the Creative Commons Attribution 4.0 License.
the Creative Commons Attribution 4.0 License.
 | 23 Jan 2020
Lability classification of soil organic matter in the northern permafrost region
Peter Kuhry
Jiří Bárta
Daan Blok
Bo Elberling
Samuel Faucherre
Gustaf Hugelius
Christian J. Jørgensen
Andreas Richter
Hana Šantrůčková
Niels Weiss
The large stocks of soil organic carbon (SOC) in soils and deposits of the northern permafrost region are sensitive to global warming and permafrost thawing. The potential release of this carbon (C) as greenhouse gases to the atmosphere does not only depend on the total quantity of soil organic matter (SOM) affected by warming and thawing, but it also depends on its lability (i.e., the rate at which it will decay). In this study we develop a simple and robust classification scheme of SOM lability for the main types of soils and deposits in the northern permafrost region. The classification is based on widely available soil geochemical parameters and landscape unit classes, which makes it useful for upscaling to the entire northern permafrost region. We have analyzed the relationship between C content and C-CO2 production rates of soil samples in two different types of laboratory incubation experiments. In one experiment, ca. 240 soil samples from four study areas were incubated using the same protocol (at 5 ∘C, aerobically) over a period of 1 year. Here we present C release rates measured on day 343 of incubation. These long-term results are compared to those obtained from short-term incubations of ca. 1000 samples (at 12 ∘C, aerobically) from an additional three study areas. In these experiments, C-CO2 production rates were measured over the first 4 d of incubation. We have focused our analyses on the relationship between C-CO2 production per gram dry weight per day (µgC-CO2 gdw−1 d−1) and C content (%C of dry weight) in the samples, but we show that relationships are consistent when using C ∕ N ratios or different production units such as µgC per gram soil C per day (µgC-CO2 gC−1 d−1) or per cm3 of soil per day (µgC-CO2 cm−3 d−1). C content of the samples is positively correlated to C-CO2 production rates but explains less than 50 % of the observed variability when the full datasets are considered. A partitioning of the data into landscape units greatly reduces variance and provides consistent results between incubation experiments. These results indicate that relative SOM lability decreases in the order of Late Holocene eolian deposits to alluvial deposits and mineral soils (including peaty wetlands) to Pleistocene yedoma deposits to C-enriched pockets in cryoturbated soils to peat deposits. Thus, three of the most important SOC storage classes in the northern permafrost region (yedoma, cryoturbated soils and peatlands) show low relative SOM lability. Previous research has suggested that SOM in these pools is relatively undecomposed, and the reasons for the observed low rates of decomposition in our experiments need urgent attention if we want to better constrain the magnitude of the thawing permafrost carbon feedback on global warming.
- Article
(3591 KB) -
Supplement
(7579 KB) - BibTeX
- EndNote


Permafrost has been recognized as one of the vulnerable carbon (C) pools in the Earth system (Gruber et al., 2004). A recent report of the International Panel on Climate Change (IPCC, 2018) identifies the thawing permafrost carbon-climate feedback as one of the key uncertainties when assessing global emission targets to keep global warming under 1.5 (2) ∘C. Furthermore, the urgency of additional research is highlighted by the fact that most permafrost in the northern circumpolar region has already experienced warming in recent decades (Biskaborn et al., 2019).
In the last decade there has been a surge in papers dealing with the permafrost carbon feedback on climate change (e.g., Schuur et al., 2008; Kuhry et al., 2010). This increased interest was fueled by a new and high estimate of the total soil organic carbon (SOC) storage in the northern permafrost region (Tarnocai et al., 2009), which was received with great interest by the Earth system science community (e.g., Ciais, 2009). Since this first new estimate was published, a multitude of new SOC inventories at the landscape level have been conducted across the circumpolar north (e.g., Hugelius and Kuhry, 2009; Hugelius et al., 2010; Horwath Burnham and Sletten, 2010; Palmtag et al., 2015; Gentsch et al., 2015a; Siewert et al., 2016). Recent studies have also focused on re-evaluating the spatial extent and SOC storage of the Yedoma “Ice Complex” and alas deposits (Strauss et al., 2013; Walter-Anthony et al., 2014; Hugelius et al., 2016; Shmelev et al., 2017).
These new data have prompted an update of the total SOC storage in the northern permafrost region, its vertical partitioning and its broad (continental-scale) distribution (Hugelius et al., 2014). The new estimate amounts to ca. 1400 PgC for the top 3 m of soils and deeper deposits, including permafrost and non-permafrost organic soils (Histels and Histosols, 302 PgC), cryoturbated permafrost mineral soils (Turbels, 476 PgC), non-cryoturbated permafrost mineral soils (Orthels) and non-permafrost mineral soils (256 PgC), and deeper yedoma (301 PgC, > 300 cm) and delta (91 PgC, > 300 cm) deposits. The spatial distribution of SOC stocks according to the major permafrost soil (Gelisol) suborders, non-permafrost mineral soils and Histosols (Soil Survey Staff, 2014) is graphically represented in the updated version of the Northern Circumpolar Soil Carbon Database (NCSCDv2, 2014).
The importance of an accurate estimate of total SOC storage in the northern permafrost region is illustrated by a recent review of the permafrost carbon feedback (Schuur et al., 2015), which included a comparison of future C release in a total of eight Earth system models. The magnitude of the projected cumulative C loss from the permafrost region by 2100, largely based on the RCP8.5 (Representative Concentration Pathway) scenario (IPCC, 2013), varied greatly between models from 37 to 174 PgC. However, by normalizing for the initial C pool size in the different models, the proportional C loss from the permafrost zone was constrained to a much narrower range of 15±3 % of the initial pool. This indicates that the quantity of SOC is a primary control when assessing C losses from the northern permafrost region.
The magnitude of the permafrost carbon feedback, however, will not only depend on the rate of future global warming (and its polar amplification), its effect on gradual and abrupt permafrost thawing (Grosse et al., 2011), or the total size (and vertical distribution) of the permafrost SOC pool. As shown by Burke et al. (2012), based on simulations with the Hadley Centre climate model, quality (decomposability) parameters need also to be considered. Thus, in terms of C pool parameters, the potential C release from the northern permafrost region will depend not only on SOC quantity but also on soil organic matter (SOM) lability (i.e., the rate at which soil organic matter will decay following warming and thawing). Laboratory incubation experiments that consider both different types of substrates (e.g., Schädel et al., 2014) and time of incubation (e.g., Elberling et al., 2013) are an important tool to assess potential C release from permafrost soils and deposits.
The aim of this study is to add a measure of SOM lability to the current estimates of SOC quantity, in order to define vulnerable C pools across the northern circumpolar region. We focus on the relationship between solid-phase geochemical parameters (particularly C content) and C release rates in laboratory incubations of active-layer and thawed permafrost samples from the main types of soils and deposits found in the northern permafrost region. Our objective is to develop a SOM lability classification scheme based on widely reported soil geochemical parameters in field SOC inventories and general landscape classes that can be linked to existing spatial SOC databases such as the NCSCD (Tarnocai et al., 2009; Harden et al., 2012; Hugelius et al., 2014). We test the robustness of our SOM lability classification by comparing two very different types of incubation experiments, both in the setup as well as timing of C release measurements.
2.1 Study areas
The samples used in the incubation experiments were collected as part of landscape-level inventories carried out in the context of the European Union Changing Permafrost in the Arctic and its Global Effects in the 21st Century (EU PAGE21) and European Science Foundation Long-term Carbon Storage in Cryoturbated Arctic Soils (ESF CryoCarb) projects to assess total storage, landscape partitioning and vertical distribution of SOC stocks in study areas across the northern permafrost region. SOC storage data from these areas are presented in Weiss et al. (2017) for Svalbard, Siewert et al. (2016) for Lena Delta, Palmtag et al. (2016) for Taymyr Peninsula, Palmtag et al. (2015) for Lower Kolyma, Hugelius et al. (2011) for Seida and Siewert (2018) for Stordalen Mire. The location of all study areas is shown in Fig. 1. The Lower Kolyma experiment includes samples from two nearby located study areas (Shalaurovo and Cherskiy); the Taymyr Peninsula experiment also includes samples from two nearby located study areas (Ary-Mas and Logata). Metadata for each of these areas, including the geographic coordinates, permafrost and vegetation zones, climate parameters, number of soil profiles and incubated samples, type of incubation experiment, and time of field collection, are presented in Table S1 (Supplement).
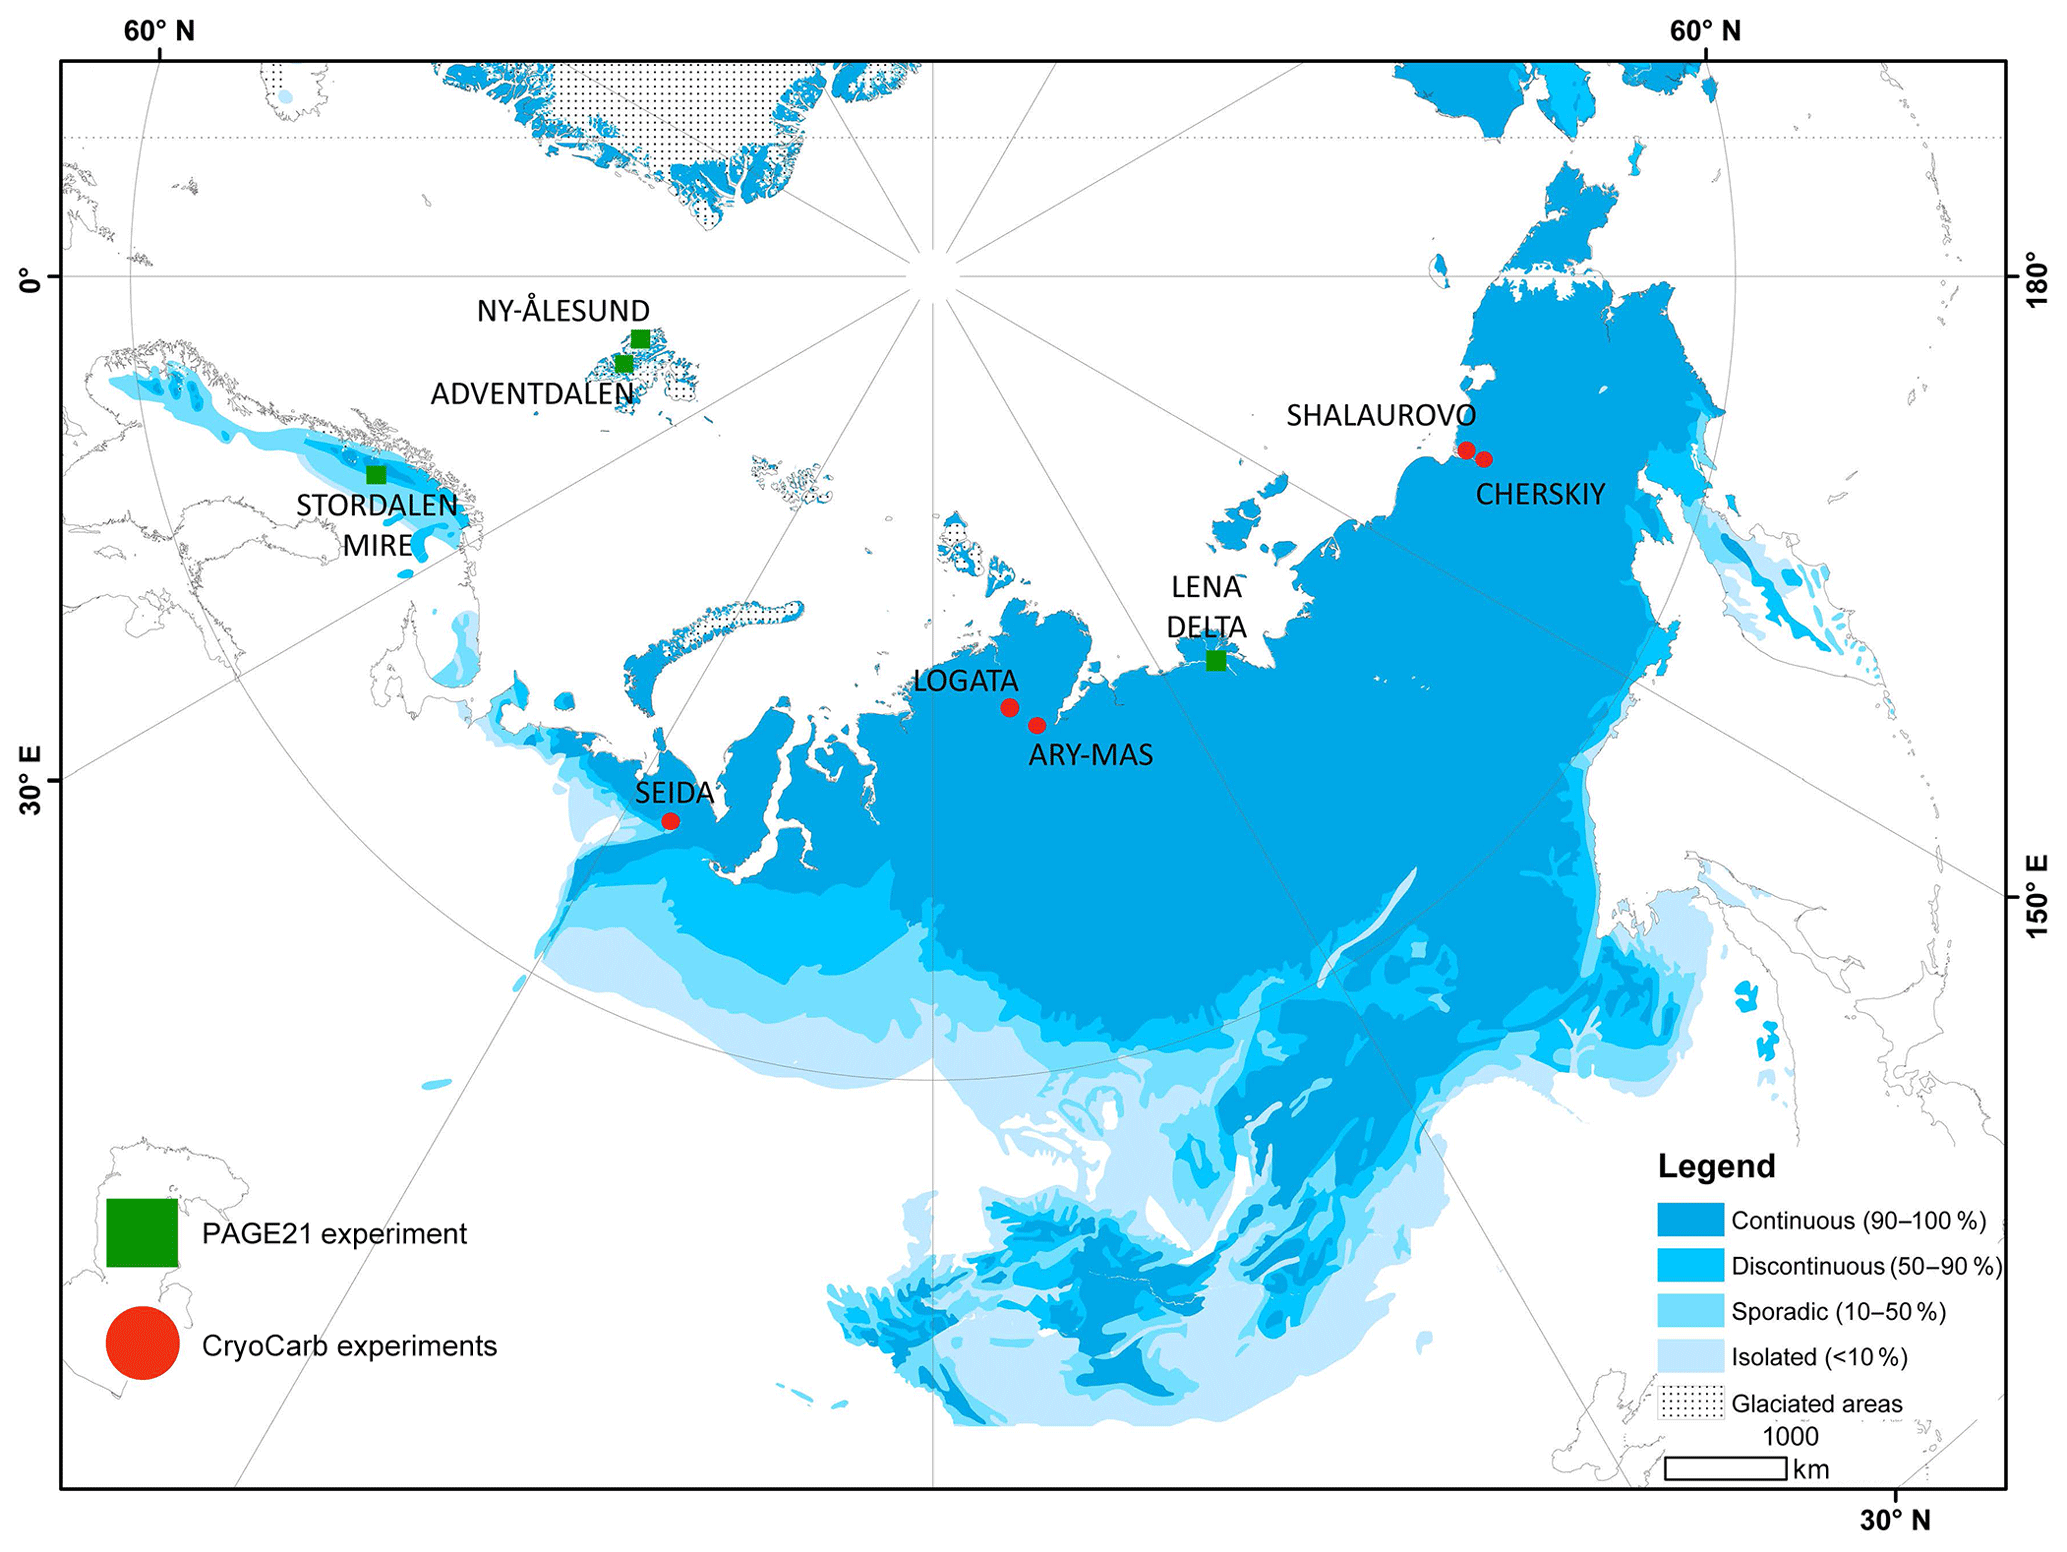
Figure 1Location of study areas in northern Eurasia. PAGE21 experiment (Ny-Ålesund, Adventdalen, Stordalen Mire, Lena Delta); CryoCarb 1-Kolyma experiment (Shalaurovo, Cherskiy); CryoCarb 2-Taymyr experiment (Ary-Mas, Logata); CryoCarb 3-Seida experiment. Permafrost zones according to Brown et al. (1997, 2002).
2.2 Field methods
The sampling strategy applied for SOC field inventories was aimed at capturing all major landscape units in each of the study areas, while at the same time it ensured an unbiased selection of soil profile location. This semi-random sampling approach consisted of deciding on the positioning of generally 1 or 2 km long transects that crossed all major landscape units, with a strictly equidistant sampling interval at normally 100 or 200 m that eliminated any subjective criteria for the exact location of each soil profile. For SOC storage calculations, the mean storage in each landscape unit class was weighed by its proportional representation in the study area based on remote sensing land cover classifications.
At each soil profile site, the topsoil organic layer was collected by cutting out blocks of a known volume in three random replicates to account for spatial variability. These samples do not always strictly adhere to the definition of an `O' (organic) soil genetic horizon, because in areas with thin topsoil organics (like in floodplains and mountain terrain) there can be a large admixture of minerogenic material resulting in C contents of less than 12 %. Active-layer samples were collected from excavated pits by horizontally inserting fixed-volume cylinders. The permafrost layer was sampled by hammering a steel pipe of a known diameter incrementally into the ground, retrieving intact samples for each depth interval. Depths intervals are normally 5 to 10 cm or less (e.g., when the topsoil organic layer was very thin). The standard sampling depth was down to 1 m below the soil surface; at some sites it was not possible to reach this depth due to large stones in the soil matrix or thin soil overlying bedrock (often in mountainous settings).
2.3 Incubation experiments
2.3.1 The PAGE21 incubation experiment
The PAGE21 incubation experiment was carried out at the University of Copenhagen (Denmark). This experiment included one sample from the topsoil organics, one sample from the middle of the active layer and one sample from the upper permafrost layer (normally 10–15 cm below the upper permafrost table) from all mineral soil profiles collected in three of the PAGE21 study areas (Ny-Ålesund, Adventdalen and Lena Delta). Samples were selected based on depth criteria and not any specific soil characteristic (e.g., presence of C-enriched cryoturbated material or absence of excess ground ice). In some cases, upper permafrost samples could not be collected due to very deep active layers and/or thin soils (particularly in mountain settings). Peat samples are available from a fourth PAGE21 study area (Stordalen Mire). In total ca. 240 soil samples from four study areas across the northern permafrost region (Ny-Ålesund and Adventdalen, Svalbard; Stordalen Mire, northern Sweden; Lena Delta, northern Siberia) were incubated in one and the same experiment (Faucherre et al., 2018).
The dry bulk density (DBD) of samples used for incubation was measured at Stockholm University (Sweden). The %C and %N of dry weight of the incubated samples were measured in an elemental analyzer (EA Flash 2000, Thermo Scientific, Bremen, Germany) at the University of Copenhagen (Denmark).
Samples were kept in frozen condition from collection until the start of the laboratory incubation experiment. Samples were incubated at 5 ∘C and field water content levels (aerobic conditions) over a 1-year time period. Mean volumetric water content varied between 30 % (topsoil organics), 45 %–50 % (active-layer and permafrost layer mineral soil) and 69 % (peat). In the original PAGE21 experiment (Faucherre et al., 2018), C-CO2 production rates were measured at five different occasions between 7 to 343 d after the start of the experiment, using a nondispersive infrared LI-840A CO2∕H2O Gas Analyzer (LI-COR® Biosciences). Since all samples from all study areas were processed and incubated using the same protocol, results are directly comparable. In this study, we use the C release rates on day 343 of incubation. These results, therefore, mostly address the “slow” (Schädel et al., 2014) and “stable” (Knoblauch et al., 2013) SOM pools, with C cycling typically within a time span of a (few) decade(s).
2.3.2 The CryoCarb incubation experiments
The CryoCarb incubations were carried out at the University of South Bohemia (České Budějovice, Czech Republic). These experiments included all samples from all profiles collected in each of three study areas (CryoCarb 1-Kolyma in northeastern Siberia, CryoCarb 2-Taymyr in northern Siberia and CryoCarb 3-Seida in northeastern European Russia). In total ca. 1000 samples were incubated.
The dry bulk density of samples used for incubation was measured at Stockholm University (Sweden). The %C and %N of dry weight were measured in an EA 1110 Elemental Analyzer (CE Instruments, Milan, Italy) at Stockholm University (Seida samples) and the University of Vienna (Kolyma and Taymyr samples).
The CryoCarb 1-Kolyma and CryoCarb-2 Taymyr samples were stored in a ground pit dug into the active layer for up to 2 weeks, before further processing. Active-layer samples would be little impacted by this storage under “natural” conditions, but (some of) the gradually thawing permafrost layer samples might have experienced initial decay. CryoCarb 3-Seida samples collected in 2009 were kept in frozen storage for ca. 10 years (see Table S1), before further processing.
In the laboratory, soil samples were dried at 40–50 ∘C within 2 weeks after field sampling (or retrieval from cold storage) and kept in a cold room (at 4 ∘C) until analyzed. For each sample, 0.2 g of dry soil was inoculated with 0.003–0.008 g of soil inoculum in 1.6 mL of water (soil : H2O, 1:100, weight : volume) in 10 mL Vacutainers, after which the Vacutainers were hermetically closed and the soil slurry was incubated in an orbital shaker at 12 ∘C for 96 h. At the end of incubation, CO2 concentration in the headspace was analyzed using an HP 5890 gas chromatograph (Hewlett-Packard, USA), equipped with a thermal conductivity (TC) detector.
The study area and layer-specific composite soil inoculi were prepared from fresh soil taken separately from the topsoil organic-layer, mineral active-layer, peat active-layer, mineral permafrost layer and peat permafrost layer from multiple soil profiles collected in each study area. Fresh soil was kept in a cold room (at 4 ∘C) and then conditioned at 15 ∘C for 1 week before inoculum preparation. We consider that the small dry weight of our soil inoculi (which, in turn, have ≤2 % microbial biomass) has no significant impact on our C release measurements. The viability of inoculi was checked by incubation in water and measuring its respiration.
The short term C-CO2 production rates measured in the CryoCarb experiments most likely address the “fast” (Schädel et al., 2014) and “labile” (Knoblauch et al., 2013) SOM pools, which represent a small fraction of the total pool and decompose within a (few) year(s). The CryoCarb approach is based on the so-called “Birch effect” (Birch, 1958), showing that after a dry–wet cycle CO2 mineralization increases. The extra C originates from the mineralization of available C released from organomineral complexes and dead biomass. In our sample pretreatment with rapid drying at ≤50 ∘C we expect that a larger part of biomass died and decomposed already during this process, which should therefore not severely affect our later measurements. Fierer and Schimel (2003) showed that a substantial part of the released C can also come from microbial biomass which died due to the osmotic shock after the rewetting of soil. However, in this case, samples were dried at room temperature resulting in less of a shock in the drying process to the microbial community. Our measurements could have been affected by the limitation of C mineralization due to the small size of surviving biomass, which we overcame by inoculation with living cells. The principle of the Birch effect is still used in ecological studies ranging from large-scale carbon cycling in ecosystems to detailed studies of SOC availability (e.g., Jarvis et al., 2007). It is well documented that the amount of extra C released after the rewetting of dry soil is site- and soil-type-specific and represents an easily available fraction of soil C (e.g., Franzluebbers et al., 2000; Šantrůčková et al., 2006). Due to different sample pretreatment, including the duration until the incubation experiment, as well as the different “local” soil inoculi used, we consider the CryoCarb incubations of the three different study areas as separate experiments.
2.4 Geochemical parameters and C-CO2 production rates
As potential explanatory geochemical parameters we have considered dry bulk density, carbon content (%C of dry weight) and carbon-to-nitrogen weight ratios (C ∕ N). In this study, we focus on the relationship between %C in samples and the corresponding C-CO2 production in aerobic incubation experiments. An important practical reason is that %C is most widely available, since it can be derived with a high degree of confidence from elemental analysis but also from indirect methods such as loss on ignition at 550 ∘C. However, there are also theoretical considerations for the choice of %C. DBD is expected to be related to quantity and degree of compaction (decomposition) of SOM. However, in the permafrost layer of soils it will also covary with the volume of excess ground ice. C ∕ N is a good indicator of degree of SOM decomposition in peat deposits (Kuhry and Vitt, 1996) and tundra upland soils (Ping et al., 2008). Recent soil carbon inventories in permafrost terrain have shown a clear decrease in soil C ∕ N as a function of age and depth (e.g., Hugelius et al., 2010; Palmtag et al., 2015). However, C ∕ N is also sensitive to the original botanical composition of the peat and soil litter. In contrast, the %C of plant material is much more narrowly constrained to around 50 % of dry plant matter. For instance, based on data in Vardy et al. (2000), we can calculate a C ∕ N range of 48.5±27.9 (mean and standard deviation) in modern phytomass samples from permafrost peatlands in the Canadian Arctic (n=27) that included vascular plants, mosses and lichens. The corresponding %C range was much narrower at 47.3±5.1. An additional benefit of using %C is that it has a clear “zero” intercept in regressions against C-CO2 production per gram dry weight per day (i.e., at 0 %C in soil samples we can expect no C release). This is also the reason why expressing C release as a function of gram dry weight (gdw) is more straightforward than gram C (gC). The latter would have the benefit of expressing C release directly as a function of C stock, but the relationship is complex with recent studies showing high initial C release rates per gC at low %C values (Weiss et al., 2016; Faucherre et al., 2018). In this study DBD is available for all samples, and we can also express C release as a function of soil volume (cm3). In the results we primarily show µgC-CO2 production per gdw per day (µgC-CO2 gdw−1 d−1) as a function of %C in the sample. However, in the “Supplementary materials” we also refer to regressions against C ∕ N and C-CO2 production rates per gC per day (µgC-CO2 gC−1 d−1) or per cm3 of soil per day (µgC-CO2 cm−3 d−1) against %C, to test the robustness of our results.
2.5 Landscape partitioning
We have investigated C-CO2 production rates for the full datasets as well as for samples grouped into landscape unit classes that can be used for an assessment of vulnerable C pools at northern circumpolar levels. For this purpose, we have subdivided our datasets to reflect the main Gelisol suborders, non-permafrost mineral soils and Histosols recognized in the spatial layers of the NCSCD, as well as deeper Quaternary deposits for which there are separate estimates of spatial extent, depth and SOC stocks (Tarnocai et al., 2009; Strauss et al., 2013; Hugelius et al., 2014). We identify the following landscape classes: peat deposits (Histels and some Histosols), peaty wetland deposits (mostly Histic Gelisols; peat layer < 40 cm deep), mineral soils (Turbels and Orthels and some non-permafrost mineral soils) in mountain and lowland settings, fluvial and deltaic (alluvial) deposits, and eolian and Pleistocene yedoma deposits. Special attention is paid to the lability of SOM in Holocene peat deposits, in deeper C-enriched buried layers and cryoturbated pockets, and in Pleistocene yedoma deposits. All main classes are represented in the PAGE21 and CryoCarb 1-Kolyma incubation experiments. The CryoCarb 2-Taymyr dataset lacks sites with eolian parent materials, whereas the CryoCarb 3-Seida dataset does not include soils formed into either alluvial or eolian deposits. Pleistocene yedoma deposits are only represented in the CryoCarb 1-Kolyma experiment. We focus on results from the PAGE21 and CryoCarb 1-Kolyma experiments but present the main results from the two other experiments in “Supplementary materials”. For a full overview of landscape unit class representation in each of the incubation experiments and study areas, see Table S2.
In addition, we have applied a further subdivision of landscape unit classes in the PAGE21 experiment to allow a more detailed statistical analysis of the dataset and assess the role of minerogenic inputs, cryoturbation and peat accumulation in SOM lability. For this purpose, the eolian class is separated into actively accumulating deposits (Adventdalen) and Holocene soils formed into Pleistocene yedoma parent materials (Lena Delta). Alluvial deposits are subdivided into profiles from active and pre-recent floodplains (multiple study areas). Mineral soils are separated into active colluviation sheets (mountain slopes on Svalbard) and other mineral soils (multiple study areas). Finally, for wetland deposits we discriminate between peat deposits (fens and bogs in Stordalen Mire; > 40 cm peat) and peaty wetland profiles (multiple study areas; < 40 cm peat). It should be stressed that these subclasses are not specifically recognized in any circumpolar SOC database and are therefore of limited use for further upscaling. In all cases, SOM lability in samples of deeper C-enriched buried layers and cryoturbated pockets is shown for comparative purposes.
2.6 Statistics
Relationships between C-CO2 production rates and geochemical parameters for all samples, as well as for groupings of samples into landscape unit classes, for each incubation experiment separately, are statistically analyzed using linear, polynomial and other non-linear regressions in the Microsoft Excel 2010 and Past3 (Hammer et al., 2001) software packages. Regressions are considered significant if p< 0.05. These analyses visualize SOM lability for full profiles including samples from topsoil organic to mineral layers that have a wide range of DBD, %C and C ∕ N values. In some cases, replicates are not normally distributed (or even unimodal), and statistics should be interpreted with caution. This is particularly the case in peatland profiles, with clusters of samples with low DBD and high %C and C ∕ N in the peat and opposite trends in samples of the underlying mineral subsoil.
To alleviate the issue on non-normal distributions, C-CO2 production rates in samples as a function of %C are also tested grouped into soil horizons (PAGE21 and CryoCarb 1-Kolyma experiments). This approach yields classes that are much better constrained in terms of %C values. Because data were still not fully normally distributed, non-parametrical Mann–Whitney tests were used (Hammer et al., 2001). The data were log-transformed to reduce skewness in data distributions and to reduce the influence of fractional data. For the mineral soils in the PAGE21 incubation experiment, we differentiated between the topsoil organic layer, the active-layer mineral soil, the permafrost layer mineral soil and C-enriched pockets in both the active layer and permafrost layer. Samples from the topsoil organic layer, the active-layer mineral soil and the permafrost layer mineral soil from profiles formed in Late Holocene loess deposits in Adventdalen (Svalbard) are considered separately, as are the active-layer peat samples from Stordalen Mire (northern Sweden). A similar grouping has been made for mineral soils in the CryoCarb 1-Kolyma experiment. In this case, Pleistocene yedoma loess samples (both frozen and thawed) are considered separately. Peat samples are much better represented in the CryoCarb 1-Kolyma than the PAGE21 experiment and are subdivided into samples from thin peat layers in the active layer of peaty wetlands (Histic Gelisols), as well as samples from the active layer and permafrost layer of deep peat deposits (Histels). For this approach, we express C-CO2 production rates per gC to take into account the large differences in %C among the different soil horizon classes. The tests are run to evaluate null hypotheses regarding differences in SOM lability between soil horizon classes, with a focus on those that are considered typical for specific landscape classes (C-enriched pockets for Turbels, peat samples for Histels and loess samples for Pleistocene yedoma).
3.1 Simple geochemical indicators of SOM lability
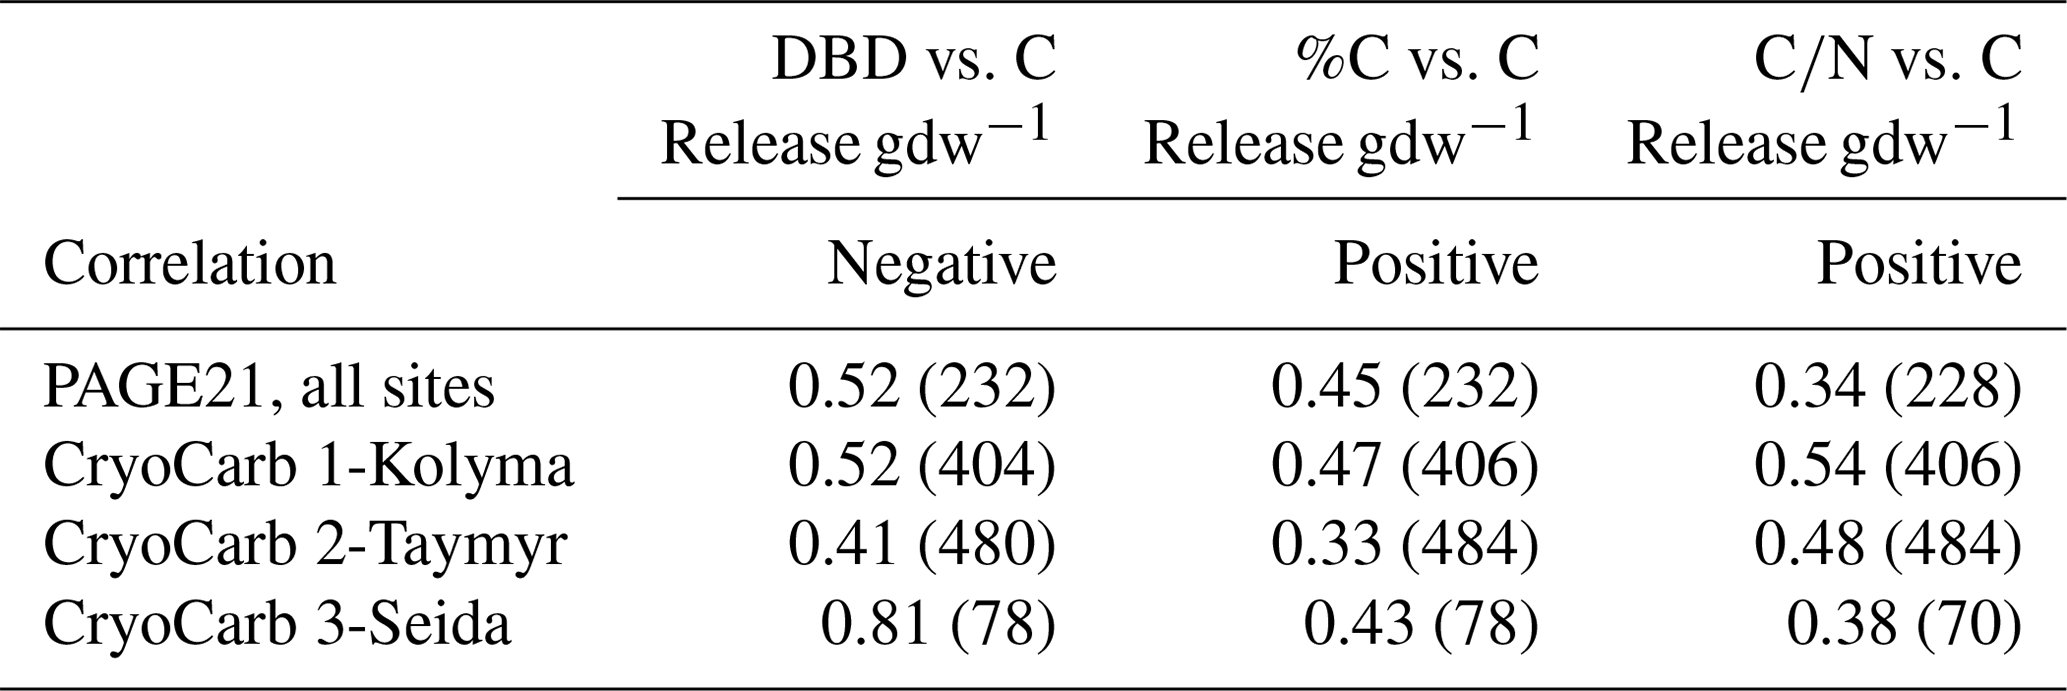
We first assessed the relationship between C release rates in incubation experiments and widely available physicochemical parameters in samples from soil carbon inventories carried out throughout the northern permafrost region. The latter include dry bulk density, C content as a percentage of dry sample weight, and carbon-to-nitrogen weight ratios. In recent studies dealing with the incubation of soil samples from the northern permafrost region, %C and C∕N of soil samples were highlighted as the best parameters to predict C release (Elberling et al., 2013; Schädel et al., 2014). DBD was highlighted as a useful proxy in the recent synthesis of PAGE21 incubation studies presented in Faucherre et al. (2018). All three parameters are significantly (anti-)correlated with each other in the four different incubation experiments (Table 1 and Fig. S1). This can be expected, since organically enriched topsoil samples have low DBD, high %C and high C ∕ N values compared to mineral layer soil samples. Also deeper soil samples, C-enriched through the process of cryoturbation (Bockheim, 2007), have generally relatively low DBD, high %C and high C ∕ N values compared to adjacent mineral soil samples (e.g., Hugelius et al., 2010; Palmtag et al., 2015).
Table 1R2 values of cross correlations and the number of samples (in brackets) between three geochemical parameters in the PAGE21 and three CryoCarb incubation experiments (all significant; p< 0.05). For regression models see Fig. S1.
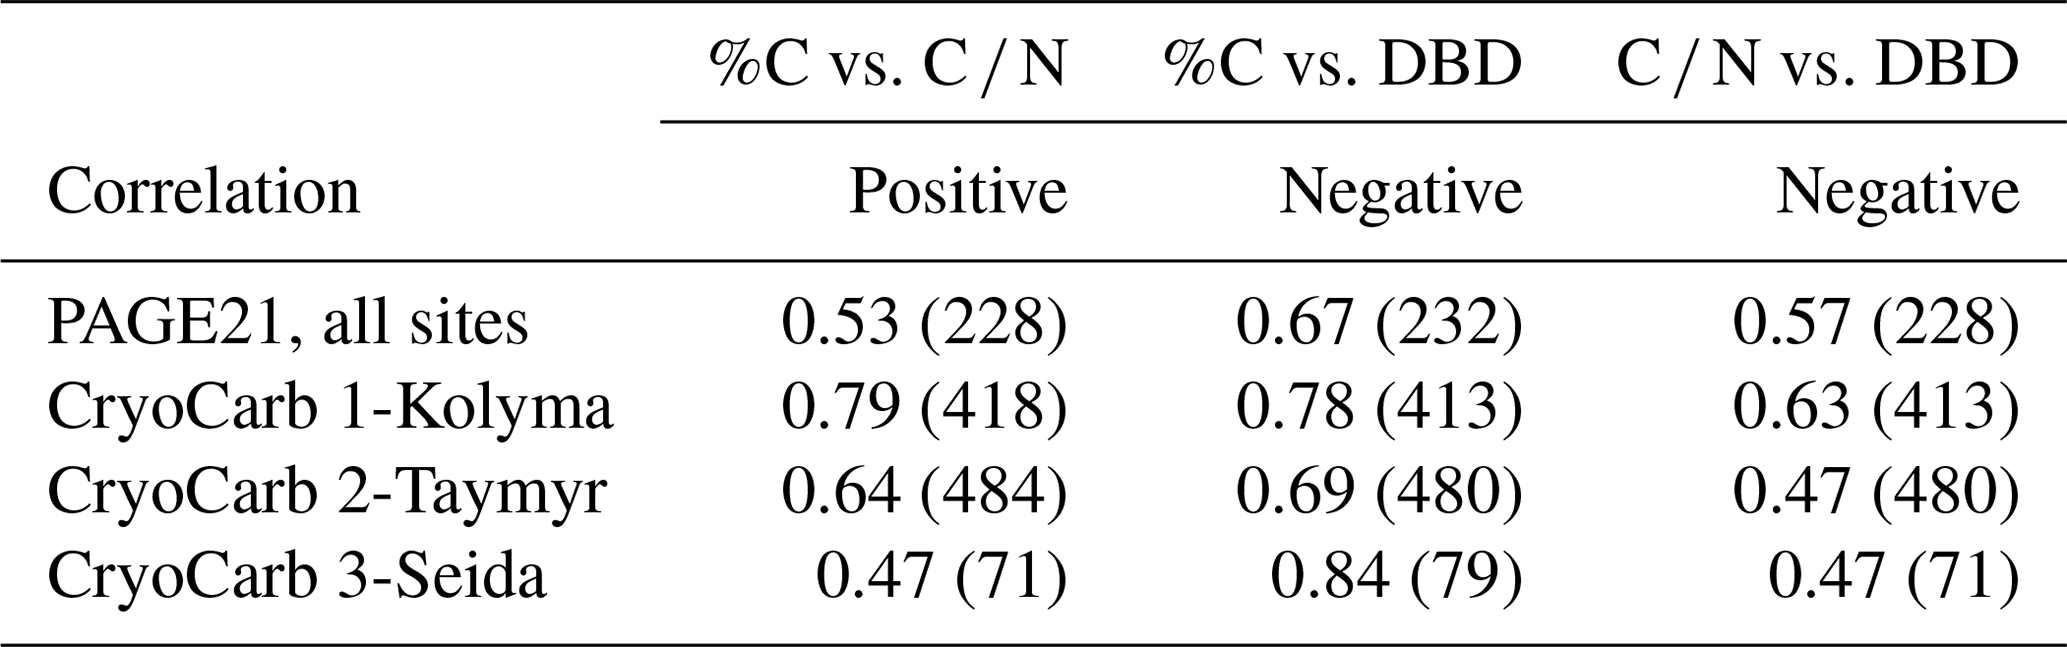
All three considered geochemical parameters are significantly (anti-)correlated with measured C release rates in the four different incubation experiments. Lower DBD, higher %C and higher C ∕ N values are associated with higher C-CO2 production per gdw of the samples (Table 2 and Fig. S2 in the Supplement). Of the three parameters, DBD explains most of the observed variability in C release in two experiments, whereas C ∕ N shows the highest R2 values in the other two experiments.
Table 2R2 values of regressions and the number of samples (in brackets) between three geochemical parameters and µgC-CO2 production per gram dry weight in the PAGE21 and three CryoCarb incubation experiments (all significant; p< 0.05). For regression models see Fig. S2.
3.2 Partitioning of the datasets based on landscape unit classes
Our results show a significant relationship between µgC-CO2 production per gdw as a function of %C of the soil sample for the full datasets in each of the four incubation experiments (Table 2 and Fig. S2). However, less than 50 % of the variability is explained by this relationship, which implies that it has limited usefulness to predict C release. The experiments show a large range in µgC-CO2 production per gdw, particularly at medium-to-high %C values. In this section we analyze whether a grouping of samples according to landscape unit classes can disentangle some of the observed variability.
Figure 2 shows the relationships between C release rates and %C in the samples for the data grouped according to major landscape unit classes in the PAGE21 (measured on day 343 of incubation) and CryoCarb 1-Kolyma (measured over the first 4 d of incubation) experiments. For the sake of simplicity, we apply linear regressions with intercept zero to all classes. These are identified by different colors and symbols that have been consistently used in Figs. 2–3 and S3–S5. The regression for the full dataset is provided as a reference (dotted lines), but it should be noted that its slope is partly determined by the number of samples in each of the recognized landscape units.
A first observation is that C release rates per gdw are ca. 15 times lower in the longer-term PAGE21 experiment compared to the short-term CryoCarb 1-Kolyma experiment. In the PAGE21 dataset (Fig. 2a), the soils developed into alluvial and eolian deposits, and in peaty wetlands they all show similar and relatively high SOM lability. Mineral soils show intermediate values, whereas the peat deposits display low SOM lability (when considering %C values). All regressions are significant, except for “peat deposits” due to very high variability in three surface peat samples (but see Fig. 3d). In the CryoCarb 1-Kolyma dataset (Fig. 2b), alluvial and eolian soils and deposits show the highest SOM lability, followed by mineral soils. In this case, peaty wetlands show a slightly lower lability than mineral soils and deposits, but they still show considerably higher lability than peatlands. This clear dichotomy in the SOM lability of mineral soils (including peaty wetlands) and peat deposits is also apparent from the CryoCarb 2-Taymyr and CryoCarb 3-Seida results even though not all landscape classes are represented in those experiments (Fig. S3). The explanatory power of the regressions (R2 values) in the peatland class is generally lower than that in the mineral soil and deposit classes. These statistics are, however, greatly improved when removing the surface peat samples from the analyses (not shown), which display very high variability.
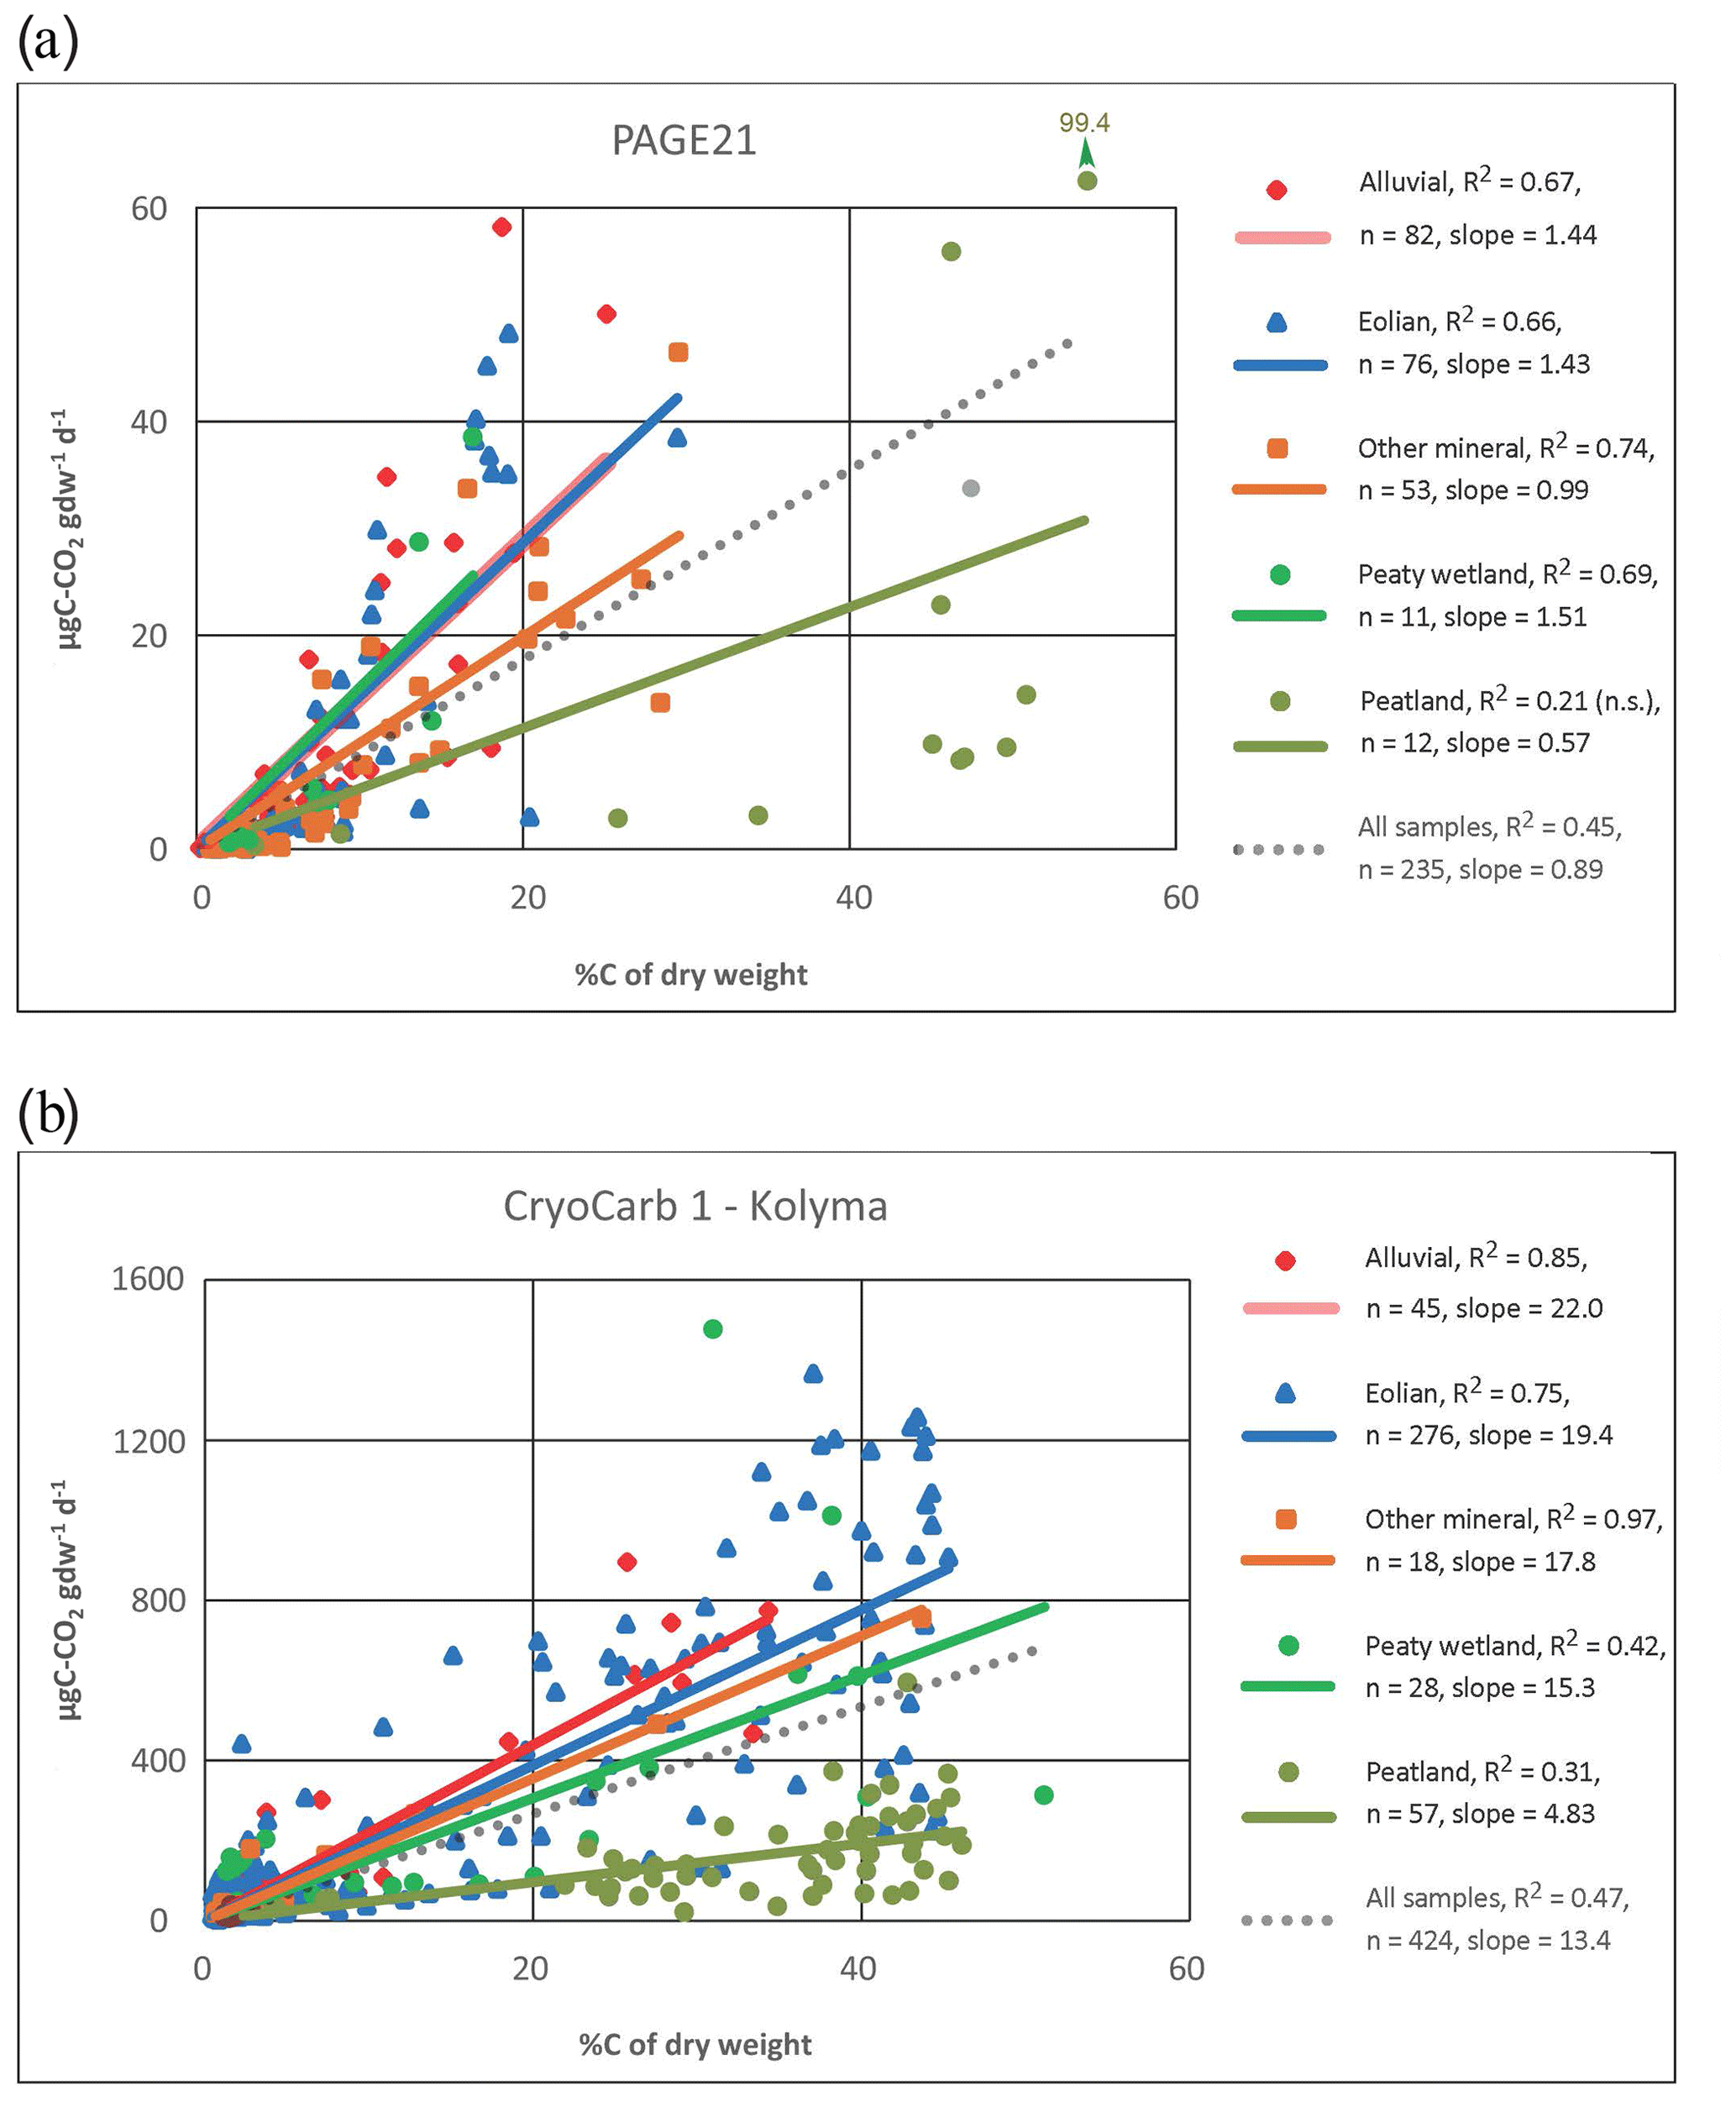
Figure 2µgC-CO2 production per gram dry weight as a function of %C of the sample for the full datasets and different landscape classes in the longer-term PAGE21 (a) and short-term CryoCarb 1-Kolyma (b) incubation experiments: All samples (dotted grey lines); alluvial class (red line and diamonds); eolian class (blue line and triangles); mineral class (brown line and squares); peaty-wetland class (dark-green line and circles); peatland class (light-green line and circles). All regressions are significant (p<0.05), except for the PAGE21 peatland class (not significant).
Linear regression analyses between C-CO2 production per gdw and C ∕ N ratios for all four experiments (Fig. S4) show small deviations from the above patterns but generally maintain the clear difference between “peat deposits” and the remaining landscape units. However, C-CO2 production was similar in peat deposits and mineral soils and deposits at low C ∕ N values (≤20). R2 values for the landscape classes are generally lower than in regressions against %C, and regression lines at low C release tend to converge to C ∕ N values of 8–12, which are typical for microbial decomposer biomass, suggesting only slow internal cycling of remaining SOM (Zechmeister-Boltenstern et al., 2015).
The PAGE21 dataset with C-CO2 production rates expressed per gC as a function of %C of the soil sample also shows similar results, however, with generally lower R2 and sometimes non-significant regressions (Fig. S5a). The same patterns are also noted when expressing C release as a function of soil volume (cm3); however, R2 values are generally even lower and more often non-significant (Fig. S5b).
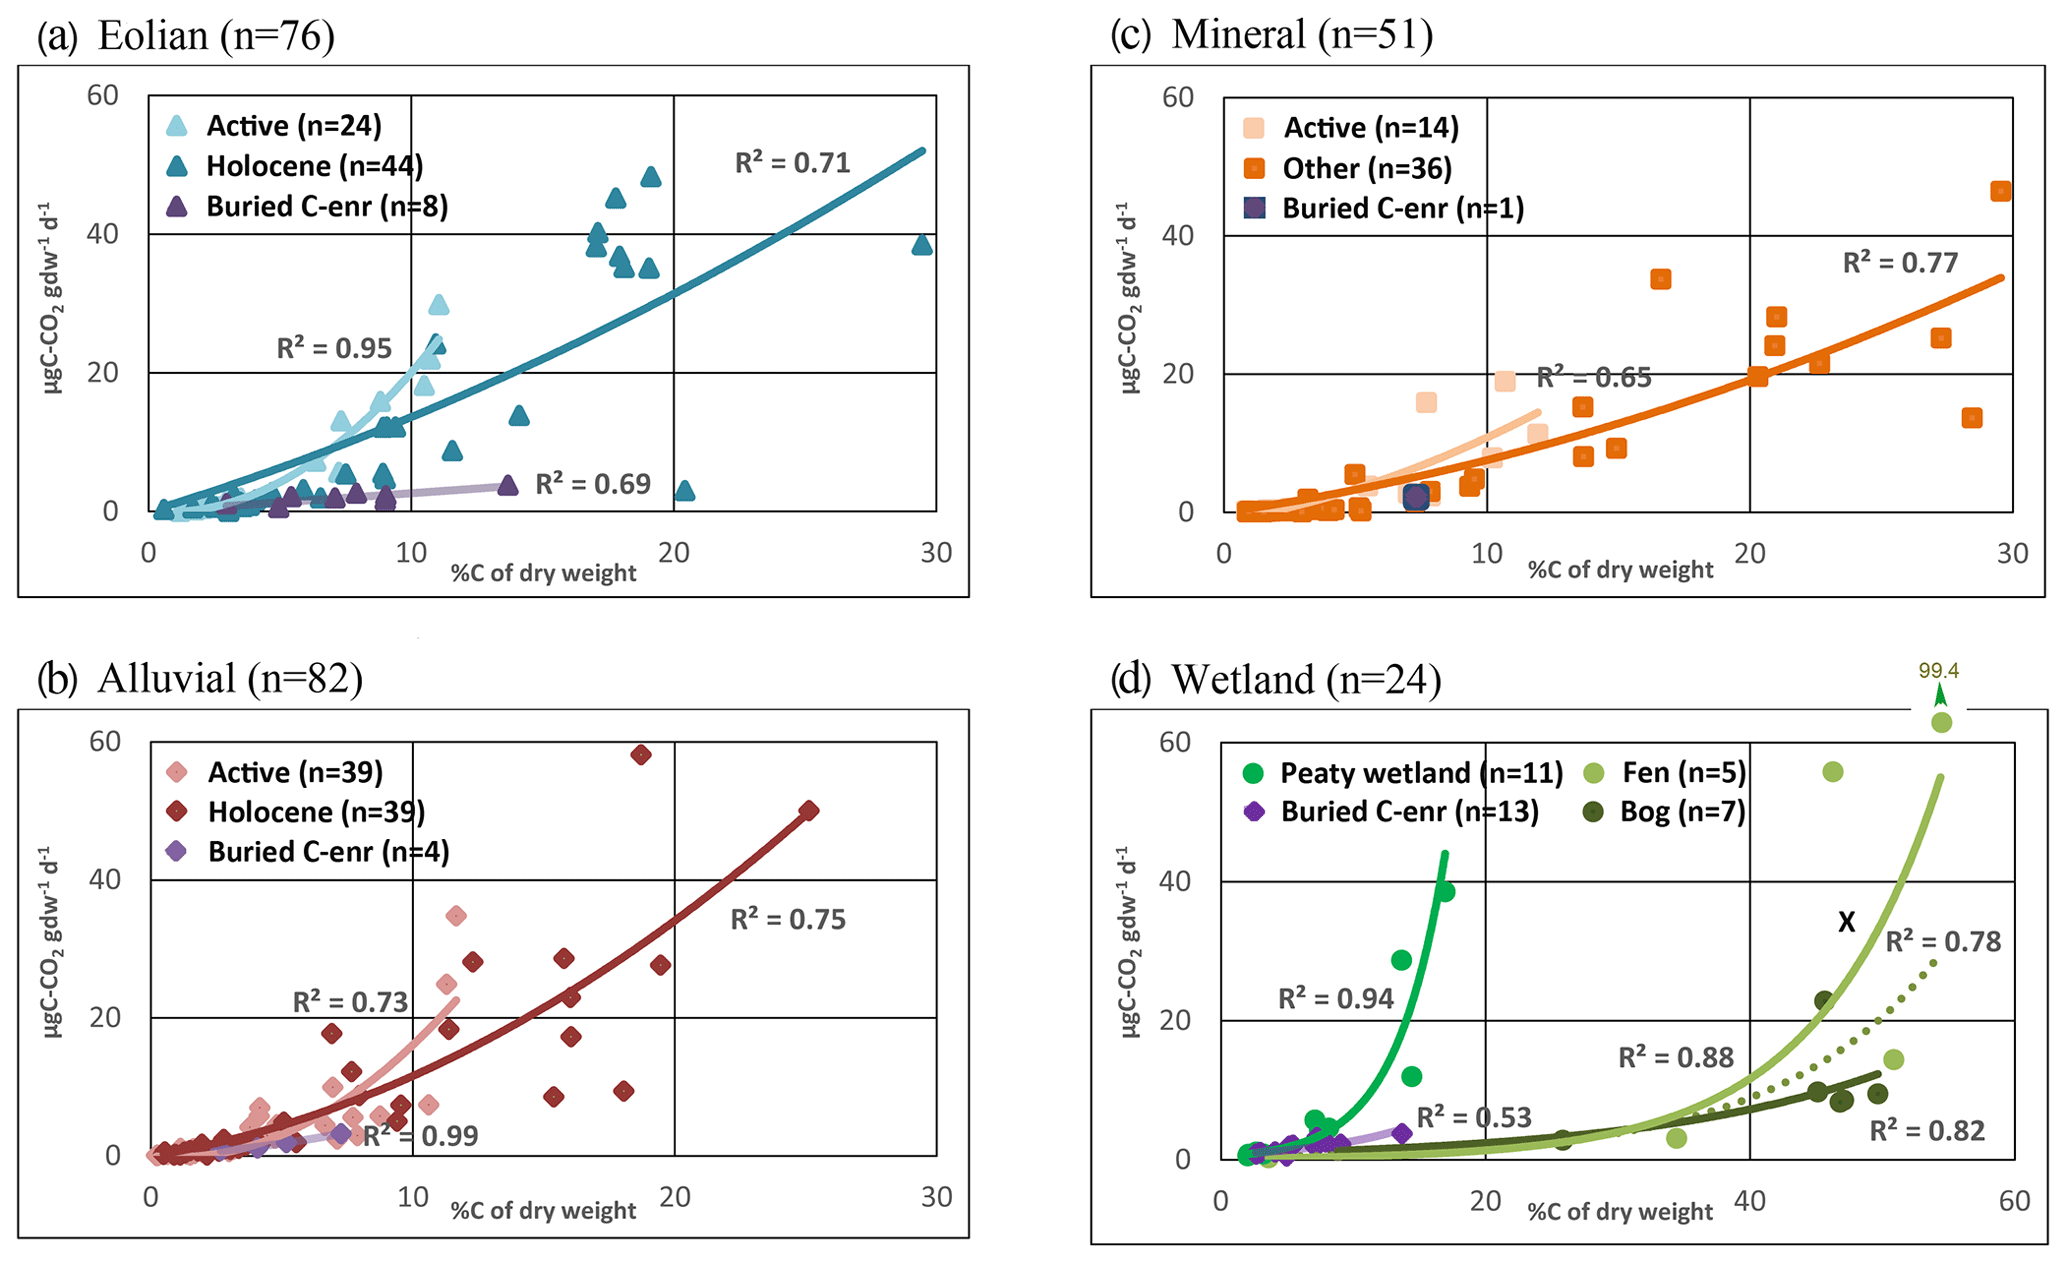
Figure 3µgC-CO2 production per gram dry weight as a function of %C of the sample for different landscape classes and their subdivisions in the PAGE21 incubation experiment. (a) Eolian class separated into actively accumulating deposit (light blue), Holocene soil formation into Pleistocene yedoma parent materials (dark blue) and buried C-enriched samples (pink). (b) Alluvial class separated into active floodplain (rose), Holocene soil formation into pre-recent floodplain deposits (red) and buried C-enriched samples (pink). (c) Mineral class separated into active colluviation sheets (light brown), other mineral soils (dark brown) and one buried C-enriched sample (pink). (d) Wetland class separated into wetlands with thin peat layers (green), fens (light green) and bogs (dark green) with deep peat deposits and, for comparison, buried C-enriched samples in mineral soils (pink). The hatched line represents the regression for all peatland samples (fens and bogs) together. C release from one surface peat sample (x) in the margin of a peatland is also indicated, but it is not included in the regressions. All regressions are significant (p<0.05).
3.3 Further subdivision of landscape unit classes in the PAGE21 dataset
Figure 3a–c present SOM lability in a further subdivision of the mineral soil and deposit landscape classes in the PAGE21 dataset. We have compared profiles with active accumulation or movement in eolian, alluvial and colluvial settings, with Holocene soils developed into older eolian, alluvial or other mineral parent materials, respectively. In each of these comparisons, we specifically identify samples from deeper C-enriched buried layers and cryoturbated pockets. Generally speaking, a second-order polynomial (intercept zero) provides the best fit and has been applied for the sake of uniformity to all described subclasses. All these datasets have in common that the subclasses with active surface accumulation or movement have topsoil samples that show relatively low C content due to the continuous admixture of minerogenic materials. At the same time, these all show the highest C-CO2 production per gdw (when considering %C). Furthermore, the second-order polynomial regressions of all subclasses (except for buried C-enriched samples) suggest that the topsoil samples are particularly labile suggesting the presence of a more degradable SOM pool in the recently deposited plant litter. Deeper C-enriched material shows relatively low lability and does not show rapidly increasing lability at higher %C values.
Figure 3d compares the SOM lability in fen and bog deposits (Stordalen Mire) and peaty wetland profiles (multiple study areas), adding for comparison the results from the previously described deeper C-enriched buried layers and cryoturbated pockets in mineral soils (see Fig. 3a–c). In this case, exponential functions best describe observed trends and indicate very high lability of surface peat(y) samples. The thin peat layers in peaty wetlands have relatively low %C values pointing to admixture of minerogenic materials. The SOM in these profiles show relatively high C-CO2 production per gdw compared to “true” peat samples (when considering %C). Compared to the non-significant linear regression for all peat samples shown in Fig. 2a, exponential regressions for the peatland class as a whole as well as for fens and bogs separately are statistically significant. Particularly in fen peat, this regression is able to capture some very high C release values of two surface peat samples (corresponding to graminoid-derived plant litter). Deeper C-enriched material in mineral soils displays only slightly higher SOM lability compared to the mineral subsoil underlying peat deposits. It is important to bear in mind that the total number of peat samples from Stordalen Mire is limited (n=13) and that results cannot be compared directly to adjacent mineral soil profiles because field sampling in that particular study area focused solely on the peatland area.
3.4 C-enriched cryoturbated and Pleistocene yedoma samples in the CryoCarb 1-Kolyma dataset
In the PAGE21 incubation each collected profile included only one sample from the mineral soil in the middle of the active layer and one sample from the upper permafrost layer. Thus, the selection of samples was based on depth-specific criteria. As a result, the number of samples from deeper C-enriched buried layers and cryoturbated pockets is limited (n=13). In the CryoCarb 1-Kolyma experiment samples from entire profiles were incubated, and the number of deeper C-enriched samples in the mineral soil horizons is much larger. Figure 4a compares the C-CO2 production per gdw from organically enriched topsoil and mineral soil samples not affected by C enrichment with that in deeper C-enriched cryoturbated samples in tundra profiles. For the sake of clarity, only those cryoturbated samples which are C enriched by at least twice the adjacent mineral soil %C background values are included (n=22). It should be emphasized that the actual absolute %C values for the C-enriched samples and mineral soil samples not affected by C enrichment can vary between study areas and profiles, among other reasons due to differences in soil texture (Palmtag and Kuhry, 2018). The results from this much more narrowly defined dataset are similar to those presented for the PAGE21 experiment; i.e., the SOM in deeper C-enriched cryoturbated samples is less labile than in organically enriched topsoil samples with similar %C values.
The PAGE21 experiment does not include any samples from Pleistocene yedoma deposits. In contrast, the CryoCarb 1-Kolyma dataset has samples from two yedoma exposures along river and thermokarst lake margins. The material was collected from perennially frozen yedoma deposit as well as from thawed-out sections of the exposures. C release from these samples are presented in Fig. 4b, which for comparison also shows samples from Holocene lowland soils, mineral subsoil samples beneath peat deposits and deeper C-enriched cryoturbated samples. The C-CO2 production per gdw of Pleistocene yedoma is lower than that of Holocene lowland soils, but it is somewhat higher than that of mineral subsoil beneath peat and deeper C-enriched material (when considering %C). Furthermore, the SOM lability of thawed-out deposits is somewhat lower than that of the intact permafrost yedoma material.
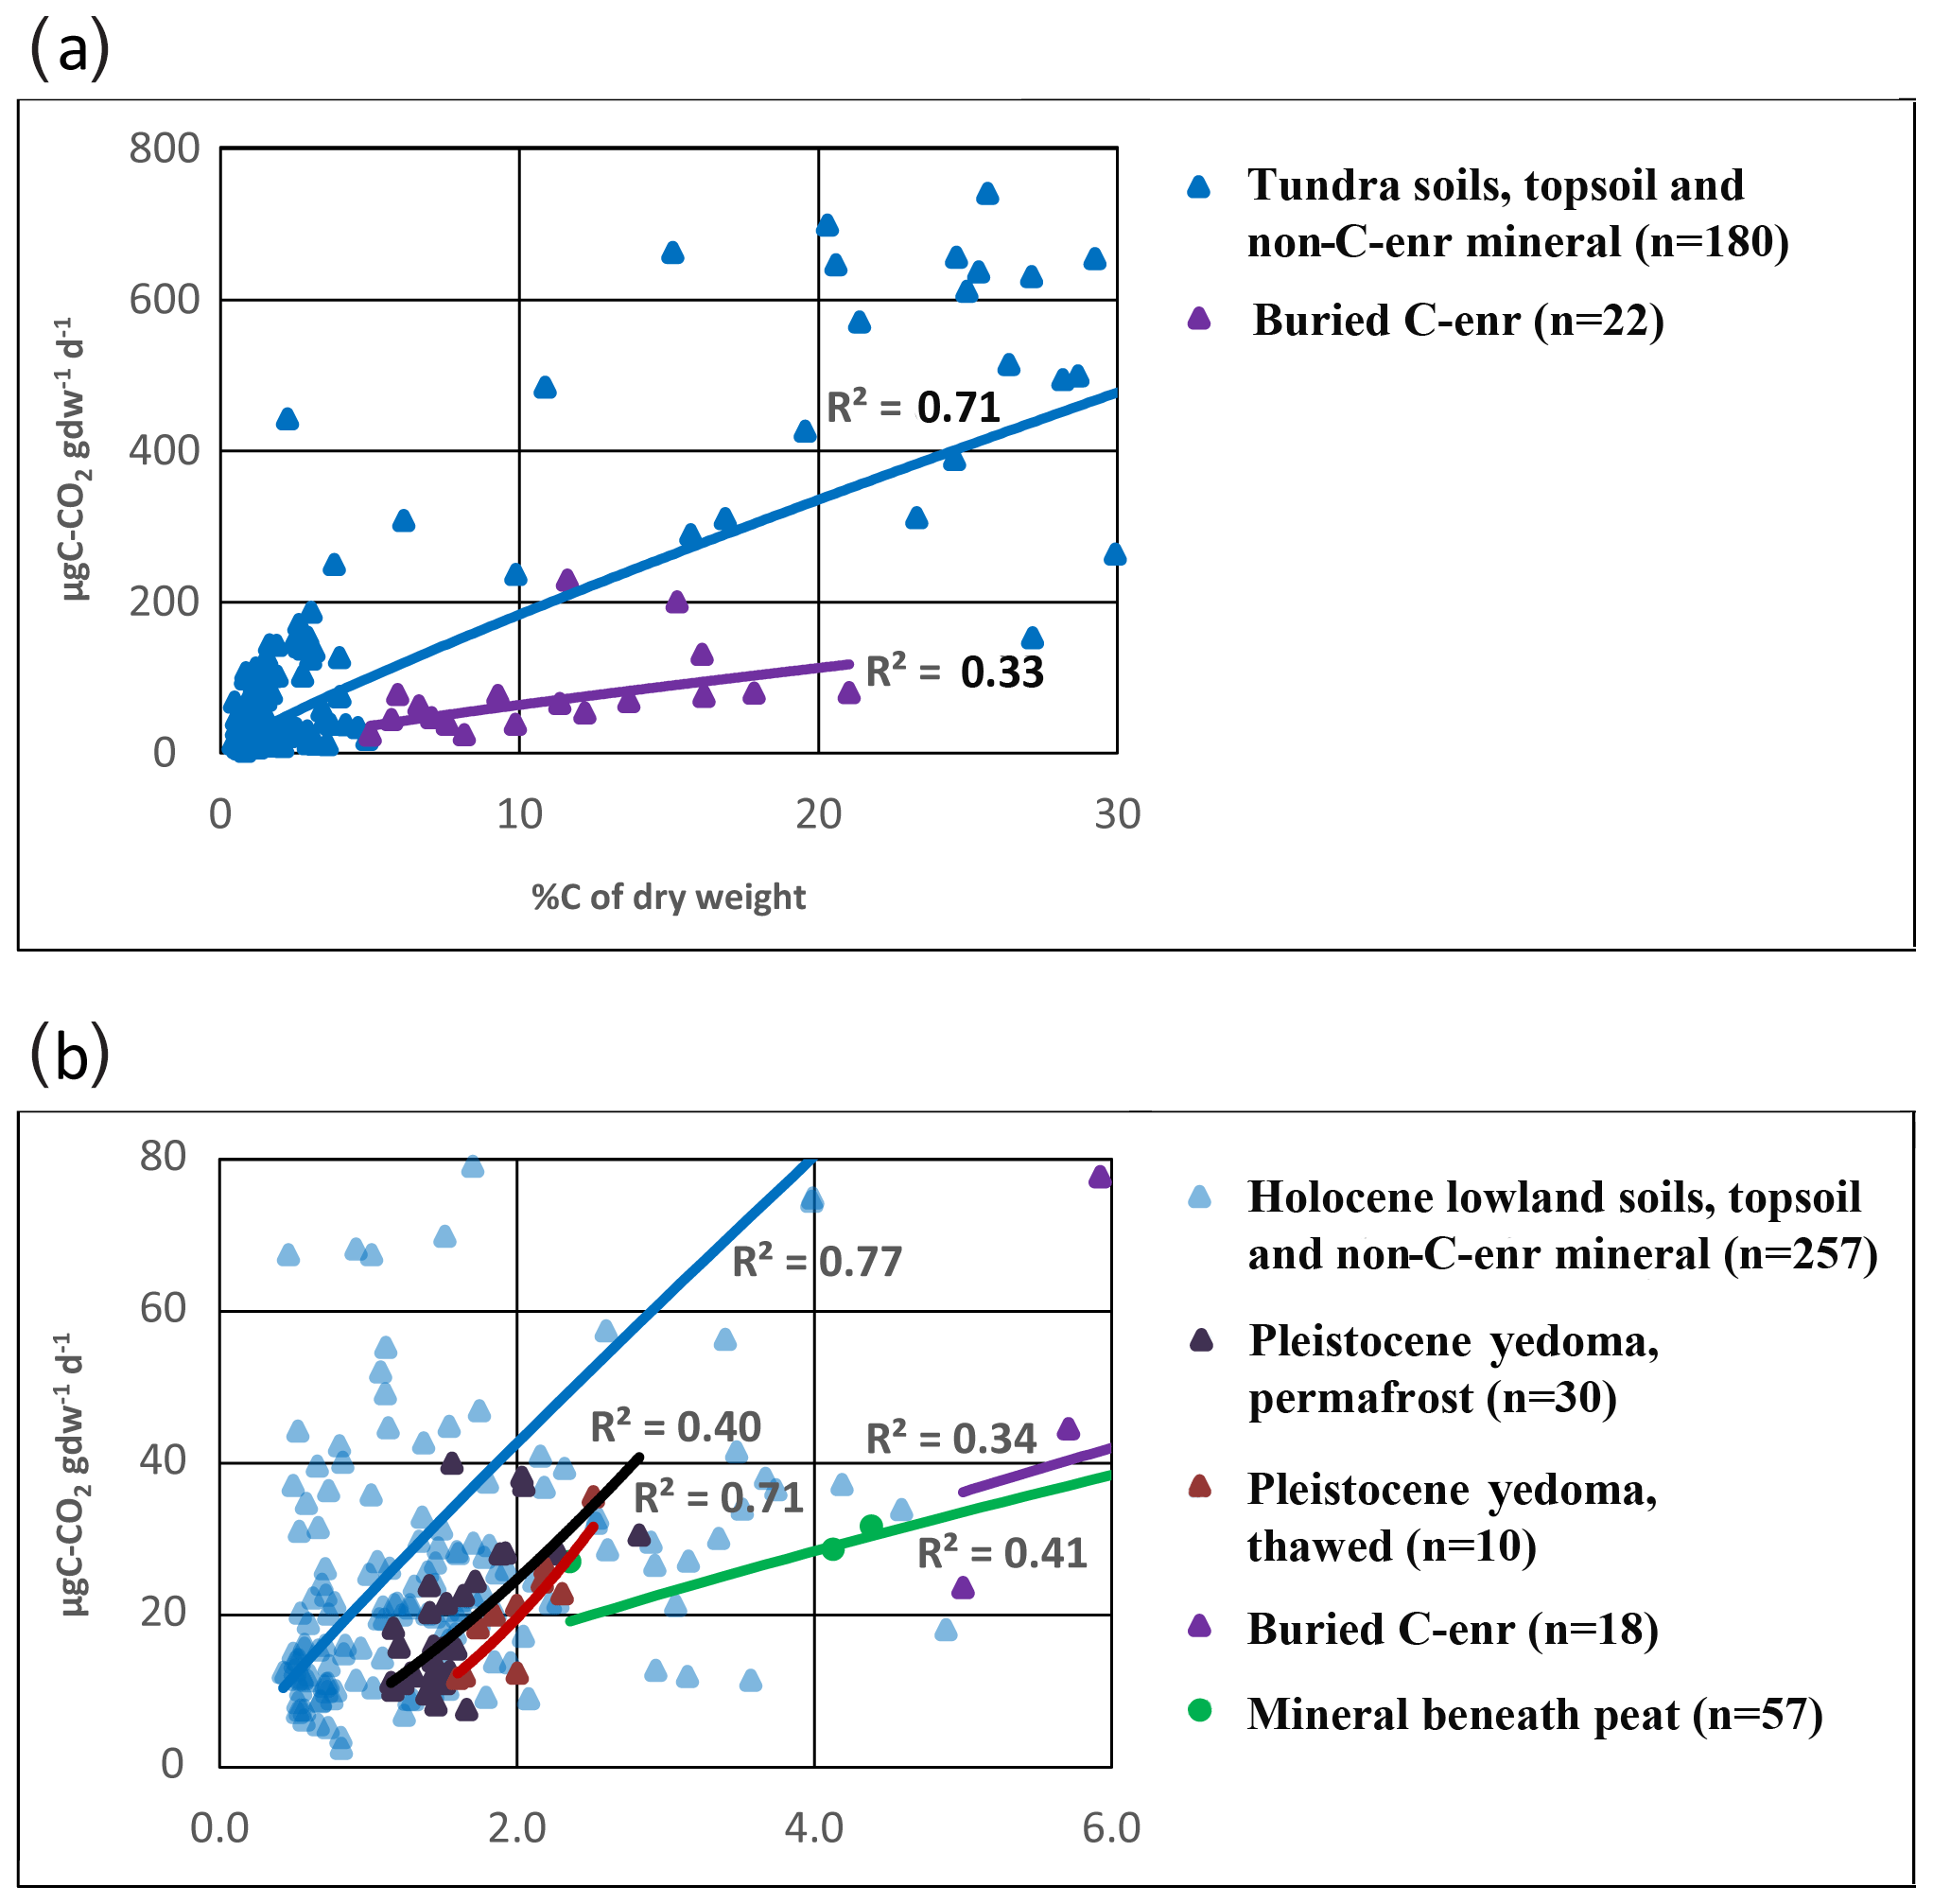
Figure 4µgC-CO2 production per gram dry weight as a function of %C of the sample in the CryoCarb 1-Kolyma incubation experiment for (a) deeper C-enriched samples (pink line and triangles), compared to samples of organically enriched topsoil and mineral soil not affected by C enrichment in all tundra profiles (blue line and triangles, showing lower part of regression line), and for (b) perennially frozen Pleistocene yedoma samples (black line and triangles) and thawed-out Pleistocene yedoma samples (red line and triangles), compared to samples of organically enriched topsoil and mineral soil not affected by C enrichment in Holocene lowland profiles (blue line and triangles, showing start of regression line), mineral subsoil samples beneath peat deposits (green line and circles, showing the start of the regression line) and buried C-enriched samples (pink line and triangles, showing the start of the regression line). All regressions (power fit) are significant (p<0.05).
3.5 Relative lability ranking of SOM landscape unit classes
Table 3a shows the slopes of the linear regressions (intercept zero) between C-CO2 production per gdw and %C of samples for the different landscape unit classes in all four incubation experiments. From these results it is clear that results from the four experiments cannot be compared directly in quantitative terms. To facilitate comparison across experiments, results were normalized to the lowland mineral soil class, which consistently showed intermediate SOM labilities. Table 3b shows the normalized regression slopes (with the slope for mineral soils set to 1) and their mean and standard deviation (when the landscape class is represented in more than one incubation experiment). This approach confirms the previous results that peat deposits and deeper C-enriched samples in mineral soils consistently show very low relative lability, whereas areas with recent mineral sediment accumulation (e.g., in recent eolian deposits) display generally somewhat higher SOM lability (when considering %C). Pleistocene yedoma deposits, only represented in one incubation experiment, also display relative low SOM lability.
Table 3(a) Slopes of linear regressions (intercept zero) between %C and C-CO2 production per gdw per day in samples of the different landscape classes in the four experiments; (b) normalized slopes of linear regressions between %C and C-CO2 production per gdw for samples in the different landscape classes in the four experiments (slope of mineral soils in lowland settings set to 1). Pt: peat deposits (Histels and Histosols), excluding two surface graminoid litter samples (PAGE21, Stordalen Mire); Min/CE: C-enriched pockets in cryoturbated soils (Turbels); Min Mtn: mineral soils in mountain settings; Min Pty: peaty wetlands (mineral soils with histic horizon); Min Lowl: mineral soils in lowland settings; Alluv: recent alluvial deposits and Holocene soils formed in alluvial deposits; Eol: recent eolian deposits; Pl Yed: Pleistocene yedoma deposits.

3.6 SOM lability based on soil horizon criteria
We also tested SOM lability in samples grouped according to soil horizon criteria (PAGE21 and CryoCarb 1-Kolyma experiments), with special attention to those horizon classes that can be linked to the specific landscape classes showing low relative SOM lability (C-enriched pockets for Turbels, peat samples for Histels and loess samples for Pleistocene yedoma). This approach yielded classes with data distributions that are much better constrained in terms of %C values.
In this analysis we focus on C-CO2 production per gC to take into account large differences in %C between soil horizon classes (see Fig. S6). The main difference between the two experiments is the much lower %C values of the topsoil organic class in the PAGE21 incubation, which can be explained by a greater surface admixture of minerogenic material in alluvial (Lena Delta), eolian and mountainous areas (Svalbard). In contrast, the predominant lowland setting of the CryoCarb 1-Kolyma study area is characterized by soils with thicker, more C-rich topsoil organic layers.
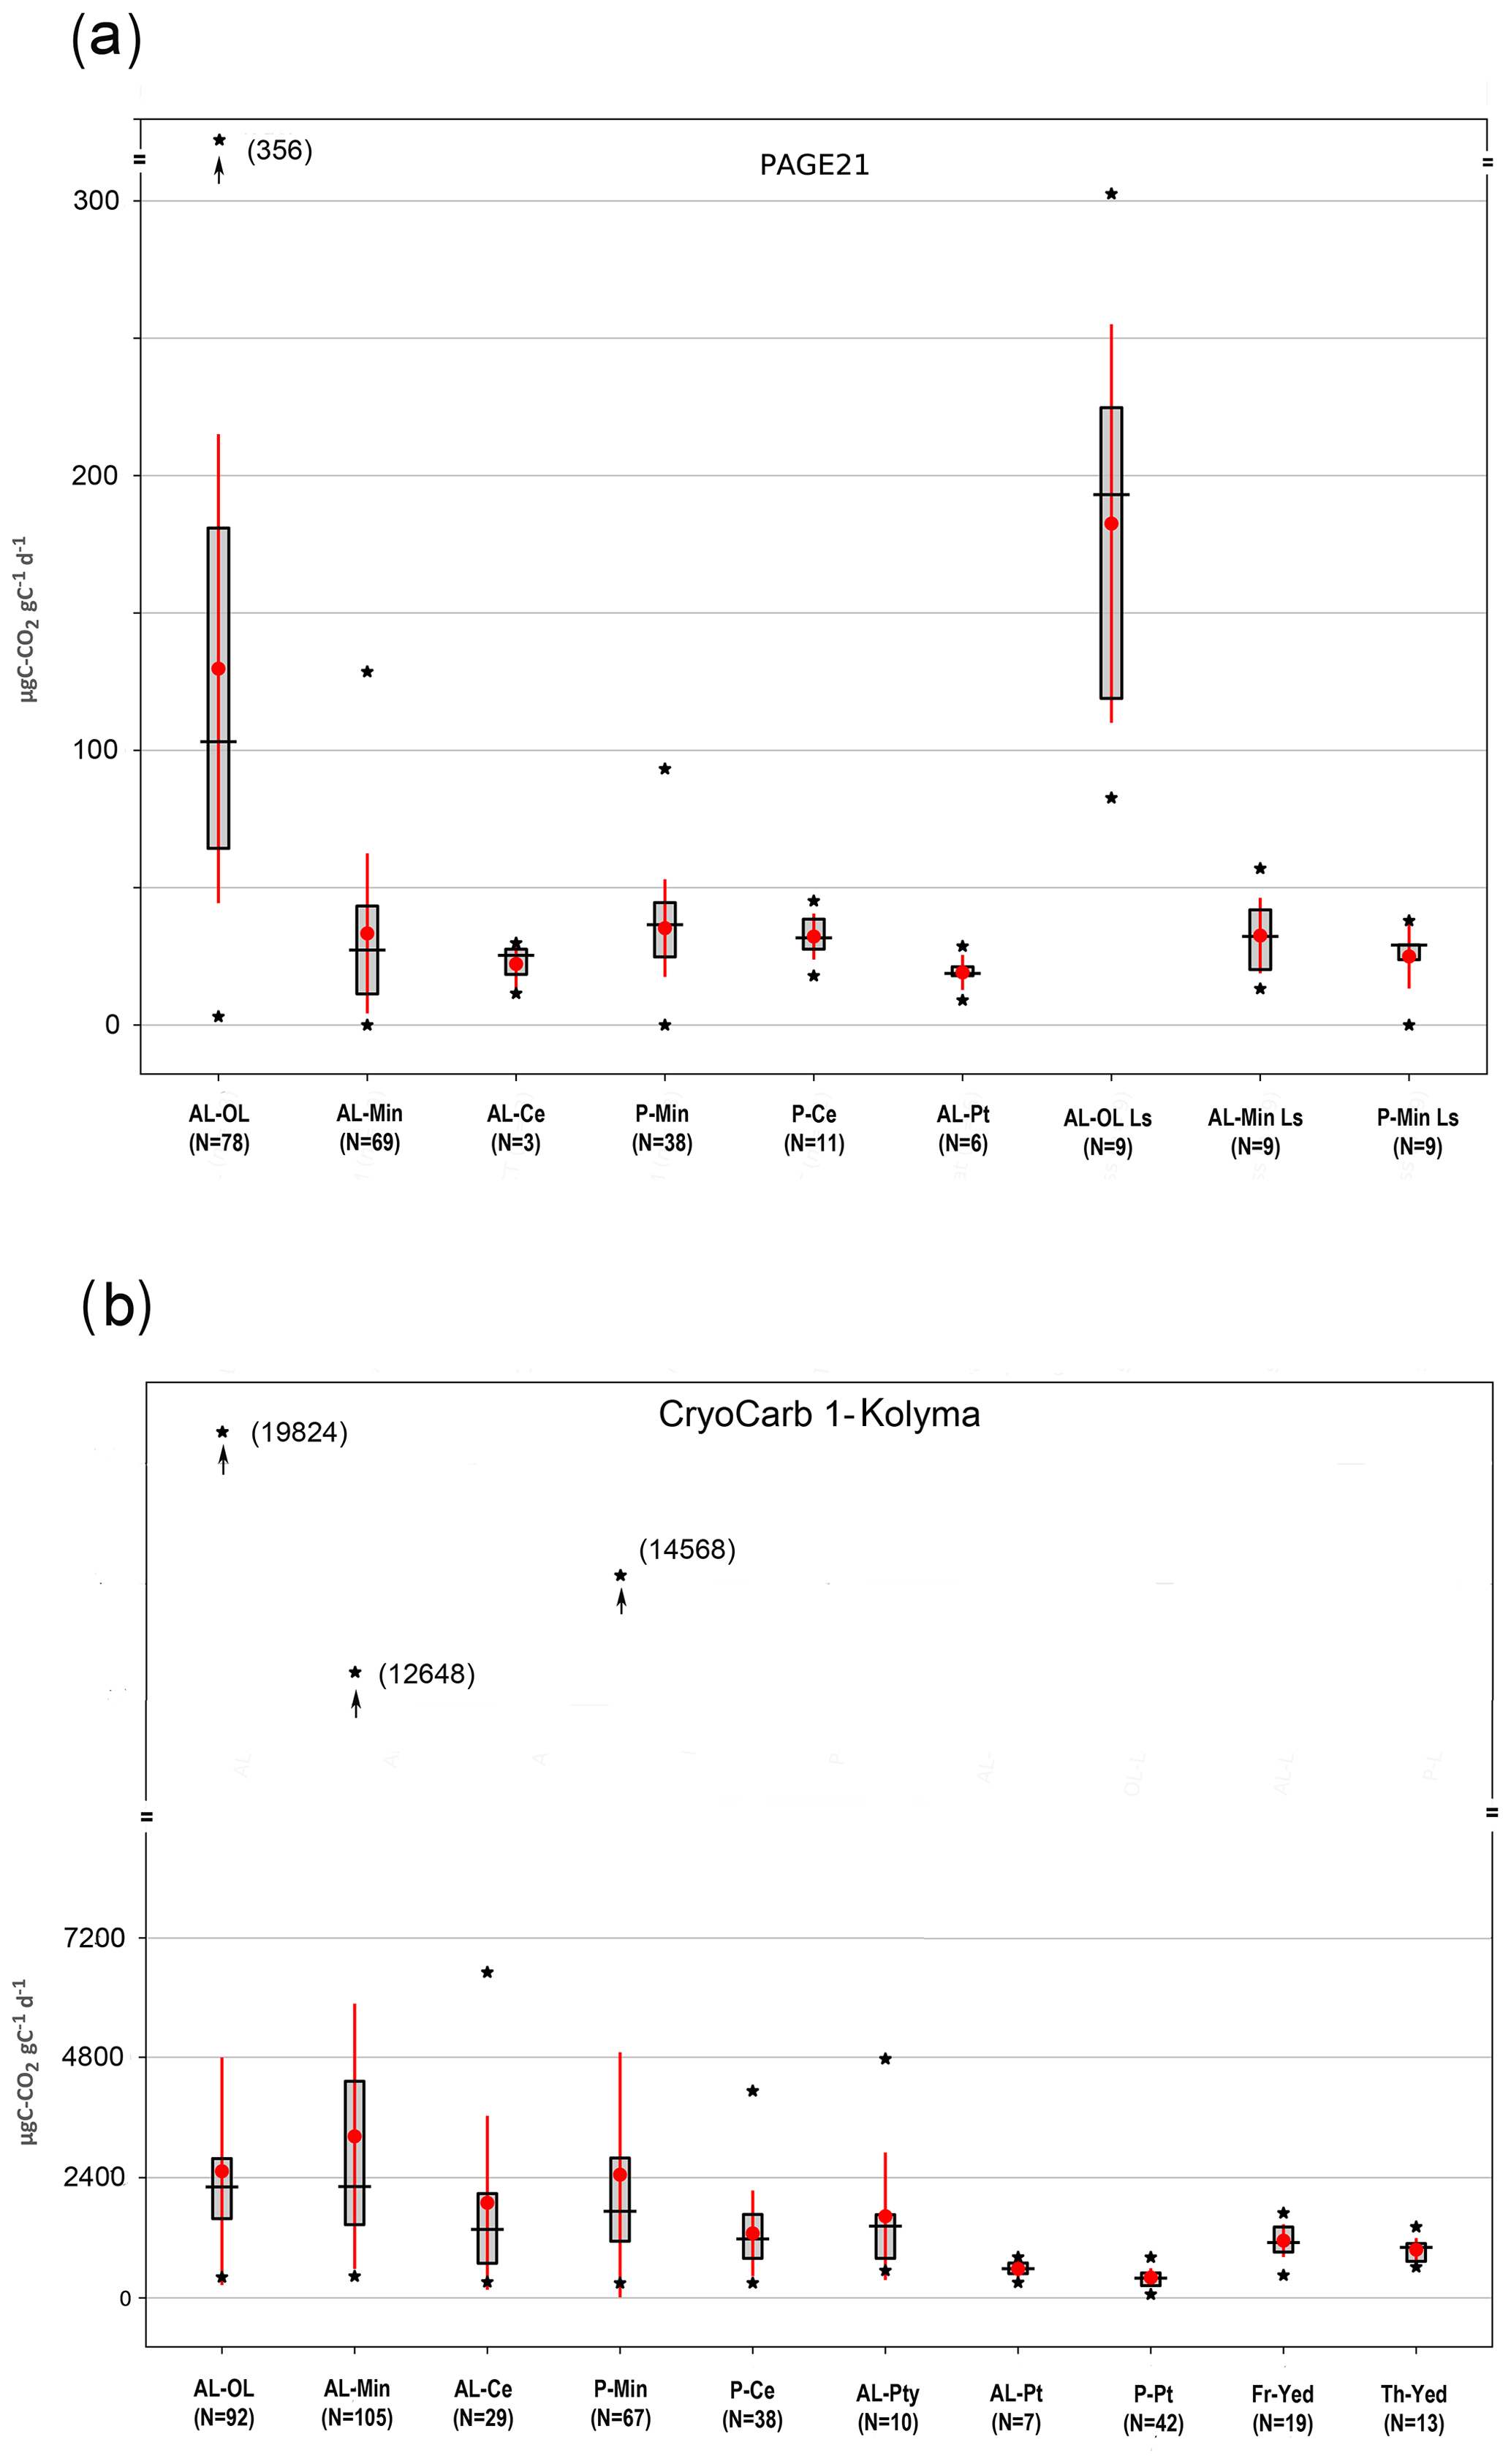
Figure 5µgC-CO2 production per gram carbon in samples of (a) the PAGE21 and (b) the CryoCarb 1-Kolyma incubation experiments, grouped according to soil horizon criteria. AL-OL: active-layer topsoil organics; AL-Min: active-layer mineral; AL-Ce: active layer C enriched; P-Min: permafrost layer mineral; P-Ce: permafrost layer C enriched; AL-Pty: active-layer thin peat (CryoCarb 1-Kolyma experiment only); AL-Pt: active-layer peat; P-Pt: permafrost layer peat (CryoCarb 1-Kolyma experiment only); AL-OL Ls: active-layer topsoil organics in Late Holocene loess deposits (PAGE21 experiment only); AL-Min Ls: active-layer mineral in Late Holocene loess deposits (PAGE21 experiment only); P-Min Ls: permafrost layer mineral in Late Holocene loess deposits (PAGE21 experiment only); Fr-Yed: permafrost Pleistocene yedoma deposits (CryoCarb 1-Kolyma experiment only); Th-Yed: thawed-out Pleistocene yedoma deposits (CryoCarb 1-Kolyma experiment only). Box-whisker plots show the mean and standard deviation (in red) and median, 1st and 3rd quartiles, and minimum and maximum values (in black) for the different soil horizon groups.
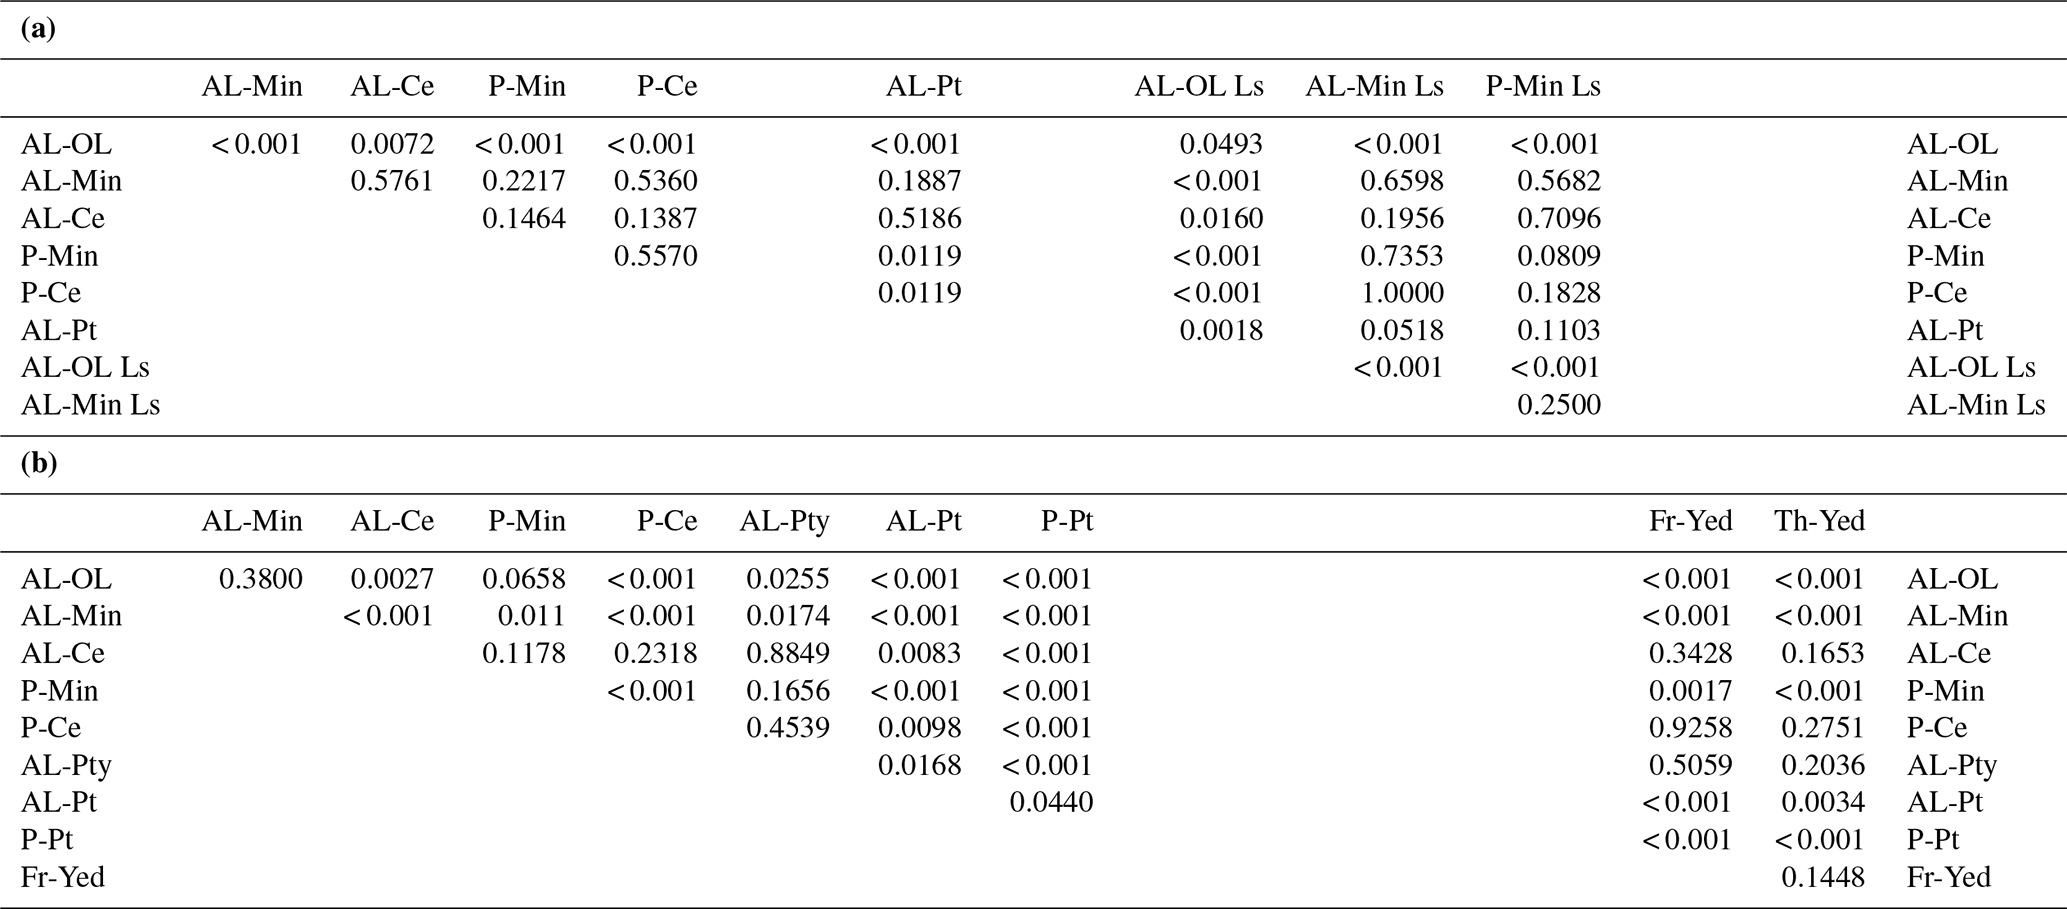
Figure 5 shows C-CO2 production per gC in the soil horizon groups of the longer term PAGE21 and short-term CryoCarb 1-Kolyma experiments. Results of the Mann–Whitney paired tests for both these experiments are shown in Table 4. PAGE21 classes show fewer statistically significant differences than in the CryoCarb 1-Kolyma experiment, which can at least partly be ascribed to smaller sample sizes. The number of samples in the PAGE21 incubation for C-enriched pockets in the active layer (n=3) and for peat (n=6) are particularly low.
C release rates in topsoil organic samples from actively accumulating Holocene loess soils are significantly higher than those in topsoil organic samples from the remaining PAGE21 mineral soils (Fig. 5a and Table 4a). Both topsoil organic classes show significantly higher rates than all mineral soil and peat classes. Peat samples have the lowest mean and median C release rates from all these classes, but only the rates from permafrost layer mineral soil and C-enriched pocket samples are significantly higher. Both mean and median C release rates from active-layer and permafrost layer C-enriched pockets are somewhat lower (but not significantly different) than those from adjacent, non-C-enriched mineral soil samples.
C release rates in the soil horizon classes from the CryoCarb 1-Kolyma experiment show similarities, but there are also some differences compared to those observed in the PAGE21 experiment. Absolute C release rates per gC are more than an order of magnitude higher in the CryoCarb 1-Kolyma experiment (measured as a mean release over the first 4 d of incubation) compared to those in the PAGE21 experiment (measured on day 343 of incubation). Another important difference is that C release rates per gC in the short-term CryoCarb 1-Kolyma incubation do not differ significantly between the topsoil organic class and the active-layer and permafrost layer mineral soil classes, which we ascribe to the presence of a highly labile C pool (e.g., DOC and plant roots) in the mineral soil layers that is quickly decomposed (see Weiss et al., 2016; Faucherre et al., 2018). However, rates from active-layer and permafrost layer C-enriched pockets are significantly lower than those from adjacent, non-C-enriched mineral soil samples. Both active-layer and permafrost layer peat samples show significantly lower C release rates than all other classes, with active layer peat samples having significantly higher rates than permafrost layer peat samples. Samples from the Pleistocene yedoma loess “frozen” and “thawed” classes display significantly lower C release rates per gC than those in the topsoil organic-layer, active-layer and permafrost layer mineral soil classes, but they are significantly higher than those in the peat classes. The two yedoma classes do not differ significantly from each other, the active-layer and permafrost layer C-enriched pocket classes, or the peaty wetland class.
The analysis and comparison of results in the PAGE21 and CryoCarb 1-Kolyma incubations show consistent trends in C-CO2 production rates as a function of simple soil geochemical parameters in both the full datasets as well as in the grouping of samples according to landscape classes. However, it is not possible to directly compare these two very different laboratory experiments quantitatively. The varying field collection techniques, field storage, transport and laboratory storage, pretreatment, experimental setup, and time of measurement after the start of incubations have a clear effect on the magnitude of the observed C-CO2 production rates. The same methods were applied to all samples from all study areas in the PAGE21 experiment, but these differed markedly from those applied in the CryoCarb setup and even between the three individual CryoCarb experiments (e.g., addition of different “local” microbial decomposer inoculi to rewetted samples).
In quantitative terms, C-CO2 production rates per gdw measured over the first 4 d in the CryoCarb 1-Kolyma samples incubated at 12 ∘C are about 15 times higher than those measured after about 1 year in the PAGE21 samples incubated at 5 ∘C (see Fig. 2). Similarly, C-CO2 production rates per gC are also more than an order of magnitude higher in the short-term CryoCarb 1-Kolyma than the longer-term PAGE21 incubation (see Fig. 5). Upper permafrost mineral soil samples (< 3 %C) from Kytalyk in northeastern Siberia, incubated at 2 ∘C directly after field collection and thawing (measurement after 20–30 h, following 3 d of pre-incubation), show median C release rates of ca. 750 µgC-CO2 gC−1 d−1 (Weiss et al., 2016), compared to ca. 1750 µgC-CO2 gC−1 d−1 in the same class of CryoCarb 1-Kolyma samples. Median C release rates in upper permafrost mineral soil samples of the PAGE21 experiment (Faucherre et al., 2018) decrease from ca. 170 on day 8 to ca. 35 µgC-CO2 gC−1 d−1 on day 343 since the start of incubation. It is obvious from these results that there is a rapid decline in C release rates over the time of incubation. Longer incubation experiments (up to 12 years) have shown that the overall rate of C loss decreases almost exponentially over time (Elberling et al., 2013). However, even when the laboratory incubation setups and time of measurement are similar, large differences can occur in C release rates. For instance, peat samples in the CryoCarb 1-Kolyma incubation display about twice the C-CO2 production rates per gdw than those observed in the CryoCarb 3-Seida incubation (Figs. 2b and S3b).
Nonetheless, a comparison of C-CO2 production rates per gdw for landscape unit classes in terms of relative SOM lability provided useful and robust results. These classes were implemented to allow the upscaling of results to the northern permafrost region. They reflect main Gelisol (and non-Gelisol) soil suborders and deeper Quaternary deposits to permit direct comparison with the size and geographic distribution of these different SOC pools (Tarnocai et al., 2009; Hugelius et al., 2014). Samples from mineral soil profiles, including wetland deposits with a thin peat(y) surface layer, display high relative SOM lability compared to peat deposits, deep C-enriched buried or cryoturbated samples, and Pleistocene yedoma deposits (when considering %C of the incubated sample). These results are confirmed by the more stringent statistical analysis of samples grouped into soil horizon classes. Peat deposit, C-enriched pocket and yedoma deposit samples show significantly lower C-CO2 production rates per gC than topsoil organics and mineral layer samples (CryoCarb 1-Kolyma experiment). The same trends are observed in the incubation experiment of the upper permafrost samples from Kytalyk, reported by Weiss et al. (2016). C-enriched pockets (3–10 %C) showed lower C-CO2 production rates per gC than mineral soil samples (< 3 %C), while a buried peat sample (ca. 40 %C) displayed a very low C-CO2 production rate per gC. The PAGE21 experiment also revealed that peat samples mineralized a smaller fraction of C over the 1 year of incubation compared to mineral soil samples (Faucherre et al., 2018).
Table 4p Values of Mann–Whitney paired tests of µgC-CO2 production per gram carbon for soil horizon groups in (a) the PAGE21 and (b) the CryoCarb 1-Kolyma incubation experiments. Abbreviations as in Fig. 5. Differences are considered significant when p< 0.05.
A further subdivision of landscape classes and more careful analysis of incubation results in the PAGE21 experiment provide additional useful insights. For example, the separation of eolian deposits into actively accumulating deposits during the Late Holocene (Adventdalen) and Holocene soils formed into Pleistocene yedoma parent materials (Lena Delta) showed clear differences in C release rates per gdw (when considering %C), with the former displaying a higher SOM lability in topsoil organic samples (see Fig. 3a). The topsoil organic samples from the actively accumulating eolian deposits in Adventdalen also displayed significantly higher C release rates per gC than all other topsoil organic, mineral layer and peat(y) horizon classes (see Table 4a). The separation of alluvial deposits into active floodplain deposits and Holocene soils formed in pre-recent river terraces and of mineral soils into active colluviation sheets (mountain slopes on Svalbard) and other mineral soils showed similar trends in SOM lability (see Fig. 3b–c). These results suggest that the admixture of minerogenic material in topsoil organics of actively accumulating eolian, alluvial and colluvial deposits promotes SOM decomposition. Peaty wetland deposits display much higher C release rates per gdw (when considering %C) than peatland deposits (see Fig. 3d). These two landscape classes are poorly represented in the PAGE21 experiment, but a statistical test of C release rates per gC in these peat(y) soil horizon classes of the CryoCarb 1-Kolyma incubation confirms this difference (see Table 4b). This is interesting because even though wetlands with a thin peat layer do not have particularly high C stocks, they can be important sources of methane (CH4) to the atmosphere (Olefeldt et al., 2013). These further subdivisions into landscape subclasses are of limited use for upscaling purposes because they are not considered explicitly in any available geographic database for the northern permafrost region.
The implementation of landscape classes (and their subdivisions) in the PAGE21 and CryoCarb incubation experiments have greatly constrained variation in C release rates compared to the full datasets. However, much within-class variability remains, and there is a need to further investigate the sources of this variability. Important additional soil and environmental factors such as microbial community, moisture, texture, pH, redox potential, etc. were not available for the (full) PAGE21 and CryoCarb datasets and could, therefore, not be tested. We conclude that additional research is needed to further constrain observed SOM lability across the northern permafrost region and within the classes proposed here.
The relatively low lability in the peatland class is surprising. The low DBD, high %C and high C ∕ N of peat are normally associated with a relatively low degree of decomposition. This, in turn, is the result of environmental factors such as anaerobic and/or permafrost conditions that largely inhibit SOM decay (Davidson and Janssens, 2006). One could expect that this less decomposed material would show high lability following thawing and warming, but our results point to the opposite. This is particularly surprising when considering the setup of the CryoCarb experiments, in which a slush of rewetted material inoculated with microbial decomposers was incubated at 12 ∘C. Although the CryoCarb experiments are very short assays (4 d), the longer-term PAGE21 incubation data (measured after roughly 1 year) provide similar results.
In the case of peat deposits, it should be considered if this low decomposability is an evolved “biochemical trait” in peat-forming species that maintains their favored habitat, similar to the role of Sphagnum anatomy (hyaline cells), physiology (acidification) and cell wall chemistry (phenolic compounds) in sustaining moist and acid surface conditions and inhibiting peat decomposition (Clymo and Hayward, 1982). Furthermore, the generally high C ∕ N ratios of peat provide a poor substrate quality to the decomposer community (Bader et al., 2018). Diáková et al. (2016) reported low microbial biomass in subarctic peat deposits of the Seida study area (northeastern European Russia). Permafrost degradation in peatlands can result in two opposite pathways, one resulting in surface collapse and an increase in soil moisture (particularly mimicked in the CryoCarb incubation setup) and another one resulting in drainage, drying and accelerated C losses, not the least due to a higher incidence of peat fires (Kuhry, 1994).
Our results on the low lability of peat deposits can be compared to the findings of Schädel et al. (2014) in their assessment of SOM decomposability in the northern permafrost region. That study recognized a group of organic soil samples (> 20 % initial C), ranging in depth between 0 and 120 cm. We consider that this group will include both topsoil organic samples as well as deeper peat deposits. In the Schädel et al. (2014) study, this group showed the largest range in decomposability, with some samples showing high potential C losses, whereas deeper organic samples were less likely to respire large amounts of C. We suggest, therefore, that both studies might show the same trends.
In our incubation experiments, SOM from deeper C-enriched buried layers and cryoturbated pockets show relatively low lability when compared to organic-rich topsoil samples. These results are corroborated by Čapek et al. (2015) and Gentsch et al. (2015b), who report low bioavailability of SOM in subducted horizons of Lower Kolyma soils (northeastern Siberia). The reason why this relatively undecomposed material displays low lability remains unclear. One reason could be that the decomposer community needs time to adapt to the new environmental conditions following thawing and warming; another one is that there is a simple mismatch between the microbial community adapted to decompose relatively undecomposed organic material and the physicochemical environment (e.g., higher bulk density) prevailing in (thawed-out) deeper soil horizons (Gittel et al., 2013; Schnecker et al., 2014). Kaiser et al. (2007) and Čapek et al. (2015) reported low microbial biomass in deeper C-enriched soil samples.
These results pose interesting questions regarding the role of organic aggregates and organomineral associations for SOM lability (e.g., Gentsch et al., 2018). On the one hand, our samples from topsoil organic horizons with active minerogenic inputs in eolian, alluvial and colluvial settings display (very) high C release rates, whereas deeper C-enriched soil materials show low decomposability. The underlying soil physicochemical and microbial processes require urgent attention in order to better constrain C release rates from soils and deposits in the northern permafrost region.
Pleistocene yedoma deposits, represented in the CryoCarb 1-Kolyma incubation experiment, also display low relative SOM lability, despite the incorporation of relatively fresh plant root material caused by syngenetic permafrost aggradation. These results are corroborated by results from Schädel et al. (2014) for their group of deep mineral samples (with yedoma provenance).
An important consideration is whether the consistent differences in relative SOM lability of landscape and soil horizon classes observed in our incubation experiments will be maintained over periods of decades to centuries of projected warming and thawing. Very short-term incubations, such as in the CryoCarb setup (4 d) might register the initial decomposition of highly labile SOM components, such as microbial necromass, simple molecules (e.g., sugars or amino acids), low molecular-weight DOC, etc., or it might not provide enough time for an adaptation of the microbial decomposer community to new environmental settings (Weiss et al., 2016; Weiss and Kaal, 2018). On the other hand, in longer incubation experiments such as in the PAGE21 experiment (1 year), the conditions in the incubated samples become gradually more artificial compared to field conditions. Specifically, microbes in long-term incubations become increasingly C limited, as no new C input by plants occur, whereas inorganic nutrients, such as nitrate or ammonium, accumulate to unphysiological levels. Care, therefore, should be taken when extrapolating our results over longer time frames if no corroborating field evidence for longer term decay rates can be obtained (e.g., Kuhry and Vitt, 1996; Schuur et al., 2009).
The PAGE21 and CryoCarb incubation experiments confirm results from previous studies that simple geochemical parameters such as DBD, %C and C ∕ N can provide a good indication of SOM lability in soils and deposits of the northern permafrost region (Elberling et al., 2013; Schädel et al., 2014; Faucherre et al., 2018). In our analyses we have focused on %C of the sample, since it is the most widely available of the three investigated geochemical parameters. Furthermore, %C is less sensitive than C ∕ N to botanical origin of the plant litter and, in contrast to DBD, not dependent on ground compaction or the volume of excess ground ice.
When considering the full datasets of the four experiments, our regressions of C release as a function of %C were statistically significant but explained less than 50 % of the observed variability. Subsequently, we investigated whether a further division of samples into predefined landscape unit classes would better constrain the observed relationships. In defining these classes, we applied a scheme that could easily be used for spatial upscaling to northern circumpolar levels. We adopted the main Gelisol suborders (Histels, Turbels and Orthels), non-permafrost Histosols and mineral soils, and types of deeper Quaternary (deltaic and floodplain, eolian and yedoma) deposits that have been used in the NCSCD and related products to estimate the total SOC pool in the northern permafrost region (Tarnocai et al., 2009; Strauss et al., 2013; Hugelius et al., 2014). We conclude that these landscape classes better constrain observed variability in the relationships and that the relative SOM lability rankings of these classes were consistent among all four incubation experiments, for both regressions against %C and C ∕ N (all four experiments) and for regressions of %C against different units of C-CO2 production “per gram dry weight”, “per gram C” and “per cm3”(PAGE21 dataset). Our results based on full profiles indicate that C-CO2 production rates per gdw decrease in the order of Late Holocene eolian to alluvial and mineral (including peaty wetlands) to Pleistocene yedoma to C-enriched pockets to peat, with the lowest C release rates observed in peat deposits (when considering %C). These results are corroborated by statistical analysis of C release rates per gC for samples grouped according to soil horizon criteria (PAGE21 and CryoCarb 1-Kolyma datasets).
An important conclusion from these results is that purportedly more undecomposed SOM, such as in peat deposits (Histels and Histosols), C-enriched cryoturbated samples (Turbels) and Pleistocene yedoma deposits, does not seem to imply higher SOM lability. These three SOC pools, which together represent ≥50 % of the reported SOC storage in the northern permafrost region (Hugelius et al., 2014; Palmtag and Kuhry, 2018), display relatively low rates of C release. Consequently, there is an urgent need for further research to understand these results in order to better constrain the thawing permafrost carbon feedback on global warming.
The soil geochemical data and incubation results presented in this paper are available upon request from Peter Kuhry (peter.kuhry@natgeo.su.se). For the full PAGE21 incubation dataset, please contact Bo Elberling (be@ign.ku.dk). For the full CryoCarb incubation dataset, please contact Jiří Bárta (jiri.barta@prf.jcu.cz).
The supplement related to this article is available online at: https://doi.org/10.5194/bg-17-361-2020-supplement.
PK developed the initial concept for the study. All authors contributed with the collection of soil profiles at various sites. The PAGE21 incubation experiment was planned and conducted at CENPERM (University of Copenhagen) by SF, CJJ and BE, whereas the CryoCarb incubation experiments were carried out at the University of South Bohemia (České Budějovice) under guidance of HS and JB. PK performed all statistical analyses, in cooperation with GH. All co-authors contributed to the writing of the paper, including its discussion section.
The authors declare that they have no conflict of interest.
The collection and laboratory analyses for Svalbard (Adventdalen and Ny-Ålesund), Stordalen Mire and Lena Delta samples were supported by the EU-FP7 PAGE21 project (grant agreement no. 282700). Lower Kolyma and Taymyr Peninsula samples were collected and incubated in the framework of the ESF CryoCarb project, with support from the Swedish Research Council (VR support to Kuhry), the Austrian Science Fund (FWF; grant no. I370-B17 to Richter), the Czech Science Foundation (project no. 16-18453S to Barta) and the Czech Soil & Water Research Infrastructure (MEYS CZ; grant nos. LM2015075 and EF16-013/0001782 to Šantrůčková). Seida samples were originally collected in the framework of the EU FP6 CARBO-North project (contract no. 036993). Gustaf Hugelius acknowledges a Swedish Research Council Marie Skłodowska Curie International Career Grant. Kateřina Diaková is acknowledged for the collection of the soil inoculi in Seida. The Seida samples were subsequently incubated at the University of South Bohemia. We are most grateful to Nikolai Lashchinskiy (Siberian Branch of the Russian Academy of Sciences, Novosibirsk, Russia) and Nikolaos Lampiris, Juri Palmtag, Nathalie Pluchon, Justine Ramage, Matthias Siewert and Martin Wik (all of Stockholm University), for help in sample collection. We would also like to thank Magarethe Watzka (University of Vienna) for elemental analyses of soil samples. Zhanna Kuhrij is acknowledged for the preparation of Figs. 5 and S6. We thank two anonymous reviewers for their constructive comments on the paper.
This research has been supported by the EU FP7 PAGE21 (grant no. 282700), the Swedish Research Council (no. 90735701), the Austrian Science Fund (no. FWF I370-B17), the Czech Science Foundation (no. 16-18453S), the Czech Soil & Water Research Infrastructure grants (MEYS CZ; nos. LM2015075 and EF16-013/0001782), the EU FP6 Carbo-North grant (no. 036993), and the Swedish Research Council Marie Skłodowska Curie International Career grant (no. 330-2014-6417).
The article processing charges for this open-access
publication were covered by Stockholm University.
This paper was edited by Lutz Merbold and reviewed by two anonymous referees.
Bader, C., Müller, M., Schulin, R., and Leifeld, J.: Peat decomposability in managed organic soils in relation to land use, organic matter composition and temperature, Biogeosciences 15, 703–719, https://doi.org/10.5194/bg-15-703-2018, 2018.
Birch, H. F.: The effect of soil drying on humus decomposition and nitrogen availability, Plant Soil, 10, 9–31, 1958.
Biskaborn, B. K., Smith, S. L., Noetzli, J., Matthes, H., Vieira, G., Streletskiy, D. A., Schoeneich, P., Romanovsky, V. E., Lewkowicz, A. G., Abramov, A., Allard, M., Boike, J., Cable, W. L., Christiansen, H. H., Delaloye, R., Diekmann, B., Drozdov, D., Etzelmüller, B., Grosse, G., Guglielmin, M., Ingeman-Nielsen, T., Isaksen, K., Ishikawa, M., Johansson, M., Johannsson, H., Joo, A., Kaverin, D., Kholodov, A., Konstantinov, P., Kröger, T., Lambiel, C., Lanckman, J. P., Luo, D., Malkova, G., Meiklejohn, I., Moskalenko, N., Oliva, M., Phillips, M., Ramos, M., Sannel, A. B. K., Sergeev, D., Seybold, C., Skryabin, P., Vasiliev, A., Wu, Q., Yoshikawa, K., Zheleznyak, M., and Lantuit, H.: Permafrost is warming at a global scale, Nat. Commun., 10, 264, https://doi.org/10.1038/s41467-018-08240-4, 2019.
Bockheim, J. G.: Importance of cryoturbation in redistributing organic carbon in permafrost-affected soils, Soil Sci. Soc. Am. J., 71, 1335–1342, https://doi.org/10.2136/sssaj2006.0414N, 2007.
Brown, J., Ferrians Jr., O. J., Heginbottom, J. A., and Melnikov, E. S.: Circum-Arctic map of permafrost and ground-ice conditions, 1:10 000 000, Map CP-45, United States Geological Survey, International Permafrost Association, Washington, DC, 1997.
Brown, J., Ferrians Jr., O. J., Heginbottom, J. A., and Melnikov, E. S.: Circum-Arctic map of permafrost and ground-ice conditions, version 2. Boulder, Colorado USA, NSIDC: National Snow and Ice Data Center, 2002.
Burke, E. J., Hartley, I. P., and Jones, C. D.: Uncertainties in the global temperature change caused by carbon release from permafrost thawing, The Cryosphere, 6, 1063–1076, https://doi.org/10.5194/tc-6-1063-2012, 2012.
Čapek, P., Diáková, K., Dickopp, J. E., Bárta, J., Wild, B., Schnecker, J., and Hugelius, G.: The effect of warming on the vulnerability of subducted organic carbon in arctic soils, Soil Biol. Biochem., 90, 19–29, https://doi.org/10.1016/j.soilbio.2015.07.013, 2015.
Ciais, P.: A geoscientist is astounded by Earth's huge frozen carbon deposits, Nature, 462, 393, https://doi.org/10.1038/462393e, 2009.
Clymo, R. S. and Hayward, P. M.: The Ecology of Sphagnum, in: Bryophyte Ecology, edited by: Smith, A. J. E., 540, 229–289, https://doi.org/10.1007/978-94-009-5891-3_8, 1982.
Davidson, E. A. and Janssens, I. A.: Temperature sensitivity of soil carbon decomposition and feedbacks to climate change, Nature, 440, 165–173, https://doi.org/10.1038/nature04514, 2006.
Diáková, K., Čapek, P., Kohoutová, I., Mpamah, P., Barta, J., Biasi, C., Martikainen, P., and Šantrůčková, H.: Heterogeneity of carbon loss and its temperature sensitivity in East-European subarctic tundra soils, FEMS Microbiol. Ecol., 92, fiw140, https://doi.org/10.1093/femsec/fiw140, 2016.
Elberling, B., Michelsen, A., Schädel, C., Schuur, E. A., Christiansen, H. H., Berg, L., Tamstorf, M. P., and Sigsgaard, C.: Long-term CO2 production following permafrost thaw, Nat. Clim. Change, 3, 890–894, https://doi.org/10.1038/nclimate1955, 2013.
Faucherre, S., Jørgensen, C. J., Blok, D., Weiss, N., Siewert, M. B., Bang-Andreasen, T., Hugelius, G., Kuhry, P., and Elberling, B.: Short and long-term controls on active layer and permafrost carbon turnover across the Arctic, J. Geophys. Res.–Biogeo., 123, 372–390, https://doi.org/10.1002/2017JG004069, 2018.
Fierer, N. and Schimel, J. P.: A proposed mechanism for the pulse in carbon dioxide production commonly observed following the rapid rewetting of a dry soil, Soil Sci. Soc. Am. J., 67, 798–805, https://doi.org/10.2136/sssaj2003.0798, 2003.
Franzluebbers, A. J., Haney, R. L., Honeycutt, C. W., Schomberg, H. H., and Hons, F. M.: Flush of carbon dioxide following rewetting of dried soil relates to active organic pools, Soil Sci. Soc. Am. J., 64, 613–623, https://doi.org/10.2136/sssaj2000.642613x, 2000.
Gentsch, N., Mikutta, R., Alves, R. J. E., Barta, J., Čapek, P., Gittel, A., Hugelius, G., Kuhry, P., Lashchinskiy, N., Palmtag, J., Richter, A., Šantrůčková, H., Schnecker, J., Shibistova, O., Urich, T., Wild, B., and Guggenberger, G.: Storage and transformation of organic matter fractions in cryoturbated permafrost soils across the Siberian Arctic, Biogeosciences, 12, 4525–4542, https://doi.org/10.5194/bg-12-4525-2015, 2015a.
Gentsch, N., Mikutta, R., Shibistova, O., Wild, B., Schnecker, J., Richter, A., and Guggenberger, G.: Properties and bioavailability of particulate and mineral-associated organic matter in Arctic permafrost soils, Lower Kolyma Region, Russia. European J. Soil Sci., 66, 722–734, https://doi.org/10.1111/ejss.12269, 2015b.
Gentsch, N., Wild, B., Mikutta, R., Čapek, P., Diáková, K., Schrumpf, M., Turner, S., Minnich, C., Schaarschmidt, F., Shibistova, O., Schnecker, J., Urich, T., Gittel, A., Šantrůčková, H., Bárta, J., Lashchinskiy, N., Fuß, R., Richter, A., and Guggenberger, G.: Temperature response of permafrost soil carbon is attenuated by mineral protection, Glob. Change Biol., 24, 3401–3415, https://doi.org/10.1111/gcb.14316, 2018.
Gittel, A., Bárta, J., Kohoutová, I., Mikutta, R., Owens, S., Gilbert, J., Schnecker, J., Wild, B., Hannisdal, B., Maerz, J., Lashchinskiy, N., Čapek, P., Šantrůčková, H., Gentsch, N., Shibistova, O., Guggenberger, G., Richter, A., Torsvik, V. L., Schleper, C., and Urich, T.: Distinct microbial communities associated with buried soils in the Siberian tundra, ISME J., 8, 841–853, 2014.
Grosse, G., Harden, J., Turetsky, M. R., McGuire, A. D., Camill, P., Tarnocai, C., Frolking, S., Schuur, E. A. G., Jorgenson, T., Marchenko, S., Romanovsky, V., Wickland, K. P., French, N., Waldrop, M. P., Bourgeau-Chavez, L., and Striegl, R. G.: Vulnerability of high-latitude soil organic carbon in North America to disturbance, J. Geophys. Res., 116, G00K06, https://doi.org/10.1029/2010JG001507, 2011.
Gruber, N, Friedlingstein, P., Field, C. B., Valentini, R., Heimann, M., Richey, J. E., Romero-Lankao, P., Schulze, D., and Chen, C.-T. A.: The vulnerability of the carbon cycle in the 21st century: An assessment of carbon-climate-human interactions, in: The Global Carbon Cycle, Integrating Humans, Climate and the Natural World, edited by: Field, C. and Raupach, M., Island Press, Washington DC, 45–76, 2004.
Hammer, Ø., Harper, D. A. T., and Ryan, P. D.: PAST: Paleontological Statistics Software Package for Education and Data Analysis, Palaeontol. Electron., 4, 9 pp., 2001.
Harden, J. W., Koven, C. D., Ping, C. L., Hugelius, G., McGuire, A. D., Camill, P., Jorgenson, T., Kuhry, P., Michaelson, G. J., O'Donnell, J. A., Schuur, E. A. G., Tarnocai, C., Johnson, K., and Grosse, G.: Field information links permafrost carbon to physical vulnerabilities of thawing, Geophys. Res. Lett., 39, L15704, https://doi.org/10.1029/2012gl051958, 2012.
Horwath Burnham, J. and Sletten, R. S.: Spatial distribution of soil organic carbon in northwest Greenland and underestimates of High Arctic carbon stores, Global Biogeochem. Cy., 24, GB3012, https://doi.org/10.1029/2009GB003660, 2010.
Hugelius, G. and Kuhry, P.: Landscape partitioning and environmental gradient analyses of soil organic carbon in a permafrost environment, Global Biogeochem. Cy., 23, GB3006, https://doi.org/10.1029/2008GB003419, 2009.
Hugelius, G., Kuhry, P., Tarnocai, C., and Virtanen, T.: Soil organic carbon pools in a periglacial landscape: a case study from the central Canadian Arctic, Permafrost Periglac., 21, 16–29, https://doi.org/10.1002/ppp.677, 2010.
Hugelius, G., Virtanen, T., Kaverin, D., Pastukhov, A., Rivkin, F., Marchenko, S., Romanovsky, V., and Kuhry, P.: High-resolution mapping of ecosystem carbon storage and potential effects of permafrost thaw in periglacial terrain, European Russian Arctic, J. Geophys. Res., 116, G03024, https://doi.org/10.1029/2010JG001606, 2011.
Hugelius, G., Strauss, J., Zubrzycki, S., Harden, J. W., Schuur, E. A. G., Ping, C.-L., Schirrmeister, L., Grosse, G., Michaelson, G. J., Koven, C. D., O'Donnell, J. A., Elberling, B., Mishra, U., Camill, P., Yu, Z., Palmtag, J., and Kuhry, P.: Estimated stocks of circumpolar permafrost carbon with quantified uncertainty ranges and identified data gaps, Biogeosciences, 11, 6573–6593, https://doi.org/10.5194/bg-11-6573-2014, 2014.
Hugelius, G., Kuhry, P., and Tarnocai, C.: Ideas and perspectives: Holocene thermokarst sediments of the Yedoma permafrost region do not increase the northern peatland carbon pool, Biogeosciences, 13, 2003–2010, https://doi.org/10.5194/bg-13-2003-2016, 2016.
IPCC: Summary for Policymakers, in: Climate Change 2013: The Physical Science Basis, Contribution of Working Group I to the Fifth Assessment Report of the Intergovernmental Panel on Climate Change, edited by: Stocker, T. F., Qin, D., Plattner, G.-K., Tignor, M., Allen, S. K., Boschung, J., Nauels, A., Xia, Y., Bex, V., and Midgley, P. M., Cambridge University Press, Cambridge, United Kingdom and New York, NY, USA, 28 pp., 2013.
IPCC: Summary for Policymakers, in: Global Warming of 1.5 ∘C. An IPCC Special Report on the impacts of global warming of 1.5 ∘C above pre-industrial levels and related global greenhouse gas emission pathways, in: the context of strengthening the global response to the threat of climate change, sustainable development, and efforts to eradicate poverty, edited by: Masson-Delmotte, V., Zhai, P., Pörtner, H.-O., Roberts, D., Skea, J., Shukla, P. R., Pirani, A., Moufouma-Okia, W., Péan, C., Pidcock, R., Connors, S., Matthews, J. B. R., Chen, Y., Zhou, X., Gomis, M. I., Lonnoy, E., Maycock, T., Tignor, M., and Waterfield, T., World Meteorological Organization, Geneva, Switzerland, 32 pp., 2018.
Jarvis, P., Rey, A., Petsikos, C., Wingate, L., Rayment, M., Pereira, J., Banza, J., David, J., Miglietta, F., Borghetti, M., Manca., G., and Valentini, R.: Drying and wetting of Mediterranean soils stimulates decomposition and carbon dioxide emission: the “Birch effect”, Tree Physiol., 27, 929–940, 2007.
Kaiser, C., Meyer, H., Biasi, C., Rusalimova, O., Barsukov, P., and Richter, A.: Conservation of soil organic matter through cryoturbation in arctic soils in Siberia, J. Geophys. Res., 112, G02017, https://doi.org/10.1029/2006JG000258, 2007.
Knoblauch, C., Beer, C., Sosnin, A., Wagner, D., and Pfeiffer, E-M.: Predicting long-term carbon mineralization and trace gas production from thawing permafrost of Northeast Siberia, Glob. Change Biol., 19, 1160–1172, https://doi.org/10.1111/gcb.12116, 2013.
Kuhry, P.: The role of fire in the development of Sphagnum-dominated peatlands in Western Boreal Canada, J. Ecol., 82, 899–910, 1994.
Kuhry, P. and Vitt, D. H.: Fossil carbon/nitrogen ratios as a measure of peat decomposition, Ecology, 77, 271–275, https://doi.org/10.2307/2265676, 1996.
Kuhry, P., Dorrepaal, E., Hugelius, G., Schuur, E. A. G., and Tarnocai, C.: Potential remobilization of belowground permafrost carbon under future global warming, Permafrost Periglac., 21, 208–214, https://doi.org/10.1002/ppp.684, 2010.
NCSCDv2: The Northern Circumpolar Soil Carbon Database, version 2, https://doi.org/10.5879/ECDS/00000002, 2014.
Olefeldt, D., Turetsky, M. R., Crill, P. M., and McGuire, A. D.: Environmental and physical controls on northern terrestrial CH4 emissions across permafrost zones, Glob. Change Biol., 19, 589–603, https://doi.org/10.1111/gcb.12071, 2013.
Palmtag, J. and Kuhry, P.: Grain size controls on cryoturbation and soil organic carbon density in permafrost-affected soils, Permafrost Periglac., 29, 112–120, https://doi.org/10.1002/ppp.1975, 2018.
Palmtag, J., Hugelius, G., Lashchinskiy, N., Tamstorf, M. P., Richter, A., Elberling, B., and Kuhry, P.: Storage, landscape distribution and burial history of soil organic matter in contrasting areas of continuous permafrost, Arct. Antarct. Alp. Res., 47, 71–88, https://doi.org/10.1657/AAAR0014-027, 2015.
Palmtag, J., Ramage, J., Hugelius, G., Gentsch, N., Lashchinskiy, N., Richter, A., and Kuhry, P.: Controls on the storage of organic carbon in permafrost soils in northern Siberia, Eur. J. Soil Sci., 67, 478–491, https://doi.org/10.1111/ejss.12357, 2016.
Ping, C.-L., Michaelson, G. J., Jorgenson, M. T., Kimble, J. M., Epstein, H., Romanovsky, V. E., and Walker, D. A.: High stocks of soil organic carbon in North American Arctic region, Nat. Geosci., 1, 615–619, https://doi.org/10.1038/ngeo284, 2008.
Šantrůčková, H., Kurbatova, J., Shibistova, O., Smejkalova, M., and Kastovska, E.: Short-Term Kinetics of Soil Microbial Respiration – A General Parameter Across Scales?, in: Tree Species Effects on Soils: Implications for Global Change, Proceedings of the NATO Advanced Research Workshop on Trees and Soil Interactions, Implications to Global Climate Change, August 2004, Krasnoyarsk, Russia, 229–246, https://doi.org/10.1007/1-4020-3447-4_13, 2006.
Schädel, C., Schuur, E. A. G., Bracho, R., Elberling, B., Knoblauch, C., Lee, H., Luo, Y., Shaver, G. R., and Turetsky, M. R.: Circumpolar assessment of permafrost C quality and its vulnerability over time using long-term incubation data, Glob. Change Biol., 20, 641–652, https://doi.org/10.1111/gcb.12417, 2014.
Schuur, E. A. G., Bockheim, J., Canadell, J. G., Euskirchen, E., Field, C. B., Goryachkin, S. V., Hagemann, S., Kuhry, P., Lafleur, P. M., Lee, H., Mazhitova, G., Nelson, F. E., Rinke, A., Romanovsky, V. E., Shiklomanov, N., Tarnocai, C., Venevsky, S., Vogel, J. G., and Zimov, S. A.: Vulnerability of Permafrost Carbon to Climate Change: Implications for the Global Carbon Cycle, Bioscience, 58, 701–714, https://doi.org/10.1641/B580807, 2008.
Schuur, E. A. G., McGuire, A. D., Schädel, C., Grosse, G., Harden, J. W., Hayes D. J., Hugelius, G., Koven, C. D., Kuhry, P., Lawrence, D. M., Natali, S. M., Olefeldt, D., Romanovsky, V. E., Schaefer, K., Turetsky, M. R., Treat, C. C., and Vonk, J. E.: Climate change and the permafrost carbon feedback, Nature, 20, 171–179, https://doi.org/10.1038/nature14338, 2015.
Shmelev, D., Veremeeva, A., Kraev, G., Kholodov, A., Spencer, R. G. M., and Walker, W. S.: Estimation and Sensitivity of Carbon Storage in Permafrost of North-Eastern Yakutia, Permafrost. Periglac., 28, 379–390, https://doi.org/10.1002/ppp.1933, 2017.
Siewert, M. B.: High-resolution digital mapping of soil organic carbon in permafrost terrain using machine learning: a case study in a sub-Arctic peatland environment, Biogeosciences, 15, 1663–1682, https://doi.org/10.5194/bg-15-1663-2018, 2018.
Siewert, M. B., Hugelius, G., Heim, B., and Faucherre, S.: Landscape controls and vertical variability of soil organic carbon storage in permafrost-affected soils of the Lena River Delta, CATENA, 147, 725–741, https://doi.org/10.1016/j.catena.2016.07.048, 2016.
Schnecker, J., Wild, B., Hofhansl, F., Eloy Alves, R. J., Bárta, J., Čapek, P., Fuchslueger, L., Gentsch, N., Gittel, A., Guggenberger, G., Hofer, A., Kienzl, S., Knoltsch, A., Lashchinskiy, N., Mikutta, R., Santrůčková, H., Shibistova, O., Takriti, M., Urich, T., Weltin, G., and Richter, A.: Effects of soil organic matter properties and microbial community composition on enzyme activities in cryoturbated arctic soils, PLoS ONE, 9, e94076, https://https://doi.org/10.1371/journal.pone.0094076, 2014.
Soil Survey Staff: Keys to Soil Taxonomy, Twelfth Edition, USDA Natural Resources Conservation Service, Washington, DC, 372 pp., 2014.
Strauss, J., Schirrmeister, L., Grosse, G., Wetterich, S., Ulrich, M., Herzschuh, U., and Hubberten, H.-W.: The deep permafrost carbon pool of the Yedoma region in Siberia and Alaska, Geophys. Res. Lett., 40, 6165–6170, https://doi.org/10.1002/2013GL058088, 2013.
Tarnocai, C., Canadell, J. G., Schuur, E. A. G., Kuhry, P., Mazhitova, G., and Zimov, S.: Soil organic carbon pools in the northern circumpolar permafrost region, Global Biogeochem. Cy., 23, GB2023, https://doi.org/10.1029/2008GB003327, 2009.
Vardy, S. R., Warner, B. G., Turunen, J., and Aravena, R.: Carbon accumulation in permafrost peatlands in the Northwest Territories and Nunavut, Canada, The Holocene, 10, 273–280, https://doi.org/10.1191/095968300671749538, 2000.
Walter Anthony, K. M., Zimov, S. A., Grosse, G., Jones, M. C., Anthony, P. M., Iii, F. S. C., Finlay, J. C., Mack, M. C., Davydov, S., Frenzel, P., and Frolking, S.: A shift of thermokarst lakes from carbon sources to sinks during the Holocene epoch, Nature, 511, 452–456, https://doi.org/10.1038/nature13560, 2014.
Weiss, N. and Kaal, J.: Characterization of labile organic matter in Pleistocene permafrost (NE Siberia), using Thermally assisted Hydrolysis and Methylation (THM-GC-MS), Soil Biol. Biochem., 117, 203–213, https://doi.org/10.1016/j.soilbio.2017.10.001, 2018.
Weiss, N., Blok, D., Elberling, B., Hugelius, G., Jorgensen, C. J., Siewert, M. B., and Kuhry, P.: Thermokarst dynamics and soil organic matter characteristics controlling initial carbon release from permafrost soils in the Siberian Yedoma region, Sediment. Geol., 340, 38–48, https://doi.org/10.1016/j.sedgeo.2015.12.004, 2016.
Weiss, N., Faucherre, S., Lampiris, N., and Wojcik, R.: Elevation-based upscaling of organic carbon stocks in high Arctic permafrost terrain: A storage and distribution assessment for Spitsbergen, Svalbard, Polar Res., 36, https://doi.org/10.1080/17518369.2017.1400363, 2017.
Zechmeister-Boltenstern, S., Keiblinger, K. M., Mooshammer, M., Penuelas, J., Richter, A., Sardans, J., and Wanek, W.: The application of ecological stoichiometry to plant–microbial–soil organic matter transformations, Ecol. Monogr., 85, 133–155, https://doi.org/10.1890/14-0777.1, 2015.