the Creative Commons Attribution 4.0 License.
the Creative Commons Attribution 4.0 License.
 | 26 Mar 2020
Carbon–nitrogen interactions in European forests and semi-natural vegetation – Part 1: Fluxes and budgets of carbon, nitrogen and greenhouse gases from ecosystem monitoring and modelling
Chris R. Flechard
Andreas Ibrom
Ute M. Skiba
Wim de Vries
Marcel van Oijen
David R. Cameron
Nancy B. Dise
Janne F. J. Korhonen
Nina Buchmann
Arnaud Legout
David Simpson
Maria J. Sanz
Marc Aubinet
Denis Loustau
Leonardo Montagnani
Johan Neirynck
Ivan A. Janssens
Mari Pihlatie
Ralf Kiese
Jan Siemens
André-Jean Francez
Jürgen Augustin
Andrej Varlagin
Janusz Olejnik
Radosław Juszczak
Mika Aurela
Daniel Berveiller
Bogdan H. Chojnicki
Ulrich Dämmgen
Nicolas Delpierre
Vesna Djuricic
Julia Drewer
Eric Dufrêne
Werner Eugster
Yannick Fauvel
David Fowler
Arnoud Frumau
André Granier
Patrick Gross
Yannick Hamon
Carole Helfter
Arjan Hensen
László Horváth
Barbara Kitzler
Bart Kruijt
Werner L. Kutsch
Raquel Lobo-do-Vale
Annalea Lohila
Bernard Longdoz
Michal V. Marek
Giorgio Matteucci
Marta Mitosinkova
Virginie Moreaux
Albrecht Neftel
Jean-Marc Ourcival
Kim Pilegaard
Gabriel Pita
Francisco Sanz
Jan K. Schjoerring
Maria-Teresa Sebastià
Y. Sim Tang
Hilde Uggerud
Marek Urbaniak
Netty van Dijk
Timo Vesala
Sonja Vidic
Caroline Vincke
Tamás Weidinger
Sophie Zechmeister-Boltenstern
Klaus Butterbach-Bahl
Eiko Nemitz
Mark A. Sutton
The impact of atmospheric reactive nitrogen (Nr) deposition on carbon (C) sequestration in soils and biomass of unfertilized, natural, semi-natural and forest ecosystems has been much debated. Many previous results of this dC∕dN response were based on changes in carbon stocks from periodical soil and ecosystem inventories, associated with estimates of Nr deposition obtained from large-scale chemical transport models. This study and a companion paper (Flechard et al., 2020) strive to reduce uncertainties of N effects on C sequestration by linking multi-annual gross and net ecosystem productivity estimates from 40 eddy covariance flux towers across Europe to local measurement-based estimates of dry and wet Nr deposition from a dedicated collocated monitoring network. To identify possible ecological drivers and processes affecting the interplay between C and Nr inputs and losses, these data were also combined with in situ flux measurements of NO, N2O and CH4 fluxes; soil leaching sampling; and results of soil incubation experiments for N and greenhouse gas (GHG) emissions, as well as surveys of available data from online databases and from the literature, together with forest ecosystem (BASFOR) modelling.
Multi-year averages of net ecosystem productivity (NEP) in forests ranged from −70 to 826 g C m−2 yr−1 at total wet + dry inorganic Nr deposition rates (Ndep) of 0.3 to 4.3 g N m−2 yr−1 and from −4 to 361 g C m−2 yr−1 at Ndep rates of 0.1 to 3.1 g N m−2 yr−1 in short semi-natural vegetation (moorlands, wetlands and unfertilized extensively managed grasslands). The GHG budgets of the forests were strongly dominated by CO2 exchange, while CH4 and N2O exchange comprised a larger proportion of the GHG balance in short semi-natural vegetation. Uncertainties in elemental budgets were much larger for nitrogen than carbon, especially at sites with elevated Ndep where Nr leaching losses were also very large, and compounded by the lack of reliable data on organic nitrogen and N2 losses by denitrification. Nitrogen losses in the form of NO, N2O and especially were on average 27 % (range 6 %–54 %) of Ndep at sites with Ndep < 1 g N m−2 yr−1 versus 65 % (range 35 %–85 %) for Ndep > 3 g N m−2 yr−1. Such large levels of Nr loss likely indicate that different stages of N saturation occurred at a number of sites. The joint analysis of the C and N budgets provided further hints that N saturation could be detected in altered patterns of forest growth. Net ecosystem productivity increased with Nr deposition up to 2–2.5 g N m−2 yr−1, with large scatter associated with a wide range in carbon sequestration efficiency (CSE, defined as the NEP ∕ GPP ratio). At elevated Ndep levels (> 2.5 g N m−2 yr−1), where inorganic Nr losses were also increasingly large, NEP levelled off and then decreased. The apparent increase in NEP at low to intermediate Ndep levels was partly the result of geographical cross-correlations between Ndep and climate, indicating that the actual mean dC∕dN response at individual sites was significantly lower than would be suggested by a simple, straightforward regression of NEP vs. Ndep.
- Article
(6167 KB) - Companion paper
-
Supplement
(1574 KB) - BibTeX
- EndNote


The global terrestrial net sink for atmospheric carbon dioxide (CO2) is approximately 1.7 Pg C yr−1, i.e. roughly one-fifth of global CO2-C emissions by fossil fuel combustion and industry (9.4±0.5 Pg C yr−1). This corresponds to the land-based carbon (C) uptake of 3.2±0.8 Pg C yr−1 minus emissions from deforestation and other land-use changes of 1.5±0.7 Pg C yr−1. The ocean sink is of the same order (2.4±0.5 Pg C yr−1), while twice as much CO2-C (4.7±0.02 Pg C yr−1) is added yearly to the atmosphere (Le Quéré et al., 2018). Data from atmospheric CO2 inversion methods (e.g. Bousquet et al., 1999; Ciais et al., 2010), from national to global forest C inventory approaches (Goodale et al., 2002; Pan et al., 2011) and from eddy covariance (EC) flux networks (Luyssaert et al., 2007) have suggested that a dominant part of this terrestrial CO2 sink is currently occurring in forests, and especially in boreal and temperate forests of the Northern Hemisphere (Ciais et al., 2010; Pan et al., 2011). Tropical forest areas are believed to be closer to carbon neutral (Pan et al., 2011), or even a net C source globally (Baccini et al., 2017), due to emissions from deforestation, forest degradation and land-use change offsetting their sink potential. However, others (Stephens et al., 2007) have argued that the tropical land CO2 sink may be stronger – and the northern hemispheric land CO2 sink weaker – than was generally believed. At the European scale, Schulze et al. (2010) calculated that the net biome productivity (NBP, the mean long-term carbon sink at a large spatial scale) of temperate and boreal forests was 81 % of the total continental-scale land sink.
The large European and North American CO2 sinks have been attributed to a combination of factors including afforestation of abandoned land and formerly cut forests, reduced forest harvest, CO2 fertilization, changes in management and age structure legacy effects in Europe (Vilén et al., 2016), and atmospheric reactive nitrogen (Nr) deposition (Reay et al., 2008; Ciais et al., 2013, and references therein; De Vries et al., 2017). However, some studies (Nadelhoffer et al., 1999; Gundale et al., 2014; Fernández-Martínez et al., 2017) have questioned the widespread theory that elevated Nr deposition boosts forest C sequestration, and the magnitude of the N fertilization effect on forest C sequestration has been a matter of much debate (Magnani et al., 2007, 2008; Högberg, 2007; De Schrijver et al., 2008; de Vries et al., 2008; Sutton et al., 2008; Dezi et al., 2010; Binkley and Högberg, 2016). A better understanding of the impact of nitrogen deposition on natural and semi-natural ecosystems, in particular over forests, and the impact on the carbon and nitrogen cycles as an indirect effect resulting from anthropogenic activities (Canadell et al., 2007) remains key to improving the forecast of regional (de Vries et al., 2017) and global (Du and de Vries, 2018) models.
The relevance of Nr deposition for the global C sequestration potential, or more explicitly the dC∕dN response (change in C storage with change in Nr deposition), has been estimated typically through meta-analyses of Nr addition experiments (e.g. Schulte-Uebbing and de Vries, 2018), or by combining forest growth inventories, together with estimates of Nr deposition obtained from large-scale forest monitoring plots (Solberg et al., 2009; Laubhann et al., 2009; De Vries et al., 2008). Both methods have many sources of uncertainty. One key difficulty in the latter approach lies in estimating total (wet + dry) Nr deposition (Ndep), especially dry deposition, which is highly variable spatially, very challenging to measure and consequently hard to parameterize in regional-scale chemical transport models (CTMs) (Flechard et al., 2011; Simpson et al., 2014; Schwede et al., 2018). The annual or long-term dry deposition component of Ndep to forests, in all the diversity of N-containing forms (gaseous vs. aerosol, reduced vs. oxidized, inorganic vs. organic, e.g. Zhang et al., 2009), has been actually measured (by micrometeorological methods) in very few forests worldwide (Neirynck et al., 2007; Erisman et al., 1996). Due to the large diversity of atmospheric compounds that contribute to total Nr and the complexity of the measurement techniques required for each compound (Flechard et al., 2011), it is even debatable that complete measurements of all Nr deposition terms have ever been achieved anywhere. Thus virtually all studies of the forest dC∕dN response so far have relied on modelled atmospheric Nr deposition estimates, at least for the dry and occult deposition fractions, and further the Nr deposition data being used were systematically provided by the outputs of large-scale regional (e.g. Sutton et al., 2008; Fernández-Martínez et al., 2017) or even global (Fleischer et al., 2013) models, with resolutions of typically 10 km × 10 km or 1∘ × 1∘, respectively. Grid averaging in such large-scale models introduces a large uncertainty in local (ecosystem-scale) Nr dry deposition rates (Schwede et al., 2018), particularly when the forest sites are located near agricultural or industrial Nr sources (Loubet et al., 2009; Fowler et al., 1998).
Additionally, nitrogen losses may significantly offset atmospheric Nr inputs at eutrophicated and acidified sites, with the consequence that dC∕dN may correlate better with net, rather than gross, atmospheric Nr inputs. Depending especially on the extent of ecosystem N saturation (De Schrijver et al., 2008), substantial N losses may occur in the form of nitrate () leaching (Dise et al., 2009), nitric oxide (NO) and nitrous oxide (N2O) emissions (Pilegaard et al., 2006); ammonia (NH3) bidirectional exchange (Hansen et al., 2013); and emissions of di-nitrogen (N2) from total denitrification (Butterbach-Bahl et al., 2002) (Fig. 1). The implication is that the carbon response to Ndep would be non-linear, with larger dC∕dN at low Ndep rates and a lowering of dC∕dN as Ndep increases, as suggested in the review by Butterbach-Bahl and Gundersen (2011) and further elaborated in De Vries et al. (2014). The latter authors show in their review that above a certain N deposition level, the dC∕dN response declines due to adverse effects of excess Nr deposition and high soil ammonium () concentration and nitrification (e.g. acidification, nutrient base cation losses, aluminium mobility), which are known to reduce soil fertility and affect ecosystem health and functioning (Aber, 1992).
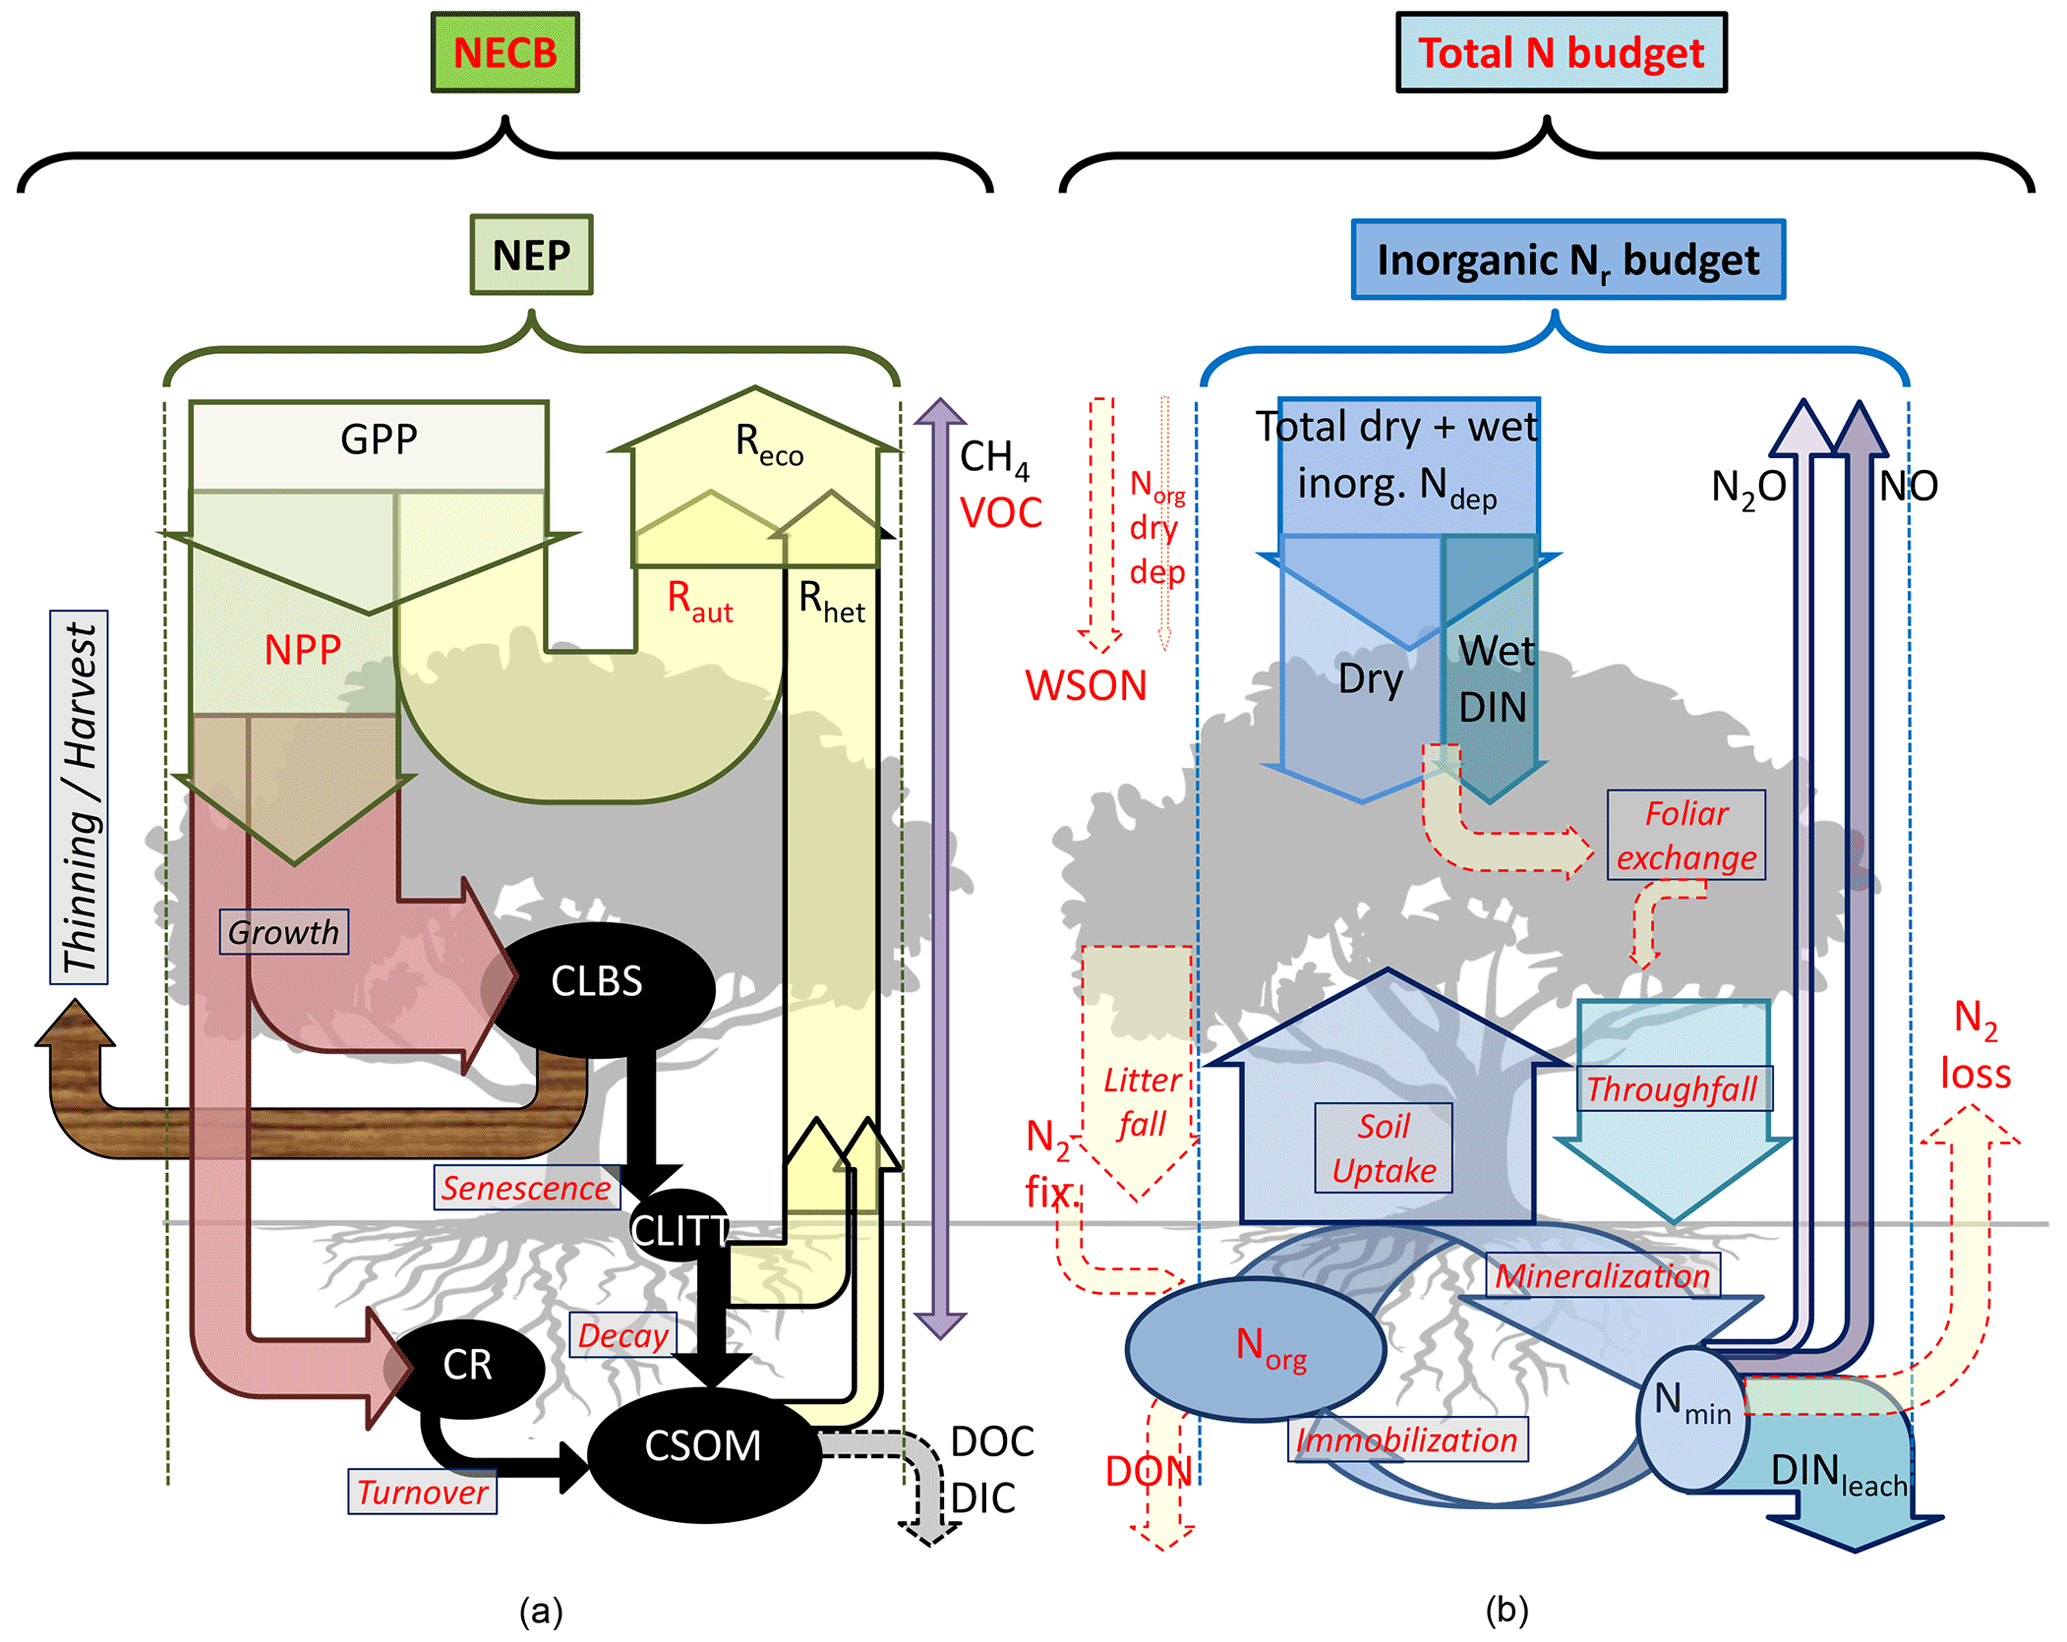
Figure 1Flux terms and boundaries of the carbon (a) and nitrogen (b) budgets discussed in this paper. Net ecosystem productivity NEP = GPP − Reco (≈ NPP − Rhet) based on multi-annual eddy covariance CO2 flux data. The net ecosystem carbon balance (NECB) includes in addition other C loss fluxes such as DIC/DOC, CH4 and VOC, as well as harvest, thinning or other disturbances (e.g. fire). Inorganic reactive nitrogen (Nr) budget = Ndep − DINleach − NO − N2O. The total N budget includes in addition organic nitrogen deposition (WSON) and leaching (DON), as well as N2 inputs and losses from biological fixation and denitrification, respectively. CLBS, CSOM, CR, CLITT: carbon stocks in leaves, branches and stems; in soil organic matter; in roots; and in litter layers, respectively. Terms highlighted in red indicate that direct or measurement-based estimates were not available for some or all sites in our datasets (see also Table 2 for a list of acronyms, Table 3 for a summary of methods and Table S6 for data availability).
Carbon losses through dissolved organic carbon (DOC) and biogenic dissolved inorganic carbon (DIC) leaching can also be significant, especially for wetlands (Dinsmore et al., 2010) and also grassland and cropland ecosystems (Kindler et al., 2011; Gielen et al., 2011). This is relevant for the net ecosystem carbon balance (NECB) or the net biome productivity (NBP) estimates obtained on the basis of EC flux systems and needs to be accounted for as a part of the net ecosystem productivity (NEP) that is not actually stored in the system (Chapin et al., 2006; Schulze et al., 2010) (Fig. 1). Dissolved and/or emitted methane (CH4) may further represent a significant loss from organic soils (Hendriks et al., 2007), while CH4 oxidation, which is often observed in well-aerated soils and can be suppressed by Nr addition, especially (Steudler et al., 1989), may affect the net greenhouse gas (GHG) budget. Nitrogen-deposition-induced N2O emissions from the forest floor (Pilegaard et al., 2006; Liu and Greaver, 2009), or from denitrification triggered by deposited in peatland (Francez et al., 2011), can also offset the gain in the ecosystem GHG balance resulting from a hypothetical nitrogen fertilization effect.
Nitrogen deposition or addition is known to affect soil microbial C cycling in many different ways, for example high-level N enrichment generally leading to reduced microbial biomass and suppressed soil CO2 respiration (Treseder, 2008); a reduction of basal respiration without significant decline in total microbial biomass, following N addition to incubated peat cores (Francez et al., 2011); and added altering directly the oxidative enzyme production by microbial communities and hence controlling extracellular enzyme activity (Waldrop and Zak, 2006). Nitrate addition can lead to a reduction in CH4 emissions from wetlands and peatlands (Francez et al., 2011), since in anaerobic conditions and in the presence of as an electron acceptor, denitrifying bacteria can oxidize organic C substrates (e.g. acetate) and thus outcompete methanogenic communities (Boone, 1991). However, if chronic N enrichment of peatland ecosystems leads to floristic changes, especially an increase in vascular plants at the expense of bryophytes, the net effect may be an increase in CH4 emissions (Nykänen et al., 2002), as the aerenchyma of tracheophytes provides a direct diffusion path to the atmosphere for soil-produced CH4, bypassing oxidation in the peat by methanotrophs. Excess-nitrogen-induced vegetation composition changes in Sphagnum moss peatland are believed to reduce C sequestration potentials, and the effect is likely to be exacerbated by climate change (Limpens et al., 2011).
This complex web of interactions between the C and N cycles and losses shows the need for integrated approaches for studying the impacts of Nr deposition on C sequestration and net GHG budgets. Ideally, all C and N gain and loss pathways (including infrequently or rarely measured fluxes such as Nr dry deposition, organic C and N leaching fluxes, and GHG fluxes; see Fig. 1) should be quantified at long-term experimental sites to improve and calibrate process-based models. Closing the C and N budgets experimentally at each site of large (e.g. FLUXNET) monitoring networks is unlikely to occur in the near future, but realistic and cost-effective measurement approaches can be used to progressively reduce the uncertainties for the large terms of the budgets. Such approaches were tested and implemented in this study, as part of a large-scale effort, within the NitroEurope Integrated Project (NEU, 2013; Sutton and Reis, 2011), to quantify Nr deposition and N losses from ecosystems, in parallel and coordinated with the CarboEurope Integrated Project (CEIP, 2011) to estimate the net C and GHG balance, for forest and semi-natural ecosystems in Europe.
A main objective of this paper is to build tentative C, N and GHG budgets, as well as analyse C–N interactions empirically, for a wide range of European monitoring sites, by using measurements or observation-based data as far as possible, complemented by modelling. Important methodological goals are to critically examine uncertainties in measurement methods and elemental budgets, to identify knowledge and data gaps, and to assess the current state of process understanding as encoded in models. To this end, we compiled the C, N and GHG flux data from NEU, CEIP and other complementary datasets, using a combination of in situ measurements, empirical relationships, ecosystem modelling, literature and database surveys, at the scale of the CEIP and NEU flux monitoring networks. This study presents the methodologies and discusses the different terms of the budgets, including atmospheric deposition from gas, aerosol and precipitation Nr concentration monitoring, soil leaching measurements and modelling, GHG and Nr emission estimates from chamber measurements and laboratory-based soil bioassays, EC-tower-based C budgets, and historical published data. Forest ecosystem modelling (BASFOR) is used to simulate C, N and GHG fluxes, with the double objective to compare with actual measurements and to fill some gaps in the datasets. Wherever possible, alternative measurements, datasets or modelled data are shown alongside the primary data in order to provide an estimate of the uncertainty in the different terms. In the companion paper (Flechard et al., 2020), the response of C sequestration to Ndep is quantified using the same datasets.
2.1 Monitoring sites
The study comprised 40 terrestrial ecosystem-scale, carbon and nitrogen flux monitoring sites, including 31 forests (F) and nine natural or semi-natural (SN) short vegetation ecosystems, primarily moorlands, wetlands and extensively managed, unfertilized grasslands (Table 1). The sites spanned a European geographical and climatic gradient from the Mediterranean to the Arctic and from the Atlantic to western Russia (Fig. S1 in the Supplement), an elevation range of −2 m to 1765 m a.m.s.l., a mean annual temperature (MAT) range of −1.0 to 17.6 ∘C, and a mean annual precipitation (MAP) range of 500 to 1365 mm. Selected references are provided for each site in Table S1 in the Supplement. A list of the main acronyms and abbreviations used in the paper is provided in Table 2.
Table 1Overview of ecosystem and climatic characteristics and inter-annual mean ecosystem–atmosphere exchange fluxes for forest and semi-natural short vegetation sites.

a PFT (plant functional types): DB – deciduous broadleaf forest; EN – evergreen needleleaf coniferous forest; EB – evergreen broadleaf Mediterranean forest; MF – mixed deciduous–coniferous forest; SN – short semi-natural, including moorland, peatland, shrubland and unimproved/upland grassland. b Maximum canopy height. c Maximum leaf area index, defined as one-sided or half of the total. d Above mean sea level. e Mean annual temperature. f Mean annual precipitation. g Nitrogen deposition. h Gross primary productivity. i Ecosystem respiration. j Net ecosystem productivity. n/a: not applicable.
The forest sites of the study ranged from very young (< 10 years old) to mature (> 150 years old) and can be broadly classified into four plant functional types (PFTs) or five dominant tree categories (Table 1): deciduous broadleaf (DB), evergreen needleleaf (EN, comprising mostly spruce and pine species), mixed deciduous–coniferous (MF), and Mediterranean evergreen broadleaf (EB). Forest species composition, stand characteristics, C and N contents of different ecosystem compartments (leaves, wood, soil), soil physical properties and micro-climatological characteristics are described in Tables S2–S5. Semi-natural short vegetation ecosystems included unimproved (mountainous and semi-arid) grasslands, wetlands and peatlands; they are included in the study as unfertilized, C-rich soil systems, providing a contrast with forests where storage also occurs above ground (thus with different C∕N ratios). Among the 40 EC-CO2 flux measurement stations, most sites (36) were part of the CEIP CO2 flux network. A further three CO2 flux sites were operated as part of the NEU network (EN2, EN16, and SN3), and one site (DB4) was included from the French F-ORE-T observation network (F-ORE-T, 2012). Table S6 provides an overview of the available C, N and GHG flux measurements, detailed hereafter.

2.2 Nitrogen fluxes
Input and output fluxes of the ecosystem nitrogen and carbon budgets are represented schematically in Fig. 1. The following sections describe the methods used to quantify the different terms, summarized in Table 3.
2.2.1 Atmospheric deposition
To obtain realistic estimates of total (dry + wet) Nr deposition at the 40 sites of the network, it was necessary to measure ambient air concentrations of the main N-containing chemical species at each location, due to the large spatial heterogeneity in gas-phase concentrations, especially for NH3. The requirement for local measurements of wet deposition was relaxed because this is much less spatially variable. For both dry and wet components, measurements had to be complemented by models, either to calculate fluxes based on local concentration data at each site or to obtain local estimates from a large-scale CTM when data were missing.
Table 3Summary of the main methods used to quantify carbon, nitrogen, and greenhouse gas fluxes and budgets for the 31 forests and nine short semi-natural vegetation sites included in this study. Horizontal bars (green: forests; blue: short semi-natural vegetation) indicate the percentage of study sites with available data (filled bars) or without available data (open bars). See also Tables S6–S7 for details at individual sites.
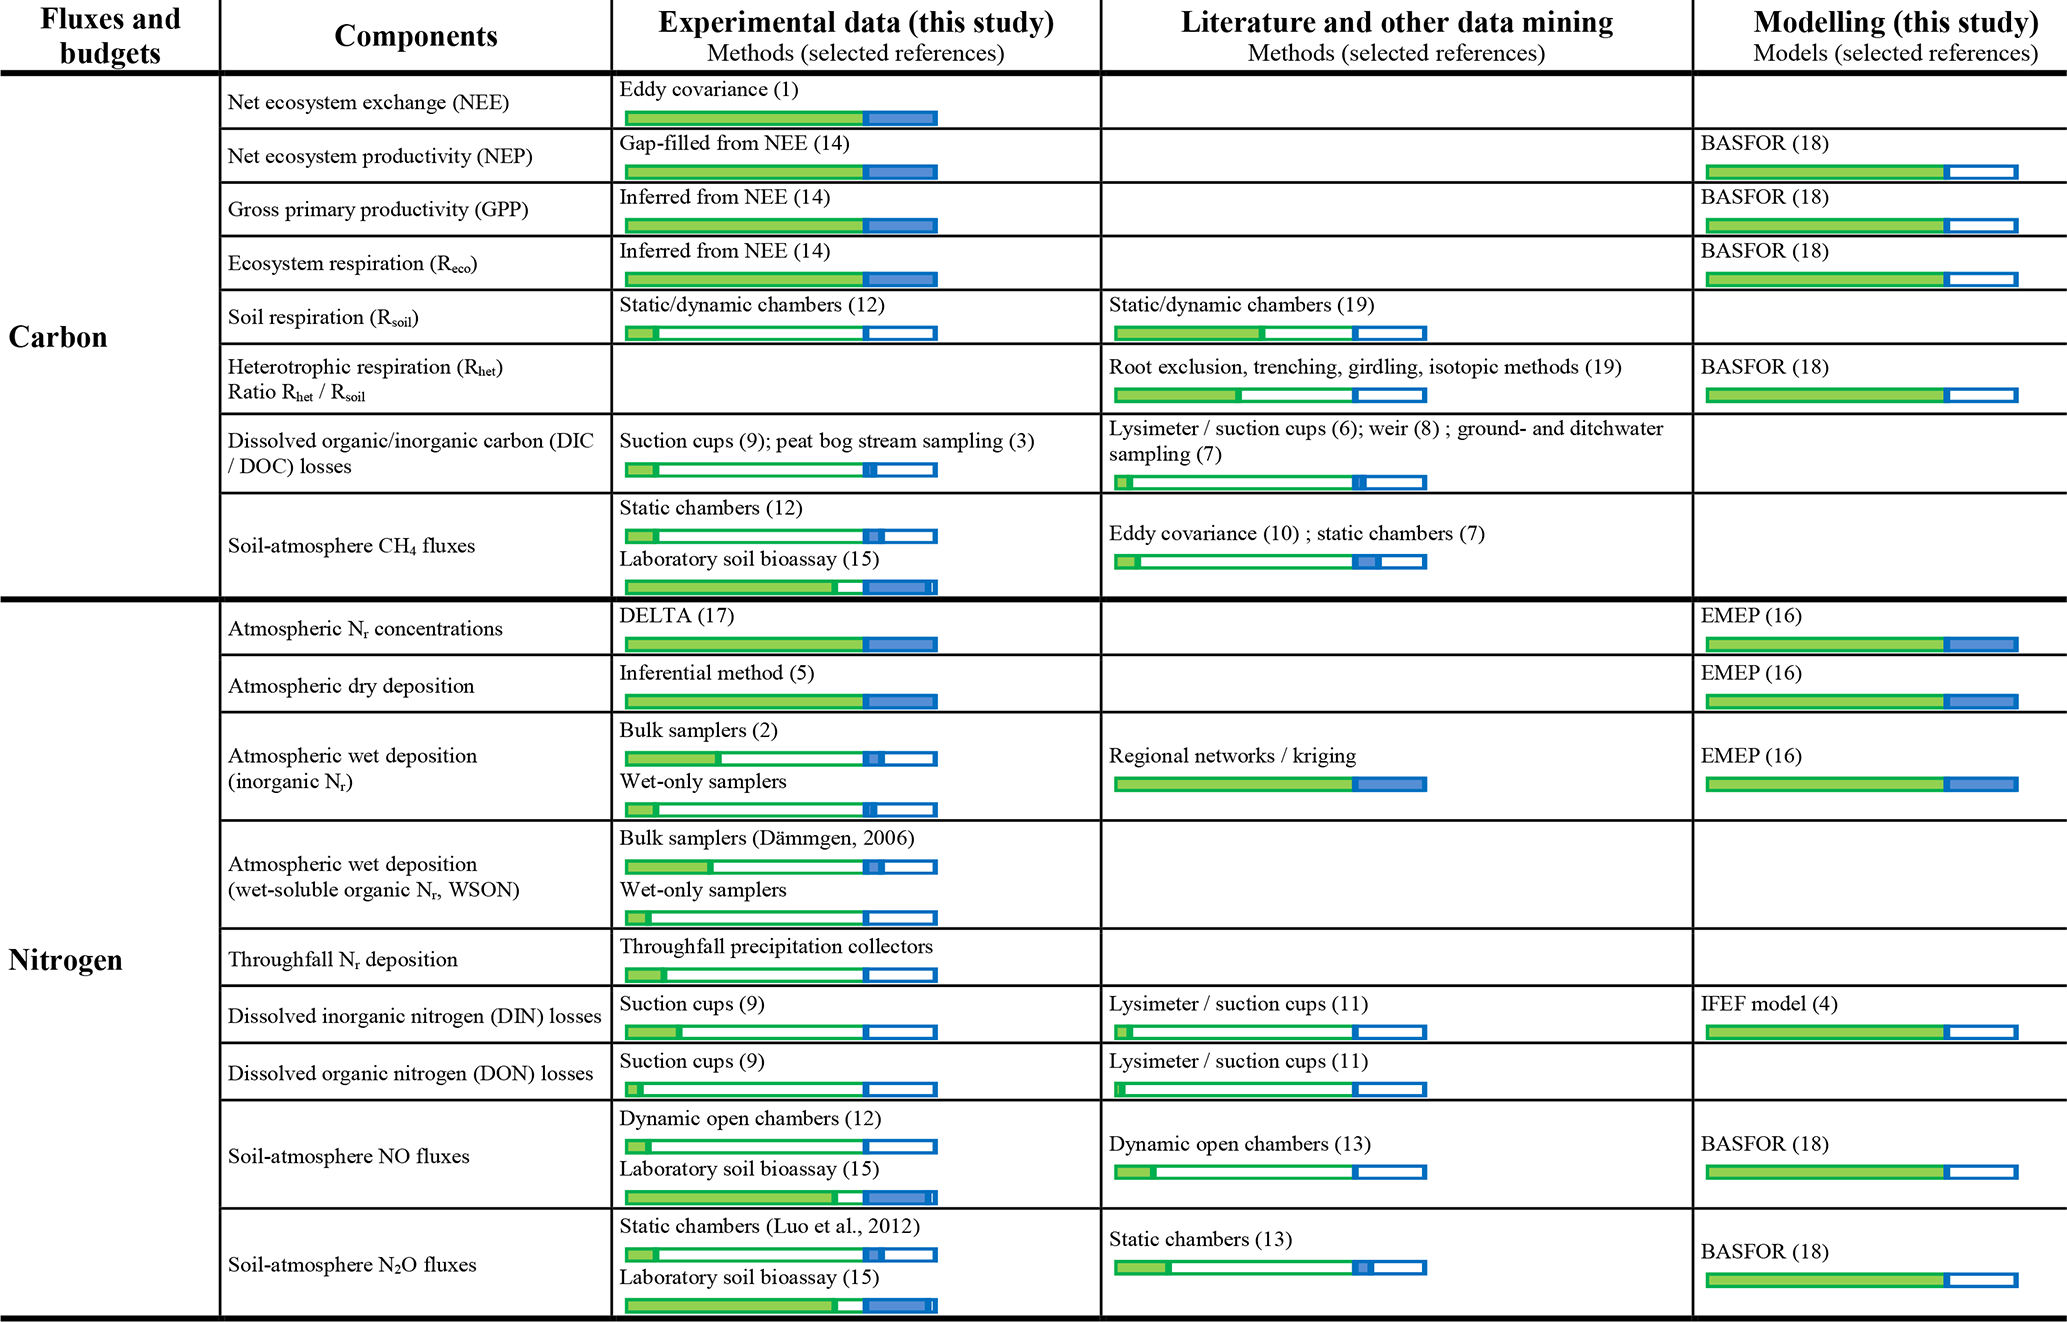
1 Aubinet et al. (2000). 2 Dämmgen (2006). 3 Dinsmore et al. (2010). 4 Dise et al. (2009). 5 Flechard et al. (2011). 6 Gielen et al. (2011). 7 Hendriks et al. (2007). 8 Ilvesniemi et al. (2009). 9 Kindler et al. (2011). 10 Kowalska et al. (2013). 11 Legout et al. (2016). 12 Luo et al. (2012). 13 Pilegaard et al. (2006). 14 REddyProc (2019). 15 Schaufler et al. (2010). 16 Simpson et al. (2012). 17 Tang et al. (2009). 18 van Oijen et al. (2005). 19 See Table S7.
Atmospheric inorganic Nr concentrations, available from the NEU (2013) database, were measured monthly for 2–4 years in the gas phase (NH3, HNO3, HONO) and in the aerosol phase (, ), using DEnuder for Long-Term Atmospheric sampling (DELTA) systems (Sutton et al., 2001; Tang et al., 2009). Concentrations of nitrogen dioxide (NO2), not covered by DELTA sampling, were measured by chemiluminescence at a few sites only and were otherwise taken from gridded concentration outputs of the European-scale EMEP CTM (details given below). The Nr data initially reported in Flechard et al. (2011) covered the first 2 years of the NEU project (2007–2008); here, the data from the entire 4-year NEU monitoring period (2007–2010) were used and averaged to provide a more robust long-term 4-year estimate of Nr dry deposition. The inferential modelling method was used to calculate dry deposition for N-containing gas and aerosol species, whereby measured ambient Nr concentrations were multiplied by a vegetation-, meteorology- and chemical-species-dependent deposition velocity (Vd) (Flechard et al., 2011, 2013; Bertolini et al., 2016; Thimonier et al., 2018). In the case of NH3, a canopy compensation point scheme was applied in some models, allowing bidirectional exchange between the surface and the atmosphere. Considering notoriously large uncertainties in deposition velocities and large discrepancies between the surface exchange schemes currently used in different CTMs, we tried here to minimize such uncertainties by using the ensemble average dry deposition predicted by four different models, as in Flechard et al. (2011).
The dry deposition of atmospheric organic Nr (ON) species not accounted for by the EMEP model (e.g. amines, urea), and not included in DELTA measurements, can contribute a fraction of total Nr deposition. However, Kanakidou et al. (2016) suggest that particulate ON largely dominates the atmospheric ON load, and for particles the main atmospheric removal mechanism is through precipitation. Thus, dry deposition of ON is expected to be much smaller than wet deposition of water-soluble organic compounds (see below).
For wet deposition, several sources of data were used, and the final wet deposition estimate was derived from the arithmetic mean of the different sources, where available. First, within the NEU project, a survey was made of the available national and/or transnational (e.g. EMEP, 2013; ICP, 2019) wet deposition monitoring network concentration data for inorganic N (, ) in the different European countries hosting one or several CEIP/NEU flux sites. These data were checked for consistency and outliers, harmonized, and then spatially interpolated by kriging to provide measurement-based estimates of solute concentrations in rainfall for each of the 40 sites of this study. Wet deposition was then calculated as the product of interpolated concentration times measured precipitation at each site.
Next, 13 sites (DB1, DB3, DB4, EN4, EN9, EN13, EN14, EB2, EB3, MF1, MF2, SN3, SN8) were identified as lacking local or nearby wet deposition measurements. These sites were equipped for three years (2008–2010) with bulk (open funnel) precipitation samplers (Model B, Rotenkamp, Germany; Dämmgen, 2006), mounted above the canopy or inside a clearing for some of the forest sites, with monthly sample change and analysis. The precipitation samples were stabilized by addition of thymol at the beginning of each exposure period and were analysed subsequently for inorganic Nr ( and ) as well as , Cl−, , base cations (Mg2+, Ca2+, K+, Na+) and pH. A few other sites (EN2, EN8, EN10, EN16, DB2, SN9) were already equipped with wet-only or bulk precipitation collectors. No correction was applied to the bulk deposition estimates to account for a possible contribution by dry deposition within the sampler glass funnel (e.g. Dämmgen et al., 2005), since there did not appear to be any systematic overestimation compared with wet deposition estimates from the monitoring networks or EMEP data (see Results and Fig. S2), even if a more significant bias may be expected in dry (Mediterranean) regions.
In addition to inorganic nitrogen, the wet deposition of water-soluble organic Nr (WSON) compounds was also investigated in precipitation samples at 16 sites (Cape et al., 2012). However, since WSON data were not available for all sites and the measurements were subject to considerable uncertainties (Cape et al., 2012), and also because the contribution of WSON to total Nr deposition was on average less than 5 %, WSON was not included in the final estimates of total Nr deposition.
The last data source was the ca. 50 km × 50 km gridded modelled wet inorganic Nr deposition (also NO2 concentrations, discussed above), simulated by the European-scale EMEP CTM (Simpson et al., 2006a, b, 2012, 2014) for the years 2007–2010, available from EMEP (2013). The data were downloaded in 2013, and it should be noted that in this data series different model versions were used for the different years. This leads to some uncertainty, especially in the dry deposition estimates, but it is hard to say which model version is the most realistic. Evaluation of the model against measurements over this period has shown quite consistent results for the wet-deposited components and NO2 concentrations, but the dry deposition rates cannot be evaluated versus actual measurements at the European scale. We chose therefore to make use of all versions and years, giving a small ensemble of simulations.
2.2.2 Soil gaseous and leaching losses
Nitrogen losses to the atmosphere (gaseous emissions) and to groundwater (N leaching) are especially hard to quantify and thus typically cause large uncertainties in ecosystem N budgets. These Nr losses were estimated by direct flux measurements or by indirect empirical methods. Soil NO and N2O emissions were measured in the field using closed static and dynamic chamber methods, as part of NEU (e.g. EN2, EN10, EN16, DB2, SN3, SN8, SN9) and/or collected from the literature (e.g. EN2, EN10, EN14, EN16, DB2, Pilegaard et al., 2006; long-term data at EN2 in Luo et al., 2012). Such data were available for N2O at seven forest sites and four semi-natural sites, as well as at five forest sites for NO (Table S6). Manual static chamber N2O measurements were made manually at a typically fortnightly (growing season) or monthly (winter half-year) frequency at many sites. Automatic chamber systems, allowing continuous N2O measurements at a frequency of four times per day, were deployed at EN2, EN10, DB2 and SN3. Fluxes of NO were only measured by automatic dynamic (open) chambers. Measured fluxes were scaled up to yearly values by linear interpolation or using the arithmetic mean of all flux measurements. There may be considerable uncertainty in the annual flux if gap-filling is based on linear interpolation between discrete values, when flux measurements are made manually and are therefore discontinuous and infrequent (Parkin, 2008). This is due to the episodic nature and log-normal distribution of NO and N2O emissions, observed particularly in fertilized croplands and grasslands. However, this episodicity is less pronounced in semi-natural ecosystems, or at least the magnitude of the episodic fluxes is generally much smaller than in fertilized agro-systems (Barton et al., 2015). The uncertainty in annual emissions estimated in our study from manual chamber measurements is related to the observation frequency (fortnightly or monthly) and is likely larger than in the case of automatic (continuous) chamber measurements.
Direct in situ Nr and non-CO2 GHG gas flux measurements were unavailable at many sites. These soil N2O and NO (and also CH4) fluxes were therefore also estimated, as part of NEU, from empirical temperature and moisture responses of soils. These responses were established in a series of factorial soil incubation experiments in controlled conditions with four levels of temperature (5–20 ∘C) and water-filled pore space (20–80 WFPS %), following the protocol described in Schaufler et al. (2010). Twenty-four undisturbed soil cores (top 5 cm of the mineral soil, Ah horizon) were taken from each of 27 forests and eight semi-natural sites in spring after soils had warmed up above 8 ∘C for 1 week in order to guarantee phenological comparability of the different climatic zones. Sampling was conducted in 2008, 2009 and 2010, and cores were sent to a common laboratory at the Federal Research and Training Centre for Forests (BFW, Vienna, Austria) for the controlled environment bioassays, which were carried out straight away. The 5 cm topsoil layer was selected as it represents the highest microbial activity and correspondingly high GHG production/consumption rates, although processes in deeper soil layers should not be neglected (Schaufler et al., 2010). Site-specific, empirical bivariate (temperature, WFPS) relationships describing soil fluxes for CO2, N2O, NO and CH4 were derived from the incubation results and then applied to multi-annual time series of soil temperature and moisture measured at the sites, mimicking field conditions and providing scaled-up estimates of potential annual trace gas emissions.
Leaching of dissolved inorganic nitrogen (DIN = ) was measured using lysimeter setups, or estimated from a combination of suction cup measurements (typically ∼1 m soil depth) and a hydrological drainage model, at a few sites during the NEU monitoring period (EN2, EN4, EN10, EN15, EN16, DB1, DB2) and as part of parallel projects (EN8, DB4). One-dimensional (1-D) drainage models were based on the soil water balance equation using evapotranspiration, observed precipitation and changes in soil water content (Kindler et al., 2011; Gielen et al., 2011). For the forest sites where no leaching measurements were available, the empirical algorithm by Dise et al. (2009) was applied to predict DIN leaching based on key variables (throughfall inorganic Nr deposition DINTF, organic horizon C∕N ratios, MAT). The algorithm, developed from the extensive Indicators of Forest Ecosystem Functioning (IFEF) database (> 300 European forest sites), simulates the non-linearity of DIN leaching with respect to DINTF and soil C∕N ratio, with critical thresholds for the onset of leaching of DINTF=0.8 g N m−2 yr−1 and C∕N = 23, respectively. Since the algorithm requires DINTF as input, as opposed to total (above canopy) Ndep, in the present study we applied a reduction factor of 0.85 from Ndep to DINTF (i.e. a canopy retention of 15 % of atmospheric N), which was calculated as the average of all available individual DINTF ∕ Ndep ratios in the IFEF database. A comparison with values of DINTF ∕ Ndep ratios actually measured at the EN2, EN8, EN10, EN16 and DB2 sites (0.71, 0.80, 0.29, 0.85 and 1.11, respectively; mean ± SD 0.75±0.30) shows that the applied ratio of 0.85 is plausible but also that much variability in canopy retention/leaching may be expected between sites.
2.3 Carbon fluxes
2.3.1 Ecosystem–atmosphere CO2 exchange
Half-hourly rates of net ecosystem–atmosphere CO2 exchange (NEE) were measured over several years (on average 5 years; see Table S6) by the eddy covariance (EC) technique at all sites. The long-term net ecosystem productivity is defined following Chapin et al. (2006) as the difference between gross primary production (GPP) and ecosystem respiration (Reco) and is thus calculated as the straightforward annual sum of NEE fluxes (with opposite sign). The net ecosystem carbon balance may differ from the NEP if C fluxes other than assimilation and respiration, such as DIC/DOC leaching, CH4 and other volatile organic compound (VOC) emissions, as well as lateral fluxes (harvest, thinning) and other disturbances (fire), are significant over the long term (Chapin et al., 2006). For convenience in this paper, we use the following sign convention for CO2 fluxes: GPP and Reco are both positive, while NEP is positive for a net sink (a C gain from an ecosystem perspective) and negative for a net source. Previous studies have normalized C flux data through the carbon use efficiency (CUE), commonly defined from a plant's perspective as the ratio of net to gross primary productivity (NPP ∕ GPP), or the biomass production efficiency (BPE = BP ∕ GPP; Vicca et al., 2012), which is a CUE proxy. By analogy, we define here an ecosystem-scale, medium-term indicator of carbon sequestration efficiency (CSE) as the NEP ∕ GPP ratio, calculated from measurable fluxes over the CEIP/NEU project observation periods.
The EC technique is based on fast-response (sampling rates typically 10–20 Hz) open-path or closed-path infrared gas analyser (IRGA) measurements of turbulent fluctuations in CO2 concentration (c) in the surface layer above the ecosystem, coupled with ultrasonic anemometer measurements of the three components of wind (u, v, w) and temperature. The NEE flux is calculated as the average product of c and w fluctuations, i.e. the covariance (Swinbank, 1951; Lee et al., 2004).
The EC-CO2 flux measurements reported here followed the protocols established during the CEIP project, largely based on the EUROFLUX methodology (Aubinet et al., 2000). Briefly, post-processing of the raw high-frequency EC data included typically de-spiking to remove outliers, 2-D rotation of the coordinate system, time lag optimization by maximization of the covariance between CO2 concentration and the vertical component of wind speed (w), and block-averaging over the flux-averaging interval of 30 min. Corrections were applied for various methodological artefacts, including notably (i) flux losses at the different frequencies of flux-carrying eddies, caused e.g. by attenuation/damping in the inlet/tubing system (Ibrom et al., 2007; Fratini et al., 2012), path averaging, sensor separation, analyser response time, and high- and low-pass filtering; (ii) effects of temperature fluctuations and dilution by water vapour on measured fluctuations in concentrations of CO2 (Webb–Pearman–Leuning corrections; Webb et al., 1980); and (iii) CO2 storage below sensor height. Quality assurance and quality control procedures were further developed and agreed upon within CEIP, including statistical tests, non-stationarity, integral turbulence characteristics (Foken et al., 2004) and footprint evaluation (Göckede et al., 2008). Friction velocity (u∗) threshold filtering was implemented using the moving point test according to Papale et al. (2006) and as described in REddyProc (2019), in order to discard flux data from periods of low turbulence.
Different EC post-processing software was used at the different sites within the project, such that the data were not evaluated in exactly the same way across the CEIP network, but a reasonably good overall agreement was found among the different software, within 5 %–10 % difference for 30 min CO2 flux values (Mauder et al., 2008; Mammarella et al., 2016). Similarly, for the gap-filling of the 30 min flux time series, during periods of instrument malfunction or unsuitable measurement conditions (low turbulence, insufficient fetch, etc.), and for the partitioning of NEP into GPP and Reco, a number of alternative algorithms have been developed in the past, based on different sets of principles (Falge et al., 2001; Barr et al., 2004; Reichstein et al., 2005; Lasslop et al., 2010). The gap-filling and partitioning algorithm used by default in this study was the generic online REddyProc (2019) software, implemented also in the European Fluxes Database Cluster. REddyProc was based on (i) Reichstein et al. (2005) for the filling of gaps in the NEE flux data on the basis of information from environmental conditions, (ii) Reichstein et al. (2005) for the night-time-data-based Reco parameterization (using an Arrhenius-type function of temperature), and (iii) on Lasslop et al. (2010) for the daytime-data-based GPP evaluation (using a rectangular hyperbolic light response curve for NEE and including a temperature sensitivity of respiration and limitation of GPP by vapour pressure deficit).
In this study, for all CEIP flux sites, we have retrieved the fully analysed and validated half-hourly (level-3) and daily to annual (level-4) CO2 flux (NEP, GPP, Reco) data as available, initially from the CEIP database and later from the European Fluxes Database Cluster (2012) or from the GHG-Europe portal (GHG-Europe, 2012). For these data, although the evaluation methods were not necessarily harmonized between sites, we hold that the data available in the database were obtained using the best possible, state-of-the-art evaluation methods at the time of retrieval. For the four non-CEIP flux sites, flux evaluation closely followed CEIP protocols; in the case of DB4 the EddyPro (v6.2) software was used, which was based on a synthesis of calculation and correction methods from CEIP and other FLUXNET flux networks around the globe.
The EC-CO2 flux measurements used in this study mostly spanned the 5-year period of CEIP (2004–2008), except for a dozen sites where measurements continued until 2010, i.e. the end of NEU and of atmospheric Nr sampling. Older EC data (since the mid-late 1990s) were also available at DB5, EN6 and EN13. Data collection started and ended later at DB4, at which both EC-CO2 flux and DELTA-Nr measurements spanned the 7-year period 2009–2015. Data analyses presented in the paper, based on inter-annual mean CO2 budgets and mean Nr deposition, assume that five or more years of monitoring yield reasonably robust estimates of long-term fluxes for the different sites and that the small time shift between the CEIP and NEU project periods (2–3 year overlap) does not affect the results significantly. At some sites, such as DB2, long-term NEE measurements showed multi-decadal variations (Pilegaard et al., 2011; Wu et al., 2013); thus it was essential to use the years overlapping with NEU.
2.3.2 Soil CO2 and CH4 fluxes
In situ soil CO2 efflux (SCE) measurements by opaque (static or dynamic) manual chambers were carried out at 25 of the forest sites, with typically weekly to monthly sampling frequency, with fluxes being measured continuously (hourly) by automated chambers at a few sites (e.g. EN2). The SCE is usually considered a proxy for CO2 production by soil respiration (Rsoil), though the two may not be equal as part of the CO2 production is dissolved into pore water and may reach the atmosphere only later, either on-site or even off-site if dissolved CO2 (DIC) leaches to groundwater. Annual Rsoil data, scaled up from SCE measurements, are available for 19 forest sites and were collected from the CEIP or GHG-Europe databases and/or from various peer-reviewed publications for the different sites (see Table S7). The ratio of heterotrophic respiration (Rhet) to Rsoil was determined on an annual scale at 16 sites by different techniques (root-exclusion meshes, trenching experiments, radiocarbon or stable isotope tracing, tree girdling; e.g. Subke et al., 2006) (Table S7).
Methane fluxes were measured by chamber methods or eddy covariance at six forest sites and five semi-natural (peatland, wetland) sites (Hendriks et al., 2007; Skiba et al., 2009; Drewer et al., 2010; Shvaleva et al., 2011; Luo et al., 2012; Kowalska et al., 2013; Juszczak and Augustin, 2013) (Table S6). These data were complemented by bioassay measurements of CH4 emission or uptake (net oxidation) by the laboratory soil cores, as described previously for NO and N2O estimates (Schauffler et al., 2010).
2.3.3 Dissolved carbon losses
Dissolved inorganic (excluding CO2 from weathering of carbonate rocks) and organic carbon (DIC/DOC) fluxes were measured at six forest sites (DB1, DB2, EN4, EN8, EN10, EN15), using suction cups for sampling soil water and combined with soil drainage data, or by monitoring water runoff through weirs, as part of CEIP, NEU and other projects (Ilvesniemi et al., 2009; Kindler et al., 2011; Gielen et al., 2011; Verstraeten et al., 2014). Data were also available for peatland at SN7, with DIC, DOC and also dissolved CH4 concentrations in pore water of the clayey peat, in groundwater from the sand aquifer and in ditch water, as described in Hendriks et al. (2007). For the peatland within SN9, Dinsmore et al. (2010) measured stream concentrations and export of DIC, DOC and particulate organic carbon (POC), and they also estimated stream evasion of CO2, CH4 and N2O in addition to the land-based flux (EC, chamber) measurements in the tower footprint.
2.4 Ecosystem greenhouse gas balance
Net GHG budgets were constructed from inter-annual mean EC-based NEP combined with measured and scaled-up N2O and CH4 fluxes wherever available (nine and six sites, respectively), or with bioassay-derived fluxes (most sites) or modelled data (BASFOR, forests/N2O only), using 100-year global warming potentials (GWPs) of 265 and 28 for N2O and CH4, respectively (Fifth Assessment Report, IPCC, 2013). The sign convention for non-CO2 GHG fluxes and for the net ecosystem GHG balance in this paper adopts an atmospheric warming perspective, i.e. positive fluxes for emissions toward the atmosphere (warming) and negative for uptake by the surface (cooling).
2.5 Ancillary soil, plant and ecosystem measurements
Ancillary data were collected mainly for the purpose of assembling input parameters and calibration datasets for forest ecosystem (BASFOR) modelling (see below). Texture (% clay, % sand, % silt), pH, soil organic carbon (SOC) concentration and C∕N ratios were measured in soils of 35 sites as part of the bioassay experiments described previously but were otherwise also documented in the CEIP database and in papers previously published for the majority of sites (Table S1). For the forest sites, ecosystem data for soil water content (SWC), porosity, saturation water content (ΦSAT), field capacity (ΦFC) and wilting point (ΦWP), as well as for canopy height (H), leaf area index (LAI), diameter at breast height (DBH), basal area (BA), number of trees per unit area or stand density (SD) and thinning events, were obtained from CEIP and other project (e.g. FLUXNET) databases and complemented by various publications (Tables S2–S5). Such was also the case for ecosystem carbon stocks in soil organic matter (CSOM) and in roots (CR), stems (CS), branches (CB), leaves (CL) and litter layers (CLITT), for which the global database assembled by Luyssaert et al. (2007) provided additional data. At sites for which published values of ΦFC and ΦWP were not available, default estimates were inferred from soil texture by means of van Genuchten (1980) pedo-transfer functions, using tabulated values from the German soil description handbook (Eckelmann et al., 2005)
Foliar C and N contents (LeafC, LeafN) were measured as part of NEU for EN1, EN2, EN5, EN8, EN10, EN15, EN16, DB2 (Wang et al., 2013), DB4, SN3, SN4, SN8, and SN9 or were otherwise taken from CEIP, GHG-Europe and FLUXNET databases as well as various publications; in total, leaf C∕N measurements were available for 31 sites. By contrast, data were much rarer for C∕N ratios for other compartments of the forest ecosystem, with data available at only 15 sites for litter and at only five sites for roots, stems and branches.
2.6 Modelling of C and N fluxes and pools by the BASFOR ecosystem model
The BASic FORest model (BASFOR) is a deterministic forest ecosystem model that simulates the growth (from planting or natural regeneration) and the biogeochemistry of temperate deciduous and coniferous even-aged stands (van Oijen et al., 2005; Cameron et al., 2013). A description of the model and the fortran code are available in BASFOR (2016). The model was calibrated through a multiple site Bayesian calibration (BC) procedure, applied to three groups of plant functional types (DBF, EN-spruce, EN-pine), based on flux and pool data from the CEIP/NEU databases (Cameron et al., 2018). Details on model implementation as part of this study are provided in Flechard et al. (2020).
Briefly, the C, N and water cycles are simulated at a daily time step in interaction with the soil and climate environments and constrained by management (pruning and thinning). Carbon and nitrogen pools are simulated in the different ecosystem compartments (tree stems, branches, leaves and roots, litter layers, and SOM with fast and slow turnover), which are interconnected by internal flows and transformations (e.g. SOM mineralization, nitrogen retranslocation). Carbon, nitrogen and water enter the ecosystem from the atmosphere (photosynthesis, Nr deposition, rainfall). Inorganic nitrogen is taken up from the soil by tree roots; C and N return to the litter and soil pools upon senescence of leaves, branches and roots, and also when trees are pruned or thinned. Losses of C occur through autotrophic (root and shoot) respiration and microbial decomposition into CO2 of litter and SOM (heterotrophic respiration); losses of N occur through nitrate leaching below the root zone and soil emissions to the atmosphere of NO and N2O. The water balance is constrained by incoming rainfall, soil water holding capacity and evapotranspiration (ET) simulated by the Penman equation.
3.1 Nitrogen inputs and outputs
3.1.1 Nitrogen deposition
Total inorganic Nr deposition ranged from 0.1 to 4.3 g N m−2 yr−1 across the CEIP/NEU networks (Table 1), with the largest values observed in the Netherlands, northern Belgium, and southern Germany and the lowest levels observed at latitudes > 60∘ N (Fennoscandia). Nitrogen deposition was dominated by the dry fraction in forests (Fig. 2), with an average contribution to total deposition of 63 % versus 39 % for short semi-natural vegetation. This contribution was even larger (> 2∕3) for high-deposition sites (Ndep > 2 g N m−2 yr−1). Total Ndep was more strongly correlated to dry deposition across all sites (R2=0.94) than to wet deposition (R2=0.56). Important differences in the ratio of dry to wet deposition are evident across climatic regions, with the share of dry deposition being especially large at Mediterranean sites (e.g. Sanz et al., 2002), where annual rainfall is smaller. However, the share of dry deposition was also large for sites that are located near (large) anthropogenic (industrial, vehicular, agricultural) Nr emission sources. Total Nr deposition was around 25 % smaller on average at short semi-natural vegetation sites compared with forests (Fig. S2), even though the mean total atmospheric Nr concentrations (reduced and oxidized, N-containing gas and aerosol compounds) were quite similar between the two datasets (Flechard et al., 2011). The difference was driven by higher dry deposition rates over forests due to higher aerodynamic roughness and deposition velocities (Fig. S3; see also Schwede et al., 2018). Reduced Nr (NH3 gas and in aerosol and rain, collectively NHx) contributed on average 56 % of total deposition; oxidized Nr (HNO3+NO2 gas and in aerosol and rain, collectively NOy) was dominant at only six forest sites of the network (EN7, EN10, EN18, EB2, SN3, SN5; Fig. 2).
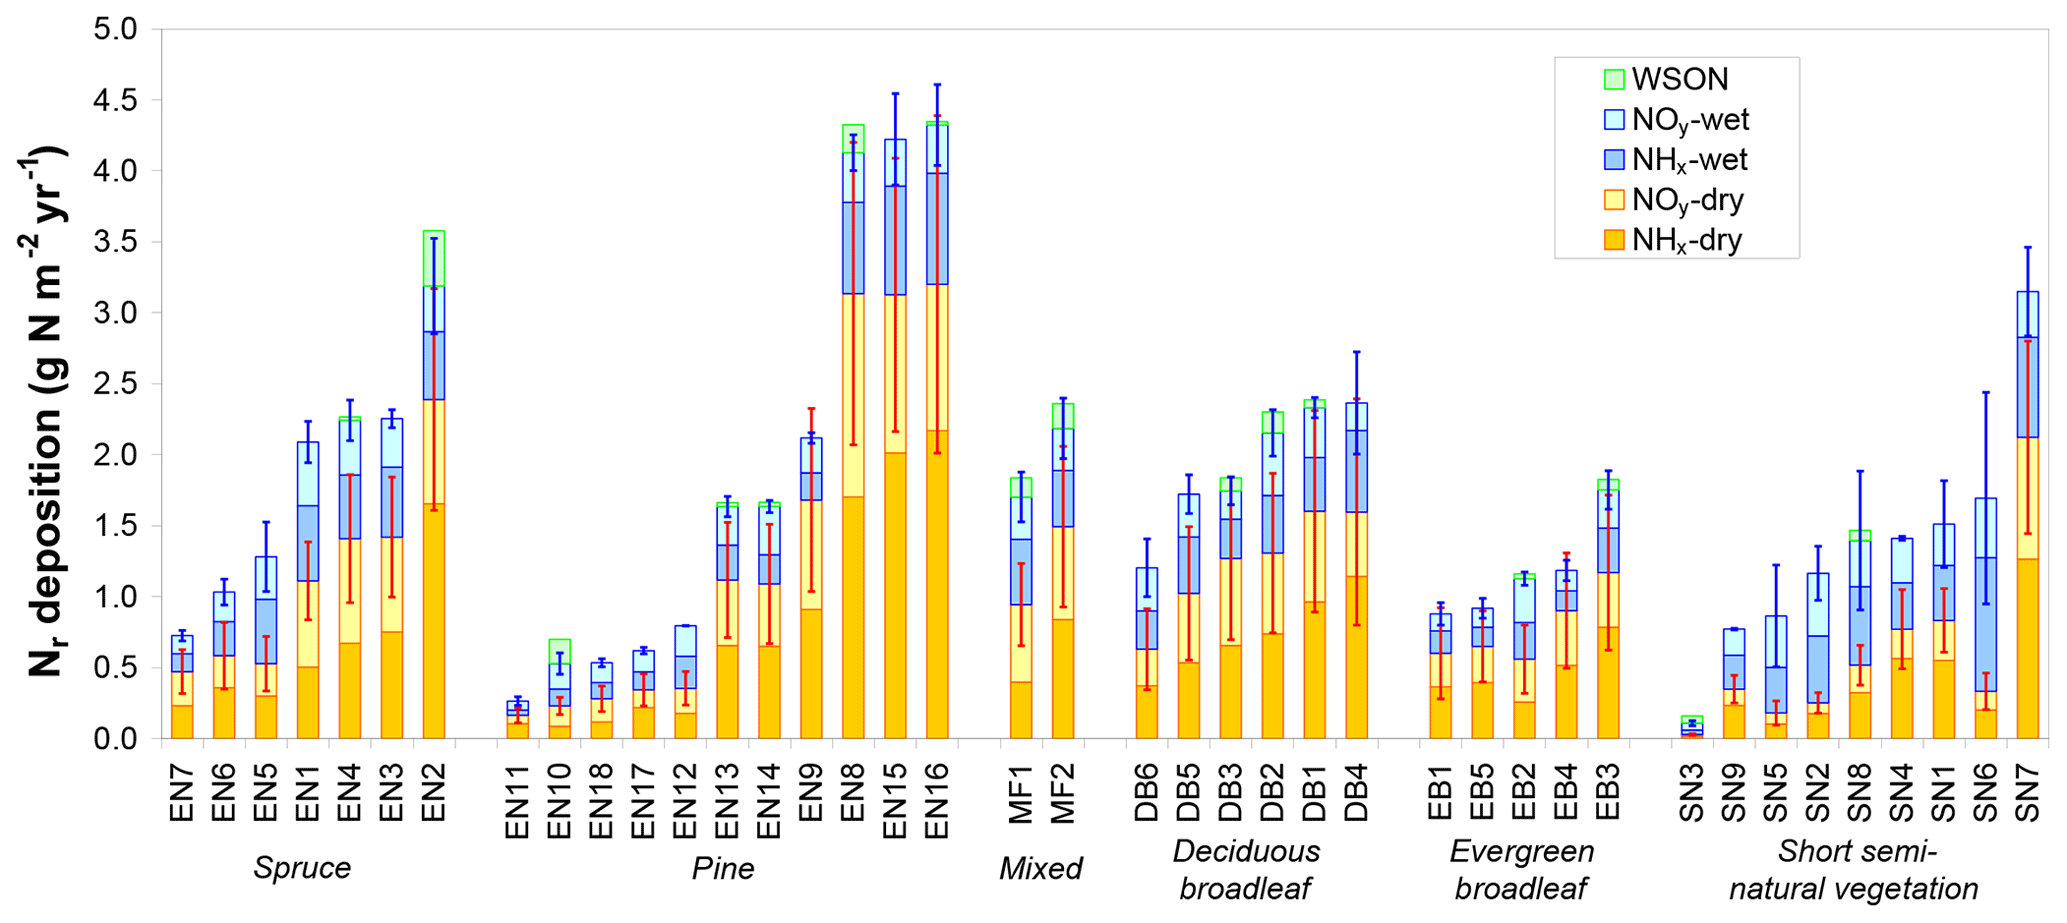
Figure 2Total reactive nitrogen deposition (Ndep) and breakdown into inorganic wet and dry, oxidized (NOy) and reduced (NHx) deposition estimates at the 31 forest sites (evergreen needleleaf EN1-7 (spruce), EN8-18 (pine), mixed – MF, deciduous broadleaf – DB, evergreen broadleaf – EB) and at nine short semi-natural (SN) vegetation sites of the NitroEurope monitoring network. Data are arithmetic means over the years 2007–2010 of (i) inferential dry deposition estimates by four different models based on in situ atmospheric Nr measurements and of (ii) different wet deposition estimates from precipitation monitoring datasets and from European-scale atmospheric chemistry and transport modelling (EMEP). Error bars indicate standard deviations of the four dry deposition models (red bars) and standard deviations of the different data sources for inorganic Nr wet deposition (blue bars). Wet deposition of water-soluble organic nitrogen (WSON) was measured at a few selected sites and is shown here for comparison with total inorganic Nr deposition.
For comparison, dry deposition, calculated here as the ensemble average of four inferential model estimates based on in situ Nr concentration measurements, was on average more than a factor of 2 larger than the ca. 50 km × 50 km grid square-averaged EMEP model estimate (taken from EMEP, 2013) (see Fig. S2). However, since each EMEP grid square contains variable proportions of different land uses with different deposition velocities, it is more meaningful to compare DELTA-based inferential estimates for each study site with ecosystem-specific EMEP dry deposition rates in the relevant grid squares. In this case, the EMEP dry deposition rates are on average 32 % smaller than the inferential estimates.
By contrast, wet deposition was generally reasonably consistent between the different data sources for inorganic Nr (in situ bulk or wet-only measurement, kriging of monitoring network data, EMEP model output). For the 18 sites where all three sources of data were available, the mean CV of the three estimates was 21 % (range 2 %–56 %, with 15 CV values out of 18 below 30 %), and the mean (±95 % confidence interval) wet deposition estimates across the 18 sites were 0.63±0.14, 0.64±0.15 and 0.68±0.16 g N m−2 yr−1 for the three methods, respectively (Fig. S2), showing no systematic bias between methods. Wet deposition of organic nitrogen, measured at 16 sites, represented on average 11 % (range 2 %–36 %) of total inorganic + organic wet deposition (Fig. S2), but only 4 % (range 1 %–30 %) of total dry + wet Nr deposition, since total Ndep was dominated by dry deposition at most forest sites.

Figure 3Comparison of measured and estimated ecosystem inorganic Nr losses and their relationships to total atmospheric Nr deposition (x axis) at the forest sites. NO fluxes (a) and N2O fluxes (b) were either (i) measured in situ using static or dynamic flux chambers, (ii) scaled up from laboratory-bioassay-derived T–WFPS relationships, or (iii) simulated using the BASFOR ecosystem model (see text for details). DIN leaching (c) was either measured (lysimeter or suction cups) or predicted from the Dise et al. (2009) empirical algorithm. The sum of inorganic Nr losses (d) (DINleach + NO+ N2O) was computed as the mean of measured values and modelled estimates. In panels (a)–(c), site names are indicated for sites where in situ measurements were available.
3.1.2 Nitrogen losses
Total ecosystem losses of inorganic Nr were computed for the forest sites as the sum of DIN leaching and NO and N2O emissions (Fig. 3a–d). We assumed that NH3 emissions by soil and vegetation were negligible due to generally acidic forest soils, as well as low values of the stomatal compensation point (the leaf NH3 emission potential), respectively (Flechard et al., 2013). Inorganic Nr losses (Fig. 3d) increased sharply with Nr deposition and were largely dominated by DIN leaching at Ndep levels above 2 g N m−2 yr−1 (Fig. 3c). For these large Ndep levels, the fraction of deposited Nr lost as DIN, NO or N2O was generally larger than 50 % (Fig. 3f). The inorganic Nr balance (Nr deposition minus NO, N2O and DIN losses) was probably still positive for most sites (Fig. 3e), although the confidence intervals of the budget term (accounting for uncertainties in all terms including deposition) were very large for the elevated Nr deposition sites. Note that the DIN leaching estimate by BASFOR, shown for comparison on Fig. 3c, was not used in the calculation of total inorganic N losses in Fig. 3d; this is because BASFOR does not simulate N2 loss by denitrification, and thus part of the soil N surplus that would in reality denitrify is assumed to drain, resulting in an overestimation of the leaching term, though not necessarily of the total N losses.
Emissions of NO estimated from bioassay measurements (Schaufler et al., 2010) and by BASFOR modelling were generally of the same order in forests (average values across all forest sites of 0.22 and 0.21 g N m−2 yr−1, respectively), but validation by in situ chamber flux data was difficult owing to the limited number of available measurements (only five forest sites, mean value 0.27 g N m−2 yr−1). Nonetheless, the largest NO emissions by the three methods were all found at Ndep levels above 2 g N m−2 yr−1 (Fig. 3a). By contrast, N2O emissions did not show any marked dependence on Ndep and were on average smaller than NO emissions by a factor of 2 to 5, with mean values across all sites of 0.12, 0.08 and 0.04 g N m−2 yr−1 for bioassay, BASFOR and chamber fluxes, respectively. The mean N2O fluxes (averaged over the different methods) were larger than mean NO fluxes at only one-third of the forests sites; by contrast, at SN sites N2O emissions were larger than NO emissions at all but one location. The dominance of NO over N2O in forests could in principle reflect the generally well aerated conditions of (especially coniferous) forest litter layers on well-drained topsoils, which are more conducive to NO formation by nitrification than N2O by denitrification (Davidson et al., 2000; Pilegaard et al., 2006). This would be perhaps especially true for the four highest (> 3 g N m−2 yr−1) Nr deposition sites (EN2, EN8, EN15 and EN16, all coniferous forests) with the highest NO emissions (Fig. 3), which all had sand-dominated (64 %–96 %) soil textures (Table S4). On the other hand, given the acidity of many forest topsoils (Table S4), nitrification could be inhibited, but chemodenitrification could produce significant amounts of NO (Pilegaard, 2013).
For a complete ecosystem net N budget, additional measurements of dissolved organic nitrogen (DON) leaching, as well as dinitrogen (N2) fluxes (biological fixation and total denitrification), would be required (Fig. 1), but they were not quantified in most cases. A tentative ballpark estimate of the potential magnitude of denitrification N2 emissions for the DB2 forest site may be calculated by considering the mean N2∕N2O ratio of 74 (±0.85 st. err.), which was measured in He–O2 mixture soil incubation experiments performed on DB2 soil cores (unpublished data). This mean ratio, multiplied by the mean field-measured N2O emission flux of 0.074 g N2O-N m−2 yr−1 (Pilegaard et al., 2006), yields an estimate of the order of 5.5 g N2-N m−2 yr−1. There is considerable uncertainty in this number, since the mean N2∕N2O ratio was calculated from short-term investigations in the laboratory, which may or may not be representative of the prevailing soil and weather conditions in the field. This uncertainty is reinforced by the low sensitivity of the N2 detector, which was a factor of 20–80 lower than that of the N2O detector used in the experiment (Buchen et al., 2019). Another estimate of forest soil denitrification loss obtained through a soil core incubation method was given by Butterbach-Bahl et al. (2002) for the EN2 spruce site, with an annual N2 emission flux of 0.72 g N2-N m−2 yr−1 and a mean N2/N2O ratio of 7. The N2 emissions thus estimated suggest that total denitrification may be a very significant term in the total N budget of forests, possibly of the same order as atmospheric Nr deposition.
Measurements of DON leaching were available at very few sites but proved to be significant. At the pine forest site of EN8, DON leaching was of the order of 0.3 g N m−2 yr−1, i.e. a factor of 3 lower than DIN losses (Verstraeten et al., 2014). At the beech forest site of DB2, DIN and DON leaching were of the same order (0.07–0.08 g N m−2 yr−1), but both were very small in comparison to Ndep (2.15 g N m−2 yr−1), while at the pine forest site of EN10 the leaching/runoff Nr loss was actually dominated by DON (0.012 g N m−2 yr−1), which was around an order of magnitude larger than DIN leaching (Korhonen et al., 2013) and a factor of 4 smaller than Ndep.
3.2 Net carbon and greenhouse gas balance
3.2.1 Spatial variability of the carbon sink in relation to climate and nitrogen deposition
The ultimate objective of the project was to quantify the response of C sequestration to atmospheric Nr deposition (addressed in Flechard et al., 2020), but this is not straightforward. We follow first in this paper a descriptive approach, whereby variations of C fluxes and other productivity indicators (e.g. leaf area index and N content) are examined graphically as a function of Ndep (Fig. 4). However, this is done with the strong reservation that a simple empirical relationship does not necessarily prove causality, as other confounding and co-varying factors, e.g. climate, soil and age may exist. Figures 4–5 show for example that the large inter-site differences in MAT and MAP at the European scale also need to be considered, beside the variability in Ndep. Note that in assessing the variability of ecosystem carbon sink strength within the network, we use EC-derived NEP (the long-term NEE sum) as a proxy for the net ecosystem carbon balance, because estimates of DIC/DOC leaching, CH4 emissions and other C loss processes were not systematically measured at all sites.

Figure 4Overview of inter-annual mean EC-derived C flux estimates (GPP, Reco and NEP), ecosystem LAI and leaf N content, in relation to total (dry + wet) atmospheric Nr deposition (a–e), and relationship of Reco to GPP (f), for forests (filled circles, black labels) and short semi-natural vegetation (filled stars, magenta labels). In all plots, the colour scale indicates mean annual temperature (MAT), while the symbol size is proportional to mean annual precipitation (MAP, scale provided in panel a).
Inter-annual mean NEP ranged from a small net source of −70 g C m−2 yr−1 (EN6, a waterlogged peat-based spruce stand in the southern Russian taiga) to a large net sink of +826 g C m−2 yr−1 (EN5, upland spruce forest in northern Italy) (Table 1, Fig. 4c); GPP ranged from 377 g C m−2 yr−1 (SN3, a boreal peatland site with the lowest MAT = −0.6 ∘C) to 2256 g C m−2 yr−1 (EN14, a pine stand in Italy, one of the warmest sites with MAT of 14.9 ∘C and non-limiting rainfall with MAP = 920 mm) (Fig. 4a). Ecosystem respiration peaked at 1767 g C m−2 yr−1 at EN4 (upland spruce forest in eastern Germany) and was lowest at 345 g C m−2 yr−1 at SN3 (boreal peatland), the coldest site (Fig. 4b); Reco was strongly and positively related to GPP (Fig. 4f) (R2=0.62, slope = 0.64). The resulting carbon sequestration efficiency values based on the ratio of observed NEP ∕ GPP (CSEobs) varied widely among observation sites, ranging from −9 % to 61 %, with an average of 25 %.
The data show a positive correlation between GPP and Ndep in the range 0–2.5 g N m−2 yr−1 (R2=0.55, p<0.01). By contrast the five sites with Ndep > 2.5 g N m−2 yr−1 tend to show visually an inverse relationship (Fig. 4a), despite the fact that they lie in comparatively favourable climates. Similar patterns are observed for Reco and NEP (Fig. 4b–c), but with much larger scatter and lower R2 (0.24, p<0.01, and 0.30, p<0.01, respectively, for the Ndep range 0–2.5 g N m−2 yr−1), with the same apparent decline for higher-deposition sites. However, a closer inspection of Fig. 4a–c reveals a potential cross-correlation with climate (see also Fig. S4): (i) the lower end of the Ndep range, coinciding with the lowest GPP, Reco and NEP, also coincides with the lowest MAT and MAP (e.g. Finnish sites); and (ii) the sites in the intermediate Ndep range (1.5–2.5 g N m−2 yr−1), coinciding mostly with the largest observed GPP values (> 1500 g C m−2 yr−1), were on average 1.8 ∘C warmer (10.2 vs. 8.4 ∘C) and 89 mm yr−1 wetter (887 vs. 798 mm) than the sites in the lower Ndep range (0-1.5 g N m−2 yr−1).
Other proxies of the ecosystem C and N cycles and productivity, such as the LAI (defined as one-sided for broadleaf, or half of the total for needleleaf; Table 1 and Fig. 4d) and the foliar N content (LeafN, Fig. 4e), also showed positive relationships to Ndep (see below for differences between vegetation types). The inter-annual mean value of the annual maximum leaf area index (LAImax) increased from around 1 to 7 m2 m−2 for Ndep increasing from 0.1 to 4.5 g N m−2 yr−1, with the lower half of the LAImax distribution (< 4.5 m2 m−2) mostly occurring at boreal, Mediterranean, and upland sites and thus under temperature and/or water limitations.
Clearly, therefore, the continental-scale variability in ecosystem–atmosphere CO2 fluxes was to a large extent controlled by climate, namely by limitations in temperature and water availability. Gross ecosystem productivity was limited, as expected, by low temperatures at high latitudes (or high elevations) and by low rainfall and/or high evaporative demand at Mediterranean, boreal and continental sites. The distribution of the forest monitoring sites in the European climate space, with MAP and MAT on the x and y axes, respectively (Fig. 5a–b), shows that for sites with MAT > 7 ∘C there was a broad negative correlation between MAT and MAP (, p=0.01); i.e. the warmest sites in southern Europe tend to be the driest and therefore potentially water-limited. Maximum GPP (and also Reco, not shown) occurred in the mid-climate range, around 9–15 ∘C MAT and around 700–1000 mm MAP. Similarly, the larger Ndep values (> 2 g N m−2 yr−1) occurred almost exclusively at sites with MAT in the narrow range of 6–11 ∘C, and although these large Ndep values were found in a broad MAP range (550–1200 mm), they peaked sharply around 800–900 mm MAP (Figs. 5a; S4). Modelled Ndep values from the EMEP CTM (Fig. 5c–d) show that this is a generic pattern at the European scale.
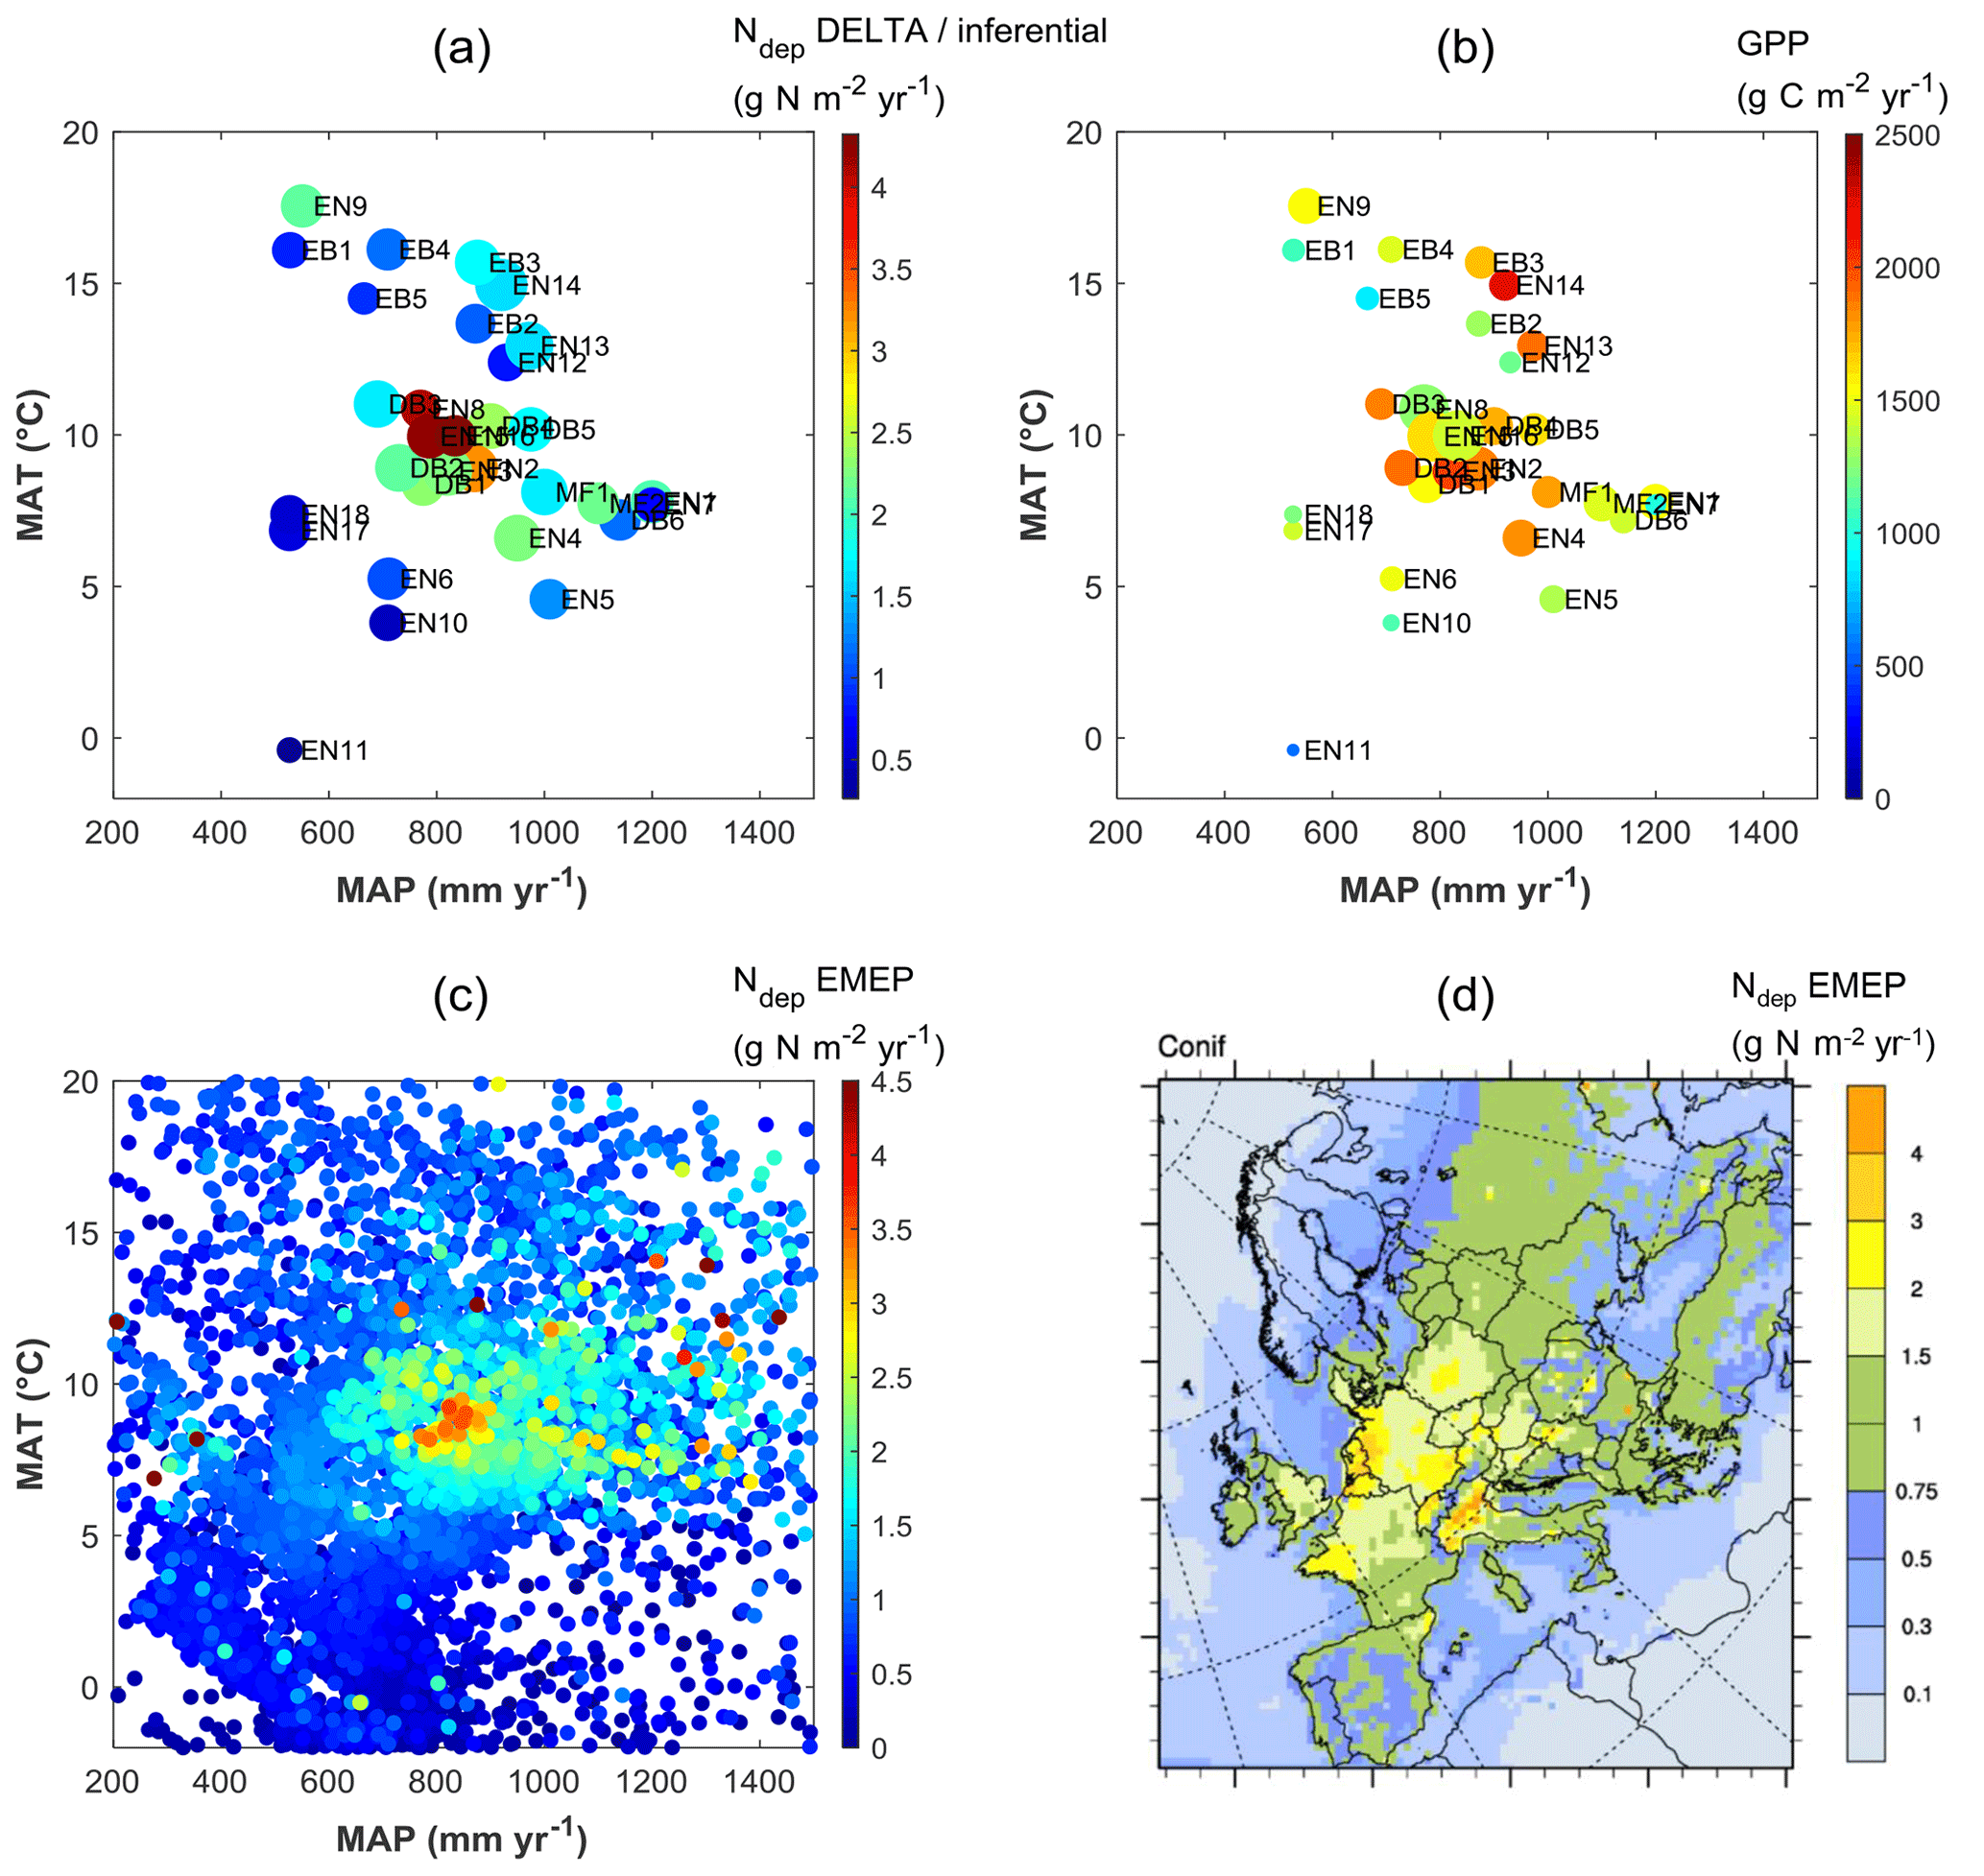
Figure 5Distribution of observation-based nitrogen deposition (Ndep) (a) and gross primary productivity (GPP) (b) for the forest sites of this study, within the European climate space represented by mean annual temperature (MAT) and precipitation (MAP). In plot (a) the symbol colour indicates Ndep, while the symbol size is proportional to GPP; in plot (b) the symbol colour indicates GPP, while the symbol size is proportional to Ndep. Plot (c) shows modelled Ndep from the EMEP model over coniferous forests (year 2010), represented in climate space (one data point for each grid square of the EMEP domain containing coniferous forests), also shown as a map (d). The MAT axis can be seen as a proxy for latitude and/or elevation, while the MAP axis expresses to some extent longitude (distance to the ocean) and/or orographic precipitation enhancement.
Ecosystem DIC + DOC losses estimated by Kindler et al. (2011) for four forest sites of this study (DB1, DB2, EN4, EN15) were on average 13±7 g C m−2 yr−1 (range 3–35 g C m−2 yr−1), with contributions by DIC to total (DIC + DOC) losses varying between 18 % and 83 %. By contrast, Gielen et al. (2011) estimated DOC leaching losses of 10±2 g C m−2 yr−1 for the EN8 pine stand on an acidic sandy soil, in which DIC concentrations in soil water were negligibly small. Ilvesniemi et al. (2009) found DOC losses in runoff at EN10 of 0.8 g C m−2 yr−1, which was negligible compared with NEP. These leaching or runoff losses of DOC and DIC were on average over all forest sites equivalent to a very small mean fraction of 0.6 % of GPP (range 0.1 %–1.9 %) but a more significant fraction of NEP (mean 6 %, range 0.3 %–13 %). At the SN7 peatland site, fluxes of total dissolved carbon (including CH4) through seepage, infiltration and drainage were relatively small by comparison to NEP and to other peat bogs (17 g C m−2 yr−1, only 5 % of NEP) (Hendriks et al., 2007); by contrast, at the SN9 peatland site, net stream C export (including DIC, DOC and POC) was on average 29.1 g C m−2 yr−1 (81 % of which being DOC), equivalent to a mean leached fraction of 37 % of NEP (Dinsmore et al., 2010).
3.2.2 Differences between plant functional types
Forests (F) and short semi-natural (SN) vegetation showed similar relationships with GPP as a function of Nr deposition, increasing with a broadly similar slope at low Ndep values and then levelling off beyond 2g N m−2 yr−1, except for the fact that GPP was lower by typically 200–500 g C m−2 yr−1 in SN compared with F sites, for a given Ndep level (Fig. 4). The behaviour was different for NEP, where the slope against Ndep in the range 0–2 g N m−2 yr−1 was much steeper for F than for SN, which occurred because Reco values are of the same order for F and SN at a given Ndep level. No systematic difference was observed between the forest PFT, based on the available data, in the apparent relationships of the C fluxes vs. Ndep. However, this may be a result of the small number – and large diversity – of deciduous broadleaf (DB) and evergreen broadleaf (EB) forest sites in the dataset, compared with evergreen needleleaf (EN) sites (Table 1).
The relationship of LeafN to Ndep (Fig. 4e) showed three distinct groups, with the smallest values (0.8 %–1.8 % N in dry weight, DW) for evergreen needleleaf and broadleaf (EN, EB) forests being positively correlated to Ndep in the range 0.5–4.3 g N m−2 yr−1 (R2=0.71, p< 0.01). Values for short semi-natural (SN) vegetation were found in an intermediate range (1 %–2.7 % N DW), with a steep and significant relationship to Ndep (R2=0.51, p< 0.05). The largest values occurred for deciduous broadleaf (DB) forests (mostly > 2 % N DW), but with little relationship to Ndep (R2=0.18, not significant). Seasonal variations in forest LeafN could reach a factor of 2, as did differences between tree species within the same forest, which may account for some of the scatter observed in Fig. 4e.
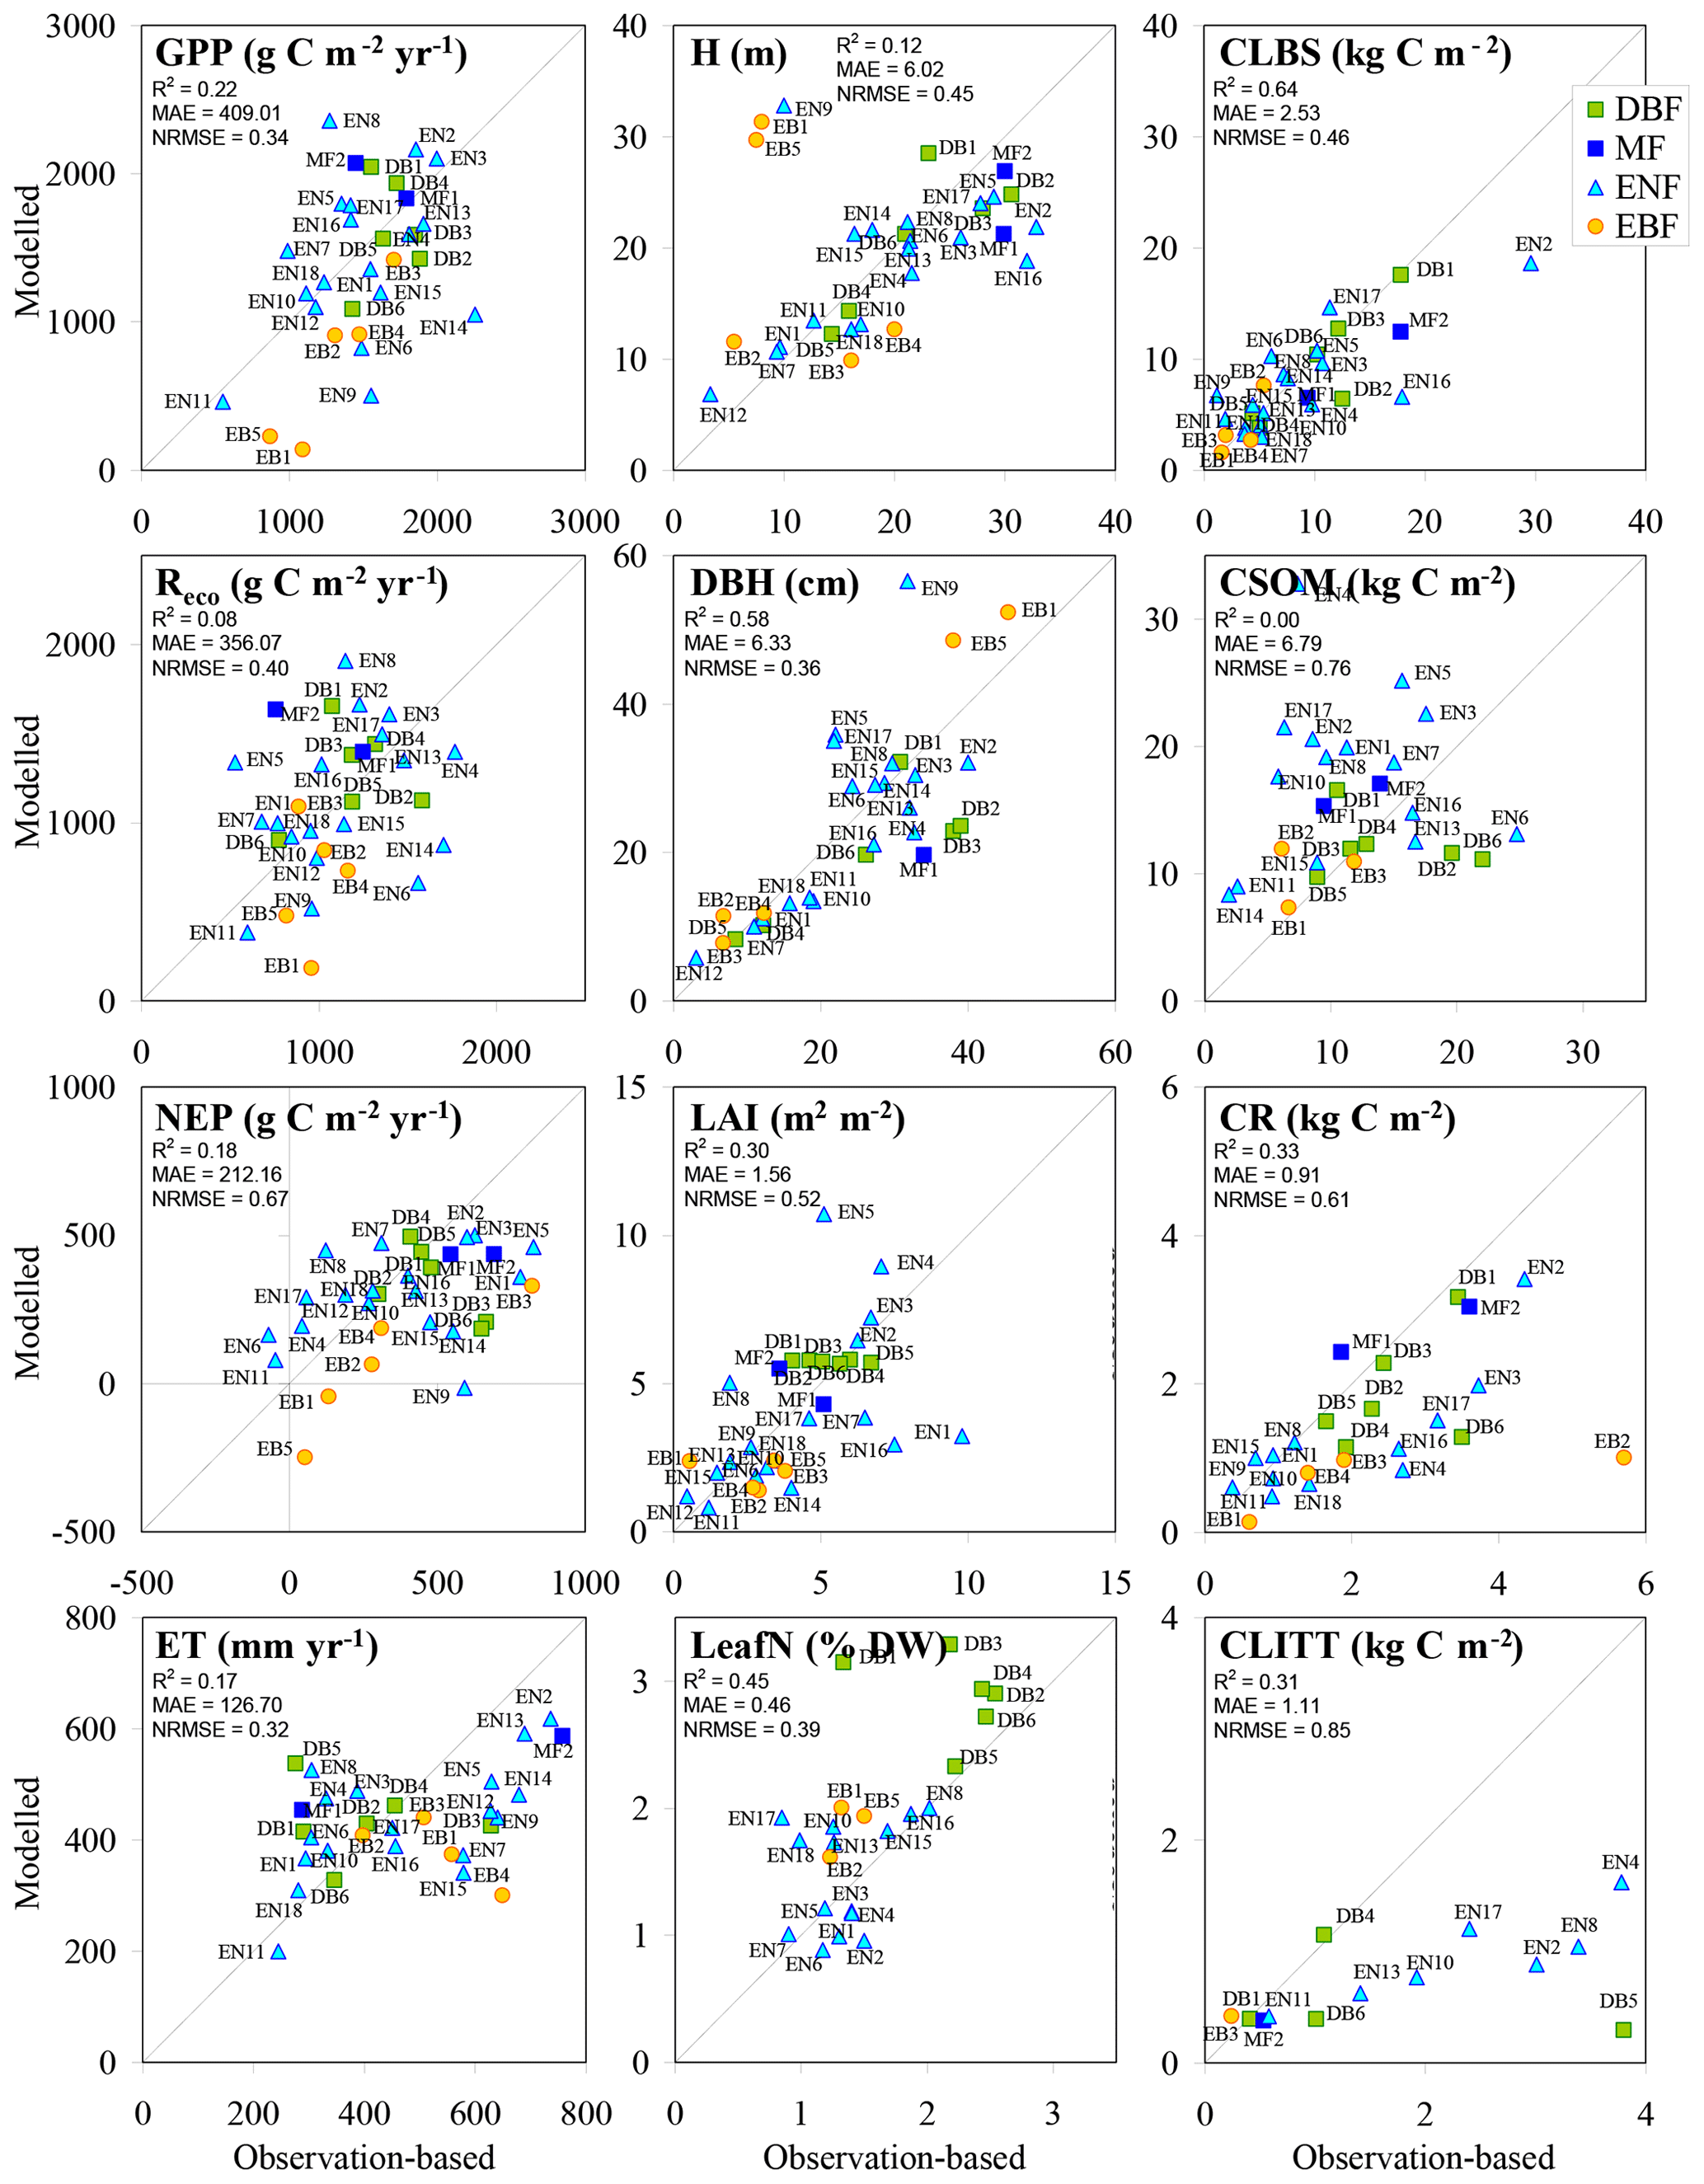
Figure 6BASFOR baseline simulations for all forest sites; model outputs and observation-based values were averaged over the years between the first and last available observations. Note that model simulations include MF and EBF sites, for which the model was not calibrated in Cameron et al. (2018); the two MF runs were made using the parameter table for DBF, while the five EBF runs were made using the parameter table for ENF to allow continued growth throughout the year. H: mean tree height; DBH: mean diameter at breast height; CLBS, CSOM, CR, CLITT: carbon stocks in leaves, branches and stems; in soil organic matter; in roots; and in litter layers, respectively; R2: coefficient of determination; MAE: mean absolute error; NRMSE: root mean square error normalized to the mean.
3.2.3 Carbon fluxes and pools derived from forest ecosystem modelling
In the BASFOR base run (Fig. 6), reasonable overall model performance was achieved for GPP, ecosystem C pools, H, DBH, LAI and LeafN, while more scatter was present for Reco, NEP and ET. In particular, in apparent contrast to GPP, Reco stands out as a more challenging variable to model. Predictably, because BASFOR was calibrated using a subset of 22 sites from this dataset (Cameron et al., 2018), the range and mean values of modelled Reco were close to mean observations by EC across the study sites, but differences between sites were poorly reproduced with much scatter around the 1∕1 line and a low R2. The modelled carbon sequestration efficiency (CSEmod), simulated over the same time period as the flux measurements, was much less variable (range 17 %–31 %, mean 22 %) than observation-based values (CSEobs) (comparison made for the 22 sites used in model calibration). One possible reason was that BASFOR assumed that autotrophic respiration (Raut) is a constant fraction of GPP, which may be an oversimplification (Collalti and Prentice, 2019). Also, heterotrophic respiration (Rhet) appeared to be a much more variable fraction of Reco in reality (Table S7) than was predicted by the model, leading to sizable divergence in the overall modelled Reco. As the direct measurement, NEP was the least uncertain term in EC-derived data, compared with GPP and daytime Reco, which were inferred from measured (half-hourly) EC NEE by empirical partitioning models. By contrast, in BASFOR, NEP was calculated as the residual between two large numbers (GPP and Reco) and thus compounds the uncertainties of both component terms. The modelled result for NEP appeared to be an overestimation of net C uptake at low-productivity sites and an underestimation at high-productivity ones (slope < 1). A broadly similar pattern emerged for ET.
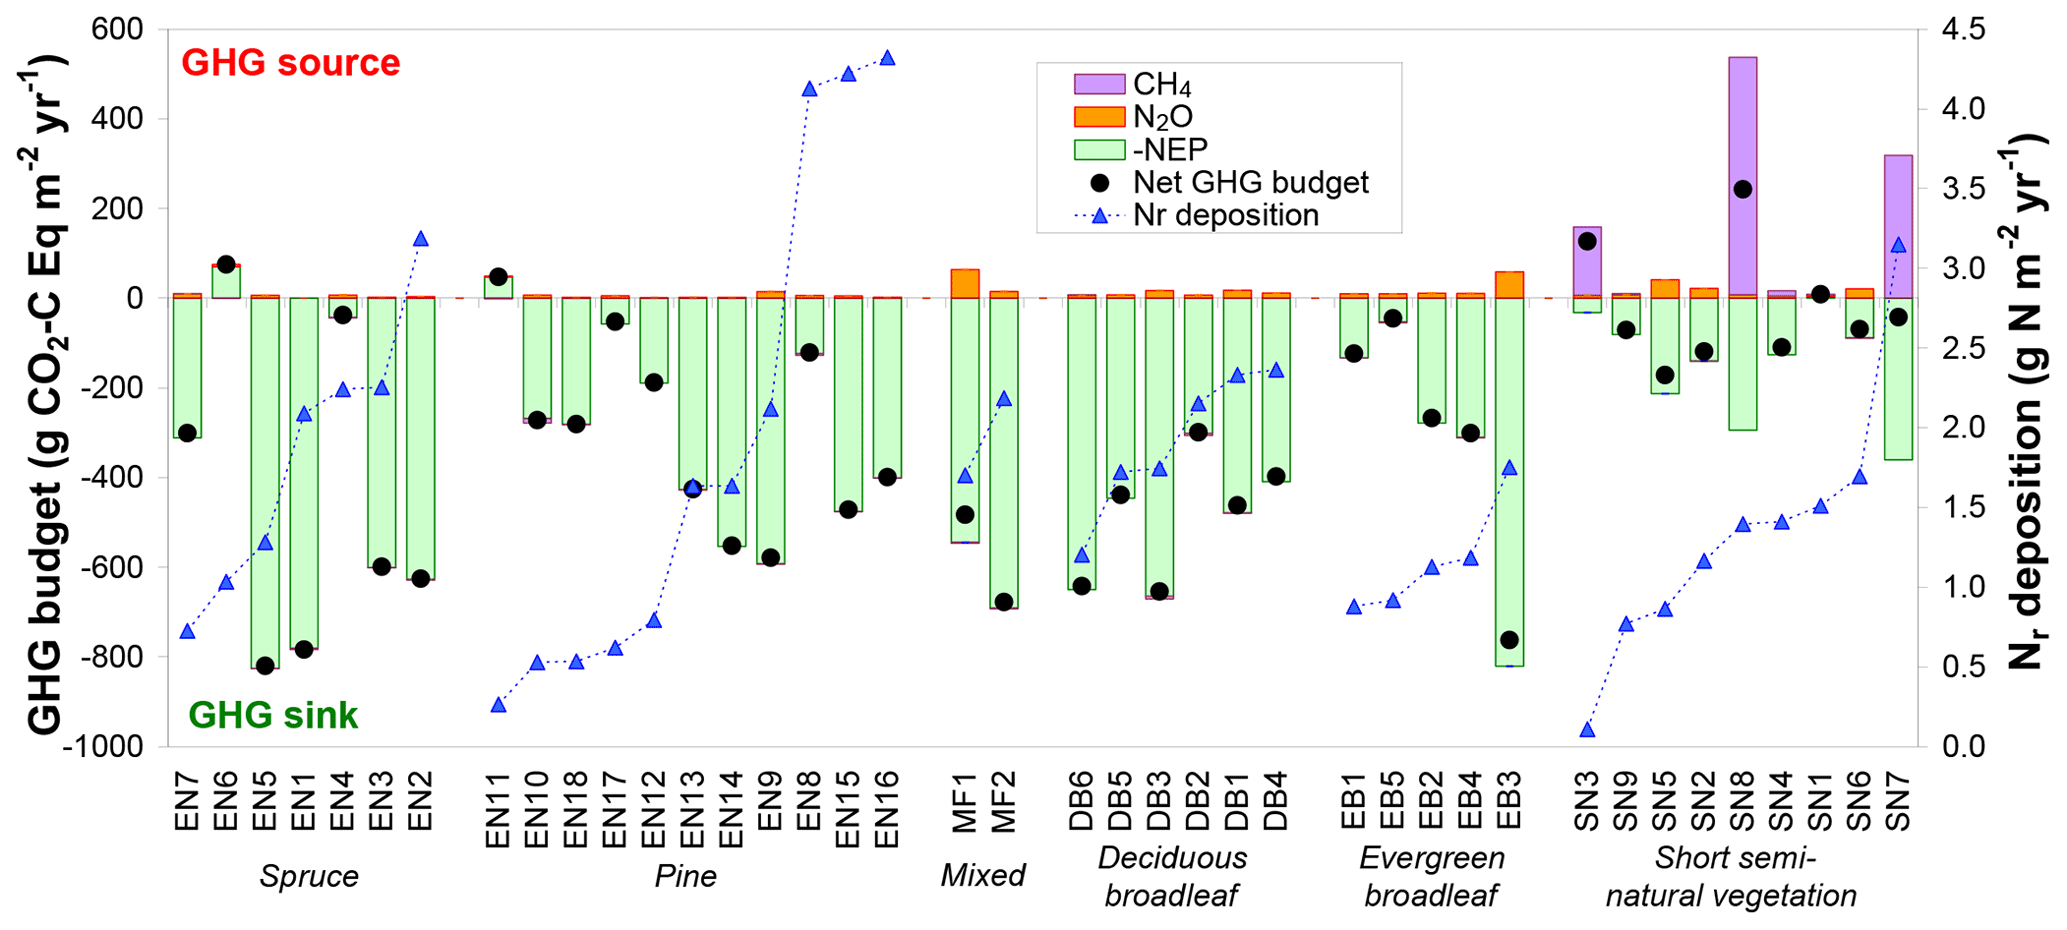
Figure 7Net greenhouse gas (GHG) budgets calculated from a combination of inter-annual mean (around 2005–2010) net ecosystem productivity (NEP) from eddy covariance, and N2O and CH4 flux data measured in situ or estimated by extrapolated bioassay data and forest ecosystem BASFOR modelling. Global warming potential values (100-year time horizon) of 265 and 28 were used for N2O and CH4, respectively; the sign convention is with respect to the atmosphere: negative for a sink and positive for a source. The data were grouped by ecosystem type (evergreen needleleaf: EN-spruce and EN-pine; MF: mixed forests; DB: deciduous broadleaf; EB: evergreen broadleaf; SN: short semi-natural vegetation); within each group the data were sorted by increasing Nr deposition.
3.2.4 Net ecosystem greenhouse gas budgets
Carbon dioxide largely dominated the net GHG budget at all forest sites, with only three sites where either N2O or CH4 GWP-equivalent fluxes were larger than 10 % of NEP in absolute terms (Fig. 7). Most of the forest soils (22 out of 27 sites) investigated in the bioassay experiment behaved as small net sinks for CH4, with a mean (±SE) net oxidation flux of g C m−2 yr−1 (range −0.61 to +0.16 g C m−2 yr−1). The mean CH4 flux measured by soil chambers at the six forest sites where such measurements were available (EN2, EN6, EN10, EN16, DB2, EB5) was also a net oxidation flux of g C m−2 yr−1 (range −1.0 to −0.0 g C m−2 yr−1). For these six sites, there was a significant correlation (R2=0.74, p<0.05) between annual soil CH4 flux estimates derived from the bioassay experiment and from in situ flux measurements (Fig. S5 in Supplement), with the largest net annual soil CH4 uptake flux being observed by both methods at the EN10 pine forest site (Skiba et al., 2009). By contrast, at the elevated Ndep sites EN2 and EN16, the net soil CH4 flux was close to zero, consistent with previous research (e.g. Steudler et al., 1989; Smith et al., 2000) showing that the CH4 oxidation capacity of forest soils in negatively affected by Nr addition or deposition. In terms of C uptake, soil CH4 oxidation was negligible compared to CO2 fluxes, representing on average only 0.1 % of NEP (range 0.0 %–0.4 %). In terms of GWP the CH4 flux was larger, being equivalent to 0.8 % of NEP (range 0 %–4.5 %), but on average still a factor of 3 smaller than the warming by N2O emissions equal to 3.9 % of NEP (range 0 %–18.5 %).
In contrast to forests, at semi-natural, short vegetation sites N2O or CH4 emissions had a larger impact on the net GHG balance, where most (seven out of nine) sites showed non-CO2 GHG contributions larger than 10 % of NEP. Three of these seven sites were unfertilized, extensively grazed upland (SN2, SN5, SN6) grasslands (small N2O sources), while three sites (SN3, SN7, SN8) were CH4-emitting peatlands or wetlands (EC-CH4 and chamber flux data from Drewer et al., 2010; Hendriks et al., 2007; Juszczak and Augustin, 2013; Kowalska et al., 2013). At SN3 and SN8, the small to moderate NEP sinks were turned by large CH4 emissions into net GHG sources (net warming budgets of +127 and +242 g CO2-C Eq m−2 yr−1, respectively), though not into actual net C sources (Fig. 7). At SN8, CH4 emissions generally ranged from 25 to 45 g CH4-C m−2 yr−1 but reached 86 g CH4-C m−2 yr−1 during a particularly wet year, when the whole area was flooded. At the SN9 peatland site, Dinsmore et al. (2010) calculated that stream GHG evasion – at the scale of the 335 ha peat bog encompassing the flux tower footprint – together with downstream export represented 50–60 g CO2-Eq m−2 yr−1 (13–16 g CO2-C Eq m−2 yr−1), 96 % of which being degassed CO2, i.e. in the range 11 %–23 % of the GHG budget from the tower footprint.
Previous observations of simple empirical relationships found between N deposition and forest productivity have been criticized for, amongst other things, their low number of replications, unreasonably high sensitivities of productivity to N additions, and limitations of the data and simplistic univariate statistical approaches used (Magnani et al., 2007; Högberg, 2007; de Vries et al., 2008; Sutton et al., 2008). Other attempts have subsequently been made to assess impacts of N deposition on forest growth and carbon sequestration, while accounting for other drivers, at more than 350 long-term monitoring plots in Europe (Solberg et al., 2009; Laubhann et al., 2009; De Vries et al., 2008). A special feature of the present study is that it aims to assemble N deposition rates and budgets, together with variables of the carbon cycle, for a wide range of sites across the European continent in more depth and completeness than hitherto attempted, in order to seek more robust empirical evidence for the response of the terrestrial carbon cycle to different regimes of atmospheric N inputs. The quality of the individual datasets is, however, not uniformly high. Some of the data were measured in situ with known uncertainty, while others were simulated, derived from laboratory experiments, and adapted to the field situation using measured time series of soil T and soil moisture, or taken from existing databases and literature. Also, data may not be fully comparable between sites (different methods used) or even fully representative of each site (spatial heterogeneity). In the following sections, we discuss limitations of the measured, empirical and simulated data, in terms of the component C and N fluxes, their budgets and interactions, and the challenges faced when attempting to establish empirical/statistical evidence for possible N effects on carbon sequestration in natural and semi-natural terrestrial ecosystems in Europe.
4.1 Constraining the ecosystem nitrogen balance through combined measurements and modelling
The compilation of Nr flux data (Fig. 3), based on several independent sources for each component term, provides a realistic picture of inorganic Nr inputs and losses; their balance suggests that for forests subjected to large deposition loads (> 2 g N m−2 yr−1), typically more than half of the incoming Nr is lost to neighbouring environmental compartments such as groundwater and the atmosphere and is thus not available to promote C storage in the forest ecosystem. Since N losses increase – and N retention decreases – exponentially when Ndep exceeds a critical load of approximately 2–2.5 g N m−2 yr−1 (Fig. 3), it seems unlikely that the C sink strength of semi-natural ecosystems, including forests, increases linearly with Nr deposition, especially not with wet N deposition only. Based on a review of experimental N addition studies (e.g. Högberg et al., 2006; Pregitzer et al., 2008) and monitoring-based field studies along N deposition gradients (e.g. Solberg et al., 2009; Laubhann et al., 2009; Thomas et al., 2010), De Vries et al. (2014) suggested that the C response reaches a plateau near 1.5–2.0 g N m−2 yr−1 and then starts to decrease. The linear relationship between C sequestration and wet Nr deposition as proposed for example by Magnani et al. (2007) is also challenged by the large contribution of dry Nr deposition and therefore by the poor correlation between total Ndep and wet deposition. We argue that our multiple-constraint approach for the nitrogen balance (measurement–model combination, model ensemble averaging, alternative data sources) provides overall a more robust basis for studying the impact of Ndep on the C cycle, even though uncertainties in individual terms remain significant.
4.1.1 Reducing uncertainty in nitrogen deposition
The uncertainty in dry deposition based on measured Nr concentrations and inferential modelling is likely not smaller than 30 %, due to limitations in process understanding. The difference between ecosystem-specific EMEP values and the mean inferential estimates (Fig. S2) reflects discrepancies and uncertainties in the four dry deposition schemes used (Flechard et al., 2011); the mean coefficient of variation (CV = σ∕μ) between the four inferential model estimates was 36 %, i.e. larger than the difference between ecosystem-specific EMEP values and the mean inferential estimates. Other sources of discrepancy between the two methods include the use of measured vs. modelled meteorology to drive the deposition models, and site-specific vs. generic values of canopy height and leaf area index, as discussed in Flechard et al. (2011).
The uncertainty in total Nr deposition is probably of the same order since even wet deposition can be deceptively difficult to measure (Dämmgen et al., 2005), and organic N, especially water-soluble organic N, may be significant but challenging to quantify (Cape et al., 2012) and generally ignored in the literature. WSON appears to be a generally small fraction of total (wet + dry) Ndep at most sites except at remote locations in Fennoscandia (EN10, SN3), where WSON deposition could represent up to 20 %–30 % of total Ndep. Also, potential double-counting due to dry deposition to the bulk deposition collectors (e.g. Thimonier et al., 2018) was not considered in this study, although on the basis of the comparison to other data sources (Fig. S2), bulk samplers did not appear to significantly overestimate wet deposition.
Despite these uncertainties, measuring gas-phase and aerosol Nr concentrations locally should provide a better estimate of total ecosystem Nr inputs than the outputs of a large-scale chemical transport model. In addition, the partitioning of wet vs. dry deposition, reduced vs. oxidized N, and canopy absorption vs. soil deposition should also be improved, all of which are useful in interpreting ecosystem N-cycling processes. In particular, for ammonia, with its high spatial variability on a local scale, the inferential modelling approach based on local measurements is likely to provide more realistic deposition estimates than a coarse-resolution chemical transport model (Flechard et al., 2013; Thimonier et al., 2018). In addition to low-cost methods for Nr concentrations, more actual micrometeorological Nr flux measurements are needed to further process understanding and better constrain surface exchange models over many ecosystems (Fowler et al., 2009). For example, ammonia flux measurements at DB2 have revealed unexpected features such as net NH3 emissions from the forest in summer and autumn, in particular in response to leaf fall (Hansen et al., 2013, 2017). DB2 is likely not a net NH3 source at the annual scale, but short-term emission pulses, which are not represented in most dry deposition models (Flechard et al., 2011), could significantly offset total Nr deposition.
An improved knowledge of Nr exchange patterns over CO2 flux monitoring sites, either through inferential modelling or direct flux measurements, is also essential to quantify the fraction of deposited Nr that is absorbed by the canopy, reaching more or less directly the seat of photosynthesis in leaves, thus favouring a higher nitrogen use efficiency (NUE) (Nair et al., 2016; Wortman et al., 2012; Gaige et al., 2007). Canopy nitrogen retention occurs via several processes, including gaseous uptake by stomatal diffusion, a well-documented process (Monteith and Unsworth, 1990), but also through cuticular diffusion and stomatal penetration by aqueous solutions, with surface-deposited and dissolved gases and particles acting as direct leaf nutrients (Burkhardt, 2010; Burkhardt et al., 2012). By contrast, the Nr fraction initially deposited to soil (as simulated by the majority of fertilization tracer experiments, e.g. Nadelhoffer et al., 1999) is subject to various losses via nitrification, denitrification and microbial uptake, before being eventually taken up by roots and moving upwards in xylem flow. The more advanced, emerging multi-layer canopy exchange models for atmospheric pollutants (Nr species but also O3, SO2, etc.) can now partition dry deposition into stomatal, non-stomatal and soil pathways with increasing detail (Zhou et al., 2017; Simpson and Tuovinen, 2014; Flechard et al., 2013), thanks to improved understanding and parameterizations of surface and air column interactions and of photosynthesis-driven stomatal conductance (Büker et al., 2007; Grote et al., 2014). However, particular attention must be paid to measurement quality for an improved deposition accuracy, because such models are still very much dependent on local atmospheric concentration data for all main Nr forms (gas and aerosol, reduced and oxidized, mineral and organic).
4.1.2 Uncertainty in ecosystem nitrogen losses and net balance
The comparison of DIN leaching values by different methods shows that the Dise et al. (2009) algorithm performs reasonably well for low to moderate Nr deposition levels but underestimates DIN losses for some of the highest (> 4 g N m−2 yr−1) deposition sites. This observation was also made by Dise et al. (2009) themselves, who argued that their simple relationships involving external forcings (Ndep) and internal factors (soil N status) are adequate “for early to intermediate stages of nitrogen saturation” but may fail at sites where historical, chronically enhanced Nr deposition has so strongly impacted forest ecosystems that N leaching has become dependent also on stochastic factors such as insect defoliation or a drought period followed by re-wetting of the soil. As was the case for field-measured NO emissions (Fig. 3a), the four highest DIN leaching fluxes (0.9–3.2 g N m−2 yr−1) occurred in the four highest Ndep forests growing on well-drained acidic sandy soils. In addition, it is noteworthy that the two sites with the largest Ndep and DIN leaching rates (EN15, EN16) were dominated by pine or Douglas fir (Table S2). These species have been shown in a common garden experiment (Legout et al., 2016) to cause larger nitrification, leaching and acidification rates (as well as larger losses of calcium, magnesium and aluminium), compared with other tree species such as beech or oak. This is consistent with deciduous trees being known to take up and store more nitrogen per unit biomass in stems and branches than coniferous trees (Jacobsen et al., 2003). Typical stem N content values, proposed for N uptake calculations in the Convention on Long-range Transboundary Air Pollution (CLRTAP) manual for critical loads mapping, are 1 and 1.5 g N kg−1 dry matter for conifers and deciduous trees, respectively, for steady-state conditions (CLRTAP, 2017). Tree species traits may therefore, in our study, have exacerbated an existing DIN leaching predisposition resulting from edaphic factors and pollution climate. At the lower end of the Ndep range, the dataset is consistent with previous studies, which have shown that DIN leaching is unlikely to occur in forests where Ndep < 1 g N m−2 yr−1 (de Vries et al., 2009), although under these conditions there may still be significant N losses as NO and N2O (Fig. 3).
The best empirical fit for the relationship of the sum DIN + NO + N2O to Ndep was slightly non-linear (Fig. 3d) and may indicate that at the upper end of the Ndep range, above 4 g N m−2 yr−1, the sum of inorganic Nr losses might approach or even exceed the estimated atmospheric deposition, which corresponds to one of the several existing definitions of ecosystem N saturation (see below). Whether these ecosystems turn into net N sources depends on the relative magnitudes of the missing terms: N2 fixation (likely small in temperate compared with tropical forests; Vitousek et al., 2002), N2 losses from denitrification (possibly the largest of the unknown terms at forest sites that are frequently waterlogged), N2O losses from the litter layers of the forest floor, DON leaching, and also incoming organic nitrogen in precipitation (WSON) as well as dry deposition of organic Nr species, not quantified here (Fig. 1). The presumably small, and unaccounted for, N inputs via N2 fixation and organic Nr deposition are at least partly compensated for by denitrification N2 losses and DON leaching losses. Moreover DON leaching typically responds much less strongly than DIN leaching to N inputs (Siemens and Kaupenjohann, 2002). Under these assumptions, the inorganic Nr budget calculated from Fig. 3 may provide a reasonable proxy for the overall ecosystem N balance. In this case, N outputs by gaseous and dissolved losses represent on average across all forest sites 43 % of N inputs. More important than the average N loss for judging Nr deposition effects on C sequestration is the large range of losses from 6 % to 85 %, with on average a 27 % loss (range 6 %–54 %) for Ndep < 1 g N m−2 yr−1, 45 % loss (12 %–78 %) for intermediate Ndep levels, and 65 % loss (35 %–85 %) for Ndep > 3 g N m−2 yr−1. However, if the very few available data or estimates for DON leaching and especially denitrification N2 fluxes are correct and may be extrapolated to other sites, they may often outweigh the inputs through organic Nr deposition and biological N2 fixation, and thus the inorganic Nr budget (Fig. 3) may underestimate the overall N losses.
4.2 Drivers and uncertainties of the carbon and GHG balance
4.2.1 Variability of carbon sequestration efficiency
The CSE ratio (= NEP ∕ GPP) calculated over the CEIP/NEU project observation periods provides an indicator of the fraction of accumulated carbon in the ecosystem relative to gross CO2 uptake by photosynthesis. This is a useful metric to compare carbon cycling in different terrestrial ecosystems, and it is directly related to climate effects and other drivers such as site fertility (Vicca et al., 2012) and management (Campioli et al., 2015). By contrast, quantifying the accumulated carbon in terrestrial ecosystems requires much longer observations (one or several decades) to ensure statistical significance of a small change over a large C stock, particularly when soils are considered. This is often impractical but also of limited use, because N deposition rates are unlikely to be constant over such long periods.
Over the time frame of the CEIP/NEU projects, observation-based CSEobs values were much more variable than their modelled counterparts. Negative CSEobs values (EN6, EN11) imply a net carbon source and may be explained by a number of factors, including soil carbon loss, lateral DOC ∕ DIC water flow from adjacent ecosystems, tree mortality, low fertility, poor ecosystem health, a recently planted forest or other disturbances with long-lasting consequences on the C budget. At EN6 the main reasons may be a large SOC concentration, leading to large Reco values, and a relatively old age of the forest, responsible for a small GPP.
However, the large discrepancy between observation-based and modelled CSE estimates may not be entirely caused by the model's inability to reproduce all fine patterns of GPP and especially Reco across all ecosystems (Fig. 6). Some of the largest CSEobs values may be less ecologically plausible and might result from methodological biases and/or incorrect interpretation of the EC measurements, in terms of their representativeness for the ecosystem considered. Multi-annual values of GPP and Reco derived from EC flux data are not measurements sensu stricto; they compound problems in EC measurements, post-processing of high-frequency data, gap-filling and partitioning. Some partitioning algorithms (Barr et al., 2004; Reichstein et al., 2005) evaluate GPP as the difference between measured daytime NEE and an estimate of daytime Reco that is based on an empirical model of night-time Reco measurements. In this case, any problem with night-time and thus with estimated daytime Reco would directly impact GPP in the same way (Vickers et al., 2009): GPP and Reco would both be underestimated, or both overestimated, in absolute terms and by the same absolute magnitude, thereby impacting the annual or long-term NEP ∕ GPP (CSEobs) ratio.
In this study, however, the use of the daytime-data-based partitioning method by Lasslop et al. (2010), within the REddyProc algorithm embedded in the European Fluxes Database Cluster, was intended to ensure the independence of GPP and Reco estimates, since Reco was estimated from the intercept of the Michaelis–Menten light response curve fitted to daytime-measured NEE. This partitioning procedure should avoid the propagation into the GPP estimate of potential errors in night-time Reco data, although it still assumes similar dependencies of day- and night-time respiration on environmental factors, which is debatable from a biological standpoint (e.g. Kok, 1949; Wehr et al., 2016; Wohlfahrt and Galvagno, 2017). From a micrometeorological perspective, the night-time flux can be underestimated due to low-turbulence conditions and the transport of CO2 by horizontal and/or vertical advection, as well as the decoupling of soil-level and understorey fluxes from the turbulent fluxes measured above the canopy (Feigenwinter et al., 2008; Etzold et al., 2010; Montagnani et al., 2010; Paul-Limoges et al., 2017). Further, in principle, the u∗ threshold filtering (Gu et al., 2005; Papale et al., 2006), carried out to discard low-turbulence flux data at the start of the gap-filling and partitioning algorithm (REddyProc, 2019) should alleviate the issue of night-time Reco underestimation, which affects annual Reco and CSEobs even if the error does not propagate into GPP in the Lasslop et al. (2010) method. However, the choice of the value for the u∗ threshold can be critical if advection-affected flux values are to be discarded, especially for sites and datasets where the independence of the gap-filled annual NEP value from the u∗ threshold value cannot be demonstrated. Advective flux contributions remain a largely unresolved issue, as Aubinet et al. (2010) conclude that “direct advection measurements do not help to solve the night-time CO2 closure problem”. Others (e.g. Kutsch and Kolari, 2015) have commented on the need to assign appropriate uncertainties when dealing with CSE and C balances derived from EC flux towers, which only measure turbulent fluxes and CO2 storage change in the air column underneath the sensor but not the other terms of the conservation equation of a scalar in the atmospheric boundary layer (see Eq. 1 in Aubinet et al., 2000).
Despite all these precautions, at sloping or complex terrain sites where advection can be important, it cannot be excluded that the Lasslop et al. (2010) daytime-data-based approach may still underestimate Reco (and overestimate CSEobs) if advection is not accounted for explicitly. This is because the Reco estimate based on the intercept of the light response curve for the measured NEE (at PAR = 0) is strongly influenced by measurements made around sunrise and sunset, when a clear impact of advection on the light response curve ordinate has been observed, as shown at the EN5 subalpine site by Montagnani et al. (2009) (see their Fig. 13).
It is important to note that advection may also be a problem at flat lowland sites if there is strong spatial land surface heterogeneity, e.g. differences in albedo or in Bowen ratio, a gradient in tree species, a nearby lake, and a gradient in water availability. Conversely, there may also be sites where EC underestimates CSEobs for similar reasons, albeit in the opposite direction, for example additional CO2 being advected into the ecosystem and then released by turbulent diffusion to the atmosphere within the tower footprint. Another possibility is that basal Reco, measured at dawn or dusk over a different (larger) footprint, is lower than during the day. Flux partitioning may again in this case underestimate Reco during the warmer daytime hours, and therefore also underestimate GPP, resulting in overestimated NEP ∕ GPP (CSEobs) ratios.
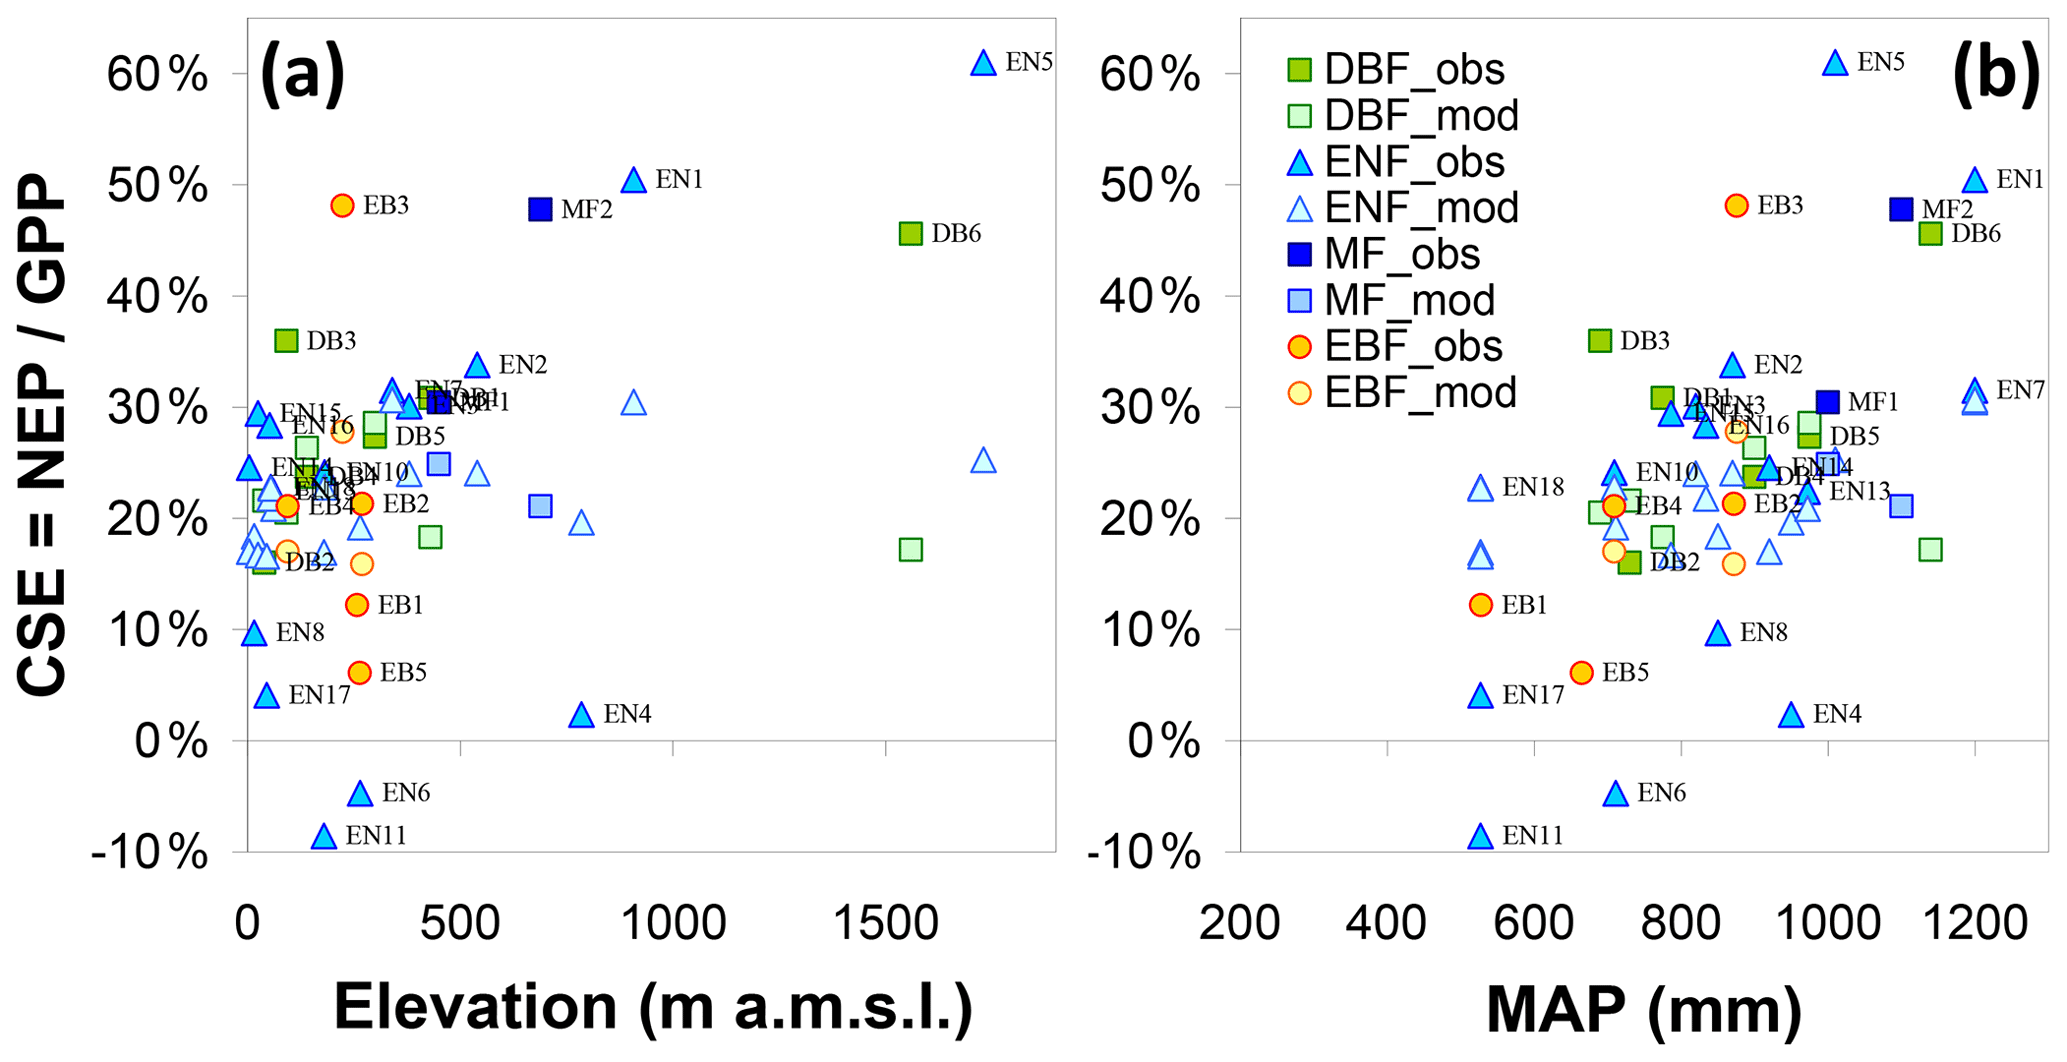
Figure 8Variability of observation-based and modelled carbon sequestration efficiency (CSE, defined as the NEP ∕ GPP ratio), as a function of (a) site elevation above mean sea level (m), and (b) MAP: mean annual precipitation (mm). Site labels are provided for observations only.
Given this uncertainty, the fact that most of the forest stands with CSEobs values larger than 40 % (EN1, EN5, DB6, MF2) were located at elevations above 700 m a.s.l. (Table 1 and Fig. 8a), i.e. in hilly or mountainous areas with topographically more complex terrain than typically encountered at lowland sites, may be coincidental, or partly a consequence of advection or decoupling issues (Paul-Limoges et al., 2017). In such conditions, consistency cross-checks involving additional flux, advection, soil and biometric measurements, even ecosystem modelling, provide useful reference points to assess the plausibility of EC-derived C budgets and to better constrain the problem. At the EN5 site, the annual total tree biomass C increment based on biometric measurements was on average 218 g C m−2 yr−1 over the period 2010–2017 (Leonardo Montagnani, unpublished data), i.e. 26 % of the reported mean EC-derived NEP value of 826 g C m−2 yr−1 for the CEIP–NEU period, and it seems unlikely that the increase in soil carbon and fine root stocks could account for the large difference. By contrast, the DB6 site was a fertile and managed beech forest, with a significantly higher efficiency conversion of photosynthates into biomass compared to less fertile and unmanaged sites (Vicca et al., 2012; Campioli et al., 2015). The long-term annual total NPP at the site was 780 g C m−2 yr−1 over the period 1992–2007, with a significant part allocated below ground (Alberti et al., 2015), while heterotrophic respiration estimated at the site using either bomb carbon (Harrison et al., 2000) or mineralization rates (Persson et al., 2000) was around 200 g C m−2 yr−1, resulting in similar NEP estimates by EC flux measurements versus biometric data combined with process studies.
At the MF2 site, Etzold et al. (2011) calculated inter-annual mean EC-derived NEP, GPP and Reco values (for the same 2005–2009 period used in this study) of 415, 1830 and 1383 g C m−2 yr−1, respectively, using customized gap-filling and partitioning algorithms and thus providing alternative estimates to those from the REddyProc algorithm within the European Fluxes Database Cluster (Table 1). Values of Reco and NEP were 82 % larger and 40 % lower, respectively, in Etzold et al. (2011) compared with the default database values that do not explicitly correct for advection. However, the Etzold et al. (2011) mean EC-derived NEP was much closer to NEP values calculated from the net annual increment in the woody and non-woody biomass and soil C storage using four different biometric and modelling methods (range 307–514 g C m−2 yr−1, mean 421 g C m−2 yr−1). The CSEobs value derived from Etzold et al. (2011) was 23 % and comparable to the value of 25 % that can be calculated from the decoupling-corrected EC budget computed by Paul-Limoges et al. (2017) for the same site for the years 2014–2015, in which the decoupling correction to account for undetected below-canopy fluxes doubled Reco and reduced NEP from 758 to 327 g C m−2 yr−1. These alternative CSEobs estimates were thus much lower than the default CSEobs value of 48 % but fully consistent with model predictions (Fig. 8).
The four upland sites, EN1, EN5, DB6 and MF2, were also among the wettest, with MAP > 1000 mm (Fig. 8b) in principle promoting larger leaching and runoff. The overall distribution of CSEobs as a function of MAP (Fig. 8b) shows an apparent increase in CSEobs with precipitation, though with large scatter, which would be consistent with a reduction in EC-tower-based Reco through an increase in the dissolved leached fraction. At sites where significant leaching occurs, Reco determined from the atmospheric flux is no longer a reliable indicator of total C losses by respiration since the dissolved and then leached fraction of Rsoil is not captured by the flux tower (Gielen et al., 2011), which implies that CSEobs is overestimated. As observed in the case of GPP, such apparent correlations of CSEobs to single factors like elevation or MAP may not be (entirely) causal, potentially concealing underlying cross-correlations (such as large but unmeasured advection components occurring at the same sites where MAP is largest). The data by Kindler et al. (2011) and Gielen et al. (2011) do suggest that the overestimation of C sequestration (as estimated by EC-derived NEP), caused by not accounting for dissolved C leaching, was likely smaller than 10 % for forests (7 % of NEP on average), but all five sites they investigated had MAP < 1000 mm and only one (EN4) was an upland site (785 m).
To summarize a set of unresolved issues, the largest CSEobs values (> 45 %) are likely to result from a combination of ecological factors and methodological biases, but they occurred at sites in the mid-range for Ndep (1.2–2.2 g N m−2 yr−1) and thus did not introduce confounding trends in the overall C–N relationships we seek to establish across the whole Ndep spectrum in this study.
4.2.2 Forest net greenhouse gas balance dominated by carbon
Based on the available data, the net GHG balance of the 31 forests investigated was generally not significantly affected by N2O or CH4 (Fig. 7), with the caveat that these fluxes were not actually measured in situ everywhere or with the same intensity and duration as CO2. Thus, the uncertainty in non-CO2 GHG fluxes is much larger (possibly > 100 %) than for multi-annual EC-based CO2 datasets, where a typical uncertainty is of the order of 10 %–30 % (Loescher et al., 2006). Nonetheless, the N2O and CH4 emissions observed by different methods in forest soils were typically 2 orders of magnitude smaller than the CO2 sink (in GWP equivalents), which means that the quality of CO2 estimates dominates the overall uncertainty in our forest GHG budgets. Note that such results cannot be extended to waterlogged, organic soils of temperate and boreal zones, where CH4 emissions can be large (Morison et al., 2012), nor can they be extended to the tropics, especially in degraded forests (Pearson et al., 2017). Also, N2O fluxes can be highly episodic, with emission events linked to for example freeze–thaw cycles (Risk et al., 2013; Medinets et al., 2017), and such episodes would have been missed by the bioassay approach and in some cases by discontinuous (manual) chamber measurements.
By contrast, for the short semi-natural vegetation sites of our study, NEP was on average a factor of 2.7 smaller than in forests but only a factor of 1.5 smaller for GPP, which implies that total C losses were much larger in proportion to gross assimilation, especially non-respiratory, non-CO2 losses (i.e. a much lower CSE). Large wetland CH4 emissions and dissolved DIC/DOC fluxes were much more likely to offset or even determine the C and GHG balance (Fig. 7; Kindler et al., 2011). In these systems, studying the impact of Nr deposition on C sequestration requires much more robust estimates of the gaseous and dissolved budgets for all components and over the long term, since the estimation of NECB requires in addition to EC CO2 the knowledge of non-atmospheric, non-CO2 fluxes (Fig. 1). Technological developments in the field of (routine) EC measurements for N2O and CH4 (e.g. Nemitz et al., 2018) are likely to reduce uncertainties in net GHG budgets in the foreseeable future, but DIC/DOC losses in wetlands probably represent a bigger challenge.
It should however be remembered that such short-term GHG budgets, based on a few years of flux data and GWP multipliers for a 100-year time horizon, do not actually reflect the long-term climate impact of northern mires, which may be thousands of years old and, despite their CH4 emissions, typically have an overall climate-cooling effect. As shown by Frolking et al. (2006), pristine mires typically start cooling the climate some hundreds of years after their formation, with the exact timing of course depending on the magnitude of the CH4 and CO2 fluxes; thus the history of the site should be accounted for when dealing with ecosystem radiative forcing assessments. For the SN3 site, Drewer et al. (2010) actually used a 500-year time horizon GWP (instead of the usual 100-year) for CH4, reducing the GHG source strength of the site by a factor of 4 to 10, depending on the year considered.
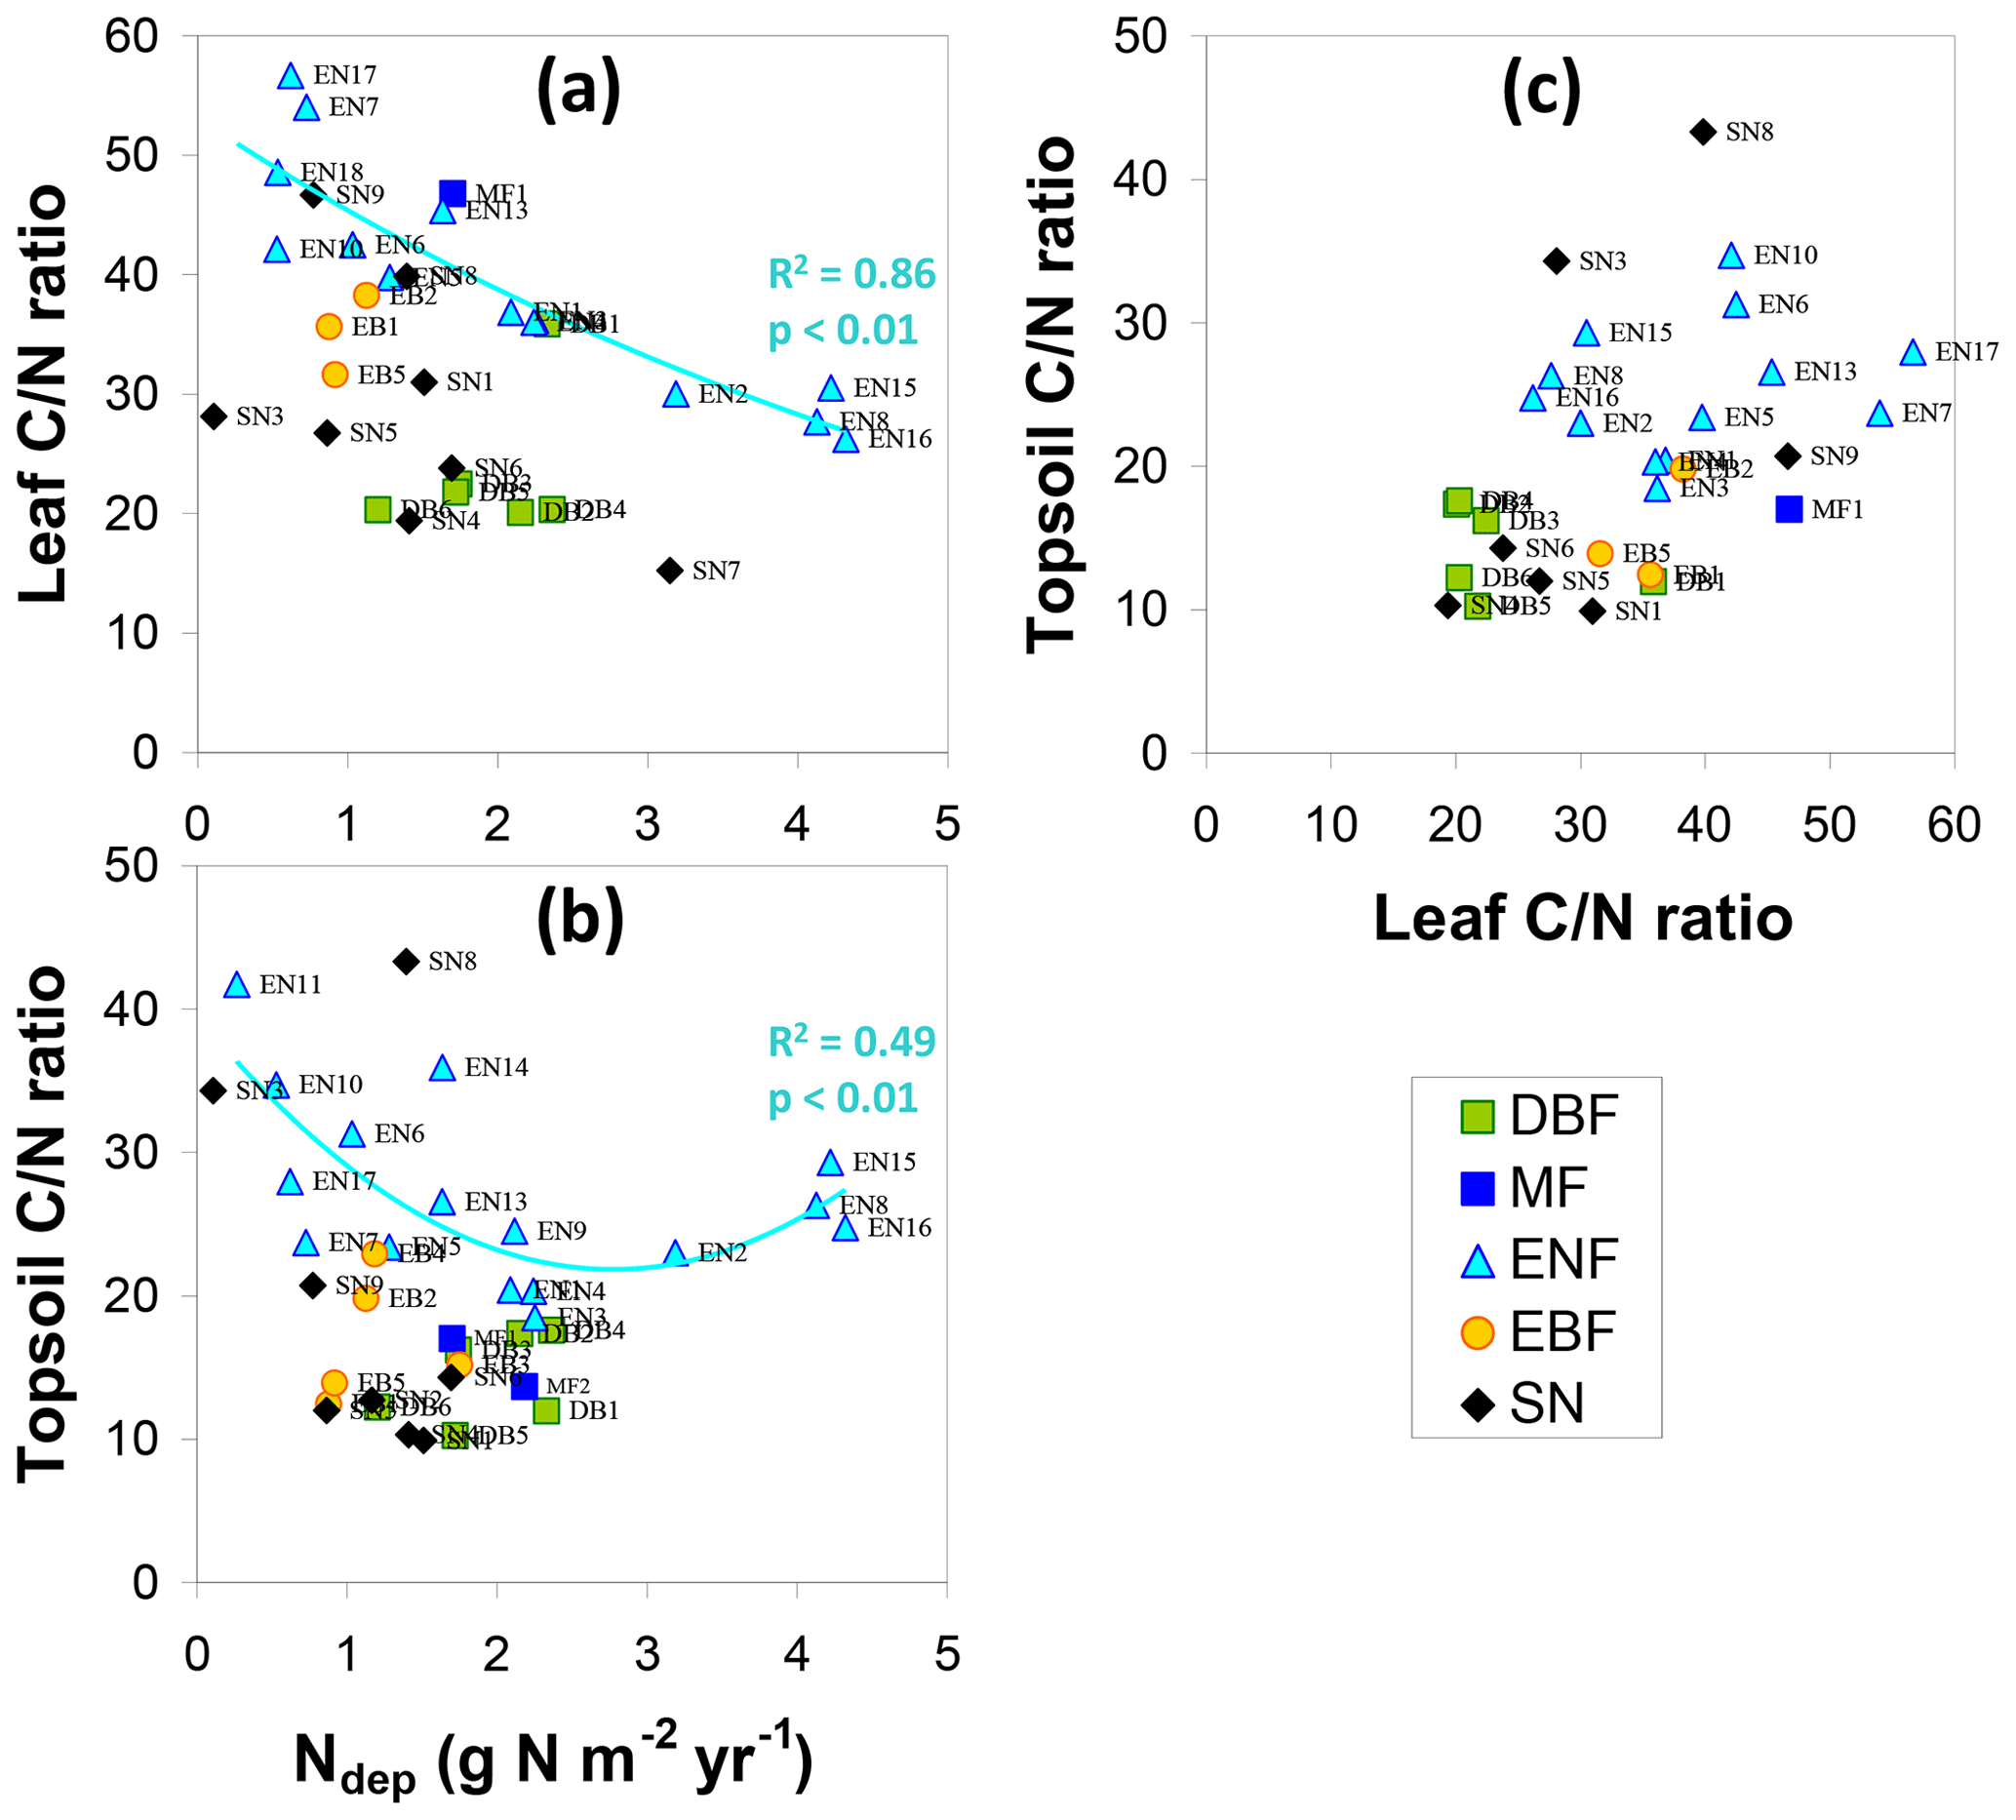
Figure 9Relationships of leaf (a) and topsoil (b) C∕N ratios with atmospheric nitrogen deposition (Ndep), and to each other (c), in different ecosystem types (DBF: deciduous broadleaf forests, MF: mixed forests, ENF: evergreen needleleaf forests, EBF: evergreen broadleaf forests, SN: short semi-natural vegetation).
4.3 Challenges in understanding the coupling of carbon and nitrogen budgets
4.3.1 Tangled effects of nitrogen deposition and climate on ecosystem productivity
The analysis of Ndep variability and spatial patterns at the scale of the monitoring network, as well as the European scale (Fig. 5), showed that the impact of Nr deposition on ecosystem C sequestration cannot be considered independently of climate in the regional context of this study. Nitrogen deposition patterns at the European scale result from the continent-wide geographical distribution of population, human, industrial and agricultural activities, and of precursor emissions, combined with mesoscale patterns of meteorology-driven atmospheric circulation and chemistry. Through the interplay of these factors, the elevated Ndep levels in this study happened to co-occur geographically with temperate climatic zones of central and western Europe (Fig. 5c–d) that are the most conducive to vegetation growth at the continental scale. This means adequate water supply as precipitation, reasonably low summertime evaporative demand, mild winters and temperate summers, and long growing seasons. In other words, there are many gaps in the multidimensional variable space, which is incompletely explored by the available dataset. Thus, any regression analysis that would correlate NEP and other C fluxes with Ndep, without simultaneously accounting for climate, would be flawed, as Sutton et al. (2008) concluded from their reanalysis of the data used by Magnani et al. (2007). A dC∕dN slope calculated directly from a (linear or non-linear) mono-factorial regression analysis of GPP or NEP vs. Ndep would misleadingly attribute the whole C flux variability to Ndep while ignoring climate effects (Fleischer et al., 2013). In addition, a range of other potential explanatory variables such as soil type, especially the water holding capacity (ΦFC−ΦWP), soil fertility (Vicca et al., 2012; Legout et al., 2014), tree species and stand age (Besnard et al., 2018), are potentially needed to explain the observed variability. In order to account for, and untangle, the multiple inter-relationships, we chose a mechanistic model (BASFOR) based approach, described in Flechard et al. (2020), whereby most of the known interactions of plant, soil, climate, age and species are encoded and parameterized to the best of our current knowledge. Given the limited size and very large diversity of the dataset, such an approach appears to be preferable to regression-based statistical analyses, since a simple pattern to explain the coupling of carbon and nitrogen budgets with the available data and knowledge is unlikely.
4.3.2 Evidence of nitrogen saturation from various indicators
Various definitions of nitrogen saturation have been proposed (Aber, 1992; De Schrijver et al., 2008; Binkley and Högberg, 2016), including (i) the absence of a growth response in the case of further N addition (dC∕dN = 0), (ii) the onset of leaching and/or gaseous emissions, and (iii) the equivalence of N inputs and N losses. The underlying concept of a dC∕dN response is that the C and N cycles are closely coupled through stoichiometric ratios in the different parts of the ecosystem, with very different C∕N ratios in soil organic matter, roots, leaves, tree branches and stems (de Vries et al., 2009; Zechmeister-Boltenstern et al., 2015). A difference in dC∕dN response could, for example, be expected between forests, where carbon is stored in both woody and root biomass (C∕N ratio 300–500) and below ground in SOM (C∕N ratio 30–40), versus short semi-natural vegetation, where most of the stock is in SOM, and thus with a much lower overall ecosystem C∕N ratio. This would be consistent with the observations in Fig. 4, where the apparent increase in NEP with increasing Ndep is smaller in short semi-natural vegetation than in forests. But the theoretical stoichiometric approach becomes more uncertain in the event of N saturation, as the C and N cycles have become much less tightly coupled than in pristine, N-limited environments, and thus defining a dose-response relationship requires a precise quantification of all C and N inputs and losses, not just productivity and Nr deposition.
Another possible indicator of N saturation in the present dataset may be provided by the comparison of the relationships of C∕N ratios of foliage and topsoil (5 cm) to atmospheric Nr deposition (Fig. 9a–b). Since leaf N content was not only dependent on Nr deposition but also on the ecosystem type (Fig. 4e), C∕N ratios are shown separately for the different vegetation classes in Fig. 9. There was a clear negative correlation of leaf C∕N ratio to Ndep for coniferous forests (ENF, spruce and pine pooled: exponential fit R2=0.86, p< 0.01) and a similar but not significant trend for SN (linear R2=0.29) (Fig. 9a); for the other ecosystems (DBF, MF, EBF) there were not enough data to derive trends. In topsoils (Fig. 9b), there was also a broad downward trend of C∕N ratios with increasing Ndep within the ENF and SN classes but only for Ndep up to 2.5 g N m−2 yr−1. Again, as for GPP and NEP, the relationship is highly non-linear as the four ENF sites above this Ndep threshold break the trend observed in the lower Ndep sites, and the overall best fit is quadratic (R2=0.49, p< 0.01) with an inflexion point around this threshold. While the relationship of foliar C∕N ratio to Ndep was almost linear for ENF (a consequence of the linear trend in ENF leaf N content, Fig. 4e), the non-linear behaviour of the topsoil C∕N ratio and its stabilization or increase for Ndep > 2.5 g N m−2 yr−1 indicate a possible threshold for saturation. Atmospheric nitrogen was therefore apparently efficiently taken up by vegetation when reaching the leaves; but after leaf fall, and following litter decomposition and incorporation into the topsoil, there appeared to be a limit to the amount of nitrogen that can be stabilized into soil organic matter of the ENF sites. However, forest soil organic N stocks are very large (in the range 200–700 g N m−2 at the sites we investigated), and therefore changes in C∕N ratios in response to atmospheric Nr deposition must be very slow. The soil C∕N ratio at a given time reflects centuries of land use as well as a more recent history of multi-decadal changes in Nr deposition (Flechard et al., 2020). This complicates the interpretation of the downward trends observed from instantaneous snapshots of soil and foliar C∕N ratios versus Ndep since the ecosystems cannot be considered to be in steady state, neither for Ndep nor for growth or productivity. There was a positive correlation across all vegetation types between topsoil and foliar C∕N ratios (Fig. 9c; R2=0.19, p< 0.05), but this was mostly driven by differences between plant functional types (no significant correlation within each PFT).
Following definition (ii) of N saturation given above, the sum of inorganic Nr losses, heavily dominated by DIN leaching at the upper end of the Ndep range in our datasets (Fig. 3), may indicate various stages of N saturation in all forests with Ndep > 1–1.5 g N m−2 yr−1. A threshold for a more advanced saturation stage could be placed at 2–2.5 g N m−2 yr−1, where inorganic Nr losses are consistently larger than 50 % of Ndep. Such numbers are entirely consistent with the leaching risk classification of European forests proposed by Dise and Wright (1995), with low leaching risk at Ndep < 1 g N m−2 yr−1, intermediate risk at Ndep in the range 1–2.5 g N m−2 yr−1 and high risk at Ndep > 2.5 g N m−2 yr−1. The results are also in line with the review by De Vries et al. (2014); based on literature results of dC∕dN responses derived from stoichiometric scaling, meta-analysis of N addition experiments, and field observations of both growth changes and Nr deposition, accounting for other drivers, the data showed beneficial Nr deposition effects up to 2–3 g N m−2 yr−1 and adverse effects at higher levels. A lower Ndep threshold of 1 g N m−2 yr−1 had also been suggested by de Vries et al. (2007), but this was using throughfall deposition, which generally underestimates total deposition through canopy retention processes (Thimonier et al., 2018). It must be stressed, however, that the definition of an all-purpose, generic Ndep threshold for N saturation may be misleading, or at least qualified with an uncertainty, since some tree species (Douglas fir, pine, spruce), grown on the same soil and under the same climate and Ndep regime, may result in significantly higher leaching rates than others (Legout et al., 2016). This also means that the leaching flux is not necessarily a good proxy of the severity of N saturation, though this depends on which of the several definitions of N saturation is considered.
The upper threshold of 2–2.5 g N m−2 yr−1 happens to coincide with the levelling off of GPP, Reco and NEP, as well as the further reduction in C fluxes at higher Ndep levels (Fig. 4a-c). Whether this should be interpreted as a negative impact of advanced N saturation on soil processes and plant functioning and, hence, C sequestration potential is not straightforward (Binkley and Högberg, 2016). If the parallel effects of climate, soil fertility, other nutrient limitations, tree species traits, age and planting density are overlooked in a simplistic, first-order interpretation, the dataset hints at an optimum Ndep level around 2 g N m−2 yr−1, beyond which no further benefits (in carbon terms) could be gained from further atmospheric Nr additions, which would be consistent with the 2–2.5 g N m−2 yr−1 Ndep threshold derived by Etzold et al. (2014) for Swiss forests. The high soil Nr losses observed in these ecosystems growing under relatively favourable climates would then suggest that whatever fertilization effect Nr deposition may have at low to moderate deposition rates (< 2 g N m−2 yr−1) is unlikely to be sustained at high-deposition levels, especially on acidic sandy soils. However, the very limited number of affected sites with Ndep > 3 g N m−2 yr−1 leaves too few degrees of freedom to make the argument statistically compelling. More importantly, a knowledge of all other limitations to growth (climate, soil, fertility, nutrients, age structure) would be required to confirm the hypothesis. Additional measurement- and model-based investigations to untangle the Ndep effect on C sequestration (the dC∕dN term) are presented in Flechard et al. (2020), drawing from the results, fluxes and budgets presented here.
We provided estimates of carbon, nitrogen and greenhouse gas budgets for 40 flux tower sites over European forests and semi-natural vegetation, compiled from a large variability of state-of-the-art methods that can be applied in such a network approach. The CO2 budgets from well-established EC methods were the least uncertain, followed by GHG budgets of forests and then the CH4 and DIC/DOC fluxes of wetlands; uncertainty levels were likely highest in the net N budgets, especially at the elevated Nr deposition sites where leaching was almost of the same order as Ndep. The uncertainty was still compounded by the lack of some data on biological N2 fixation; N2 loss by denitrification; and organic Nr in rainwater, in dry deposition and in soil leaching, but some of these unknown terms would compensate mutually to some extent. Nevertheless, the low-cost network to monitor atmospheric gas-phase and aerosol Nr contributed to substantially reducing the large uncertainty in total Ndep rates at individual sites (compared with gridded outputs of a regional chemical transport model). This was because dry deposition almost systematically heavily dominates over wet deposition in forests, except at very remote sites (away from sources of atmospheric pollution), and directly measured Nr concentrations reduced the uncertainty in dry deposition fluxes.
The greenhouse gas balances of the 31 forest sites included in this study were almost entirely determined by the CO2 budgets, with small to negligible contributions by N2O and CH4. The GHG balance of nine extensively managed and upland grasslands, moorlands and wetlands was much more dependent on CH4 and N2O fluxes. Ecosystem productivity (GPP, NEP) data across Europe showed an apparent increase with atmospheric Ndep, though only up to 2.5 g N m−2 yr−1, while the larger Ndep rates also happen to coincide geographically with regions of Europe where climate is optimal for tree growth (neither too cold nor too dry). The data thus underpinned a strong covariation of Nr deposition with variables like elevation and climate, and they indicated that the ecosystem response of carbon sequestration to nitrogen deposition cannot be calculated simply and directly from the observed apparent dNEP ∕ dNdep using bivariate statistics. Other co-varying influences such as climate, soil, fertility, nutrient availability, forest age and ecophysiological processes should be analysed alongside so the nitrogen deposition effect can be isolated.
The site-specific analysis of C and N fluxes and budgets across a large geographical and climatic gradient support the concept of a non-linear response of C sequestration to N deposition. Large nitrogen losses (especially nitrate) from forests suggest that up to one-third of the sites investigated can be classified as in the early to advanced stages of N saturation. At the sites with the largest Nr deposition rates (> 2.5 g N m−2 yr−1), a stagnation or reduction in forest productivity, compared to mid-range deposition sites, was observed. Beyond the conclusion that the apparent C response to increased Nr deposition was non-linear, we do not have enough data to test the hypothesis that the reduction in productivity and C sequestration is linked to N-saturation-induced ecological impacts on soil and ecosystem functioning, rather than just the confounding effects of variability in meteorological and other drivers. Further efforts are required to disentangle Ndep effects and climatic as well as pedological effects on C sequestration at the continental scale.
The data used in this study are publicly available from online databases and from the literature as described in the “Materials and methods” section.
The codes of models and other software used in this study are publicly available online as described in the “Materials and methods” section.
The supplement related to this article is available online at: https://doi.org/10.5194/bg-17-1583-2020-supplement.
CRF, MAS, AI, WdV, MvO and UMS conceived the paper; MAS, EN, UMS, KBB, and WdV conceived or designed the NEU study; CRF performed the data analyses, ran model simulations and wrote the text; MvO and DRC wrote and provided the BASFOR model code and performed the Bayesian calibration; YST, NvD, HU, UD, SV, VD, MM, FS and YF performed DELTA and bulk deposition chemical analyses; AF collected wet deposition databases; DS provided modelled EMEP Nr deposition data; BaKi and SZB conceived and performed the soil bioassay experiment; JKS provided foliar nitrogen analyses; AI, UMS, JFJK, ArL, MJS, MaA, DL, LM, JN, IAJ, MP, RK, JA, AV, JO, RJ, MiA, BHC, JD, WE, AF, AG, PG, YH, CH, AH, LH, BaKr, WLK, RLdV, ALoh, BL, MVM, GM, VM, JMO, KP, GP, MTS, MU, TV, CV and TW provided eddy covariance and/or other field data, or contributed to data collection from external databases and literature; AI, WdV, MAS, UMS, MvO, EN, KBB, SZB, DRC, NBD, JFJK, NB, ArL, DS, MJS, MaA, DL, LM, JN, IAJ, MP, RK, JS, AJF, JA, AV, JO, RJ, MiA, WE, BaKi, BaKr, RLdV, AnL, GM, AN and MU contributed substantially to discussions and revisions.
The authors declare that they have no conflict of interest.
The authors gratefully acknowledge financial support by the European Commission through the two FP6 integrated projects CarboEurope Integrated Project (project no. GOCE-CT-2003-505572) and NitroEurope Integrated Project (project no. 017841), the FP7 ECLAIRE project (grant agreement no. 282910), and the ABBA COST Action ES0804. We are also thankful for funding from the French GIP-ECOFOR consortium under the F-ORE-T forest observation and experimentation network, as well as from the MDM-2017-0714 Spanish grant. We are grateful to Christian Bernhofer, Robert Clement, Han Dolman, Axel Don, Eric Dufrêne, Damiano Gianelle, Ruediger Grote, Anders Lindroth, John Moncrieff, Dario Papale, Corinna Rebmann and Alex Vermeulen for the data they provided, as well as to Klaudia Ziemblińska for her comments on the paper. Computer time for EMEP model runs was supported by the Research Council of Norway through the NOTUR project EMEP (NN2890K). Finalization of the paper was supported by the UK Natural Environment Research Council award number NE/R016429/1 as part of the UK-SCAPE programme delivering national capability. We also wish to thank two anonymous referees for their constructive criticism of the paper.
This research has been supported by the European Commission's Sixth Framework Programme (grant nos. 017841 and GOCE-CT-2003-505572) and the European Commission's Seventh Framework Programme (ECLAIRE, grant no. 282910).
This paper was edited by Sönke Zaehle and reviewed by A. Àvila and one anonymous referee.
Aber, J. D.: Nitrogen cycling and nitrogen saturation in temperate forest ecosystems, Tree, 7, 220–224, https://doi.org/10.1016/0169-5347(92)90048-G, 1992.
Alberti, G., Vicca, S., Inglima, I., Belelli-Marchesini, L., Genesio, L., Miglietta, F., Marjanovic, H., Martinez, C., Matteucci, G., D'Andrea, E., Peressotti, A., Petrella, F., Rodeghiero, M., and Cotrufo, M. F.: Soil C : N stoichiometry controls carbon sink partitioning between above-ground tree biomass and soil organic matter in high fertility forests, iForest, 8, 195–206, https://doi.org/10.3832/ifor1196-008, 2015.
Aubinet, M. A., Grelle, A., Ibrom, A., Rannik, Ü., Moncrieff, J., Foken, T., Kowalski, T. A. S., Martin, P.H., Berbigier, P., Bernhofer, C., Clement, R., Elbers, J., Granier, A., Grünwald, T., Morgenstern, K., Pilegaard, K., Rebmann, C., Snijders, W., Valentini, R., and Vesala, T.: Estimates of the annual net carbon and water exchange of forests: The EUROFLUX methodology, Adv. Ecol. Res., 30, 113–175, https://doi.org/10.1016/S0065-2504(08)60018-5, 2000.
Aubinet, M., Feigenwinter, C., Bernhofer, C., Canepa, E., Heinesch, B., Lindroth, A., Montagnani, L., Rebmann, C., Sedlak, P., and van Gorsel, E.: Direct advection measurements do not help to solve the nighttime CO2 closure problem – evidence from three inherently different forests, Agr. Forest Meteorol., 150, 655–664, https://doi.org/10.1016/j.agrformet.2010.01.016, 2010.
Baccini, A., Walker, W., Carvalho, L., Farina, M., Sulla-Menashe, D., and Houghton, R. A.: Tropical forests are a net carbon source based on aboveground measurements of gain and loss, Science, 358, 230–234, https://doi.org/10.1126/science.aam5962, 2017.
Barr, A. G., Black, T. A., Hogg, E. H., Kljun, N., Morgenstern, K., and Nesic, Z.: Inter-annual variability in the leaf area index of a boreal aspen-hazelnut forest in relation to net ecosystem production, Agr. Forest Meteorol., 126, 237–255, https://doi.org/10.1016/j.agrformet.2004.06.011, 2004.
Barton, L., Wolf, B., Rowlings, D., Scheer, C., Kiese, R., Grace, P., Stefanova, K., and Butterbach-Bahl, K.: Sampling frequency affects estimates of annual nitrous oxide fluxes, Sci. Rep.-UK, 5, 15912, https://doi.org/10.1038/srep15912, 2015.
BASFOR, BASic FORest ecosystem model: https://github.com/MarcelVanOijen/BASFOR (last access: 22 August 2019), 2016.
Bertolini, T., Flechard, C. R., Fattore, F., Nicolini, G., Stefani, P., Materia, S., Valentini, R., Laurin, G. V., and Castaldi, S.: DRY and BULK atmospheric nitrogen deposition to a West-African humid forest exposed to terrestrial and oceanic sources, Agr. Forest Meteorol., 218, 184–195, https://doi.org/10.1016/j.agrformet.2015.12.026, 2016.
Besnard, S., Carvalhais, N., Arain, A., Black, A., de Bruin, S., Buchmann, N., Cescatti, A., Chen, J., Clevers, J. G. P. W., Desai, A.R., Gough, C. M., Havrankova, K., Herold, M., Hörtnagl, L., Jung, M., Knohl, A., Kruijt, B., Krupkova, L., Law, B. E., Lindroth, A., Noormets, A., Roupsard, O., Steinbrecher, R., Varlagin, A., Vincke, C., and Reichstein, M.: Quantifying the effect of forest age in annual net forest carbon balance, Environ. Res. Lett., 13, 124018, https://doi.org/10.1088/1748-9326/aaeaeb, 2018.
Binkley, D. and Högberg, P.: Tamm Review: Revisiting the influence of nitrogen deposition on Swedish forests, Forest Ecol. Manag., 368, 222–239, https://doi.org/10.1016/j.foreco.2016.02.035, 2016.
Boone, D. R.: Ecology of methanogenesis, in: Microbial Production and Consumption of Greenhouse Gases: Methane, Nitrogen oxides, and Halomethanes, edited by: by Rogers, J. E. and Whitman, W. E., American Society for Microbiology, Washington, DC, 57–70, https://doi.org/10.1016/0169-5347(93)90172-L, 1991.
Bousquet, P., Ciais, P., Peylin, P., Ramonet, M., and Monfray, P.: Inverse modeling of annual atmospheric CO2 sources and sinks, 1. Method and control inversion, J. Geophys. Res., 104, 26161–26178, https://doi.org/10.1029/1999JD900342, 1999.
Buchen, C., Roobroeck, D., Augustin, J., Behrendt, U., Boeckx, P., and Ulrich, A.: High N2O consumption potential of weakly disturbed fen mires with dissimilar denitrifier community structure, Soil Biol. Biochem., 130, 63–72, https://doi.org/10.1016/j.soilbio.2018.12.001, 2019.
Büker, P., Emberson, L. D., Ashmore, M. R., Cambridge, H. M., Jacobs, C. M. J., Massman, W. J., Müller, J., Nikolov, N., Novak, K., Oksanen, E., Schaub, M., and de la Torre, D.: Comparison of different stomatal conductance algorithms for ozone flux modelling, Environ. Pollut., 146, 726–735, https://doi.org/10.1016/j.envpol.2006.04.007, 2007.
Burkhardt, J.: Hygroscopic particles on leaves: nutrients or desiccants?, Ecol. Monogr., 80, 369–399, https://doi.org/10.1890/09-1988.1, 2010.
Burkhardt, J., Basi, S., Pariyar, S., and Hunsche, M.: Stomatal uptake of aqueous solutions – an update involving leaf surface particles, New Phytol., 196, 774–787, https://doi.org/10.1111/j.1469-8137.2012.04307.x, 2012.
Butterbach-Bahl, K., Willibald, G., and Papen, H.: Soil core method for direct simultaneous determination of N2 and N2O emissions from forest soils, Plant Soil, 240, 105–116, https://doi.org/10.1023/A:1015870518723, 2002.
Butterbach-Bahl, K. and Gundersen, P.: Nitrogen processes in terrestrial ecosystems, in: The European Nitrogen Assessment, edited by: Sutton, M., Howard, C. M., Erisman, J. W., Billen, G., Bleeker, A., Grennfelt, P., van Grinsven, H., and Grizzetti, B., Cambridge University Press, Cambridge, UK, 99–125, available at: http://www.nine-esf.org/files/ena_doc/ENA_pdfs/ENA_c6.pdf (last access: 22 August 2019), 2011.
Cameron, D. R., Van Oijen, M., Werner, C., Butterbach-Bahl, K., Grote, R., Haas, E., Heuvelink, G. B. M., Kiese, R., Kros, J., Kuhnert, M., Leip, A., Reinds, G. J., Reuter, H. I., Schelhaas, M. J., De Vries, W., and Yeluripati, J.: Environmental change impacts on the C- and N-cycle of European forests: a model comparison study, Biogeosciences, 10, 1751–1773, https://doi.org/10.5194/bg-10-1751-2013, 2013.
Cameron, D., Flechard, C., and van Oijen, M.: Calibrating a process-based forest model with a rich observational dataset at 22 European forest sites, Biogeosciences Discuss., https://doi.org/10.5194/bg-2018-156, 2018.
Campioli, M., Vicca, S., Luyssaert, S., Bilcke, J., Ceschia, E., Chapin, F. S., Ciais, P., Fernández-Martínez, M., Malhi, Y., Obersteiner, M., Olefeldt, D., Papale, D., Piao, S. L., Peñuelas, J., Sullivan, P. F., Wang, X., Zenone, T., and Janssens, I. A.: Biomass production efficiency controlled by management in temperate and boreal ecosystems, Nat. Geosci., 8, 843–846, https://doi.org/10.1038/NGEO2553, 2015.
Canadell, J. G., Kirschbaum, M. U. F., Kurz, W. A., Sanz, M.-J., Schlamadinger, B., and Yamagata, Y.: Factoring out natural and indirect human effects on terrestrial carbon sources and sinks, Environ. Sci. Policy, 10, 370–384, https://doi.org/10.1016/j.envsci.2007.01.009, 2007.
Cape, J. N., Tang, Y. S., Gonzalez-Benitez, J. M., Mitosinkova, M., Makkonen, U., Jocher, M., and Stolk, A.: Organic nitrogen in precipitation across Europe, Biogeosciences, 9, 4401–4409, https://doi.org/10.5194/bg-9-4401-2012, 2012.
CEIP (CarboEurope Integrated Project): available at: http://www.carboeurope.org/ (last access: 22 August 2019), 2011.
Chapin, F. S., Woodwell, G. M., Randerson, J. T., Rastetter, E. B., Lovett, G. M., Baldocchi, D. D., Clark, D. A., Harmon, M. E., Schimel, D. S., Valentini, R., Wirth, C., Aber, J. D., Cole, J. J., Goulden, M. L., Harden, J. W., Heimann, M., Howarth, R. W., Matson, P. A., McGuire, A. D., Melillo, J. M., Mooney, H. A., Neff, J. C., Houghton, R. A., Pace, M. L., Ryan, M. G., Running, S. W., Sala, O. E., Schlesinger, W. H., and Schulze, E.-D.: Reconciling carbon-cycle concepts, terminology, and methods, Ecosystems, 9, 1041–1050, https://doi.org/10.1007/s10021-005-0105-7, 2006.
Ciais, P., Canadell, J. G., Luyssaert, S., Chevallier, F., Shvidenko, A., Poussi, Z., Jonas, M., Peylin, P., King, A. W., Schulze, E.-D., Piao, S. L., Rodenbeck, C., Pters, W., and Breon, F. M.: Can we reconcile atmospheric estimates of Northern terrestrial carbon sink with land-based accounting?, Curr. Opin. Env. Sust., 2, 225–230, https://doi.org/10.1016/j.cosust.2010.06.008, 2010.
Ciais, P., Sabine, C., Bala, G., Bopp, L., Brovkin, V., Canadell, J., Chhabra, A., DeFries, R., Galloway, J., Heimann, M., Jones, C., Le Quéré, C., Myneni, R. B., Piao, S., and Thornton, P.: Carbon and Other Biogeochemical Cycles, in: Climate Change 2013: The Physical Science Basis. Contribution of Working Group I to the Fifth Assessment Report of the Intergovernmental Panel on Climate Change, edited by: Stocker, T. F., Qin, D., Plattner, G.-K., Tignor, M., Allen, S. K., Boschung, J., Nauels, A., Xia, Y., Bex, V., and Midgley, P. M., Cambridge University Press, Cambridge, UK and New York, NY, USA, 465–570, available at: https://www.ipcc.ch/report/ar5/wg1/carbon-and-other-biogeochemical-cycles/ (last access: 22 August 2019), 2013.
CLRTAP: Mapping critical loads for ecosystems, Chapter V of Manual on methodologies and criteria for modelling and mapping critical loads and levels and air pollution effects, risks and trends. UNECE Convention on Long-range Transboundary Air Pollution, available at: http://www.icpmapping.org (last access: 24 May 2019), 2017.
Collalti, A. and Prentice, I. C.: Is NPP proportional to GPP? Waring's hypothesis 20 years on, Tree Physiol., 39, 1473–1483, https://doi.org/10.1093/treephys/tpz034, 2019.
Dämmgen, U.: Atmospheric nitrogen dynamics in Hesse, Germany. Creating the data base, 1. Bulk deposition of acidifying and eutrophying species, Landbauforschung-Ger., 56, 117–138, 2006.
Dämmgen, U., Erisman, J. W., Cape, J. N., Grünhage, L., and Fowler, D.: Practical considerations for addressing uncertainties in monitoring bulk deposition, Environ. Pollut., 134, 535–548, https://doi.org/10.1016/j.envpol.2004.08.013, 2005.
Davidson, E. A., Keller, M., Erickson, H. E., Verchot, L. V., and Veldkamp, E.: Testing a conceptual model of soil emissions of nitrous and nitric oxides, Bioscience, 50, 667–680, https://doi.org/10.1641/0006-3568(2000)050[0667:tacmos]2.0.co;2, 2000.
De Schrijver, A., Verheyen, K., Mertens, J., Staelens, J., Wuyts, K., and Muys, B.: Nitrogen saturation and net ecosystem production, Nature, 451, E1, https://doi.org/10.1038/nature06578, 2008.
De Vries, W., van der Salm, C., Reinds, G. J., and Erisman, J. W.: Element fluxes through European forest ecosystems and their relationships with stand and site characteristics, Environ. Pollut., 148, 501–513, https://doi.org/10.1016/j.envpol.2006.12.001, 2007.
De Vries, W., Solberg, S., Dobbertin, M., Sterba, H., Laubhann, D., Reinds, G. J., Nabuurs, G. J., Gundersen, P., and Sutton, M. A.: Ecologically implausible carbon response?, Nature, 451, E1–E3, https://doi.org/10.1038/nature06579, 2008.
De Vries, W., Solberg, S., Dobbertin, M., Sterba, H., Laubhann, D., van Oijen, M., Evans, C., Gundersen, P., Kros, J., Wamelink, G. W. W., Reinds, G. J., and Sutton, M. A.: The impact of nitrogen deposition on carbon sequestration by European forests and heathlands, Forest Ecol. Manag., 258, 1814–1823, https://doi.org/10.1016/j.foreco.2009.02.034, 2009.
De Vries, W., Du, E., and Butterbach-Bahl, K.: Short and long-term impacts of nitrogen deposition on carbon sequestration by forest ecosystems, Curr. Opin. Env. Sust., 9/10, 90–104, https://doi.org/10.1016/j.cosust.2014.09.001, 2014.
De Vries, W., Posch, M., Simpson, D., and Reinds, G.J.: Modelling long-term impacts of changes in climate, nitrogen deposition and ozone exposure on carbon sequestration of European forest ecosystems, Sci. Total Environ., 605/606, 1097–1116, https://doi.org/10.1016/j.scitotenv.2017.06.132, 2017.
Dezi, S., Medlyn, B. E., Tonon, G., and Magnani, F.: The effect of nitrogen deposition on forest carbon sequestration: a model-based analysis, Glob. Change Biol., 16, 1470–1486, https://doi.org/10.1111/j.1365-2486.2009.02102.x, 2010.
Dinsmore, K. J., Billet, M. F., Skiba, U. M., Rees, R. M., Drewer, J., and Helfter, C.: Role of the aquatic pathway in the carbon and greenhouse gas budgets of a peatland catchment, Glob. Change Biol., 16, 2750–2762, https://doi.org/10.1111/j.1365-2486.2009.02119.x, 2010.
Dise, N. B. and Wright, R. F.: Nitrogen leaching from European forests in relation to nitrogen deposition, Forest Ecol. Manag., 71, 153–161, https://doi.org/10.1016/0378-1127(94)06092-W, 1995.
Dise, N. B., Rothwell, J. J., Gauci, V., van der Salm, C., and de Vries, W.: Predicting dissolved inorganic nitrogen leaching in European forests using two independent databases, Sci. Total Environ., 407, 1798–1808, https://doi.org/10.1016/j.scitotenv.2008.11.003, 2009.
Drewer, J., Lohila, A., Aurela, M., Laurila, T., Minkkinen, K., Penttilä, T., Dinsmore, K. M., McKenzie, R., Helfter, C., Flechard, C., Sutton, M. A., and Skiba, U. M.: Comparison of greenhouse gas fluxes and nitrogen budgets from an ombotrophic bog in Scotland and a minerotrophic sedge fen in Finland, Eur. J. Soil Sci., 61, 640–650, https://doi.org/10.1111/j.1365-2389.2010.01267.x, 2010.
Du, E. and de Vries, W.: Nitrogen-induced new net primary production and carbon sequestration in global forests, Environ. Pollut., 242, 1476–1487, https://doi.org/10.1016/j.envpol.2018.08.041, 2018.
Eckelmann, W., Sponagel, H., Grottenthaler, W., Hartmann, K.-J., Hartwich, R., Janetzko, P., Joisten, H., Kühn, D., Sabel, K.-J., and Traidl, R.: Ad-hoc-Arbeitsgruppe Boden, Bodenkundliche Kartieranleitung (Manual of Soil Mapping, in German), 5th Edn., E. Schweizerbart, Hannover, 438 pp., 2005.
EMEP (European Monitoring and Evaluation Programme): EMEP MSC-W modelled data, available at: http://www.emep.int/mscw/mscw_data.html (last access: 22 August 2019), 2013.
Erisman, J. W., Mennen, M. G., Fowler, D., Flechard, C. R., Spindler, G., Grüner, A., Duyzer, J. H., Ruigrok, W., and Wyers, G. P.: Towards development of a deposition monitoring network for air pollution in Europe, Report no. 722108015, RIVM, the Netherlands, available at: http://rivm.openrepository.com/rivm/bitstream/10029/10432/1/722108015.pdf (last access: 22 August 2019), 1996.
Etzold, S., Buchmann, N., and Eugster, W.: Contribution of advection to the carbon budget measured by eddy covariance at a steep mountain slope forest in Switzerland, Biogeosciences, 7, 2461–2475, https://doi.org/10.5194/bg-7-2461-2010, 2010.
Etzold, S., Ruehr, N. K., Zweifel, R., Dobbertin, M., Zingg, A., Pluess, P., Häsler, R., Eugster, W., and Buchmann, N.: The Carbon Balance of Two Contrasting Mountain Forest Ecosystems in Switzerland: Similar Annual Trends, but Seasonal Differences, Ecosystems, 14, 1289–1309, https://doi.org/10.1007/s10021-011-9481-3, 2011.
Etzold, S., Waldner, P., Thimonier, A., Schmitt, M., and Dobbertin, M.: Tree growth in Swiss forests between 1995 and 2010 in relation to climate and stand conditions: recent disturbances matter, Forest Ecol. Manag., 311, 41–55, https://doi.org/10.1016/j.foreco.2013.05.040, 2014.
European Fluxes Database Cluster: available at: http://www.europe-fluxdata.eu/ (last access: 22 August 2019), 2012.
Falge, E., Baldocchi, D., Olson, R., Anthoni, P., Aubinet, M., Bernhofer, C., Burba, G., Ceulemans, R., Clement, R., Dolman, H., Granier, A., Gross, P., Grunwald, T., Hollinger, D., Jensen, N. O., Katul, G., Keronen, P., Kowalski, A., Lai, C. T., Law, B. E., Meyers,T., Moncrieff, H., Moors, E., Munger, J. W., Pilegaard, K., Rannik,U., Rebmann, C., Suyker, A., Tenhunen, J., Tu, K., Verma, S., Vesala, T., Wilson, K., and Wofsy, S.: Gap filling strategies for defensible annual sums of net ecosystem exchange, Agr. Forest Meteorol., 107, 43–69, https://doi.org/10.1016/S0168-1923(00)00225-2, 2001.
Fernández-Martínez, M., Vicca, S., Janssens, I. A., Ciais, P., Obersteiner, M., Bartrons, M., Sardans, J., Verger, A., Canadell, J. G., Chevallier, F., Wang, X., Bernhofer, C., Curtis, P. S., Gianelle, D., Gruwald, T., Heinesch, B., Ibrom, A., Knohl, A., Laurila, T., Law, B. E., Limousin, J. M., Longdoz, B., Loustau, D., Mammarella, I., Matteucci, G., Monson, R. K., Montagnani, L., Moors, E. J., Munger, J. W., Papale, D., Piao, S. L., and Penuelas, J.: Atmospheric deposition, CO2, and change in the land carbon sink, Sci. Rep.-UK, 7, 9632, https://doi.org/10.1038/s41598-017-08755-8, 2017.
Feigenwinter, C., Bernhofer, C., Eichelmann, U., Heinesch, B., Hertel, M., Janous, D., Kolle, O., Lagergren, F., Lindroth, A., Minerbi, S., Moderow, U., Mölder, M., Montagnani, L., Queck, R., Rebmann, C., Vestin, P., Yernaux, M., Zeri, M., Ziegler, W., and Aubinet, M.: Comparison of horizontal and vertical advective CO2 fluxes at three forest sites, Agr. Forest Meteorol., 148, 12–24, https://doi.org/10.1016/j.agrformet.2007.08.013, 2008.
Flechard C. R., Nemitz E., Smith R. I., Fowler D., Vermeulen A. T., Bleeker A., Erisman J. W., Simpson D., Zhang L., Tang Y. S., and Sutton M. A.: Dry deposition of reactive nitrogen to European ecosystems: a comparison of inferential models across the NitroEurope network, Atmos. Chem. Phys., 11, 2703–2728, https://doi.org/10.5194/acp-11-2703-2011, 2011.
Flechard, C. R., Massad, R.-S., Loubet, B., Personne, E., Simpson, D., Bash, J. O., Cooter, E. J., Nemitz, E., and Sutton, M. A.: Advances in understanding, models and parameterizations of biosphere-atmosphere ammonia exchange, Biogeosciences, 10, 5183–5225, https://doi.org/10.5194/bg-10-5183-2013, 2013.
Flechard, C. R., van Oijen, M., Cameron, D. R., de Vries, W., Ibrom, A., Buchmann, N., Dise, N. B., Janssens, I. A., Neirynck, J., Montagnani, L., Varlagin, A., Loustau, D., Legout, A., Ziemblińska, K., Aubinet, M., Aurela, M., Chojnicki, B. H., Drewer, J., Eugster, W., Francez, A.-J., Juszczak, R., Kitzler, B., Kutsch, W. L., Lohila, A., Longdoz, B., Matteucci, G., Moreaux, V., Neftel, A., Olejnik, J., Sanz, M. J., Siemens, J., Vesala, T., Vincke, C., Nemitz, E., Zechmeister-Boltenstern, S., Butterbach-Bahl, K., Skiba, U. M., and Sutton, M. A.: Carbon–nitrogen interactions in European forests and semi-natural vegetation – Part 2: Untangling climatic, edaphic, management and nitrogen deposition effects on carbon sequestration potentials, Biogeosciences, 17, 1621–1654, https://doi.org/10.5194/bg-17-1621-2020, 2020.
Fleischer, K., Rebel, K. T., Van Der Molen, M. K., Erisman, J. W., Wassen, M. J., van Loon, E. E., Montagnani, L., Gough, C. M., Herbst, M., Janssens, I. A., Gianelle, D., and Dolman, A. J.: The contribution of nitrogen deposition to the photosynthetic capacity of forests, Global Biogeochem. Cy., 27, 187–199, https://doi.org/10.1002/gbc.20026, 2013.
Foken, T., Göckede, M., Mauder, M., Mahrt, L., Amiro, B. D., and Munger, J. W.: Post-field data quality control, in: Handbook of Micrometeorology: A guide for Surface Flux Measurements, edited by: Lee, X., Massman, W. J., and Law, B. E., Kluwer Academic Publishers, Dordrecht, 181–208, 2004.
F-ORE-T (Fonctionnement des Ecosystèmes Forestiers): available at: http://www.gip-ecofor.org/f-ore-t/reseau.php (last access: 22 August 2019), 2012 (in French).
Fowler, D., Pitcairn, C. E. R., Sutton, M. A., Flechard, C., Loubet, B., Coyle, M., and Munro, R. C.: The mass budget of atmospheric ammonia in woodland within 1 km of livestock buildings, Environ. Pollut., 102, 343–348, https://doi.org/10.1016/S0269-7491(98)80053-5, 1998.
Fowler, D., Pilegaard, K., Sutton, M. A., Ambus, P., Raivonen, M., Duyzer, J., Simpson, D., Fagerli, H., Fuzzi, S., Schjoerring, J. K., Granier, C., Neftel, A., Isaksen, I. S. A., Laj, P., Maione, M., Monks, P. S., Burkhardt, J., Daemmgen, U., Neirynck, J., Personne, E., Wichink-Kruit, R., Butterbach-Bahl, K., Flechard, C., Tuovinen, J.-P., Coyle, M., Gerosa, G., Loubet, B., Altimir, N., Gruenhage, L., Ammann, C., Cieslik, S., Paoletti, E., Mikkelsen, T.N., Ro-Poulsen, H., Cellier, P., Cape, J. N., Horváth, L., Loreto, F., Niinemets, Ü., Palmer, P. I., Rinne, J., Misztal, P., Nemitz, E., Nilsson, D., Pryor, S., Gallagher, M. W., Vesala, T., Skiba, U., Brüggemann, N., Zechmeister-Boltenstern, S., Williams, J., O'Dowd, C., Facchini, M. C., de Leeuw, G., Flossman, A., Chaumerliac, N., and Erisman, J. W.: Atmospheric composition change: Ecosystems–Atmosphere interactions, Atmos. Environ., 43, 5193–5267, https://doi.org/10.1016/j.atmosenv.2009.07.068, 2009.
Francez, A. J., Pinay, G., Josselin, N., and Williams, B. L.: Denitrification triggered by nitrogen addition in Sphagnum magellanicum peat, Biogeochemistry, 106, 435–441, https://doi.org/10.1007/s10533-010-9523-5, 2011.
Fratini, G., Ibrom, A., Arriga, N., Burba, G., and Papale, D.: Relative humidity effects on water vapour fluxes measured with closed-path eddy-covariance systems with short sampling lines, Agr. Forest Meteorol., 165, 53–63, https://doi.org/10.1016/j.agrformet.2012.05.018, 2012.
Frolking, S., Roulet, N., and Fuglestvedt, J.: How northern peatlands influence the Earth's radiative budget: Sustained methane emission versus sustained carbon sequestration, J. Geophys Res., 111, G01008, https://doi.org/10.1029/2005JG000091, 2006.
Gaige, E., Dail, D. B., Hollinger, D. Y., Davidson, E. A., Fernandez, I. J., Sievering, H., White, A., and Halteman, W.: Changes in canopy processes following whole-forest canopy nitrogen fertilization of a mature Spruce-Hemlock forest, Ecosystems, 10, 1133–1147, https://doi.org/10.1007/s10021-007-9081-4, 2007.
GHG-Europe: available at: http://www.europe-fluxdata.eu/ghg-europe (last access: 22 August 2019), 2012.
Gielen, B., Neirynck, J., Luyssaert, S., and Janssens, I. A.: The importance of dissolved organic carbon fluxes for the carbon balance of a temperate Scots pine forest, Agr. Forest Meteorol., 151, 270–278, https://doi.org/10.1016/j.agrformet.2010.10.012, 2011.
Göckede, M., Foken, T., Aubinet, M., Aurela, M., Banza, J., Bernhofer, C., Bonnefond, J. M., Brunet, Y., Carrara, A., Clement, R., Dellwik, E., Elbers, J., Eugster, W., Fuhrer, J., Granier, A., Grünwald, T., Heinesch, B., Janssens, I. A., Knohl, A., Koeble, R., Laurila, T., Longdoz, B., Manca, G., Marek, M., Markkanen, T., Mateus, J., Matteucci, G., Mauder, M., Migliavacca, M., Minerbi, S., Moncrieff, J., Montagnani, L., Moors, E., Ourcival, J.-M., Papale, D., Pereira, J., Pilegaard, K., Pita, G., Rambal, S., Rebmann, C., Rodrigues, A., Rotenberg, E., Sanz, M. J., Sedlak, P., Seufert, G., Siebicke, L., Soussana, J. F., Valentini, R., Vesala, T., Verbeeck, H., and Yakir, D.: Quality control of CarboEurope flux data – part 1: coupling footprint analyses with flux data quality assessment to evaluate sites in forest ecosystems, Biogeosciences, 5, 433–450, https://doi.org/10.5194/bg-5-433-2008, 2008.
Goodale, C. L., Apps, M. J., Birdsey, R. A., Field, C. B., Heath, L. S., Houghton, R. A., Jenkins, J. C., Kohlmaier, G. H., Kurz, W., Liu, S., Nabuurs, G. J., Nilsson, S., and Shvidenko, A. Z.: Forest carbon sink in North Hemisphere, Ecol. Appl., 12, 891–899, https://doi.org/10.1890/1051-0761(2002)012[0891:FCSITN]2.0.CO;2, 2002.
Grote, R., Morfopoulos, C., Niinemets, U., Sun, Z., Keenan, T. F., Pacifico, F., and Butler, T.: A fully integrated isoprenoid emissions model coupling emissions to photosynthetic characteristics, Plant Cell Environ., 37, 1965–1980, https://doi.org/10.1111/pce.12326, 2014.
Gu, L., Falge, E., Boden, T., Baldocchi, D. D., Black, T. A., Saleska, S. R., Suni, T., Vesala, T., Wofsy, S., and Xu, L.: Observing threshold determination for night-time eddy flux filtering, Agr. Forest Meteorol., 128, 179–197, https://doi.org/10.1016/j.agrformet.2004.11.006, 2005.
Gundale, M. J., From, F., Back-Holmen, L., and Nordin, A.: Nitrogen deposition in boreal forests has a minor impact on the global carbon cycle, Glob. Change Biol., 20, 276–286, https://doi.org/10.1111/gcb.12422, 2014.
Hansen, K., Sørensen, L. L., Hertel, O., Geels, C., Skjøth, C. A., Jensen, B., and Boegh, E.: Ammonia emissions from deciduous forest after leaf fall, Biogeosciences, 10, 4577–4589, https://doi.org/10.5194/bg-10-4577-2013, 2013.
Hansen, K., Personne, E., Skjøth, C. A., Loubet, B., Ibrom, A., Jensen, R., Sørensen, L. L., and Boegh, E.: Investigating sources of measured forest-atmosphere ammonia fluxes using two-layer bi-directional modelling, Agr. Forest Meteorol., 237/238, 80–94, https://doi.org/10.1016/j.agrformet.2017.02.008, 2017.
Harrison, A. F., Harkness, D. D., Rowland, A. P., Garnett, J. S., and Bacon, P. J.: Annual carbon and nitrogen fluxes along the European forest transect, determined using 14C-bomb, in: Carbon and nitrogen cycling in European forest ecosystems, edited by: Schulze, E. D., Ecol. Stud., 142, Springer, Berlin, Heidelberg, New York, 237–256, https://doi.org/10.1007/978-3-642-57219-7, 2000.
Hendriks, D. M. D., van Huissteden, J., Dolman, A. J., and van der Molen, M.K.: The full greenhouse gas balance of an abandoned peat meadow, Biogeosciences, 4, 411–424, https://doi.org/10.5194/bg-4-411-2007, 2007.
Högberg, P., Fan, H., Quist, M., Binkley, D., and Tamm, C. O.: Tree growth and soil acidification in response to 30 years of experimental nitrogen loading on boreal forest, Glob. Change Biol., 12, 489–499, https://doi.org/10.1111/j.1365-2486.2006.01102.x, 2006.
Högberg, P.: Nitrogen impacts on forest carbon, Nature, 447, 781–782, https://doi.org/10.1038/447781a, 2007.
Ibrom, A., Dellwik, E., Larsen, S. E., and Pilegaard, K.: Strong low-pass filtering effects on water vapour flux measurements with closed-path eddy correlation systems, Agr. Forest Meteorol., 147, 140–156, https://doi.org/10.1016/j.agrformet.2007.07.007, 2007.
ICP: International Co-operative Programme on Assessment and Monitoring of Air Pollution Effects on Forests, available at: http://icp-forests.net/ (last access: 22 August 2019), 2019.
Ilvesniemi, H., Levula, J., Ojansuu, R., Kolari, P., Kulmala, L., Pumpanen, J., Launiainen, S., Vesala, T., and Nikinmaa, E.: Long-term measurements of the carbon balance of a boreal Scots pine dominated forest ecosystem, Boreal Environ. Res., 14, 731–753, available at: http://www.borenv.net/BER/pdfs/ber14/ber14-731.pdf (last access: 22 August 2019), 2009.
IPCC: Climate Change 2013: The Physical Science Basis. Contribution of Working Group I to the Fifth Assessment Report of the Intergovernmental Panel on Climate Change, edited by: Stocker, T. F., Qin, D., Plattner, G.-K., Tignor, M., Allen, S. K., Boschung, J., Nauels, A., Xia, Y., Bex, V., and Midgley, P. M., Cambridge University Press, Cambridge, UK and New York, NY, USA, 1535 pp., available at: https://www.ipcc.ch/report/ar5/wg1/ (last access: 22 August 2019), 2013.
Jacobsen, C., Rademacher, P., Meesenburg, H., and Meiwes, K. J.: Gehalte chemischer Elemente in Baumkompartimenten, Niedersächsische Forstliche Versuchs-anstalt Göttingen, im Auftrag des Bundesministeriums für Verbraucher-schutz, Ernährung und Landwirtschaft (BMVEL) (in German), Bonn, 80 pp., available at: https://www.nw-fva.de/fileadmin/user_upload/Verwaltung/Publikationen/2003/Jacobsen_et_al_2003_Elemengehalte_Biomasse.pdf (last access: 22 August 2019), 2003.
Juszczak, R. and Augustin, J.: Exchange of the greenhouse gases methane and nitrous oxide at a temperate pristine fen mire in Central Europe, Wetlands, 33, 895–907, https://doi.org/10.1007/s13157-013-0448-3, 2013.
Kanakidou, M., Myriokefalitakis, S., Daskalakis, N., Fanourgakis, G.S., Nenes, A., Baker, A.R.,Tsigaridis, K., and Mihalopoulos, N.: Past, present, and future atmospheric nitrogen deposition, J. Atmos. Sci., 73, 2039–2047, https://doi.org/10.1175/JAS-D-15-0278.1, 2016.
Kindler, R., Siemens, J., Kaiser, K., Walmsley, D. C., Bernhofer, C., Buchmann, N., Cellier, P., Eugster, W., Gleixner, G., Grunwald, T., Heim, A., Ibrom, A., Jones, S. K., Jones, M., Klumpp, K., Kutsch, W., Larsen, K.S., Lehuger, S., Loubet, B, McKenzie, R., Moors, E., Osborne, B., Pilegaard, K., Rebmann, C., Saunders, M., Schmidt, M. W. I., Schrumpf, M., Seyfferth, J., Skiba, U., Soussana, J.-F., Sutton, M. A., Tefs, C., Vowinckel, B., Zeeman, M. J., and Kaupenjohann, M.: Dissolved carbon leaching from soil is a crucial component of the net ecosystem carbon balance, Glob. Change Biol., 17, 1167–1185, https://doi.org/10.1111/j.1365-2486.2010.02282.x, 2011.
Kok, B.: On the interrelation of respiration and photosynthesis in green plants, Biochim. Biophys. Acta, 3, 625–631, https://doi.org/10.1016/0006-3002(49)90136-5, 1949.
Korhonen, J. F. J., Pihlatie, M., Pumpanen, J., Aaltonen, H., Hari, P., Levula, J., Kieloaho, A.-J., Nikinmaa, E., Vesala, T., and Ilvesniemi, H.: Nitrogen balance of a boreal Scots pine forest, Biogeosciences, 10, 1083–1095, https://doi.org/10.5194/bg-10-1083-2013, 2013.
Kowalska, N., Chojnicki, B. H., Rinne, J., Haapanala, S., Siedlecki, P., Urbaniak, M., Juszczak, R., and Olejnik, J.: Measurements of methane emission from a temperate wetland by the eddy covariance method, Int. Agrophys., 27, 283–290, https://doi.org/10.2478/v10247-012-0096-5, 2013.
Kutsch, W. L. and Kolari, P.: Data quality and the role of nutrients in forest carbon-use efficiency, Nat. Clim. Change, 5, 959–960, https://doi.org/10.1038/nclimate2793, 2015.
Lasslop, G., Reichstein, M., Papale, D., Richardson, A. D., Arneth, A., Barr, A., Stoy, P., and Wohlfahrt, G.: Separation of net ecosystem exchange into assimilation and respiration using a light response curve approach: critical issues and global evaluation, Glob. Change Biol., 16, 187–208, https://doi.org/10.1111/j.1365-2486.2009.02041.x, 2010.
Laubhann, D., Sterba, H., Reinds, G. J., and de Vries, W.: The impact of atmospheric deposition and climate on forest growth in European monitoring plots: An empirical tree growth model, Forest Ecol. Manag., 258, 1751–1761, https://doi.org/10.1016/j.foreco.2008.09.050, 2009.
Lee, X., Massman, W., and Law, B. (Eds.): Handbook of micrometeorology. A guide for surface flux measurement and analysis, Atmos. Ocean. Sci. Lib., 29, ISBN 1-4020-2264-6, Kluwer Academic Publishers, Dordrecht, 250 pp., 2004.
Legout, A., Hansson, K., Van der Heijden, G., Laclau, J.-P., Augusto, L., and Ranger, J.: Fertilité chimique des sols forestiers: concepts de base, Revue forestière française, 4, 413–424, https://doi.org/10.4267/2042/56556, 2014 (in French).
Legout, A., van der Heijden, G., Jaffrain, J., Boudot, J.-P., and Ranger, J.: Tree species effects on solution chemistry and major element fluxes: A case study in the Morvan (Breuil, France), Forest Ecol. Manag., 378, 244–258, https://doi.org/10.1016/j.foreco.2016.07.003, 2016.
Le Quéré, C., Andrew, R. M., Friedlingstein, P., Sitch, S., Hauck, J., Pongratz, J., Pickers, P. A., Korsbakken, J. I., Peters, G. P., Canadell, J. G., Arneth, A., Arora, V. K., Barbero, L., Bastos, A., Bopp, L., Chevallier, F., Chini, L. P., Ciais, P., Doney, S. C., Gkritzalis, T., Goll, D. S., Harris, I., Haverd, V., Hoffman, F. M., Hoppema, M., Houghton, R. A., Hurtt, G., Ilyina, T., Jain, A. K., Johannessen, T., Jones, C. D., Kato, E., Keeling, R. F., Goldewijk, K. K., Landschützer, P., Lefèvre, N., Lienert, S., Liu, Z., Lombardozzi, D., Metzl, N., Munro, D. R., Nabel, J. E. M. S., Nakaoka, S.-I., Neill, C., Olsen, A., Ono, T., Patra, P., Peregon, A., Peters, W., Peylin, P., Pfeil, B., Pierrot, D., Poulter, B., Rehder, G., Resplandy, L., Robertson, E., Rocher, M., Rödenbeck, C., Schuster, U., Schwinger, J., Séférian, R., Skjelvan, I., Steinhoff, T., Sutton, A., Tans, P. P., Tian, H., Tilbrook, B., Tubiello, F. N., van der Laan-Luijkx, I. T., van der Werf, G. R., Viovy, N., Walker, A. P., Wiltshire, A. J., Wright, R., Zaehle, S., and Zheng, B.: Global Carbon Budget 2018, Earth Syst. Sci. Data, 10, 2141–2194, https://doi.org/10.5194/essd-10-2141-2018, 2018.
Limpens, J., Granath, G., Gunnarsson, U., Aerts, R., Bayley, S., Bragazza, L., Bubier, J., Buttler, A., van den Berg, L. J. L., Francez, A.-J., Gerdol, R., Grosvernier, P., Heijmans, M. M. P. D., Hoosbeek, M. R., Hotes, S., Ilomets, M., Leith, I., Mitchell, E. A. D., Moore, T., Nilsson, M. B., Nordbakken, J-F., Rochefort, L., Rydin, H., Sheppard, L. J., Thormann, M., Wiedermann, M. M., Williams, B. L., and Xu, B.: Climatic modifiers of the response to nitrogen deposition in peat-forming Sphagnum mosses: a meta-analysis, New Phytol., 191, 496–507, https://doi.org/10.1111/j.1469-8137.2011.03680.x, 2011.
Liu, L. and Greaver, T. L.: A review of nitrogen enrichment effects on three biogenic GHGs: the CO2 sink may be largely offset by stimulated N2O and CH4 emission, Ecol. Lett., 12, 1103–1117, https://doi.org/10.1111/j.1461-0248.2009.01351.x, 2009.
Loescher, H. W., Law, B. E., Mahrt, L., Hollinger, D. Y., Campbell, J., and Wofsy, S. C.: Uncertainties in, and interpretation of, carbon flux estimates using the eddy covariance technique, J. Geophys. Res., 111, D21S90, https://doi.org/10.1029/2005JD006932, 2006.
Loubet, B., Asman, W. A., Theobald, M. R., Hertel, O., Tang, Y. S., Robin, P., Hassouna, M., Daemmgen, U., Genermont, S., Cellier, P., and Sutton, M. A.: Ammonia Deposition near Hot Spots: Processes, Models and Monitoring Methods, in: Atmospheric Ammonia. Detecting Emissions Changes and Environmental Impacts, edited by: Sutton, M. A., Reis, S., and Baker, S. M., Springer, Dordrecht, the Netherlands, 205–267, https://doi.org/10.1007/978-1-4020-9121-6_15, 2009.
Luo, G. J., Brüggemann, N., Wolf, B., Gasche, R., Grote, R., and Butterbach-Bahl, K.: Decadal variability of soil CO2, NO, N2O, and CH4 fluxes at the Höglwald Forest, Germany, Biogeosciences, 9, 1741–1763, https://doi.org/10.5194/bg-9-1741-2012, 2012.
Luyssaert, S., Inglima, I., Jung, M., Richardson, A. D., Reichstein, M., Papale, D., Piao, S. L., Schulzes, E. D., Wingate, L., Matteucci, G., Aragao, L., Aubinet, M., Beers, C., Bernhofer, C., Black, K. G., Bonal, D., Bonnefond, J. M., Chambers, J., Ciais, P., Cook, B., Davis, K. J., Dolman, A. J., Gielen, B., Goulden, M., Grace, J., Granier, A., Grelle, A., Griffis, T., Grünwald, T., Guidolotti, G., Hanson, P. J., Harding, R., Hollinger, D. Y., Hutyra, L. R., Kolar, P., Kruijt, B., Kutsch, W., Lagergren, F., Laurila, T., Law, B. E., Le Maire, G., Lindroth, A., Loustau, D., Malhi, Y., Mateus, J., Migliavacca, M., Misson, L., Montagnani, L., Moncrieff, J., Moors, E., Munger, J. W., Nikinmaa, E., Ollinger, S. V., Pita, G., Rebmann, C., Roupsard, O., Saigusa, N., Sanz, M. J., Seufert, G., Sierra, C., Smith, M. L., Tang, J., Valentini, R., Vesala, T., and Janssens, I. A.: CO2 balance of boreal, temperate, and tropical forests derived from a global database, Glob. Change Biol., 13, 2509–2537, https://doi.org/10.1111/j.1365-2486.2007.01439.x, 2007.
Magnani, F., Mencuccini, M., Borghetti, M., Berbigier, P., Berninger, F., Delzon, S., Grelle, A., Hari, P., Jarvis, P. G., Kolari, P., Kowalski, A. S., Lankreijer, H., Law, B. E., Lindroth, A., Loustau, D., Manca, G., Moncrieff, J. B., Rayment, M., Tedeschi, V., Valentini, R., and Grace, J.: The human footprint in the carbon cycle of temperate and boreal forests, Nature, 447, 848–850, https://doi.org/10.1038/nature05847, 2007.
Magnani, F., Mencuccini, M., Borghetti, M., Berninger, F., Delzon, S., Grelle, A., Hari, P., Jarvis, P. G., Kolari, P., Kowalski, A. S., Lankreijer, H., Law, B. E., Lindroth, A., Loustau, D., Manca, G., Moncrieff, J. B., Tedeschi, V., Valentini, R., and Grace, J.: Reply to A. De Schrijver et al. (2008) and W. de Vries et al. (2008), Nature, 451, E3–E4, https://doi.org/10.1038/nature06580, 2008.
Mammarella, I., Peltola, O., Nordbo, A., Järvi, L., and Rannik, Ü. : Quantifying the uncertainty of eddy covariance fluxes due to the use of different software packages and combinations of processing steps in two contrasting ecosystems, Atmos. Meas. Tech., 9, 4915–4933, https://doi.org/10.5194/amt-9-4915-2016, 2016.
Mauder, M., Foken, T., Bernhofer, C., Clement, R., Elbers, J., Eugster, W., Grünwald, T., Heusinkveld, B., and Kolle, O.: Quality control of CarboEurope flux data – Part 2: Inter-comparison of eddy-covariance software, Biogeosciences, 5, 451–462, https://doi.org/10.5194/bg-5-451-2008, 2008.
Medinets, S., Gasche, R., Skiba, U., Schindlbacher, A., Kiese, R., and Butterbach-Bahl, K.: Cold season soil NO fluxes from a temperate forest: Drivers and contribution to annual budgets, Environ. Res. Lett., 11, 114012, https://doi.org/10.1088/1748-9326/11/11/114012, 2016.
Montagnani, L., Manca, G., Canepa, E., Georgieva, E., Acosta, M., Feigenwinter, C., Janous, D., Kerschbaumer, G., Lindroth, A., Minach, L., Minerbi, S., Mölder, M., Pavelka, M., Seufert, G., Zeri, M., and Ziegler, W.: A new mass conservation approach to the study of CO2 advection in an alpine forest, J. Geophys. Res.-Atmos., 114, D07306, https://doi.org/10.1029/2008JD010650, 2009.
Montagnani, L., Manca, G., Canepa, E., and Georgieva, E.: Assessing the method-specific differences in quantification of CO2 advection at three forest sites during the ADVEX campaign, Agr. Forest Meteorol., 150, 702–711, https://doi.org/10.1016/j.agrformet.2010.01.013, 2010.
Monteith, J. L. and Unsworth, M. H.: Principles of Environmental Physics, 2nd Edn., Edward Arnold, London, 291 pp., 1990.
Morison, J., Matthews, R., Miller, G., Perks, M., Randle, T., Vanguelova, E., White, M., and Yamulki, S.: Understanding the carbon and greenhouse gas balance of forests in Britain, Forestry Commission Research Report, Forestry Commission, Edinburgh, UK, 149 pp., 2012.
Nadelhoffer, K. J., Emmett, B. A., Gundersen, P., Kjønaas, O. J., Koopmansk, C. J., Schleppi, P., Tietemak, A., and Wright, R. F.: Nitrogen deposition makes a minor contribution to carbon sequestration in temperate forests, Nature, 398, 145–148, https://doi.org/10.1038/18205, 1999.
Nair, R. K. F., Perks, M. P., Weatherall, A., Baggs, E. M., and Mencuccini, M.: Does canopy nitrogen uptake enhance carbon sequestration by trees?, Glob. Change Biol., 22, 875–888, https://doi.org/10.1111/gcb.13096, 2016.
Neirynck, J., Kowalski, A. S., Carrara, A., Genouw, G., Berghmans, P., and Ceulemans, R.: Fluxes of oxidised and reduced nitrogen above a mixed coniferous forest exposed to various nitrogen emission sources, Environ. Pollut., 149, 31–43, https://doi.org/10.1016/j.envpol.2006.12.029, 2007.
Nemitz, E., Mammarella, I., Ibrom, A., Aurela, M., Burba, G. G., Dengel, S., Gielen, B., Grelle, A., Heinesch, B., Herbst, M., Hörtnagel, L., Klemedtsson, L., Lindroth, A., Lohila, A., McDermitt, D. K., Meier, P., Merbold, L., Nelson, D., Nicolini, G., Nilsson, M. B., Peltola, O., Rinne, J., and Zahniser, M.: Standardisation of eddy-covariance flux measurements of methane and nitrous oxide, Int. Agrophys., 32, 517–549, https://doi.org/10.1515/intag-2017-0042, 2018.
NEU (NitroEurope Integrated Project): available at: http://www.nitroeurope.ceh.ac.uk (last access: 22 August 2019), 2013.
Nykänen, H., Vasander, H., Huttunen, J. T., and Martikainen, P. J.: Effect of experimental nitrogen load on methane and nitrous oxide fluxes on ombrotrophic boreal peatland, Plant Soil, 242, 147–155, https://doi.org/10.1023/A:1019658428402, 2002.
Pan, Y., Birdsey, R. A., Fang, J., Houghton, R., Kauppi, P. E., Kurz, W. A., Phillips, O. L., Shvidenko, A., Lewis, S. L., Canadell, J. G., Ciais, P., Jackson, R. B., Pacala, S. W., McGuire, A. D., Piao, S., Rautiainen, A., Sitch, S., and Hayes, D.: A large and persistent carbon sink in the world's forests, Science, 333, 988–993, https://doi.org/10.1126/science.1201609, 2011.
Papale, D., Reichstein, M., Aubinet, M., Canfora, E., Bernhofer, C., Kutsch, W., Longdoz, B., Rambal, S., Valentini, R., Vesala, T., and Yakir, D.: Towards a standardized processing of Net Ecosystem Exchange measured with eddy covariance technique: algorithms and uncertainty estimation, Biogeosciences, 3, 571–583, https://doi.org/10.5194/bg-3-571-2006, 2006.
Parkin, T. B.: Effect of sampling frequency on estimates of cumulative nitrous oxide emissions, J. Environ. Qual., 37, 1390–1395, https://doi.org/10.2134/jeq2007.0333, 2008.
Paul-Limoges, E., Wolf, S., Eugster, W., Hörtnagl, L., and Buchmann, N.: Below-canopy contributions to ecosystem CO2 fluxes in a temperate mixed forest in Switzerland, Agr. Forest Meteorol., 247, 582–596, https://doi.org/10.1016/j.agrformet.2017.08.011, 2017.
Pearson, T. R. H, Brown, S., Murray, L., and Sidman, G.: Greenhouse gas emissions from tropical forest degradation: an underestimated source, Carbon Balance Management, 12, 1–11, https://doi.org/10.1186/s13021-017-0072-2, 2017.
Persson, T., Karlsson, P. S., Seyferth, U., Sjöberg, R. M., and Rudebeck, A.: Carbon mineralization in European forest soils, in: Carbon and nitrogen cycling in European forest ecosystems, edited by: Schulze, E. D., Ecol. Stud., 142, Springer, Berlin, Heidelberg, New York, 257–275, https://doi.org/10.1007/978-3-642-57219-7, 2000.
Pilegaard, K.: Processes regulating nitric oxide emissions from soils, Philos. T. R. Soc. B, 368, 1–8, https://doi.org/10.1098/rstb.2013.0126, 2013.
Pilegaard, K., Skiba, U., Ambus, P., Beier, C., Brüggemann, N., Butterbach-Bahl, K., Dick, J., Dorsey, J., Duyzer, J., Gallagher, M., Gasche, R., Horvath, L., Kitzler, B., Leip, A., Pihlatie, M. K., Rosenkranz, P., Seufert, G., Vesala, T., Westrate, H., and Zechmeister-Boltenstern, S.: Factors controlling regional differences in forest soil emission of nitrogen oxides (NO and N2O), Biogeosciences, 3, 651–661, https://doi.org/10.5194/bg-3-651-2006, 2006.
Pilegaard, K., Ibrom, A., Courtney, M. S., Hummelshøj, P., and Jensen, N. O.: Increasing net CO2 uptake by a Danish beech forest during the period from 1996 to 2009, Agr. Forest Meteorol., 151, 934–946, https://doi.org/10.1016/j.agrformet.2011.02.013, 2011.
Pregitzer, K. S., Burton, A. J., Zak, D. R., and Talhelm, A. F.: Simulated chronic nitrogen deposition increases carbon storage in Northern Temperate forests, Glob. Change Biol., 14, 142–153, https://doi.org/10.1111/j.1365-2486.2007.01465.x, 2008.
Reay, D. S., Dentener, F., Smith, P., Grace, J., and Feely, R. A.: Global nitrogen deposition and carbon sinks, Nat. Geosci., 1, 430–437, https://doi.org/10.1038/ngeo230, 2008.
REddyProc: R package for Post Processing of (Half-)Hourly Eddy-Covariance Measurements, available at: https://cran.r-project.org/web/packages/REddyProc/REddyProc.pdf (last access: 22 August 2019) and https://www.bgc-jena.mpg.de/bgi/index.php/Services/REddyProcWeb (last access: 22 August 2019), 2019.
Reichstein, M., Falge, E., Baldocchi, D., Papale, D., Aubinet, M., Berbigier, P., Bernhofer, C., Buchmann, N., Gilmanov, T., Granier, A., Grünwald, T., Havránková, K., Ilvesniemi, H., Janous, D., Knohl, A., Laurila, T., Lohila, A., Loustau, D., Matteucci, G., Meyers, T., Miglietta, F., Ourcival, J.-M., Pumpanen, J., Rambal, S., Rotenberg, E., Sanz, M., Tenhunen, J., Seufert, G., Vaccari, F., Vesala, T., Yakir, D., and Valentini, R.: On the separation of net ecosystem exchange into assimilation and ecosystem respiration: review and improved algorithm, Glob. Change Biol., 11, 1424–1439, https://doi.org/10.1111/j.1365-2486.2005.001002.x, 2005.
Risk, N., Snider, D., and Wagner-Riddle, C.: Mechanisms leading to enhanced soil nitrous oxide fluxes induced by freeze-thaw cycles, Can. J. Soil Sci., 93, 401–414, https://doi.org/10.4141/CJSS2012-071, 2013.
Sanz, M. J., Carratalá, A., Gimeno, C., and Millán, M. M.: Atmospheric nitrogen deposition on the east coast of Spain: relevance of dry deposition in semi-arid Mediterranean regions, Environ. Pollut., 118, 259–272, https://doi.org/10.1016/S0269-7491(01)00318-9, 2002.
Schaufler, G., Kitzler, B., Schindlbacher, A., Skiba, U., Sutton, M. A., and Zechmeister-Boltenstern, S.: Greenhouse gas emissions from European soils under different land use: effects of soil moisture and temperature, Eur. J. Soil Sci., 61, 683–696, https://doi.org/10.1111/j.1365-2389.2010.01277.x, 2010.
Schulte-Uebbing, L. and de Vries, W.: Global-scale impacts of nitrogen deposition on tree carbon sequestration in tropical, temperate and boreal forests: A meta-analysis, Glob. Change Biol., 24, 416–431, https://doi.org/10.1111/gcb.13862, 2018.
Schulze, E.-D., Ciais, P., Luyssaert, S., Schrumpf, M., Janssens, I. A., Thiruchittampalam, B., Theloke, J., Saurat, M., Bringezu, S., Lelieveld, J., Lohila, A., Rebmann, C., Jung, M., Bastviken, D., Abril, G., Grassi, G., Leip, A., Freibauer, A., Kutsch, W., Don, A., Nieschulze, J., Börner, A., Gash, J. H., and Dolman, A. J.: The European carbon balance, Part 4: integration of carbon and other trace-gas ?uxes, Glob. Change Biol., 16, 1451–1469, https://doi.org/10.1111/j.1365-2486.2010.02215.x, 2010.
Schwede, D. B., Simpson, D., Tan, J., Fu, J. S., Dentener, F., Du, E., and de Vries, W.: Spatial variation of modelled total, dry and wet nitrogen deposition to forests at global scale, Environ. Pollut., 243, 1287–1301, https://doi.org/10.1016/j.envpol.2018.09.084, 2018.
Shvaleva, A., Lobo-do-Vale, R., Cruz, C., Castaldi, S., Rosa, A. P., Chaves, M. M., and Pereira, J. S.: Soil-atmosphere greenhouse gases (CO2, CH4 and N2O) exchange in evergreen oak woodland in southern Portugal, Plant Soil Environ., 57, 471–477, https://doi.org/10.17221/223/2011-PSE, 2011.
Siemens, J. and Kaupenjohann, M.: Contribution of dissolved organic nitrogen to N leaching from four German agricultural soils, J. Plant Nutr. Soil Sc., 165, 675–681, https://doi.org/10.1002/jpln.200290002, 2002.
Simpson, D. and Tuovinen, J. P.: ECLAIRE Ecosystem Surface Exchange model (ESX), in: Transboundary particulate matter, photo-oxidants, acidifying and eutrophying components, EMEP Status Report 1/2014, Norwegian Meteorological Institute, Norway, 147–154, available at: https://emep.int/publ/reports/2014/EMEP_Status_Report_1_2014.pdf (last access: 22 August 2019), 2014.
Simpson, D., Butterbach-Bahl, K., Fagerli, H., Kesik, M., Skiba, U., and Tang, S.: Deposition and Emissions of Reactive Nitrogen over European Forests: A Modelling Study, Atmos. Environ., 40, 5712–5726, https://doi.org/10.1016/j.atmosenv.2006.04.063, 2006a.
Simpson, D., Fagerli, H., Hellsten, S., Knulst, J., and Westling, O.: Comparison of modelled and monitored deposition fluxes of sulphur and nitrogen to ICP-forest sites in Europe, Biogeosciences, 3, 337–355, https://doi.org/10.5194/bg-3-337-2006, 2006b.
Simpson, D., Benedictow, A., Berge, H., Bergström, R., Emberson, L. D., Fagerli, H., Flechard, C. R., Hayman, G. D., Gauss, M., Jonson, J. E., Jenkin, M. E., Nyíri, A., Richter, C., Semeena, V. S., Tsyro, S., Tuovinen, J.-P., Valdebenito, Á., and Wind, P.: The EMEP MSC-W chemical transport model – technical description, Atmos. Chem. Phys., 12, 7825–7865, https://doi.org/10.5194/acp-12-7825-2012, 2012.
Simpson, D., Andersson, C., Christensen, J. H., Engardt, M., Geels, C., Nyiri, A., Posch, M., Soares, J., Sofiev, M., Wind, P., and Langner, J.: Impacts of climate and emission changes on nitrogen deposition in Europe: a multi-model study, Atmos. Chem. Phys., 14, 6995–7017, https://doi.org/10.5194/acp-14-6995-2014, 2014.
Skiba, U., Drewer, J., Tang, Y. S., van Dijk, N., Helfter, C., Nemitz, E., Famulari, D., Cape, J. N., Jones, S. K., Twigg, M., Pihlatie, M., Vesala, T., Larsen, K. S., Carter, M. S., Ambus, P., Ibrom, A., Beier, C., Hensen, A., Frumau, A., Erisman, J. W., Bruggemann, N., Gasche, R., Butterbach-Bahl, K., Neftel, A., Spirig, C., Horvath, L., Freibauer, A., Cellier, P., Laville, P., Loubet, B., Magliulo, E., Bertolini, T., Seufert, V, Andersson, M., Manca, G., Laurila, T., Aurela, M., Lohila, A., Zechmeister-Boltenstern, S., Kitzler, B., Schaufler, G., Siemens, J., Kindler, R., Flechard, C. R., and Sutton, M. A.: Biosphere-atmosphere exchange of reactive nitrogen and greenhouse gases at the NitroEurope core flux measurement sites: Measurement strategy and first data sets, Agr. Ecosyst. Environ., 133, 139–149, https://doi.org/10.1016/j.agee.2009.05.018, 2009.
Smith, K. A., Dobbie, K. E., Ball, B. C., Bakken, L. R., Sitaula, B. K., Hansen, S., Brumme, R., Borken, W., Kristensen, S., Prieme, A., Fowler, D., Macdonald, J. A., Skiba, U., Klemedtsson, L., Kasimir-Klemedtsson, A., Degorska, A., and Orlanski, P.: Oxidation of atmospheric methane in Northern European soils, comparison with other ecosystems, and uncertainties in the global terrestrial sink, Glob. Change Biol., 6, 791–803, https://doi.org/10.1046/j.1365-2486.2000.00356.x, 2000.
Solberg, S., Dobbertin, M., Reinds, G. J., Andreassen, K., Lange, H., Garcia Fernandez, P., Hildingsson, A., and de Vries, W.: Analyses of the impact of changes in atmospheric deposition and climate on forest growth in European monitoring plots: A stand growth approach, Forest Ecol. Manag., 258, 1735–1750, https://doi.org/10.1016/j.foreco.2008.09.057, 2009.
Steudler, P. A., Bowden, R. D., Melillo, J. M., and Aber, J. D.: Influence of nitrogen fertilization on methane uptake in temperate forest soils, Nature, 341, 314–316, https://doi.org/10.1038/341314a0, 1989.
Stephens, B. B., Gurney, K. R., Tans, P. P., Sweeney, C., Peters, W., Bruhwiler, L., Ciais, P., Ramonet, M., Bousquet, P., Nakazawa, T., Aoki, S., Machida, T., Inoue, G., Vinnichenko, N., Lloyd, J., Jordan, A., Heimann, M., Shibistova, O., Langenfelds, R. L., Steele, L. P., Francey, R. J., Denning, A. S.: Weak northern and strong tropical land carbon uptake from vertical profiles of atmospheric CO2, Science, 316, 1732–1735, https://doi.org/10.1126/science.1137004, 2007.
Subke, J.-A., Inglima, I., and Cotrufo, M. F.: Trends and methodological impacts in soil CO2 efflux partitioning: A meta-analytical review, Glob. Change Biol., 12, 921–943, https://doi.org/10.1111/j.1365-2486.2006.01117.x, 2006.
Sutton, M. A. and Reis, S. (Eds): The nitrogen cycle and its influence on the European greenhouse gas balance, NitroEurope final project report, Center for Ecology and Hydrology, UK, 44 pp., 2011.
Sutton, M. A., Tang, Y. S., Miners, B., and Fowler, D.: A new diffusion denuder system for long-term, regional monitoring of atmospheric ammonia and ammonium, Water Air Soil Poll. Focus, 1, 145–156, https://doi.org/10.1023/A:1013138601753, 2001.
Sutton, M. A., Simpson, D., Levy, P. E., Smith, R. I., Reis, S., van Oijen, M., and de Vries, W.: Uncertainties in the relationship between atmospheric nitrogen deposition and forest carbon sequestration, Glob. Change Biol., 14, 2057–2063, https://doi.org/10.1111/j.1365-2486.2008.01636.x, 2008.
Swinbank, W. C.: The measurement of vertical transfer of heat and water vapor by eddies in the lower atmosphere, J. Meteorol., 8, 135–145, 1951.
Tang, Y. S., Simmons, I., van Dijk, N., Di Marco, C., Nemitz, E., Dämmgen, U., Gilke, K., Djuricic, V., Vidic, S., Gliha, Z., Borovecki, D., Mitosinkova, M., Hanssen, J. E., Uggerud, T. H., Sanz, M. J., Sanz, P., Chorda, J. V., Flechard, C. R., Fauvel, Y., Ferm, M., Perrino, C., and Sutton, M. A.: European scale application of atmospheric reactive nitrogen measurements in a low-cost approach to infer dry deposition fluxes, Agr. Ecosyst. Environ., 133, 183–195, https://doi.org/10.1016/j.agee.2009.04.027, 2009.
Thimonier, A., Kosonen, Z., Braun, S., Rihm, B., Schleppi, P., Schmitt, M., Seitler, E., Waldner, P., and Thöni, L.: Total deposition of nitrogen in Swiss forests: Comparison of assessment methods and evaluation of changes over two decades, Atmos. Environ., 198, 335–350, https://doi.org/10.1016/j.atmosenv.2018.10.051, 2018.
Thomas, R. Q., Canham, C. D., Weathers, K. C., and Goodale, C. L.: Increased tree carbon storage in response to nitrogen deposition in the US, Nat. Geosci., 3, 13–17, https://doi.org/10.1038/ngeo721, 2010.
Treseder, K. K.: Nitrogen additions and microbial biomass: a meta-analysis of ecosystem studies, Ecol. Lett., 11, 1111–1120, https://doi.org/10.1111/j.1461-0248.2008.01230.x, 2008.
van Genuchten, M. T.: A closed-form equation for predicting the hydraulic conductivity of unsaturated soils, Soil Sci. Soc. Am. J., 44, 892–898, https://doi.org/10.2136/sssaj1980.03615995004400050002x, 1980.
van Oijen, M., Rougier, J., and Smith, R.: Bayesian calibration of process-based forest models: bridging the gap between models and data, Tree Physiol., 25, 915–927, https://doi.org/10.1093/treephys/25.7.915, 2005.
Verstraeten, A., De Vos, B., Neirynck, J., Roskams, P., and Hens, M.: Impact of air-borne or canopy-derived dissolved organic carbon (DOC) on forest soil solution DOC in Flanders, Belgium, Atmos. Environ., 83, 155–165, https://doi.org/10.1016/j.atmosenv.2013.10.058, 2014.
Vicca, S., Luyssaert, S., Peňuelas, J., Campioli, M., Chapin, F. S., Ciais, P., Heinemeyer, A., Högberg, P., Kutsch, W. L., Law, B. E., Malhi, Y., Papale, D., Piao, S. L., Reichstein, M., Schulze, E. D., and Janssens, I. A.: Fertile forests produce biomass more efficiently, Ecol. Lett., 15, 520–526, https://doi.org/10.1111/j.1461-0248.2012.01775.x, 2012.
Vickers, D., Thomas, C. K., Martin, J. G., and Law, B.: Self-correlation between assimilation and respiration resulting from flux partitioning of eddy-covariance CO2 fluxes, Agr. Forest Meteorol., 149, 1552–1555, https://doi.org/10.1016/j.agrformet.2009.03.009, 2009.
Vilén, T., Cienciala, E., Schelhaas, M. J., Verkerk, P. J., Lindner, M., and Peltola, H.: Increasing carbon sinks in European forests: effects of afforestation and changes in mean growing stock volume, Forestry, 89, 82–90, https://doi.org/10.1093/forestry/cpv034, 2016.
Vitousek, P. M., Cassman, K., Cleveland, C., Crews, T., Field, C. B., Grimm, N. B., Horwarth, R. W., Marino, R., Martinelli, L., Rastetter, E. B., and Sprent, J.: Towards an ecological understanding of biological nitrogen fixation, Biogeochemistry, 57, 1–45, https://doi.org/10.1023/A:1015798428743, 2002.
Waldrop, M. P. and Zak, D. R.: Response of Oxidative Enzyme Activities to Nitrogen Deposition Affects Soil Concentrations of Dissolved Organic Carbon, Ecosystems, 9, 921–933, https://doi.org/10.1007/s10021-004-0149-0, 2006.
Wang, L., Ibrom, A., Korhonen, J. F. J., Frumau, K. F. A., Wu, J., Pihlatie, M., and Schjørring, J. K.: Interactions between leaf nitrogen status and longevity in relation to N cycling in three contrasting European forest canopies, Biogeosciences, 10, 999–1011, https://doi.org/10.5194/bg-10-999-2013, 2013.
Webb, E. K., Pearman, G. I., and Leuning, R.: Correction of flux measurements for density effects due to heat and water vapour transfer, Q. J. Roy. Meteor. Soc., 106, 85–100, https://doi.org/10.1002/qj.49710644707, 1980.
Wehr, R., Munger, J. W., McManus, J. B., Nelson, D. D., Zahniser, M. S., Davidson, E. A., Wofsy, S. C., and Saleska, S. R.: Seasonality of temperate forest photosynthesis and daytime respiration, Nature, 534, 680–683, https://doi.org/10.1038/nature17966, 2016.
Wohlfahrt, G. and Galvagno, M.: Revisiting the choice of the driving temperature for eddy covariance CO2 flux partitioning, Agr. Forest Meteorol., 237/238, 135–142, https://doi.org/10.1016/j.agrformet.2017.02.012, 2017.
Wortman, E., Tomaszewski, T., Waldner, P., Schleppi, P., Thimonier, A., Eugster, W., Buchmann, N., and Sievering, H.: Atmospheric nitrogen deposition and canopy retention influences on photosynthetic performance at two high nitrogen deposition Swiss forests, Tellus B, 64, 17216, https://doi.org/10.3402/tellusb.v64i0.17216, 2012.
Wu, J., Jansson, P. E, v.d. Linden, L., Pilegaard, K., Beier, C., and Ibrom, A.: Modelling the decadal trend of ecosystem carbon fluxes demonstrates the important role of biotic changes in a temperate deciduous forest, Ecol. Model., 260, 50–61, https://doi.org/10.1016/j.ecolmodel.2013.03.015, 2013.
Zechmeister-Boltenstern, S., Keiblinger, K. M., Mooshammer, M., Penuelas, J., Rchter, A., Sardans, J., and Wanek, W.: The application of ecological stoichiometry to plant–microbial–soil organic matter transformations, Ecol. Monogr., 85, 133–155, https://doi.org/10.1890/14-0777.1, 2015.
Zhang, L., Vet, R., O'Brien, J. M., Mihele, C., Liang, Z., and Wiebe, A.: Dry deposition of individual nitrogen species at eight Canadian rural sites, J. Geophys. Res., 114, D02301, https://doi.org/10.1029/2008JD010640, 2009.
Zhou, P., Ganzeveld, L., Rannik, Ü, Zhou, L., Gierens, R., Taipale, D., Mammarella, I., and Boy, M.: Simulating ozone dry deposition at a boreal forest with a multi-layer canopy deposition model, Atmos. Chem. Phys., 17, 1361–1379, https://doi.org/10.5194/acp-17-1361-2017, 2017.