the Creative Commons Attribution 4.0 License.
the Creative Commons Attribution 4.0 License.
 | 14 Oct 2019
Microbial community composition and abundance after millennia of submarine permafrost warming
Julia Mitzscherling
Fabian Horn
Maria Winterfeld
Linda Mahler
Jens Kallmeyer
Pier P. Overduin
Lutz Schirrmeister
Matthias Winkel
Mikhail N. Grigoriev
Dirk Wagner
Susanne Liebner
Warming of the Arctic led to an increase in permafrost temperatures by about 0.3 ∘C during the last decade. Permafrost warming is associated with increasing sediment water content, permeability, and diffusivity and could in the long term alter microbial community composition and abundance even before permafrost thaws. We studied the long-term effect (up to 2500 years) of submarine permafrost warming on microbial communities along an onshore–offshore transect on the Siberian Arctic Shelf displaying a natural temperature gradient of more than 10 ∘C. We analysed the in situ development of bacterial abundance and community composition through total cell counts (TCCs), quantitative PCR of bacterial gene abundance, and amplicon sequencing and correlated the microbial community data with temperature, pore water chemistry, and sediment physicochemical parameters. On timescales of centuries, permafrost warming coincided with an overall decreasing microbial abundance, whereas millennia after warming microbial abundance was similar to cold onshore permafrost. In addition, the dissolved organic carbon content of all cores was lowest in submarine permafrost after millennial-scale warming. Based on correlation analysis, TCC, unlike bacterial gene abundance, showed a significant rank-based negative correlation with increasing temperature, while bacterial gene copy numbers showed a strong negative correlation with salinity. Bacterial community composition correlated only weakly with temperature but strongly with the pore water stable isotopes δ18O and δD, as well as with depth. The bacterial community showed substantial spatial variation and an overall dominance of Actinobacteria, Chloroflexi, Firmicutes, Gemmatimonadetes, and Proteobacteria, which are amongst the microbial taxa that were also found to be active in other frozen permafrost environments. We suggest that, millennia after permafrost warming by over 10 ∘C, microbial community composition and abundance show some indications for proliferation but mainly reflect the sedimentation history and paleoenvironment and not a direct effect through warming.
- Article
(4792 KB) -
Supplement
(916 KB) - BibTeX
- EndNote


Temperatures in high-latitude regions have been rising twice as fast as the global average over the last 30 years (IPCC in Climate Change 2013, 2013) and are predicted to experience the globally strongest increase in the future (IPCC in Climate Change 2013, 2013; Kattsov et al., 2005). In the Northern Hemisphere, 24 % of the land surface (Zhang et al., 2003) and large areas of the Arctic shelves are underlain by permafrost (Brown et al., 1997). With 1672 Pg of carbon (Schuur et al., 2008), the northern circumpolar permafrost zone stores about twice as much carbon as currently found in the atmosphere (Schuur et al., 2009; Zimov et al., 2006). About 88 % of this carbon occurs in permafrost soils and deposits (Tarnocai et al., 2009). Permafrost harbours numerous ancient but viable cells (Bischoff et al., 2013; Gilichinsky et al., 2008; Graham et al., 2012; Koch et al., 2009; Mackelprang et al., 2011; Wagner et al., 2007) that can remain active at extremely low temperatures (Hultman et al., 2015; Rivkina et al., 2000). With increasing permafrost age, microbial communities show adaptations to the permafrost biophysical environment and specialize towards long-term survival strategies such as increased dormancy, DNA repair, or stress response (Johnson et al., 2007; Mackelprang et al., 2017). Following the trend of air temperature increase in the Northern Hemisphere, continuous permafrost warmed by about 0.3 ∘C over the last decade at a global scale (Biskaborn et al., 2019). Warming of permafrost can substantially increase liquid water content, sediment diffusivity, and permeability (Overduin et al., 2008; Rivkina et al., 2000; Watanabe and Mizoguchi, 2002), potentially mobilizing carbon in the form of trapped methane (Portnov et al., 2013; Shakhova et al., 2010, 2014; Thornton et al., 2016). Microbial community composition was reported to be responsive to temperature changes (Luo et al., 2014; Rui et al., 2015; Weedon et al., 2012; Xu et al., 2015; Zhang et al., 2005; Zogg et al., 1997). However, results on the extent of these community changes and their dependence on exposure time are contradictory (Allison et al., 2010; Schindlbacher et al., 2011; Walker et al., 2018; Weedon et al., 2017; Xiong et al., 2014; Zhang et al., 2016). In general, the microbial community response to warming appears to be delayed (DeAngelis et al., 2015) and the effect of warming might take decades to affect the microbial community composition (Radujković et al., 2018; Rinnan et al., 2007). Not only microbial community composition can be responsive to temperature but also microbial abundance, especially in systems with weak energy constraints. Microbial abundance correlates with enzymatic activities and methane production (Taylor et al., 2002; Waldrop et al., 2010), which are sensitive to temperature. Microbial growth, respiration, and carbon uptake can correlate with microbial biomass (Walker et al., 2018). Thus, substantial permafrost warming on long timescales could affect microbial community composition and abundance before permafrost thaws.
Submarine permafrost provides an analogue for rising permafrost temperatures over timescales of centuries and millennia. Submarine permafrost of the Arctic Sea shelves originally formed under terrestrial (subaerial) conditions and was inundated by post-glacial sea level rise during the Holocene (Romanovskii and Hubberten, 2001). Upon sea transgression, permafrost degraded over thousands of years as the relatively warm ocean water warmed the submerged seafloor. Mean annual bottom-water temperatures in the Laptev Sea (East Siberian Arctic Shelf) are 12 to 17 ∘C warmer than the annual average surface temperature of terrestrial permafrost (Romanovskii et al., 2005). Even today, new submarine permafrost is created by the erosion of Arctic permafrost coasts (Fritz et al., 2017), which account for 34 % of the coasts worldwide (Lantuit et al., 2012). In a recent study, we compared submarine sediment cores from two locations on the Siberian Arctic Shelf and looked at the combined effect of permafrost inundation time and seawater intrusion on microbial communities. We showed that flooding by seawater reduced permafrost bacterial abundance and changed bacterial community composition due to the penetration of seawater into a former freshwater habitat (Mitzscherling et al., 2017). It was suggested that in addition to the effect of seawater infiltration, the sediment warming taking place over millennia could lead to proliferation. However, the specific effect of long-term permafrost warming independent of thawing has not been assessed so far. Here we hypothesize that millennial-scale permafrost warming directly increases microbial abundance and alters microbial community composition. We used submarine permafrost sediments of comparable age and physicochemical properties that differed in temperature by more than 10 ∘C due to different periods of inundation and sediment warming and assessed total microbial and bacterial abundances and community composition relative to temperature, pore water chemistry, and sedimentation history.
2.1 Study site and drilling
The study area (∼73∘60′ N, 117∘18′ E) is situated in the western part of the Laptev Sea on the East Siberian Arctic Shelf (Fig. 1). Mean annual bottom-water temperatures in the Laptev Sea range between −1.8 and −1 ∘C (Wegner et al., 2005), leading to sediment temperatures of −1.0 and −2.0 ∘C within the largest part of the shelf (Romanovskii et al., 2004). We investigated four cores (C1–C4; Fig. 2a) that were retrieved along an onshore–offshore transect in the coastal region of Cape Mamontov Klyk in 2005 (Overduin, 2007; Rachold et al., 2007). Cores were named after the order of drilling and we kept this order (C1, C4, C3, C2) for better comparability with previous studies (Koch et al., 2009; Mitzscherling et al., 2017; Overduin et al., 2008; Winkel et al., 2018). From onshore to offshore all cores were characterized by an increase in water depth, in depth to the ice-bonded permafrost table (Fig. 2a, Table S1 in the Supplement), and in ground temperature (Table S2) (Overduin, 2007; Rachold et al., 2007). The transect was characterized by a temperature gradient that covered an increment of more than 10 ∘C compared to the onshore permafrost. Thereby, each core displayed its own unique temperature range (Fig. 2b).
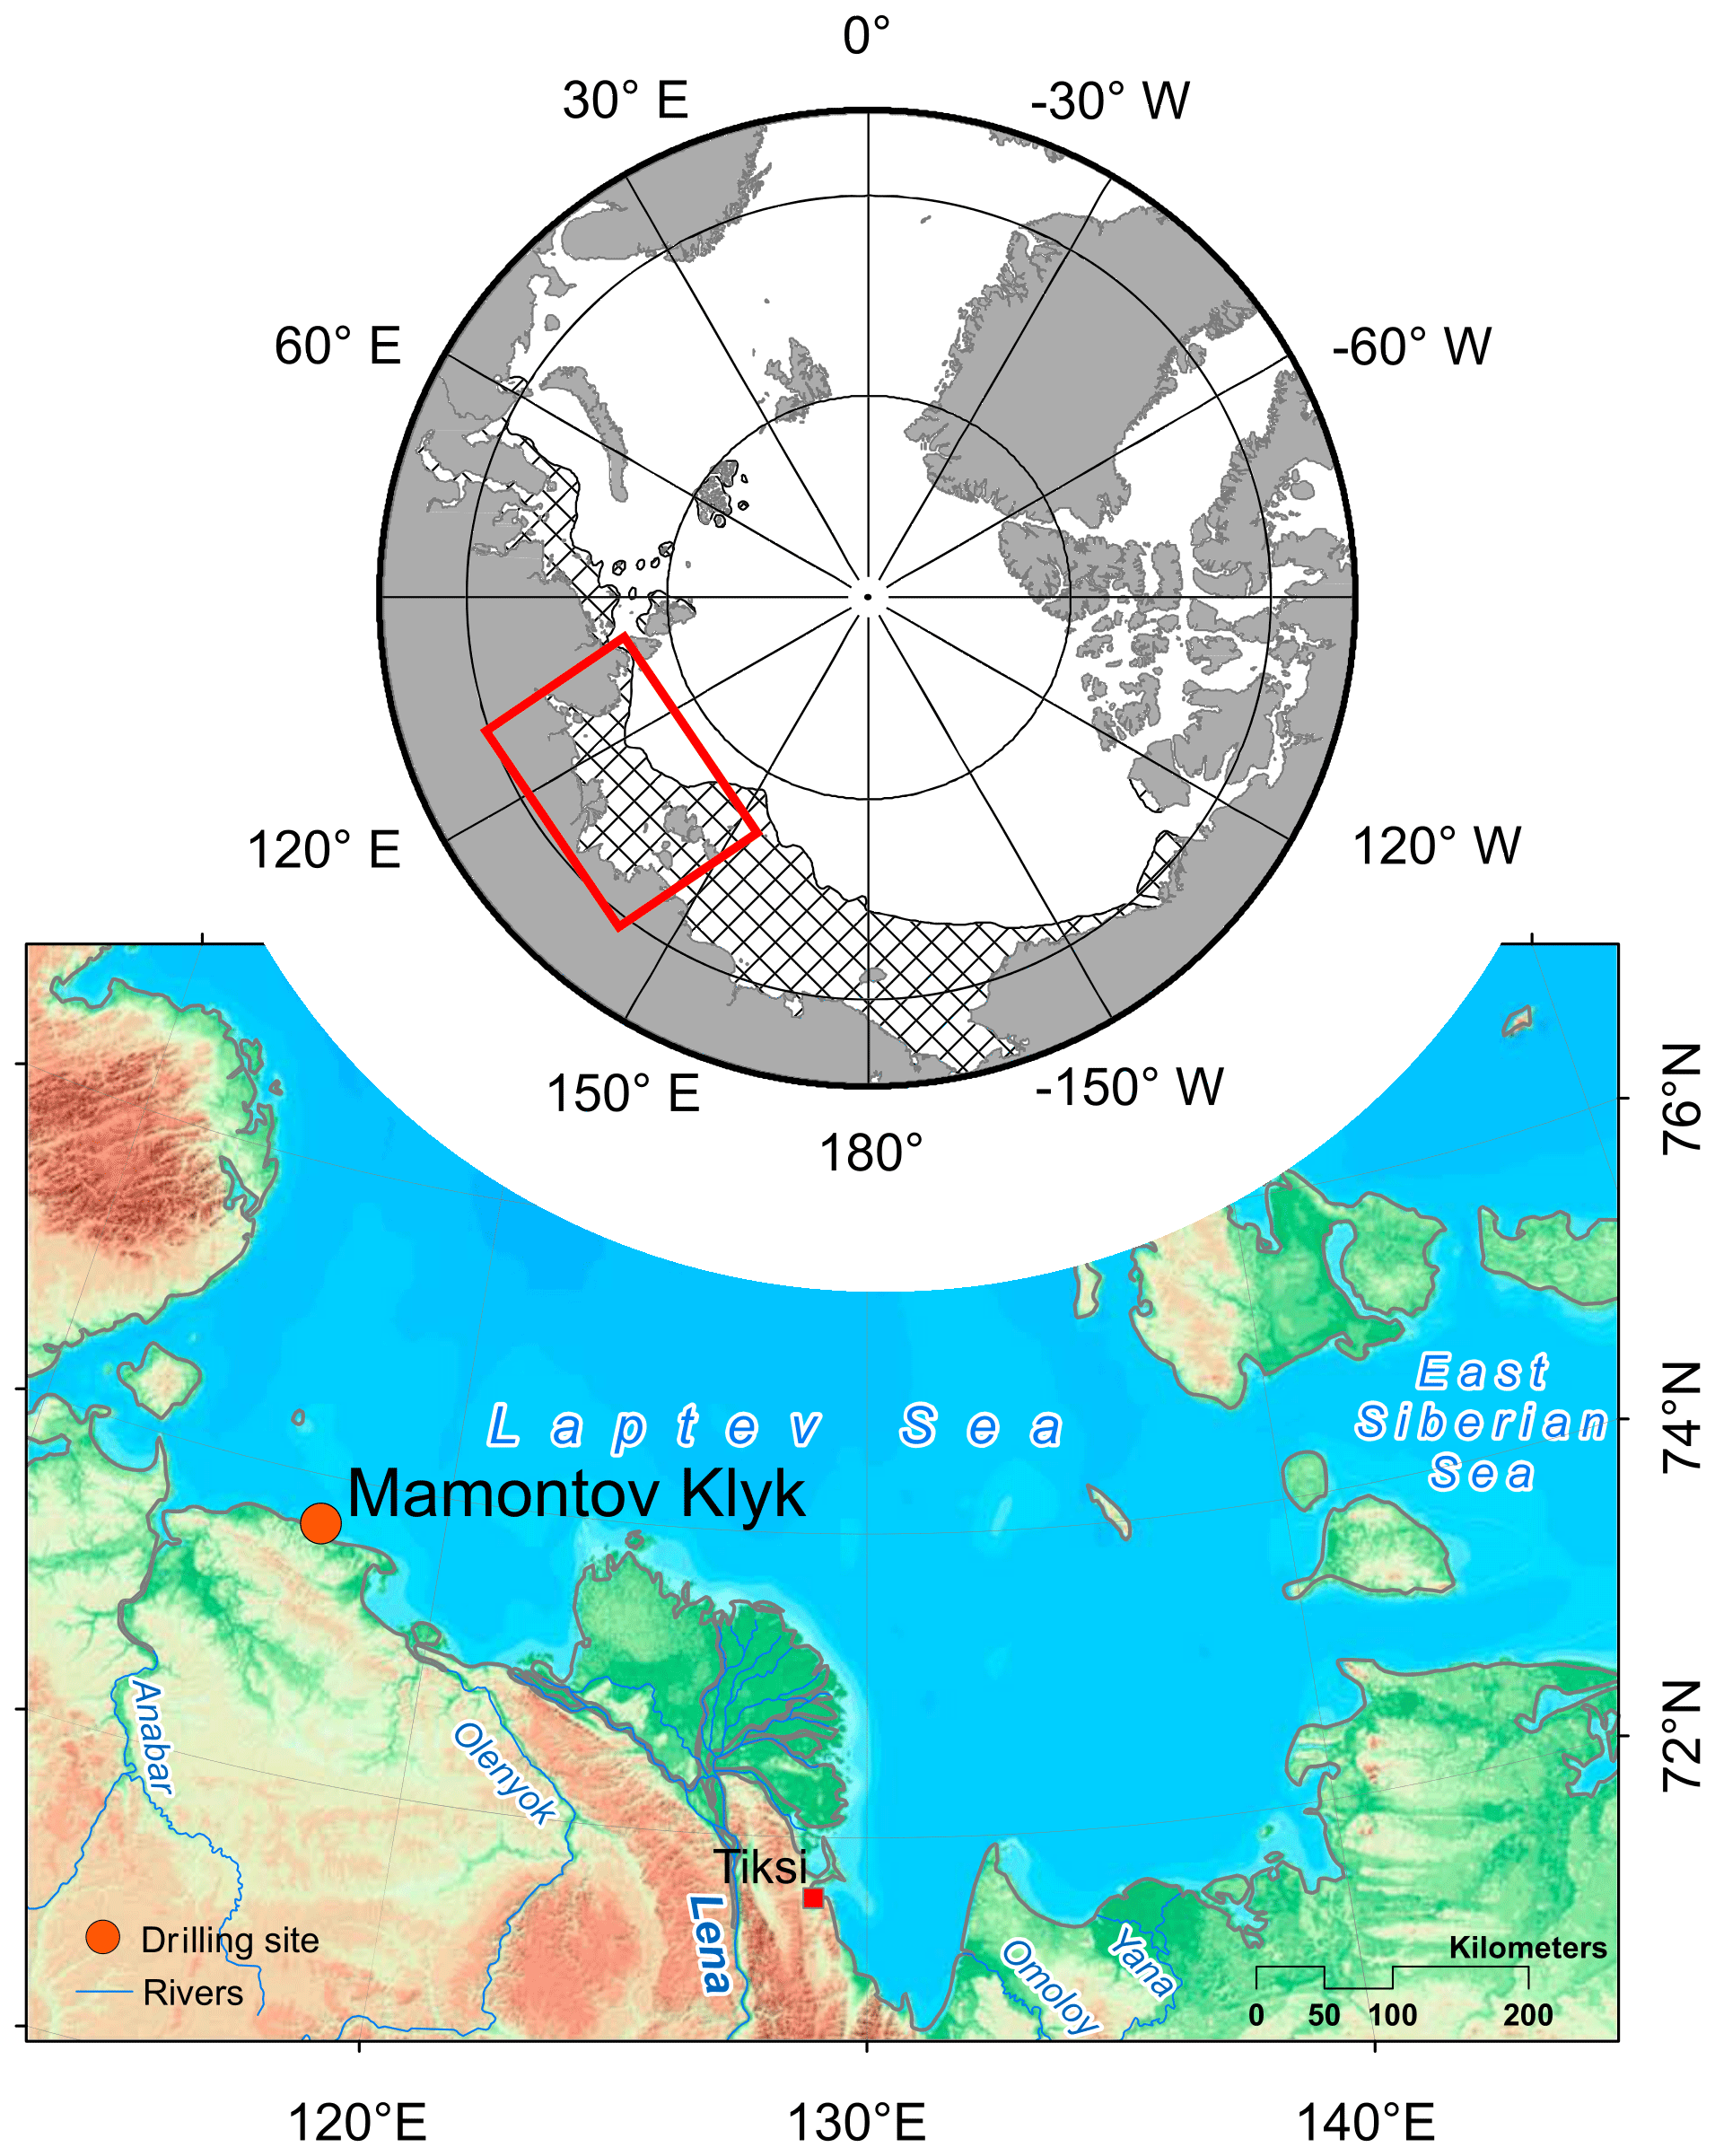
Figure 1Geographical location of the study site. Location of the Laptev Sea on a circumpolar perspective map and the potential extent of submarine permafrost (striped area; based on Brown et al., 2002), as well as the geographical location of the drilling site at Cape Mamontov Klyk in the western Laptev Sea (modified from Overduin et al., 2015).
Assuming a constant mean annual coastal erosion rate of 4.5 m yr−1 (Grigoriev, 2008), the drill site located furthest offshore (C2, 11.5 km off the coast) was inundated approximately 2500 years ago (Rachold et al., 2007). Accordingly, the drill sites C3 and C4, located 3 and 1 km off the coast, were inundated around 660 and 220 years ago, respectively. More recent analysis based on remote sensing shows that 40-year coastal erosion rates for the same stretch of coastline between 1965 and 2007 were slower (about 2.9 m yr−1) (Günther et al., 2013), which would translate into even longer inundation periods. However, in the present study we refer to those in Grigoriev (2008), which are based on direct observations of coastal erosion at the C1 coring site. Drilling was performed with a hydraulic rotary-pressure system (Drilling Technologies Factory, St. Petersburg, Russia; model URB-2A-2) and without the use of any drilling fluid. All samples were frozen immediately after recovery and were kept at −22 ∘C until further processing. Temperature measurements at all sites were done using thermistors and infrared sensors (Junker et al., 2008).
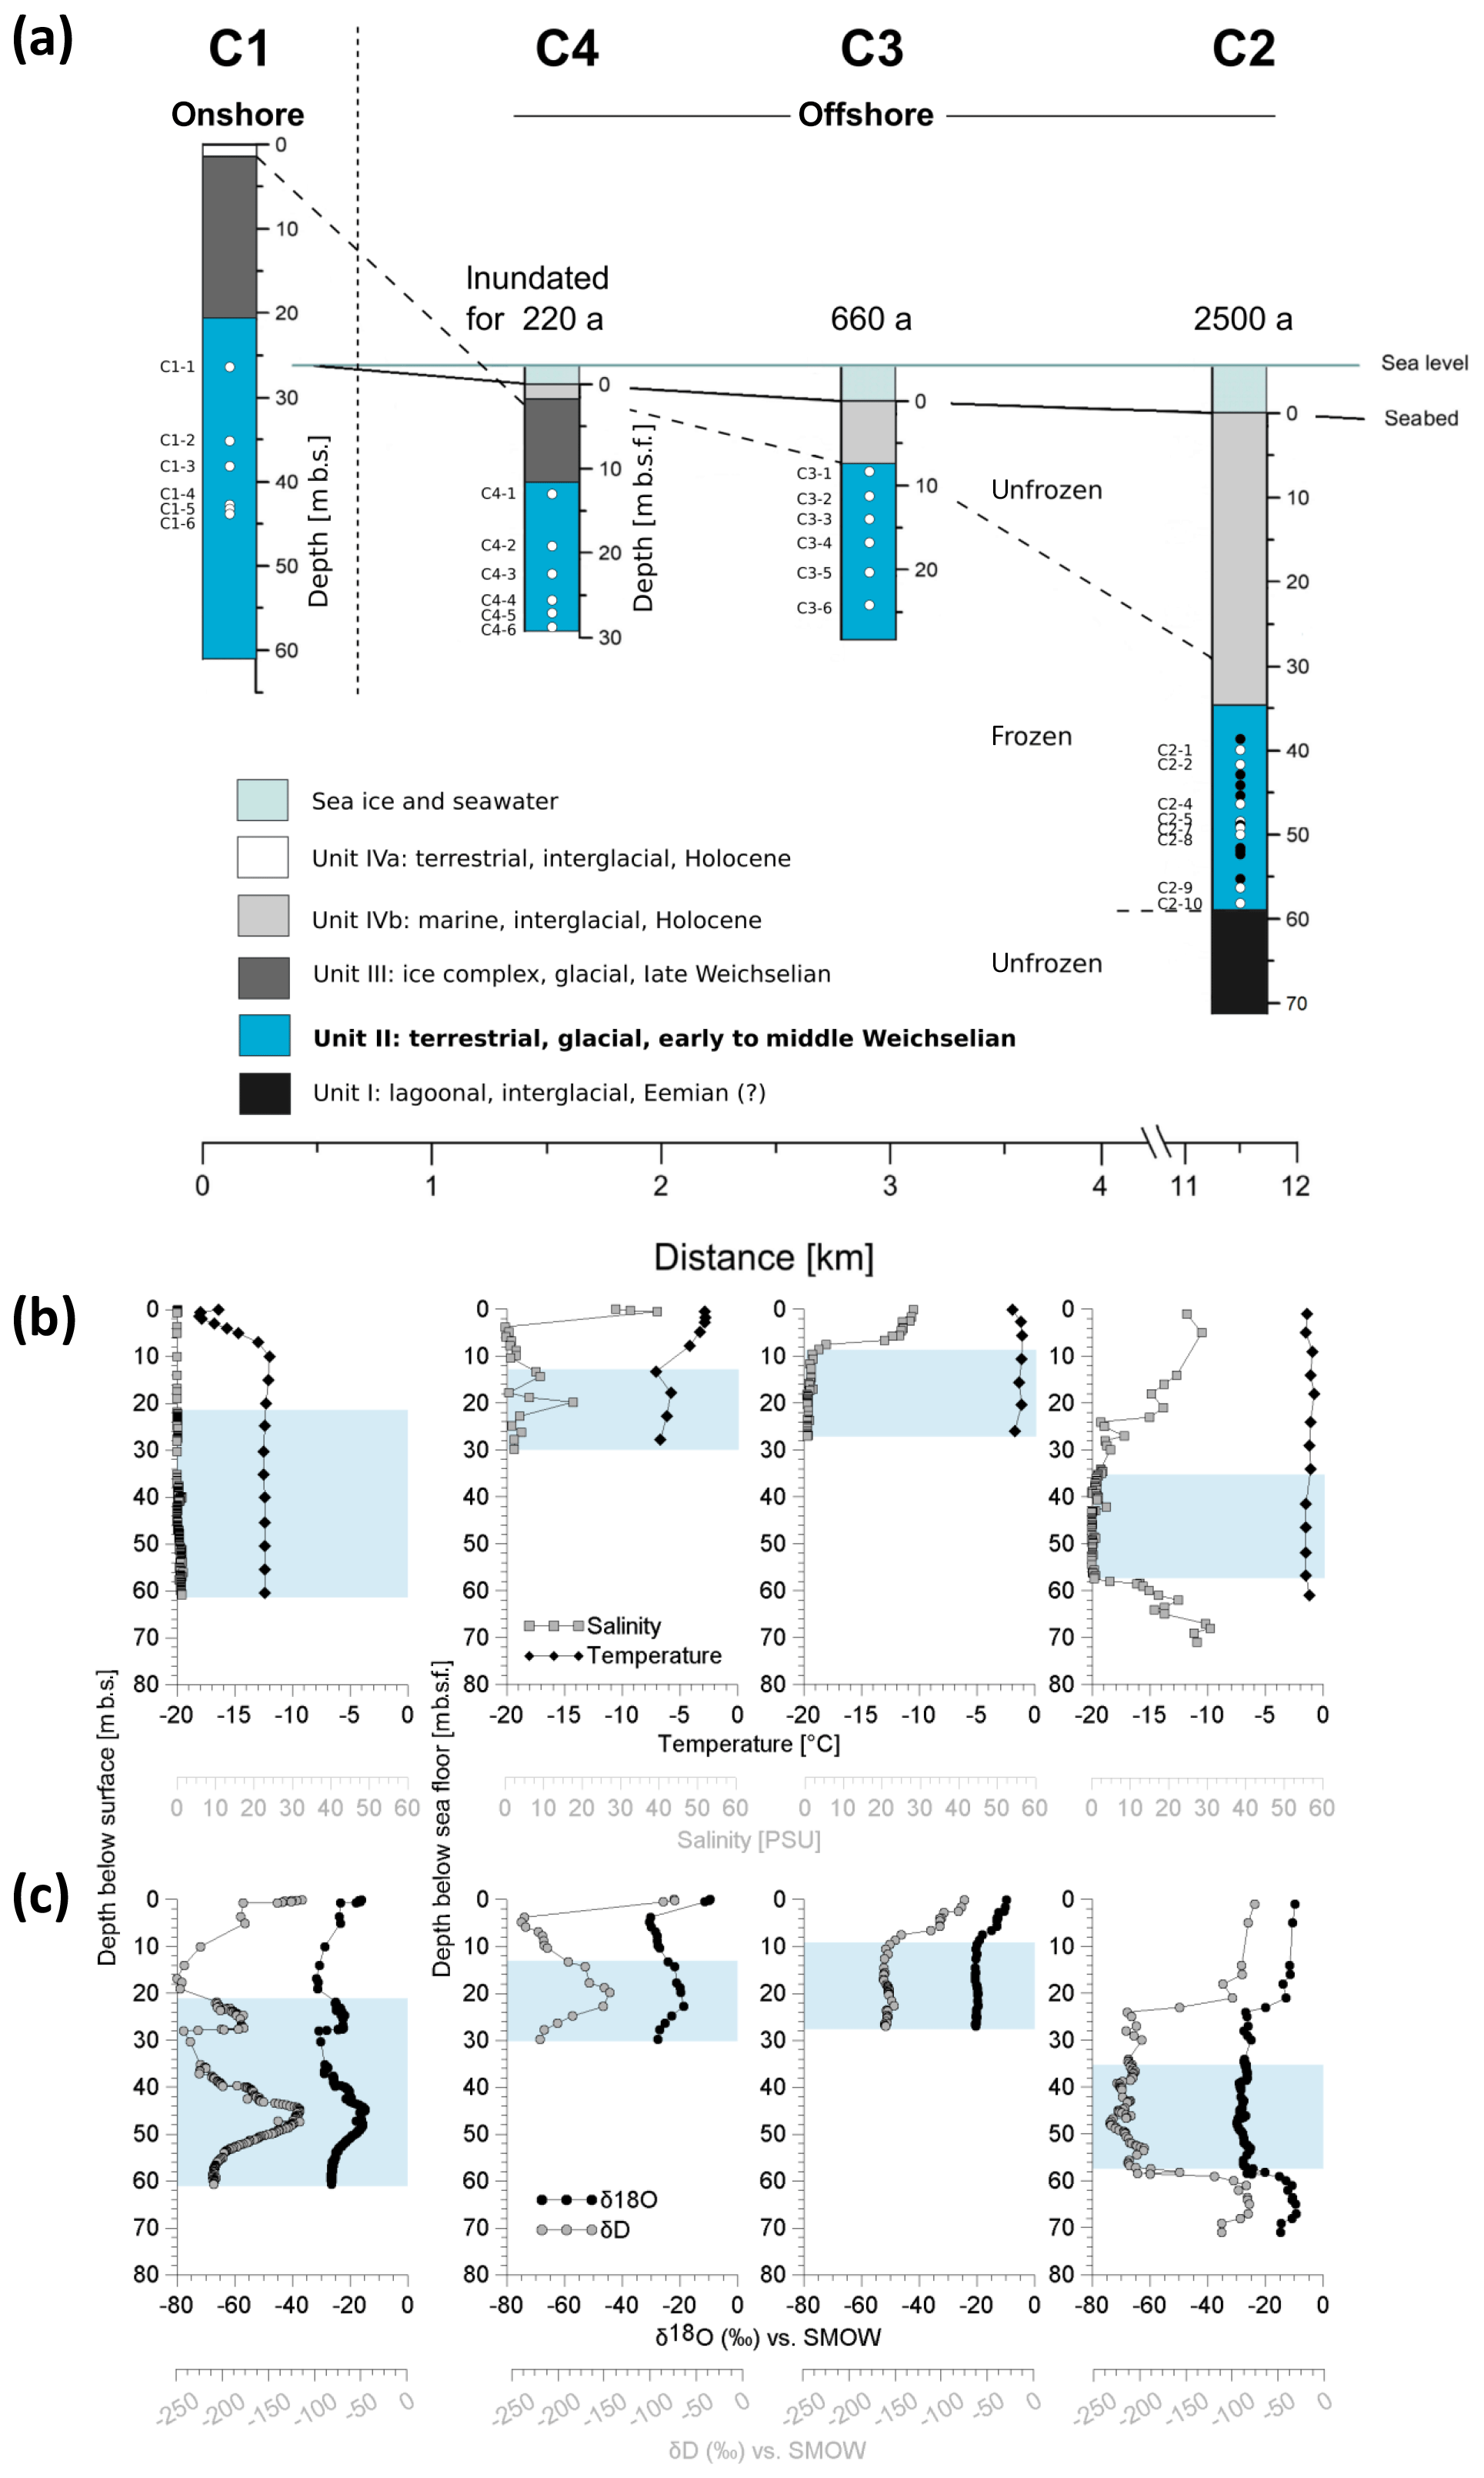
Figure 2Overview of the coring transect with the position and characteristics of the terrestrial and submarine sediment cores. (a) Periods of inundation are indicated above each submarine core. The core depth of the terrestrial core is given in metres below the surface (m b.s.) and the depth of the submarine cores in metres below the seafloor (m b.s.f.). The core depths are proportional to each other, whereas the distance scale is only schematic. Affiliation of sediment deposits to discrete sediment units (Unit I–IVb), accumulated under similar environmental conditions in the same glacial or interglacial period, are distinguished by colours. Dots show the depth of the molecular samples. White dots represent samples from this study. Their denomination is indicated to the left. Black dots represent samples from a previous study. (b) Depth profiles of temperature (black diamonds) and salinity (grey squares) as well as of (c) the pore water stable isotopes δ18O (black circles) and δD (grey circles) from the cores C1, C4, C3, and C2. The blue shaded area represents Unit II.
2.2 Sample selection
Each of the four drill cores exhibited different sedimentological units. Lithostratigraphic Unit II was identified in all cores (Fig. 2a) and was entirely located within the ice-bonded permafrost. Irrespective of the permafrost temperature Unit II sediments of all cores were cemented mainly by pore ice but were also characterized by terrestrial permafrost features like ice lenses, ice veins, and ice wedges. The photographs of Winterfeld et al. (2011) show similar ice and sediment structures of the terrestrial core C1 and the outermost submarine core C2. The depth location of Unit II within each core can be found in Table S1. This unit was deposited during the late Pleistocene, was warmed without thawing, and had so far remained unaffected by seawater infiltration. On the basis of a principal component analysis (PCA; see next chapter and Fig. 3) and previous lithostratigraphic descriptions (Winterfeld et al., 2011), all further analysis was conducted on samples from Unit II. The ages of the sediment are published in Winterfeld et al. (2011). The present study refers to sediment ages determined by optically stimulated luminescence (OSL) on quartz and infrared optically stimulated luminescence (IR-OSL) on feldspars. OSL ages of Unit II sediments from core C1 range from 30.5±2.0 ka at 22 m below the surface (m b.s.) to 114±6 ka at 50 m b.s. OSL ages range from 97±6 to 112±8 ka between 23 and 30 m below the seafloor (m b.s.f.) in core C3 and from 133±8 to 148±14 ka between 37 and 53 m b.s.f.; they increase with depth. IR-OSL ages date back to 59±5.8 ka at around 15 m b.s.f. in C4, 86±5.9 ka at 44 m b.s.f., and 111±7.5 ka at 77 m b.s.f. in C2. Consequently, sediments of Unit II were deposited during the early to middle Weichselian (Winterfeld et al., 2011).

Figure 3PCA of environmental, sedimentological, and pore water data from Unit II of all four cores, with PC 1 explaining 31.9 % and PC 2 explaining 20.6 % of the variance between samples. Vectors show selected physicochemical factors that are mainly responsible for the variance between samples (see loadings plot in Fig. S4). C1: n=183, C2: n=66, C3: n=38, C4: n=9. Outliers located outside the 95 % ellipses were removed. The insert presents all samples of the onshore–offshore transect coloured irrespective of the cores by unit (n=361).
For molecular analyses we took six replicate samples from each of the cores C1 (C1-1–C1-6), C4 (C4-1–C4-6), and C3 (C3-1–C3-6) and eight replicates from core C2 (C2-1, C2-2, C2-4, C2-5, C2-7, C2-8, C2-9, C2-10) (Fig. 2a). Those replicates were located at different depths within Unit II (Table S4). Samples from C1 were located around 27 to 44 m b.s., while samples from C4 were taken between 13 and 30 m b.s.f., samples from C3 between 9 and 25 m b.s.f., and samples from C2 between 40 and 58 m b.s.f. Unit II was mainly composed of sands with varying proportions of silt and to a minor extent clay, as well as a frequent occurrence of wood fragments, plant detritus interlayers, and small peat inclusions (Winterfeld et al., 2011). Both sandy and organic-rich deposits were represented by three replicates in C1, C4, and C3 and four replicates in C2 (Table S4). Furthermore, to check for reproducibility we included samples from C2 retrieved in a previous study (Mitzscherling et al., 2017) (sample names CK12xx). In order to prevent contamination caused by the drilling equipment, we took the subsamples from the centre of the core. Subsampling was performed in a climate chamber under freezing conditions by using sterile tools. Thus, a contamination of the samples can be excluded.
2.3 Pore water and sediment analyses
Pore water of segregated ground ice was extracted from thawed subsamples of the sediment cores using rinsed Rhizons™ (0.15 µm pore diameter). Electrical conductivity, salinity, cation and anion concentrations, stable isotope concentrations (δ18O, δD), and pH were measured for 183 samples of C1, 67 samples of C2, 38 samples of C3, and 10 samples of C4 in Unit II (Table S3). Electrical conductivity, salinity, and pH were measured with a WTW MultiLab 540 using a TetraConTM 325 cell referenced to 20 ∘C. Total dissolved element concentrations (Ba2+, Ca2+, K+, Mg2+, Na+, Siaq) were determined by inductively coupled plasma optical–emission spectrometry (ICP-OES; Optima 3000XL, PerkinElmer, Waltham) (Boss and Frieden, 1989). Dissolved anion concentrations (Cl−, , Br−, ) were measured using a KOH eluent and a latex particle separation column on a Dionex DX-320 ion chromatographer (Weiss, 2001). The pore water stable isotopes (δD and δ18O) of segregated ground ice were determined following Meyer et al. (2000) using a Finnigan MAT Delta-S mass spectrometer in combination with two equilibration units (MS Analysetechnik, Berlin).
Dissolved organic carbon (DOC) was measured as non-purgeable organic carbon via catalytic combustion at 680 ∘C using a total organic carbon analyser (Shimadzu TOC-VCPH instrument) on samples treated with 20 µL of 30 % supra-pure hydrochloric acid. The ice content was determined gravimetrically. Grain sizes were measured with a Coulter LS 200 laser particle size analyser. The total organic carbon (TOC) was measured with the element analyser Vario MAX C, while total carbon (TC), total nitrogen (TN), and total sulfur (TS) contents were determined with a carbon, nitrogen, and sulfur (CNS) analyser (Elementar Vario EL III).
2.4 DNA extraction
Core subsamples were homogenized in liquid nitrogen and DNA was extracted from ∼5 g of sediment using a modified protocol of Zhou et al. (1996). The method was described before (Mitzscherling et al., 2017), and in the following we refer to these samples as molecular samples. The quality of the extracted genomic DNA was assessed via gel electrophoresis (Fig. S1 in the Supplement). DNA concentration was quantified with the Qubit2 system (Invitrogen, HS-Quant DNA) and the crude DNA was purified using the HiYield PCR Clean-Up and Gel-Extraction Kit (SLG) to reduce PCR inhibitors prior to PCR applications.
2.5 Quantification of the bacterial 16S rRNA gene
Quantitative PCR was performed using the CFX Connect™ Real-Time PCR Detection System (Bio-Rad Laboratories, Inc.) and the primers S-D-Bact-0341-b-S-17 and S-D-Bact-0517-a-A-18 targeting the bacterial 16S rRNA gene (Table S5). Each reaction (20 µL) contained 2x concentrate of iTaq™ Universal SYBR® Green Supermix (Bio-Rad Laboratories), 0.5 µM each of the forward and reverse primer, sterile water, and 2 µL of template DNA. The qPCR assays comprised the following steps: initial denaturation for 3 min at 95 ∘C, followed by 40 cycles of denaturation for 3 s at 95 ∘C, annealing for 20 s at 58.5 ∘C, elongation for 30 s at 72 ∘C, and a plate read step at 80 ∘C for 0.3 s. Melt curve analysis from 65–95 ∘C with a 0.5 ∘C temperature increment per 0.5 s cycle was conducted at the end of each run. The qPCR assay was calibrated using known amounts of PCR-amplified gene fragments from a pure Escherichia coli culture. For each sample three technical replicates were analysed and DNA templates were diluted 5- to 100-fold prior to qPCR analysis. The PCR efficiencies based on standard curves were calculated using the Bio-Rad CFX Manager software. They varied between 93 % and 99 %. All cycle data were collected using the single threshold Cq determination mode.
2.6 Total cell counts
Preparation and quantification of the total cell abundance per gram of sediment were performed after Llobet-Brossa et al. (1998). The modified protocol was described before by Mitzscherling et al. (2017). Briefly, cells were fixed with 4 % paraformaldehyde in phosphate-buffered saline (PBS). After incubation, the sediment was pelleted by centrifugation for 5 min at 9600 g and washed in sterile filtered PBS. Two subsamples of each sample were diluted in PBS and filtered onto a polycarbonate membrane filter (0.2 µm) by applying a vacuum. Total cell counts were determined by SYBR Green I. Fluorescence microscopy was performed with a Leica DM2000 fluorescence microscope using the FI/RH filter cube. A magnification of 100x was used to count cells of either 200 fields of view or until 1000 cells were counted. We counted two filters per sample.
2.7 High-throughput Illumina16S rRNA gene sequencing and analysis
Sequencing of each sample was performed in two technical replicates. The sequencing primers that were used in this study only target bacteria and comprised different combinations of barcodes (Table S6). PCR amplification was carried out with a T100™ Thermal Cycler (Bio-Rad Laboratories, CA, USA). The PCR mixtures (25 µL) contained 1.25 U of OptiTaq DNA Polymerase (Roboklon), 10x concentrate buffer C (Roboklon), 0.5 µM of the sequencing primers S-D-Bact-0341-b-S-17 and S-D-Bact-0785-a-A-21 (Table S5), dNTP mix (0.2 mM each), an additional 0.5 mM of MgCl2 (Roboklon), PCR-grade water, and 2.5 µL of template DNA. PCR conditions comprised an initial denaturation at 95 ∘C for 5 min, followed by 35 cycles of denaturation (95 ∘C for 30 s), annealing (56 ∘C for 30 s), elongation (72 ∘C for 1 min), and a final extension step of 72 ∘C for 10 min. The PCR products were purified from agarose gel with the HiYield PCR Clean-Up and Gel-Extraction Kit (Südlabor, Gauting, Germany) and were quantified with the QBIT2 system (Invitrogen, HS-Quant DNA). They were mixed in equimolar amounts and sequenced from both directions (GATC Biotech, Konstanz) based on the Illumina MiSeq technology. The library was prepared with the MiSeq Reagent Kit V3 for 2×300 bp paired-end reads. The 15 % PhiX control v3 library was used for better performance due to different sequencing length.
2.8 Sequence analysis and bioinformatics
The data analysis of raw bacterial sequences started with the quality control of the sequencing library by the tool FastQC (quality control tool for high-throughput sequence data; http://www.bioinformatics.babraham.ac.uk/projects/fastqc/ (last access: 10 October 2018) by Simon Andrews). The tool CutAdapt (Martin, 2011) was used to demultiplex the sequence reads according to their barcodes and to subsequently remove the barcodes. Forward- and reverse-sequenced fragments with overlapping sequence regions were merged using PEAR (Zhang et al., 2014), and the nucleotide sequence orientation was standardized. Low-quality sequences were filtered and trimmed by Trimmomatic (Bolger et al., 2014), and chimeras were removed by Chimera Slayer. Finally, the Quantitative Insights into Microbial Ecology (QIIME) pipeline was used to cluster sequences into operational taxonomic units (OTUs) and to taxonomically assign them employing the SILVA database (release 123) with a cutoff value of 97 % (Caporaso et al., 2010).
2.9 Statistics
Prior to statistical analysis, absolute singletons and OTU0.03 (operational taxonomic units of clustered sequences with 97 % similarity level) not classified as bacteria or classified as chloroplasts or mitochondria were removed. In addition, OTU0.03 with reads < 0.5 % of total read counts in each sample were removed to reduce background noise. The background noise was estimated with the help of a positive control (E. coli), whereby the number of OTUs is known prior to sequencing. Absolute read counts were transformed into relative abundances in order to standardize the data and to make technical replicates comparable. Relative abundances of technical replicates were merged to mean relative abundances for bacterial community analysis, i.e. the bubble plot and non-metric multidimensional scaling analysis (NMDS). Samples having < 15 000 raw reads were checked for divergent relative abundances within duplicates (Table S7) and excluded from the calculation of mean relative abundances when the discrepancy was too big. Variation in OTU0.03 composition, 16S rRNA gene, and total cell abundance between samples and among drill sites, as well as correlations of the abundance and OTU0.03 composition with environmental parameters, were assessed using the Past 3.14 software (Hammer et al., 2001) and R, especially the vegan and MASS packages. Principal component analyses (PCAs) based on Euclidean distance were used to assess variation in environmental variables across the different sediment units and within Unit II. Prior to analysis, all environmental data were standardized by subtracting the mean and dividing by the standard deviation. To assess the correlations of bacterial and microbial abundance with environmental parameters the rank-based Spearman correlation was calculated. The Bray–Curtis dissimilarity was used to assess the beta diversity of the microbial communities in an NMDS plot. Environmental factors that might influence its composition were determined by an environmental fit into the ordination. The significance of the variance introduced by the identified environmental factors was tested using a permutational approach as implemented in the adonis function of the vegan package. Factors were tested for autocorrelation as implemented in the corrplot package. A linear model of the remaining factors was subject to a redundancy analysis, which was tested for significance using analysis of variance (ANOVA). ANOVA and the Tukey's pairwise post hoc test were conducted to test whether the DOC concentrations of the cores differed.
3.1 Physicochemical pore water and sediment properties
The temperature (Fig. 2b) of Unit II was lowest in the terrestrial borehole (C1, constantly at around −12.4 ∘C at the time of drilling in Junker et al., 2008, and between −12.0 and −12.5 ∘C recently measured over a 2-year period by Kneier et al., 2018) and increased with distance to the shore. According to Junker et al. (2008) C4 exhibited a temperature range from −7.1 to −5.8 ∘C. Ground temperatures of C3 and C2 were similar with mean values of −1.4 and −1.5 ∘C, respectively, and showed marginal variation. C3 exhibited a slightly higher mean temperature than the longest inundated core C2.
Overall, the salinity of Unit II was low (Fig. 2b, Winterfeld et al., 2011). In C4, the drill site located closest to the coast, Unit II had the highest pore water salinity (mean 5.6 PSU), ranging from 0.9 to 17.6 PSU (Table S2), which spans freshwater to mesohaline water but is far below seawater salinities. In comparison, bottom-water salinities at the drill sites ranged between 29.2 and 32.2 PSU (Overduin et al., 2008). Salinity in C3 reached a mean value of 1.1 PSU. The submarine core furthest offshore (C2) and the terrestrial core (C1) had a mean pore water salinity of around 0.8 and 0.5 PSU, respectively. The stable isotopes δD and δ18O of the sediment cores C1 and C4 exhibited similar mean values of −22 ‰ for δ18O and around −178 ‰ for δD, with greater variance in C1 (Fig. 2c, Table S2). Sediments of C3 were characterized by higher and constant isotope values of around −20 ‰ for δ18O and −158 ‰ for δD. In core C2, the isotope values were smaller with mean values of −28 ‰ for δ18O and −213 ‰ for δD (Table S2).
DOC concentrations were lowest in Unit II of core C2, the core furthest offshore, and ranged from 4 to 41 mg C L−1, with a mean value of 17 mg C L−1 (Fig. S2). Towards the coast the DOC content increased to mean values of 43 mg C L−1 in C3 and 96 mg C L−1 in C4. The terrestrial core C1 had a mean DOC concentration of around 48 mg C L−1 with values ranging from 4 to 305 mg C L−1, thereby having by far the highest measured DOC concentration of all cores. The TOC content in Unit II was generally very low with mostly < 0.5 wt %. While C1 and C4 had the lowest mean values of 0.17 wt %, the TOC content increased with distance to the coast to 0.22 wt % in C3 and 0.33 wt % in C2 (Table S3). The pH of Unit II sediments ranged from slightly acidic to slightly alkaline values. In cores C1 and C4 the pH ranged from 5 to 7.9, whereas the values of C2 and C3 were higher, ranging from pH 6.5 to 8.0. The mean pH values of all cores were around pH 7 to 7.5. Other pore water data, like anion and cation concentrations, conductivity, CNS, grain sizes, and the gravimetrically determined water content, can be found in Table S3. The whole dataset is also deposited on PANGAEA (Mitzscherling et al., 2018).
All environmental, sedimentological, and pore water data (Table S3) were used to conduct principal component analyses (PCAs) to check for the level of similarity within Unit II. Unit II formed a dense cluster relative to the other sediment units (Fig. 3 insert). Focusing on samples from Unit II only (Fig. 3) confirmed highly similar physicochemical characteristics of this unit in all cores, even though C2 and C3 clustered along the axis PC 2, while C1 and C4 were more randomly scattered. Variance between samples was mainly explained by grain sizes, pore water stable isotope concentrations, and to a lesser extent by pH.
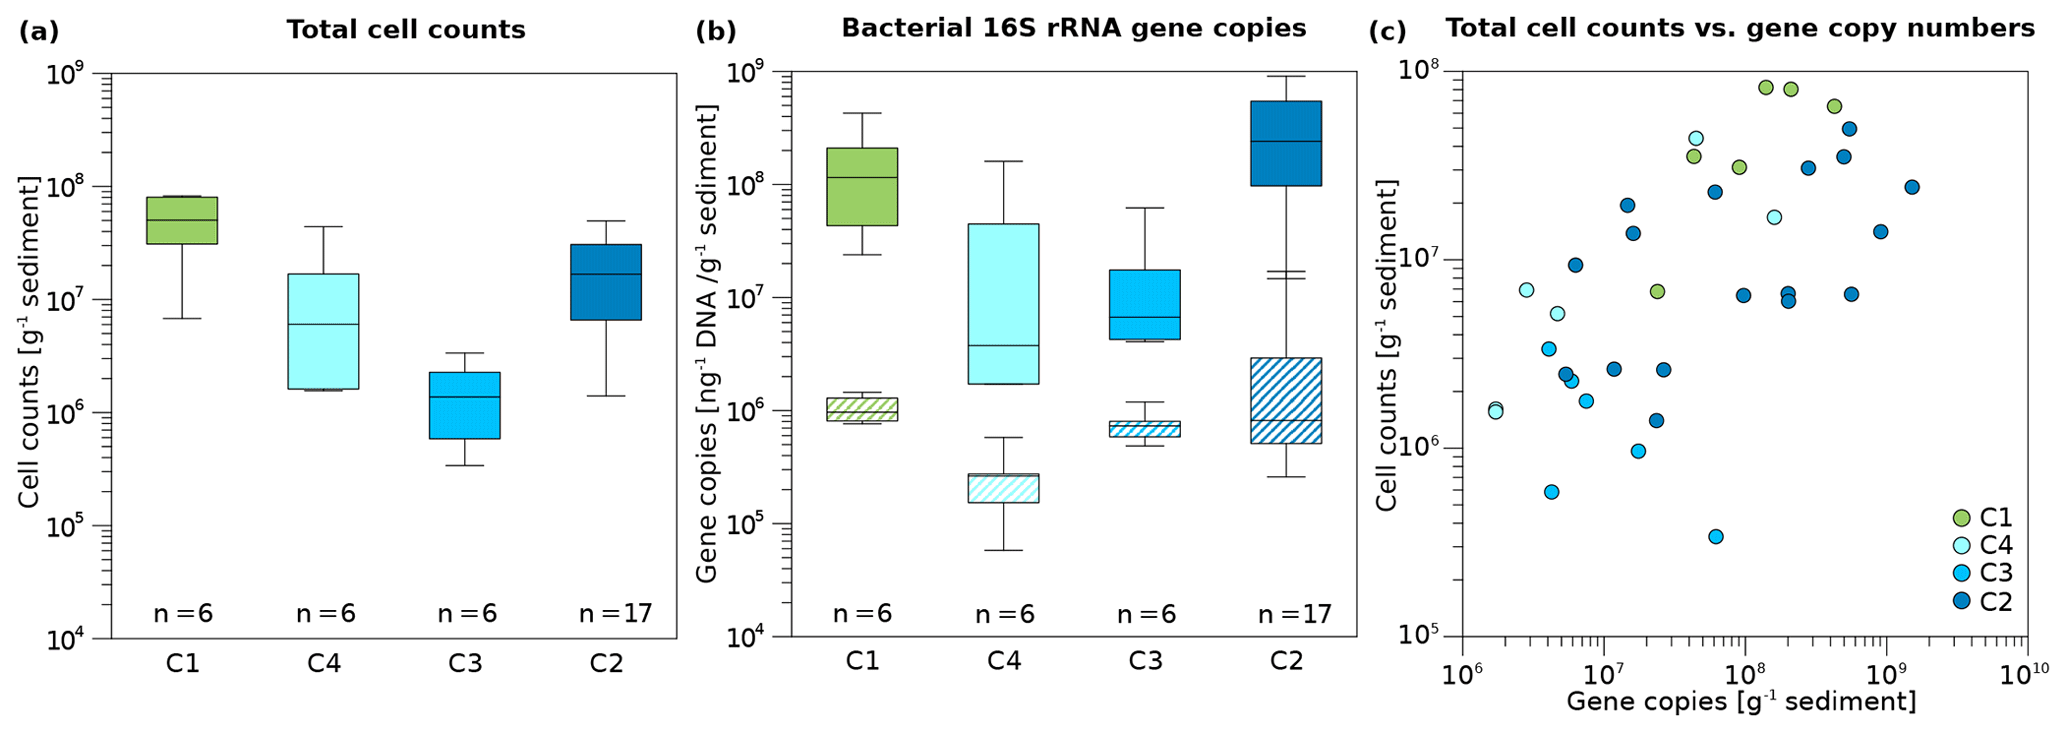
Figure 4Box plots of microbial and bacterial abundance in Unit II. (a) Total cell counts and (b) bacterial 16S rRNA gene copy numbers normalized to gram sediment wet weight (top, solid boxes) and to DNA concentration (ng; bottom, striped boxes) of the cores C1, C4, C3, and C2. Box plots contain the mean values obtained from two technical replicates of cell counts and three technical replicates of 16S rRNA gene copy numbers per biological replicate. Median lines are indicated within the boxes in which the size corresponds to ±25 % of the data, whereas the whiskers show the minimum and maximum of all data. Minimum, maximum, and mean values, as well as standard deviation and sample numbers, can be found in Table S9. (c) Correlation of total cell counts and bacterial 16S gene copy numbers per gram of sediment. The strength of the correlation is shown in Table 1. Sample points were coloured according to drill core.
3.2 Microbial abundance
Overall microbial abundance decreased from onshore to offshore (C1, C4, C3) and had increased again in the drill site located furthest from the coast (C2). The terrestrial permafrost core C1 and the submarine core C2 had the highest DNA concentrations (Fig. S3), total cell counts (TCCs) (Fig. 4a), and bacterial 16S rRNA gene copy numbers of all cores (Fig. 4b). The lowest DNA concentrations and TCC were observed in core C3, whereas the lowest numbers of bacterial 16S rRNA gene copies were found in core C4. All three abundance measures (DNA concentrations, TCC, and bacterial 16S rRNA gene copy numbers) significantly correlated with each other (Table S8). DNA concentrations reached mean values of 141.6 and 106.9 ng g−1 in C1 and C2, respectively, whereas the mean DNA concentrations in C4 and C3 were 88.5 and 19.8 ng g−1 (Table S9). Mean TCC reached a value of 5×10⁷ g−1 in C1. C4 and C2 had similar values of 1.3×10⁷ and 1.5×10⁷ g−1, while the cell numbers of C3 were 1 order of magnitude lower (1.5×10⁶ g−1). Bacterial 16S rRNA gene copy numbers usually exceeded TCC by an order of magnitude, with mean values of 1.6×10⁸ and 2.9×10⁸ g−1 in C1 and C2, but lower mean values of 3.6×10⁷ and 1.7×10⁷ g−1 in C4 and C3, respectively.
Table 1Spearman correlations of DNA concentration, 16S rRNA gene copy numbers normalized to gram sediment (16S bacteria), 16S rRNA gene copy numbers normalized to nanogram DNA (16S/DNA), and total cell count (TCC) with environmental and geochemical parameters. Presented is the correlation coefficient rs. Significant negative correlations are highlighted in red, and significant positive correlations are highlighted in green. Values in bold are significant (< 0.05) when omitting p value corrections. Colour intensity represents the significance levels: from dark to light colour p < 0.001, p < 0.01, p < 0.05. P values and more data can be found in Table S10.
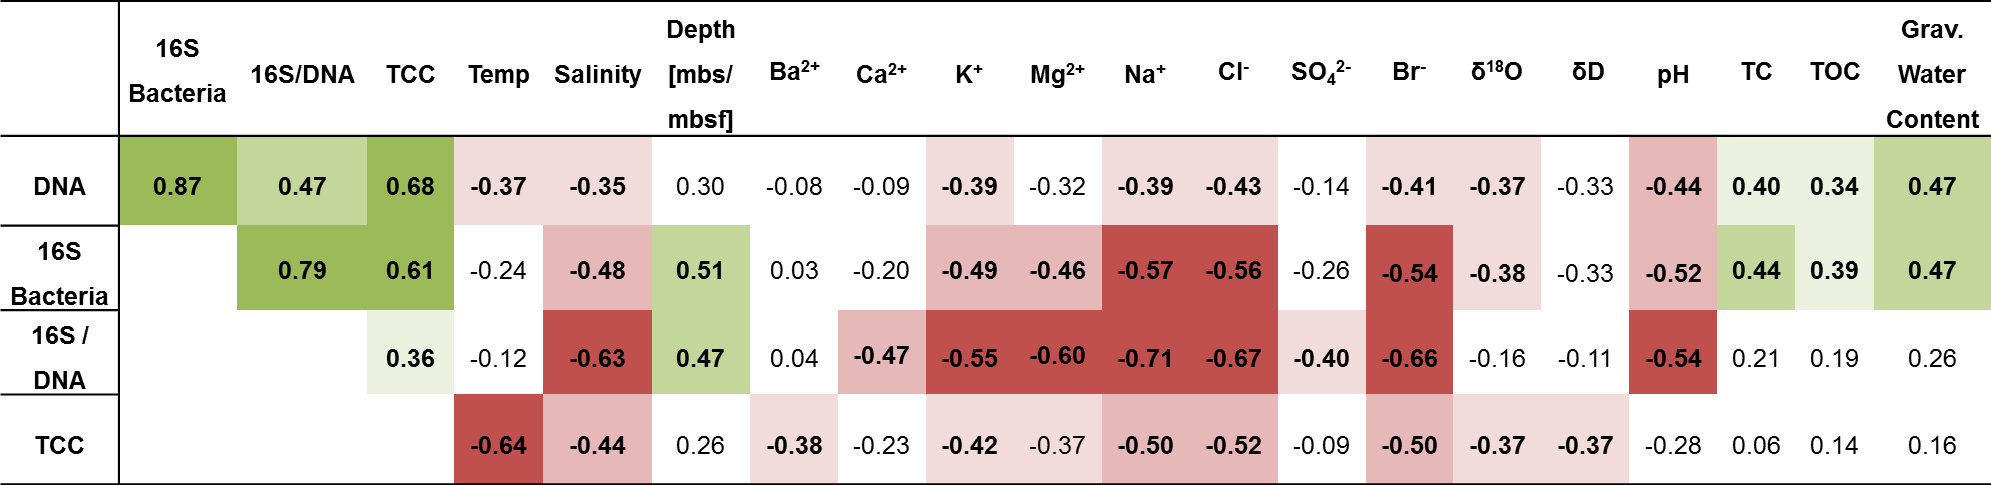
A correlation analysis (Table 1) revealed that microbial and bacterial abundance measures, including DNA concentrations, 16S rRNA bacterial gene copies, and TCC, correlated with each other (Fig. 4c). They further showed a significant rank-based negative correlation with salinity (p < 0.05, Spearman ), cations (K+, Mg2+, Na+) and anions (Cl−, Br−) (p < 0.05, ), and δ18O (p < 0.05, ). Furthermore, DNA concentrations negatively correlated with temperature (p < 0.05, ) and pH (p < 0.05, ), while TCC negatively correlated with temperature (p < 0.01, ) and 16S rRNA gene copies with pH (p < 0.01, ). Positive correlations were found for DNA and 16S rRNA gene copies with total organic carbon (TOC; p < 0.05, rs > 0.34) and water content (p < 0.01, rs=0.47).
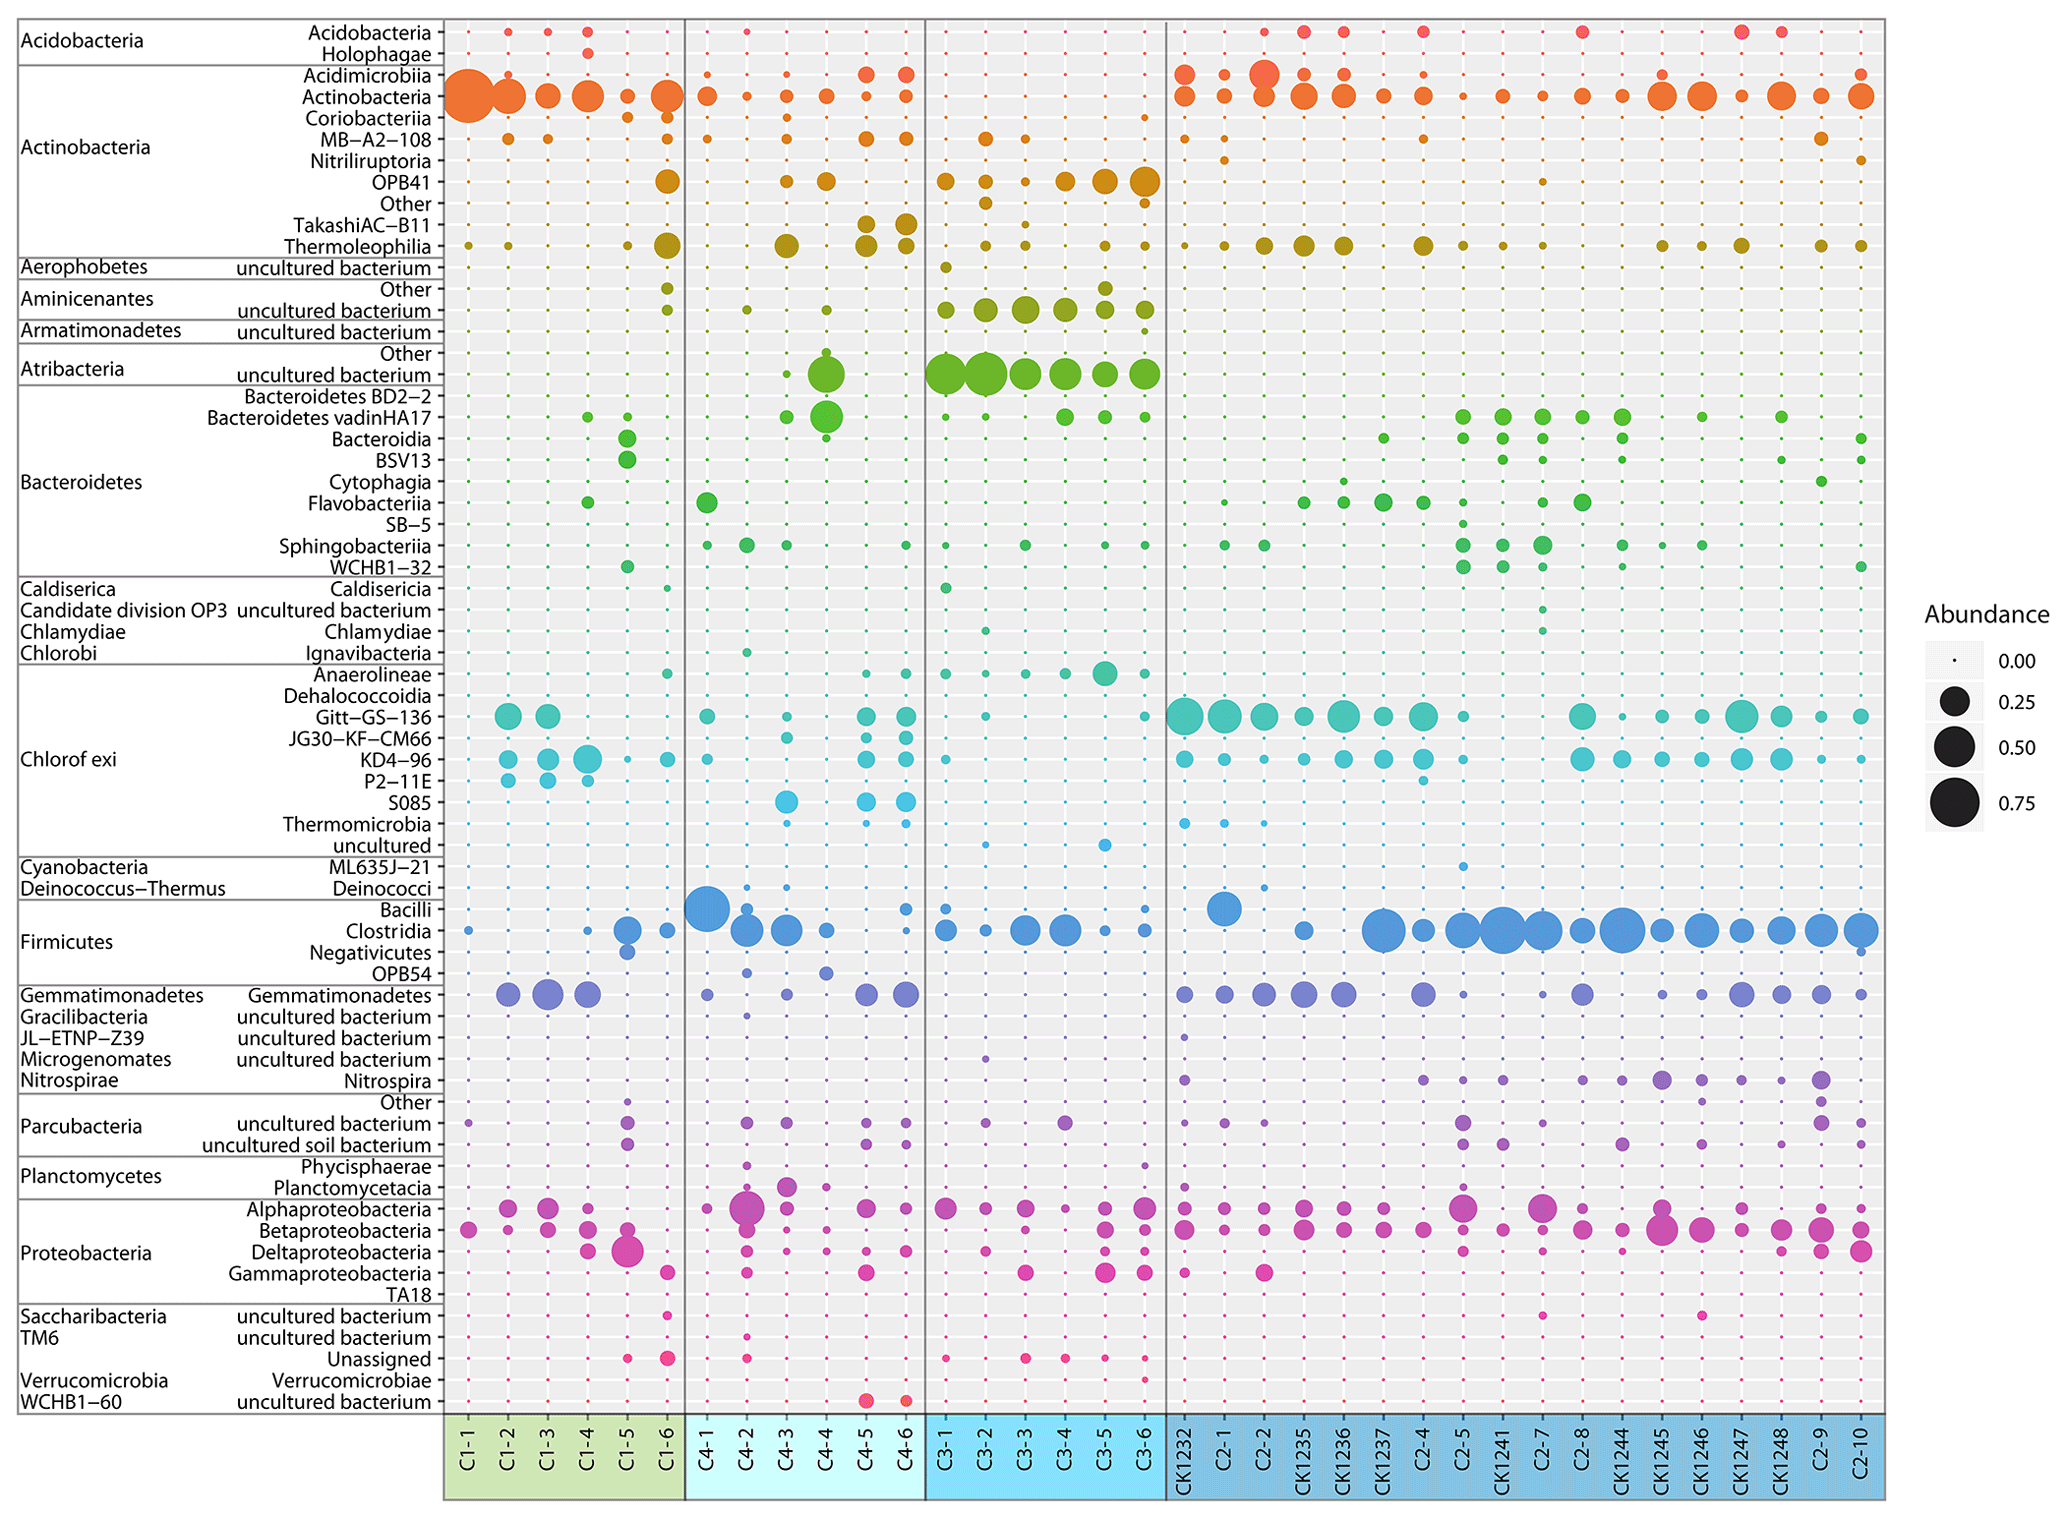
Figure 5Relative abundance of bacterial classes from Unit II of the C1–C4 cores. Coloured boxes and the sample names below indicate the particular core. Sample names were explained earlier. Bubbles represent the mean value of relative abundances from two technical replicates.
3.3 Bacterial community composition
The most abundant bacterial taxa were Actinobacteria (class), Chloroflexi (Gitt-GS-136, KD4-96), Clostridia (class), Gemmatimonadetes, and Proteobacteria (primarily Alpha- and Betaproteobacteria) (Fig. 5). Candidatus Aminicenantes (candidate phylum OP8) and Candidatus Atribacteria (candidate phylum OP9) were highly abundant in core C3, where Actinobacteria, Chloroflexi, and Gemmatimonadetes were almost absent.
Grouping patterns of the bacterial community based on the OTU0.03 composition of the samples and the Bray–Curtis dissimilarity were visualized using a non-metric multidimensional scaling (NMDS; Fig. 5). The NMDS showed a clustering of samples according to their borehole location for C2 and C3, while communities of C1 and C4 were more scattered. We fitted environmental gradients with the NMDS ordination in order to test for correlation between the bacterial community compositions at each drill site with environmental parameters (p < 0.05). Samples located at the bottom left of the plot originated from a greater depth (C1 and C2) than samples to the top right (C3 and C4). The variance of samples from the bottom to the top was explained by rising pH, permafrost temperature, and total sulfur content, while the variance of samples from the left to the right side is likely explained by increasing values of Ba2+ and the pore water stable isotopes δ18O and δD – a proxy for paleotemperature and climate. The bacterial community of C3 was most distinct and clustered furthest from the communities of all other sites. It was linked with the pore water stable isotopes δ18O and δD, Ba2+, and the sample depth. The variance between C1, C4, and C2 samples is explained by permafrost temperature differences across the cores (Fig. 2b). A subsequent permutational analysis of variance showed that depth, temperature, pH, TS, δD, δ18O, and Ba2+ contribute to the variance in the microbial community composition (Table S11), whereof δ18O and δD show a high autocorrelation. A redundancy analysis showed that the explanatory variables depth, temperature, pH, and δ18O significantly explain parts of the variance in the microbial composition (p=0.001).
Despite the overlaps within the NMDS ordination, a one-way PerMANOVA revealed that the variance between each of the clusters was significantly higher than within single clusters (Table S12); i.e. the bacterial subpopulations of each drill site were significantly different from each other.
The present study aimed to understand the effect of long-term permafrost warming independent of thaw on microbial community composition and abundance. The observed significant negative rank-based correlation between increasing temperature and total cell counts (TCCs) contradicts our hypothesis that millennial-scale permafrost warming directly increases microbial abundance. It is, however, in line with related studies on arctic and subarctic soil microbial communities in which a negative effect of increasing temperature on microbial abundance was assigned to freeze–thaw cycles (Schimel et al., 2007; Skogland et al., 1988) and substrate depletion (Walker et al., 2018). Both effects are, however, unlikely here. Firstly, sample depths were always more than 10 m below the surface and seafloor, respectively, and freeze–thaw cycles within the investigated Unit II can be excluded. Secondly, preservation, rather than depletion, of substrates was more likely in the two submarine cores C3 and C4, where DOC contents were comparable to that of the cold terrestrial permafrost of C1 (Fig. S2). The degradation of DOC can be used as a measure for microbial carbon turnover (Seto and Yanagiya, 1983) and the DOC concentration usually correlates with microbial abundance (Junge et al., 2004; Smolander and Kitunen, 2002; Vetter et al., 2010). The cores C3 and C4 had significantly lower TCC and bacterial gene copy numbers (106 cells and 105 gene copies) than the onshore core C1 and the C2 core furthest offshore (107 cells and 106 gene copies). Thus, microbial activity and substrate utilization were likely low in C3 and C4. A negative influence of permafrost warming on microbial abundance is further challenged through some indication for microbial proliferation in core C2, which had experienced the longest warming of all cores. In detail, TCCs in C2 were higher than in the other submarine cores, while DOC values were lower in C2, significantly different from C4 and C1 (Table S13). Permafrost warming for more than 2 millennia may have enabled microbial communities to adapt to the new temperature regime and sediment properties as suggested before (Mitzscherling et al., 2017). Besides permafrost warming, changing pore water salinity had an effect on the microbial abundance. Rising permafrost temperature strongly correlates with TCC, whereas salinity correlates the strongest with bacterial gene copy numbers (Table 1). Bacterial 16S rRNA gene copy numbers were lowest in core C4 (105 gene copies), where pore water salinities were elevated (electrical conductivity values > 2000 µS cm−1, Table S3). Low gene copy numbers (105 gene copies) may result from osmotic stress that limits microbial growth (Galinski, 1995; Rousk et al., 2011) and decreases microbial abundance in sediments (Jiang et al., 2007; Rath and Rousk, 2015; Rietz and Haynes, 2003; Wen et al., 2018). We argue that the different levels of salinity are relicts of the paleoclimate and varying landscape types (e.g. thermokarst lakes and lagoons, fluvial processes, floodplains; Fig. S5 and Table S14) that formed Unit II during the last glacial cycle, i.e. the Weichselian glaciation at 117–10 ka (Svendsen et al., 2004). According to the IR-OSL ages Unit II of C4 was deposited ∼60 ka and earlier. Conductivity values in C4 that were higher than 2000 µS cm−1 could be the result of strong evaporation. The climate in the Laptev Sea region during the middle Weichselian (75–25 ka) was of an extremely continental type characterized by low precipitation throughout the year and relatively warm summers (Hubberten et al., 2004). Also, salinity values in Unit II of core C4 are lower than in the seafloor sediments of the same core but higher than in the sediment layer in between (Fig. 2b), supporting the idea that differences in salinity reflect the paleoenvironment and climate and not an infiltration of seawater during the Holocene transgression. The presence of a temporary shallow thermokarst lake at the drilling site of C4 and following summer evaporation is one possible scenario leading to elevated salt concentrations (Larry Lopez et al., 2007). A strong influence of the paleoclimate on recent microbial abundance is further supported through a significant correlation between microbial abundance with δ18O values (Table 1). The stable isotope composition of ground ice is widely used as an archive for paleoclimatic information and for the determination of ground ice genesis (Meyer et al., 2002a, b; Vasil'chuk, 1991). Compared to the other cores, C3, for example, was enriched in heavy isotope species of δ18O (−20 to −15 ‰) and δD (−150 to −160 ‰), suggesting warmer temperatures at the time of deposition (Meyer et al., 2002b). As ground ice is mainly fed by summer and winter precipitation, its isotopic composition reflects the annual range of air temperatures. Isotope changes towards heavier values could also be the result of larger amounts of summer rain as well as less winter snow preserved in the ice. Assuming that the IR-OSL ages of Winterfeld et al. (2011) are correct, sediments of C3 were deposited at around 50 ka and later. Thus, C3 sediments were probably deposited during a period in which the extremely dry continental climate with relatively warm summers was especially pronounced (between 45 and 35 ka) (Hubberten et al., 2004).
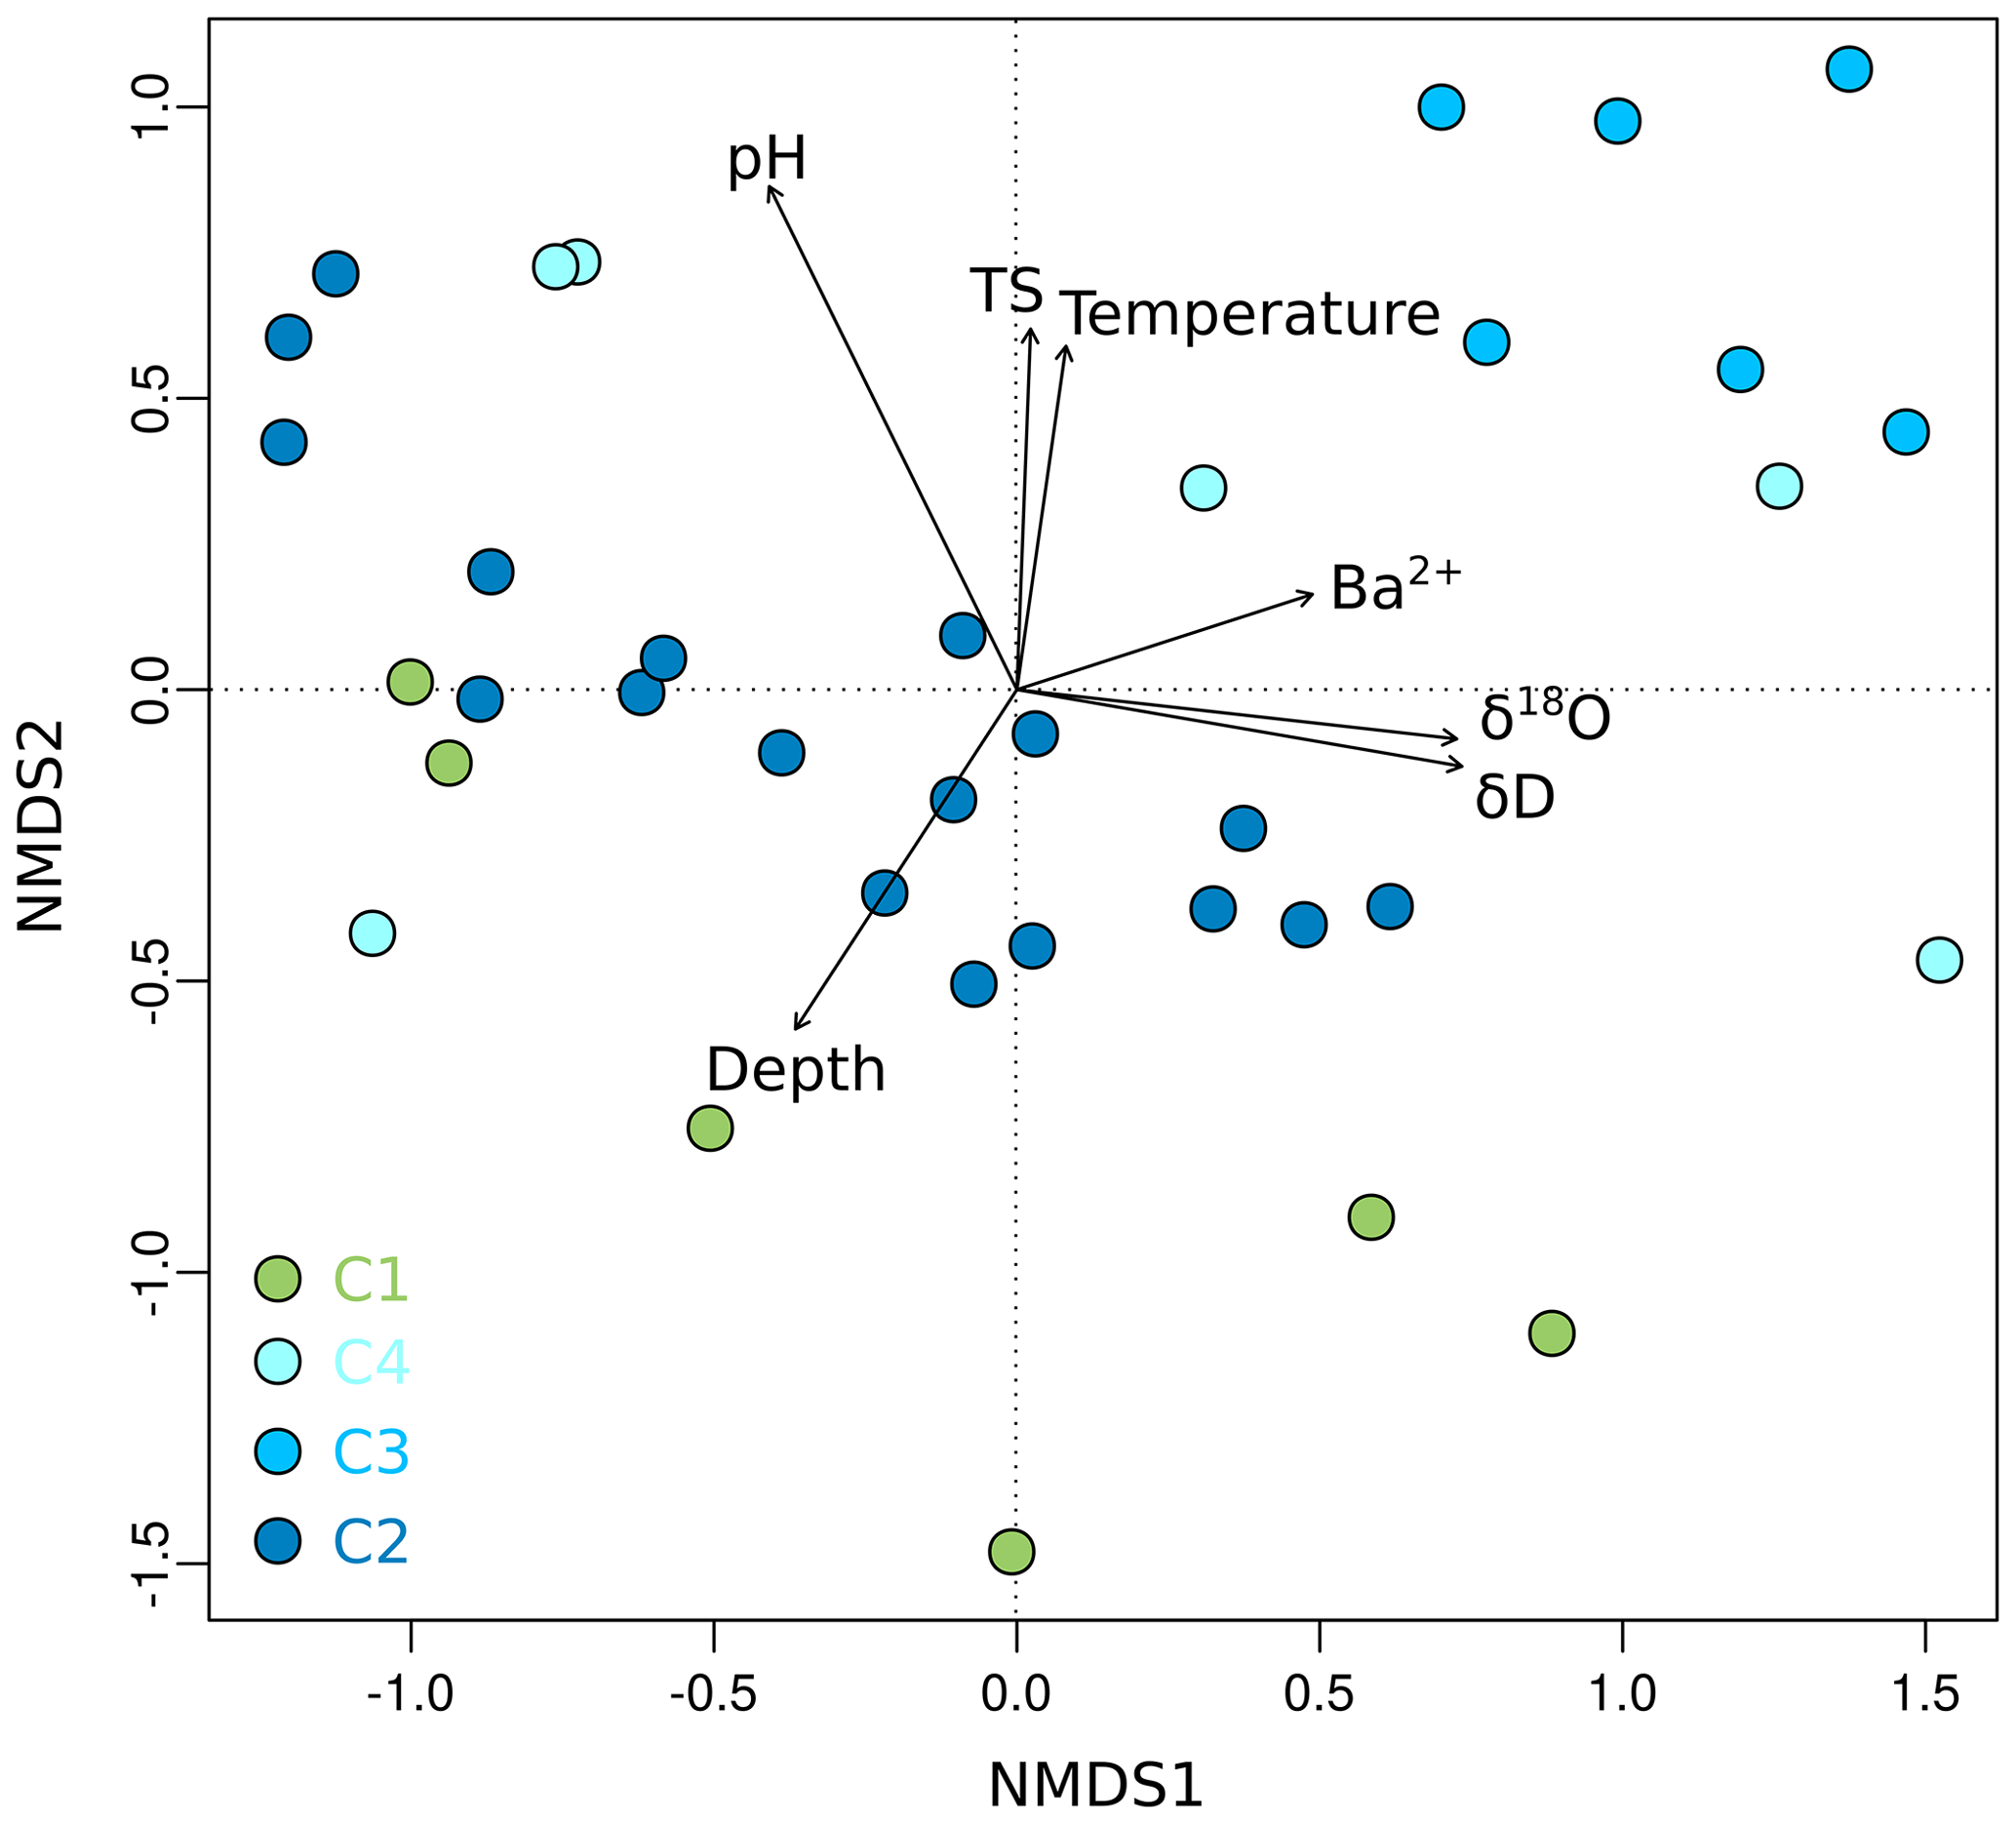
Figure 6Non-metric multidimensional scaling (NMDS) plot of OTU0.03 data from Unit II as a function of environmental parameters. Shown are environmental factors that contribute significantly (p < 0.05) to the variance of the community data. The stress value of the NMDS plot is 0.13. Each dot represents the mean value of relative OTU abundances from two technical replicates. Sample depth is denoted as metres below the surface for terrestrial samples and metres below the seafloor for submarine samples.
We suggest that microbial community composition, like microbial abundance, reflects the paleoclimate and sedimentation history and not a direct effect of permafrost warming. In detail, we observed a weak correlation between community composition with permafrost temperature and a strong correlation with pore water stable isotope values and depth, i.e. age. This suggestion is supported by similar findings in sea sediments as well as in lacustrine sediments. Microbial taxa of Arabian Sea sediments reflected past depositional conditions and exhibited paleoenvironmental selection (Orsi et al., 2017), while the microbial population in sediments of Laguna Potrok Aike in Argentina changed in response to both past environmental conditions and geochemical changes during burial (Vuillemin et al., 2018). The microbial communities in core C3, which were most distinct from the other locations (Fig. 6), may thus reflect the higher paleotemperatures and different proportions of summer and winter precipitation discussed earlier. The strongest correlation of the bacterial community composition was, however, found with pH. Soil pH is a major factor controlling bacterial diversity, richness, and community composition on a continental scale (Fierer and Jackson, 2006; Lauber et al., 2009). On a global scale pH is also one of the major controls on archaeal communities (Wen et al., 2017). Fierer and Jackson (2006) showed that the richness and diversity of bacterial communities differed between ecosystem types, which could be explained by pH. This substantiates our suggestion that Unit II and the bacterial community therein was formed under different paleoclimatic conditions and varying landscape types during the last glacial cycle. However, the limited number of environmental samples and the inference of other correlating environmental factors might decrease the statistical power in terms of seeing a more significant effect of temperature on the microbial community.
Independent of core C3, microbial community composition showed substantial site-specific differences. This local-scale variation in community composition (β diversity) likely results from the distance between the coring sites because β diversity increases with increasing distance when environmental conditions differ (Lindström and Langenheder, 2012) and when dispersal is as limited as it is in permafrost environments (Bottos et al., 2018). Our data suggest that the bacterial community in submarine permafrost sediments has experienced a weak selection after deposition and mostly reflects the paleoenvironmental and climatic conditions. Thereby, this study joins a number of other studies reporting on microbial groups that are referred to as “the paleome”. Those studies found correlations between microbial diversity and past depositional conditions (Lyra et al., 2013; Orsi et al., 2017; Vuillemin et al., 2016). Marine communities were found in terrestrial settings or soil communities in (sub-)seafloor sediments (Ciobanu et al., 2012; Inagaki et al., 2015; Inagaki and Nealson, 2006). Like those, our study implies that the bacterial communities in permafrost soils under the seafloor underwent a weak selection pressure after burial either through dormancy or very low generation times under freezing conditions.
Irrespective of the effect of permafrost warming on microbial community composition and abundance, the cell counts and microbial taxa of this study expand our knowledge about microbial life in permafrost. The bacterial taxa dominating in the submarine permafrost samples were amongst the phyla that commonly occur in Arctic permafrost and the active layer, like Proteobacteria, Firmicutes, Chloroflexi, Acidobacteria, Actinobacteria, and Bacteroidetes (Jansson and Taş, 2014; Liebner et al., 2009; Mitzscherling et al., 2017; Taş et al., 2018). Furthermore, the most abundant taxa Actinobacteria, Chloroflexi, Firmicutes, Gemmatimonadetes, and Proteobacteria (Fig. 5) are amongst the groups that were found to be active under frozen conditions in permafrost (Coolen and Orsi, 2015; Tuorto et al., 2014). The non-spore-forming Actinobacteria were reported to dominate permafrost since they are well adapted to freezing conditions (Johnson et al., 2007). They are metabolically active at low temperatures and possess DNA repair mechanisms. Firmicutes and Proteobacteria likely resist long-term exposure to subzero temperatures as they take advantage of nutrient and water availability (Johnson et al., 2007; Yergeau et al., 2010). In addition, many members of the Firmicutes are able to form spores. Candidatus Atribacteria, which dominated in the core C3, were recently described to harbour functions for survival under extreme conditions like high salinities and cold temperatures (Glass et al., 2019). They are further one of the cosmopolitan groups in the sub-seafloor and dominate the bacterial community in deep anoxic sediments with low organic carbon contents (Orsi, 2018). This makes Atribacteria another candidate for activity under in situ conditions in submarine permafrost. Genome-based metabolic prediction shows that Atribacteria can ferment sugars and propionate producing H2, which is a critical source of energy in anoxic settings, and they have the potential to polymerize carbohydrates and store them in the shell proteins of bacterial microcompartments, thus increasing their fitness and leading to their selection (Orsi, 2018). Besides sub-seafloor sediments, Atribacteria were found to be abundant in lacustrine sediments in Argentina that were deposited under similar environmental conditions as C3, with permafrost and reduced vegetation in the catchment, an active hydrology reworking and dispersing the soils, and a very low organic carbon content. Also, climatic conditions in the sedimentation period of the lacustrine sediments were similar to that of Unit II in C3, covering the driest period of the record and overall positive temperatures (Vuillemin et al., 2018).
The TCCs of the onshore permafrost core C1 were in the upper range of cell counts (106-107 cells g−1) reported for other permafrost environments (Gilichinsky et al., 2008; Jansson and Taş, 2014; Steven et al., 2006), and TCCs of the three submarine permafrost cores were comparable to microbial abundances from organic-carbon-rich sub-seafloor sediments (105–107 cells g−1) (Kallmeyer et al., 2012; Parkes et al., 2014). TCC and bacterial 16S rRNA gene abundance in cores C1 and C2, which were the highest in this study, were at least 1 order of magnitude lower than values for the active layer, i.e. the seasonally thawed, upper permafrost layer (Kobabe et al., 2004; Liebner et al., 2008, 2015). This is in line with modelling studies on generation times in the subsurface where cells were reported to divide only every 10 to 100 years (Jørgensen and Marshall, 2016; Starnawski et al., 2017). It also underlines the fact that the effect of warming on microbial abundance in the investigated submarine permafrost cores was likely poor as discussed earlier. The observation that 16S rRNA gene copies mostly exceeded TCC by an order of magnitude may reflect the long-term preservation of extracellular DNA due to low-temperature conditions in permafrost (Stokstad, 2003; Willerslev et al., 2004) and, to a lesser extent, the appearance of multiple 16S rRNA gene copies per cell (Schmidt, 1998). Although qPCR is a good relative quantification method, it is only poorly related to cell counts (Lloyd et al., 2013). In addition, cell counts might be slightly underestimated due to hidden cells below sediment particles (Kallmeyer, 2011).
Substantial permafrost warming is occurring throughout the Arctic today, and the associated response of microbial communities driving biogeochemical cycling and the formation of greenhouse gases is of general interest. Inundation by seawater accelerates permafrost warming and results in a steady state of temperature under the present conditions within a few centuries. This makes submarine permafrost a suitable natural laboratory to study the microbial response on climate-relevant timescales. Our results demonstrate that both microbial abundance and community composition even after millennia of submarine permafrost warming by more than 10 ∘C reflect the paleoclimate and sedimentation history. However, even though we could not finally prove that long-term permafrost warming directly affects microbial abundance and bacterial community composition, we found indications for it, especially in the core that had experienced the longest warming. This deserves more attention because a direct effect of permafrost warming on microbial abundance, composition, and carbon turnover would alter our understanding of the permafrost carbon feedback, which to date only considers permafrost thaw. Based on our work we suggest that future work address the responsiveness of microbial communities to permafrost warming through the analysis of organic matter quality (Fischer et al., 2002), the chemical composition of permafrost dissolved organic matter (DOM) (Spencer et al., 2015; Sun et al., 1997; Ward and Cory, 2015), the natural abundance isotope ratios of biomarkers (Boschker and Middelburg, 2002), metagenomics, and metatranscriptomics (Coolen and Orsi, 2015; Mackelprang et al., 2017). Finally, in this study the length of the coring transect (∼12 km), the age span within and between the cores, and hence the comparatively long sedimentation period encompassed by our samples from Unit II had a stronger influence on recent microbial abundance and community than the large level of physicochemical similarity within this unit (Fig. 3 insert). Further studies on the microbial response to permafrost warming should focus on historically more similar samples without neglecting similar physicochemical properties.
Sequences of the submarine permafrost communities presented in this work were deposited at the NCBI Sequence Read Archive (SRA) with the project number BioProject ID PRJNA352907 (German Research Centre for Geosciences, 2016). Bacterial 16S rRNA gene sequences have the SRA accession numbers SRR7908003–SRR7908028 and are available from Genbank, EMBL, and DDBJ (https://doi.org/10.1594/PANGAEA.895292, Mitzscherling et al., 2018). Environmental data of the sediment cores are available at https://doi.org/10.1594/PANGAEA.895292 (Mitzscherling et al., 2018).
The supplement related to this article is available online at: https://doi.org/10.5194/bg-16-3941-2019-supplement.
SL, DW, MWk, and JM formulated the research question and study design. PPO and MNG conducted fieldwork. JM visualized the data and prepared graphs. MWf and PPO provided pore water and physicochemical data. FH conducted the bioinformatics analysis. LM performed and JK supported the cell counting. JM and SL prepared the original draft. All authors contributed to the discussion and interpretation of the data and the writing of the paper.
The authors declare that they have no conflict of interest.
Our thanks go to Aleksandr Maslov (SB RAS, Melnikov Permafrost Institute, Yakutsk, Russia), who provided indispensable drilling expertise. We thank Tiksi Hydrobase staff members Viktor Bayderin, Viktor Dobrobaba, Sergey Kamarin, Valery Kulikov, Dmitry Mashkov, Dmitry Melnichenko, Aleksandr Safin, and Aleksandr Shiyan for their field support and Dimitry Yu Bolshiyanov (Arctic Antarctic Research Institute, St. Petersburg) for help with logistical issues. We further thank Anke Saborowski, Antje Eulenburg, Ute Bastian, and Katja Hockun for excellent laboratory support.
Drilling was supported by the German Ministry for Education
and Research, a Joint Russian–German Research Group (HGF-JRG100) of the
Helmholtz Association of German Research Centres, and by the EU's INTAS
programme. Susanne Liebner is grateful for funding from the Helmholtz Young
Investigators Group (grant VH-NG-919).
The article processing charges for this open-access
publication were covered by a Research
Centre of the Helmholtz Association.
This paper was edited by Denise Akob and reviewed by two anonymous referees.
Allison, S. D., McGuire, K. L., and Treseder, K. K.: Resistance of microbial and soil properties to warming treatment seven years after boreal fire, Soil Biol. Biochem., 42, 1872–1878, https://doi.org/10.1016/j.soilbio.2010.07.011, 2010.
Bischoff, J., Mangelsdorf, K., Gattinger, A., Schloter, M., Kurchatova, A. N., Herzschuh, U., and Wagner, D.: Response of methanogenic archaea to Late Pleistocene and Holocene climate changes in the Siberian Arctic, Global Biogeochem. Cy., 27, 305–317, https://doi.org/10.1029/2011GB004238, 2013.
Biskaborn, B. K., Smith, S. L., Noetzli, J., Matthes, H., Vieira, G., Streletskiy, D. A., Schoeneich, P., Romanovsky, V. E., Lewkowicz, A. G., Abramov, A., Allard, M., Boike, J., Cable, W. L., Christiansen, H. H., Delaloye, R., Diekmann, B., Drozdov, D., Etzelmüller, B., Grosse, G., Guglielmin, M., Ingeman-Nielsen, T., Isaksen, K., Ishikawa, M., Johansson, M., Johannsson, H., Joo, A., Kaverin, D., Kholodov, A., Konstantinov, P., Kröger, T., Lambiel, C., Lanckman, J.-P., Luo, D., Malkova, G., Meiklejohn, I., Moskalenko, N., Oliva, M., Phillips, M., Ramos, M., Sannel, A. B. K., Sergeev, D., Seybold, C., Skryabin, P., Vasiliev, A., Wu, Q., Yoshikawa, K., Zheleznyak, M., and Lantuit, H.: Permafrost is warming at a global scale, Nat. Commun., 10, 264, https://doi.org/10.1038/s41467-018-08240-4, 2019.
Bolger, A. M., Lohse, M., and Usadel, B.: Trimmomatic: A flexible trimmer for Illumina sequence data, Bioinformatics, 30, 2114–2120, https://doi.org/10.1093/bioinformatics/btu170, 2014.
Boschker, H. T. S. and Middelburg, J. J.: Stable isotopes and biomarkers in microbial ecology, FEMS Microbiol. Ecol., 40, 85–95, https://doi.org/10.1111/j.1574-6941.2002.tb00940.x, 2002.
Boss, C. B. and Frieden, K. J.: Concepts, instrumentation, and techniques in inductively coupled plasma atomic emission spectrometry, Handbook Perkin-Elmer, Perkin- Elmer Corporation, USA, 1989.
Bottos, E. M., Kennedy, D. W., Romero, E. B., Fansler, S. J., Brown, J. M., Bramer, L. M., Chu, R. K., Tfaily, M. M., Jansson, J. K., and Stegen, J. C.: Dispersal limitation and thermodynamic constraints govern spatial structure of permafrost microbial communities, FEMS Microbiol. Ecol., 94, 1–48, https://doi.org/10.1101/265132, 2018.
Brown, J., Ferrians, Jr, O. J., Heginbottom, J. A., and Melnikov, E.: Circum-Arctic map of permafrost and ground-ice conditions, US Geological Survey, Washington DC., 1997.
Brown, J., Ferrians Jr., O. J., Heginbottom, J. A., and Melnikov, E. S.: Circum-Arctic Map of Permafrost and Ground-Ice Conditions, Version 2, Natl. Snow and Ice Data Cent., Boulder, Colo., 2002.
Caporaso, J. G., Kuczynski, J., Stombaugh, J., Bittinger, K., Bushman, F. D., Costello, E. K., Fierer, N., Peña, A. G., Goodrich, J. K., Gordon, J. I., Huttley, G. a, Kelley, S. T., Knights, D., Koenig, J. E., Ley, R. E., Lozupone, C. a, Mcdonald, D., Muegge, B. D., Pirrung, M., Reeder, J., Sevinsky, J. R., Turnbaugh, P. J., Walters, W. a, Widmann, J., Yatsunenko, T., Zaneveld, J., and Knight, R.: QIIME allows analysis of high- throughput community sequencing data, Nat. Methods, 7, 335–336, https://doi.org//10.1038/nmeth.f.303, 2010.
Ciobanu, M.-C., Rabineau, M., Droz, L., Révillon, S., Ghiglione, J.-F., Dennielou, B., Jorry, S.-J., Kallmeyer, J., Etoubleau, J., Pignet, P., Crassous, P., Vandenabeele-Trambouze, O., Laugier, J., Guégan, M., Godfroy, A., and Alain, K.: Sedimentological imprint on subseafloor microbial communities in Western Mediterranean Sea Quaternary sediments, Biogeosciences, 9, 3491–3512, https://doi.org/10.5194/bg-9-3491-2012, 2012.
Coolen, M. J. L. and Orsi, W. D.: The transcriptional response of microbial communities in thawing Alaskan permafrost soils, Front. Microbiol., 6, 1–14, https://doi.org/10.3389/fmicb.2015.00197, 2015.
DeAngelis, K. M., Pold, G., Topçuoglu, B. D., van Diepen, L. T. a., Varney, R. M., Blanchard, J. L., Melillo, J., and Frey, S. D.: Long-term forest soil warming alters microbial communities in temperate forest soils, Front. Microbiol., 6, 1–13, https://doi.org/10.3389/fmicb.2015.00104, 2015.
Fierer, N. and Jackson, R. B.: The diversity and biogeography of soil bacterial communities, P. Natl. Acad. Sci. USA, 103, 626–631, https://doi.org/10.1073/pnas.0507535103, 2006.
Fischer, H., Wanner, S. C., and Pusch, M.: Bacterial abundance and production in river sediments as related to the biochemical composition of particulate organic matter (POM), Biogeochemistry, 61, 37–55, https://doi.org/10.1023/A:1020298907014, 2002.
Fritz, M., Vonk, J. E., and Lantuit, H.: Collapsing Arctic coastlines, Nat. Clim. Change, 7, 6–7, https://doi.org/10.1038/nclimate3188, 2017.
Galinski, E. A.: Osmoadaptation in Bacteria, Adv. Microb. Physiol., 37, 273–328, https://doi.org/10.1016/S0065-2911(08)60148-4, 1995.
German Research Centre for Geosciences: Submarine permafrost, NCBI, available at: https://www.ncbi.nlm.nih.gov/bioproject/PRJNA352907 (last access: 24 September 2019), 2016.
Gilichinsky, D., Vishnivetskaya, T., Petrova, M., Spirina, E., Mamykin, V., and Rivkina, E.: Bacteria in permafrost, in Psychrophiles: From Biodiversity to Biotechnology, edited by: Margesin, R., 83–102, Springer-Verlag, Berlin Heidelberg, 2008.
Glass, J. B., Ranjan, P., Kretz, C. B., Nunn, B. L., Johnson, A. M., McManus, J., and Stewart, F. J.: Adaptations of Atribacteria to life in methane hydrates: hot traits for cold life, bioRxiv, 536078, https://doi.org/10.1101/536078, 2019.
Graham, D. E., Wallenstein, M. D., Vishnivetskaya, T. A., Waldrop, M. P., Phelps, T. J., Pfiffner, S. M., Onstott, T. C., Whyte, L. G., Rivkina, E. M., Gilichinsky, D. A., Elias, D. A., MacKelprang, R., Verberkmoes, N. C., Hettich, R. L., Wagner, D., Wullschleger, S. D., and Jansson, J. K.: Microbes in thawing permafrost: The unknown variable in the climate change equation, ISME J., 6, 709–712, https://doi.org/10.1038/ismej.2011.163, 2012.
Grigoriev, M. N.: Kriomorphogenez i litodinamika pribrezhno-shelfovoi zony morei Vostochnoi Sibiri (Cryomorphogenesis and lithodynamics of the East Siberian near-shore shelf zone), Russian Academy of Sciences, Siberian Branch, Yakutsk, 2008 (in Russian).
Günther, F., Overduin, P. P., Sandakov, A. V., Grosse, G., and Grigoriev, M. N.: Short- and long-term thermo-erosion of ice-rich permafrost coasts in the Laptev Sea region, Biogeosciences, 10, 4297–4318, https://doi.org/10.5194/bg-10-4297-2013, 2013.
Hammer, Ø., Harper, D. A. T., and Ryan, P. D.: Paleontological Statistics Software: Package for Education and Data Analysis, Palaeontol. Electron., 4, 1–9, 2001.
Hubberten, H. W., Andreev, A., Astakhov, V. I., Demidov, I., Dowdeswell, J. A., Henriksen, M., Hjort, C., Houmark-Nielsen, M., Jakobsson, M., Kuzmina, S., Larsen, E., Lunkka, J. P., Lyså, A., Mangerud, J., Möller, P., Saarnisto, M., Schirrmeister, L., Sher, A. V., Siegert, C., Siegert, M. J., and Svendsen, J. I.: The periglacial climate and environment in northern Eurasia during the Last Glaciation, Quaternary Sci. Rev., 23, 1333–1357, https://doi.org/10.1016/j.quascirev.2003.12.012, 2004.
Hultman, J., Waldrop, M. P., Mackelprang, R., David, M. M., McFarland, J., Blazewicz, S. J., Harden, J., Turetsky, M. R., McGuire, A. D., Shah, M. B., VerBerkmoes, N. C., Lee, L. H., Mavrommatis, K., and Jansson, J. K.: Multi-omics of permafrost, active layer and thermokarst bog soil microbiomes, Nature, 521, 208–212, https://doi.org/10.1038/nature14238, 2015.
Inagaki, F. and Nealson, K. H.: The Paleome: Letters from ancient earth, in Past and Present Water Column Anoxia, Kluwer Academic Publishers, Dordrecht, 21–39, 2006.
Inagaki, F., Hinrichs, K.-U., Kubo, Y., Bowles, M. W., Heuer, V. B., Hong, W.-L., Hoshino, T., Ijiri, A., Imachi, H., Ito, M., Kaneko, M., Lever, M. A., Lin, Y.-S., Methé, B. A., Morita, S., Morono, Y., Tanikawa, W., Bihan, M., Bowden, S. A., Elvert, M., Glombitza, C., Gross, D., Harrington, G. J., Hori, T., Li, K., Limmer, D., Liu, C.-H., Murayama, M., Ohkouchi, N., Ono, S., Park, Y.-S., Phillips, S. C., Prieto-Mollar, X., Purkey, M., Riedinger, N., Sanada, Y., Sauvage, J., Snyder, G., Susilawati, R., Takano, Y., Tasumi, E., Terada, T., Tomaru, H., Trembath-Reichert, E., Wang, D. T., and Yamada, Y.: Exploring deep microbial life in coal-bearing sediment down to ∼2.5 km below the ocean floor, Science, 349, 420–424, https://doi.org/10.1126/science.aaa6882, 2015.
IPCC in Climate Change 2013: The Physical Science Basis. Contribution of Working Group I to the Fifth Assessment Report of the Intergovernmental Panel on Climate Change, Cambridge Univ. Press, 1535, 2013.
Jansson, J. K. and Taş, N.: The microbial ecology of permafrost, Nat. Rev. Microbiol., 12, 414–425, https://doi.org/10.1038/nrmicro3262, 2014.
Jiang, H., Dong, H., Yu, B., Liu, X., Li, Y., Ji, S., and Zhang, C. L.: Microbial response to salinity change in Lake Chaka, a hypersaline lake on Tibetan plateau, Environ. Microbiol., 9, 2603–2621, https://doi.org/10.1111/j.1462-2920.2007.01377.x, 2007.
Johnson, S. S., Hebsgaard, M. B., Christensen, T. R., Mastepanov, M., Nielsen, R., Munch, K., Brand, T., Gilbert, M. T. P., Zuber, M. T., Bunce, M., Rønn, R., Gilichinsky, D., Froese, D., and Willerslev, E.: Ancient bacteria show evidence of DNA repair, P. Natl. Acad. Sci. USA, 104, 14401–14405, https://doi.org/10.1073/pnas.0706787104, 2007.
Jørgensen, B. B. and Marshall, I. P. G.: Slow Microbial Life in the Seabed, Ann. Rev. Mar. Sci., 8, 311–332, https://doi.org/10.1146/annurev-marine-010814-015535, 2016.
Junge, K., Eicken, H., and Deming, J. W.: Bacterial Activity at -2 to -20 degrees C in Arctic wintertime sea ice., Appl. Environ. Microbiol., 70, 550–557, https://doi.org/10.1128/AEM.70.1.550-557.2004, 2004.
Junker, R., Grigoriev, M. N., and Kaul, N.: Non-contact infrared temperature measurements in dry permafrost boreholes, J. Geophys. Res.-Sol. Ea., 113, B4102, https://doi.org/10.1029/2007JB004946, 2008.
Kallmeyer, J.: Detection and Quantification of Microbial Cells in Subsurface Sediments, 1st ed., Elsevier Inc., 2011.
Kallmeyer, J., Pockalny, R., Adhikari, R. R., Smith, D. C., and D'Hondt, S.: Global distribution of microbial abundance and biomass in subseafloor sediment, P. Natl. Acad. Sci. USA, 109, 16213–16216, https://doi.org/10.1073/pnas.1203849109, 2012.
Kattsov, V. M., Källén, E., Cattle, H., Christensen, J., Drange, H., Hanssen-bauer, I., Jóhannesen, T., Karol, I., Räisänen, J., Svensson, G., Chen, D., Polyakov, I., and Rinke, A.: Future Climate Change: Modeling and Scenarios for the Arctic, in: Arctic Climate Impact Assessment, 99–150, 2005.
Kneier, F., Overduin, P. P., Langer, M., Boike, J., and Grigoriev, M. N.: Borehole temperature reconstructions reveal differences in past surface temperature trends for the permafrost in the Laptev Sea region, Russian Arctic, arktos, 4, 1–17, https://doi.org/10.1007/s41063-018-0041-3, 2018.
Kobabe, S., Wagner, D., and Pfeiffer, E.-M.: Characterisation of microbial community composition of a Siberian tundra soil by fluorescence in situ hybridisation, FEMS Microbiol. Ecol., 50, 13–23, https://doi.org/10.1016/j.femsec.2004.05.003, 2004.
Koch, K., Knoblauch, C., and Wagner, D.: Methanogenic community composition and anaerobic carbon turnover in submarine permafrost sediments of the Siberian Laptev Sea, Environ. Microbiol., 11, 657–668, https://doi.org/10.1111/j.1462-2920.2008.01836.x, 2009.
Lantuit, H., Overduin, P. P., Couture, N., Wetterich, S., Aré, F., Atkinson, D., Brown, J., Cherkashov, G., Drozdov, D., Donald Forbes, L., Graves-Gaylord, A., Grigoriev, M., Hubberten, H. W., Jordan, J., Jorgenson, T., Ødegård, R. S., Ogorodov, S., Pollard, W. H., Rachold, V., Sedenko, S., Solomon, S., Steenhuisen, F., Streletskaya, I., and Vasiliev, A.: The Arctic Coastal Dynamics Database: A New Classification Scheme and Statistics on Arctic Permafrost Coastlines, Estuar. Coast., 35, 383–400, https://doi.org/10.1007/s12237-010-9362-6, 2012.
Larry Lopez, C. M., Brouchkov, A., Nakayama, H., Takakai, F., Fedorov, A. N., and Fukuda, M.: Epigenetic salt accumulation and water movement in the active layer of central Yakutia in eastern Siberia, Hydrol. Process., 21, 103–109, https://doi.org/10.1002/hyp.6224, 2007.
Lauber, C. L., Hamady, M., Knight, R., and Fierer, N.: Pyrosequencing-Based Assessment of Soil pH as a Predictor of Soil Bacterial Community Structure at the Continental Scale, Appl. Environ. Microbiol., 75, 5111–5120, https://doi.org/10.1128/aem.00335-09, 2009.
Liebner, S., Harder, J., and Wagner, D.: Bacterial diversity and community structure in polygonal tundra soils from Samoylov Island, Lena Delta, Siberia, Int. Microbiol., 11, 195–202, https://doi.org/10.2436/20.1501.01.60, 2008.
Liebner, S., Rublack, K., Stuehrmann, T., and Wagner, D.: Diversity of aerobic methanotrophic bacteria in a permafrost active layer soil of the Lena Delta, Siberia, Microb. Ecol., 57, 25–35, https://doi.org/10.1007/s00248-008-9411-x, 2009.
Liebner, S., Ganzert, L., Kiss, A., Yang, S., Wagner, D., and Svenning, M. M.: Shifts in methanogenic community composition and methane fluxes along the degradation of discontinuous permafrost, Front. Microbiol., 6, 1–10, https://doi.org/10.3389/fmicb.2015.00356, 2015.
Lindström, E. S. and Langenheder, S.: Local and regional factors influencing bacterial community assembly, Environ. Microbiol. Rep., 4, 1–9, https://doi.org/10.1111/j.1758-2229.2011.00257.x, 2012.
Llobet-Brossa, E., Rossello-Mora, R., and Amann, R.: Microbial Community Composition of Wadden Sea Sediments as Revealed by Fluorescence In Situ Hybridization, Appl. Environ. Microbiol., 64, 2691–2696, 1998.
Lloyd, K. G., May, M. K., Kevorkian, R. T., and Steen, A. D.: Meta-analysis of quantification methods shows that archaea and bacteria have similar abundances in the subseafloor, Appl. Environ. Microbiol., 79, 7790–7799, https://doi.org/10.1128/AEM.02090-13, 2013.
Luo, C., Rodriguez-R, L. M., Johnston, E. R., Wu, L., Cheng, L., Xue, K., Tu, Q., Deng, Y., He, Z., Shi, J. Z., Yuan, M. M., Sherry, R. A., Li, D., Luo, Y., Schuur, E. A. G., Chain, P., Tiedje, J. M., Zhou, J., and Konstantinidis, K. T.: Soil microbial community responses to a decade of warming as revealed by comparative metagenomics, Appl. Environ. Microbiol., 80, 1777–1786, https://doi.org/10.1128/AEM.03712-13, 2014.
Lyra, C., Sinkko, H., Rantanen, M., Paulin, L., and Kotilainen, A.: Sediment Bacterial Communities Reflect the History of a Sea Basin, edited by: Slomp, C. P., PLoS One, 8, e54326, https://doi.org/10.1371/journal.pone.0054326, 2013.
Mackelprang, R., Waldrop, M. P., DeAngelis, K. M., David, M. M., Chavarria, K. L., Blazewicz, S. J., Rubin, E. M., and Jansson, J. K.: Metagenomic analysis of a permafrost microbial community reveals a rapid response to thaw, Nature, 480, 368–371, https://doi.org/10.1038/nature10576, 2011.
Mackelprang, R., Burkert, A., Haw, M., Mahendrarajah, T., Conaway, C. H., Douglas, T. A., and Waldrop, M. P.: Microbial survival strategies in ancient permafrost: Insights from metagenomics, ISME J., 11, 2305–2318, https://doi.org/10.1038/ismej.2017.93, 2017.
Martin, M.: Cutadapt removes adapter sequences from high-throughput sequencing reads, EMBnet. Journal, 17, 10–12, https://doi.org/10.14806/ej.17.1.200, 2011.
Meyer, H., Schönicke, L., Wand, U., Hubberten, H. W., and Friedrichsen, H.: Isotope studies of hydrogen and oxygen in ground ice – Experiences with the equilibration technique, Isotopes Environ. Health Stud., 36, 133–149, https://doi.org/10.1080/10256010008032939, 2000.
Meyer, H., Dereviagin, A., Siegert, C., Schirrmeister, L., and Hubberten, H. W.: Palaeoclimate reconstruction on Big Lyakhovsky Island, North Siberia – Hydrogen and oxygen isotopes in ice wedges, Permafrost Periglac., 13, 91–105, https://doi.org/10.1002/ppp.416, 2002a.
Meyer, H., Dereviagin, A., Siegert, C., and Hubberten, H.-W.: Paleoclimatic Studies on Bykovsky Peninsula, North Siberia – Hydrogen and Oxygen Isotopes in Ground Ice, Polarforschung, 70, 37–51, 2002b.
Mitzscherling, J., Winkel, M., Winterfeld, M., Horn, F., Yang, S., Grigoriev, M. N., Wagner, D., Overduin, P. P., and Liebner, S.: The development of permafrost bacterial communities under submarine conditions, J. Geophys. Res.-Biogeo., 122, 1689–1704, https://doi.org/10.1002/2017JG003859, 2017.
Mitzscherling, J., Horn, F., Winterfeld, M., Mahler, L., Kallmeyer, J., Overduin, P. P., Winkel, M., Grigoriev, M. N., Wagner, D., and Liebner, S.: Pore water chemistry, grain sizes and sediment temperature of 4 sediment cores from submarine permafrost at Mamontov Klyk Cape, Laptev Sea shelf, PANGAEA, https://doi.org/10.1594/PANGAEA.895292, 2018.
Orsi, W. D.: Ecology and evolution of seafloor and subseafloor microbial communities, Nat. Rev. Microbiol., 16, 671–683, https://doi.org/10.1038/s41579-018-0046-8, 2018.
Orsi, W. D., Coolen, M. J. L., Wuchter, C., He, L., More, K. D., Irigoien, X., Chust, G., Johnson, C., Hemingway, J. D., Lee, M., Galy, V., and Giosan, L.: Climate oscillations reflected within the microbiome of Arabian Sea sediments, Sci. Rep., 7, 1–12, https://doi.org/10.1038/s41598-017-05590-9, 2017.
Overduin, P. P.: Russian-German Cooperation SYSTEM LAPTEV SEA: The expedition COAST I, in Expeditions in Siberia 2005, edited by: Schirrmeister, L., 1–40, Reports on Polar and Marine Research, 2007.
Overduin, P. P., Rachold, V., and Grigoriev, M. N.: The State of Subsea Permafrost in the Western Laptev Nearshore Zone, in: Proceedings of the Ninth International Conference on Permafrost, Faribanks, Alaska, 1345–1350, 2008.
Overduin, P. P., Liebner, S., Knoblauch, C., Günther, F., Wetterich, S., Schirrmeister, L., Hubberten, H. W., and Grigoriev, M. N.: Methane oxidation following submarine permafrost degradation: Measurements from a central Laptev Sea shelf borehole, J. Geophys. Res.-Biogeo., 120, 965–978, https://doi.org/10.1002/2014JG002862, 2015.
Parkes, R. J., Sass, H., Cragg, B. A., Webster, G., Roussel, E. G. P., and Weightman, A. J.: Studies on prokaryotic populations and processes in subseafloor sediments – an update, in Microbial Life of the Deep Biosphere, edited by: Kallmeyer, J. and Wagner, D., de Gruyter, Berlin, 1–27, 2014.
Portnov, A., Smith, A. J., Mienert, J., Cherkashov, G., Rekant, P., Semenov, P., Serov, P., and Vanshtein, B.: Offshore permafrost decay and massive seabed methane escape in water depths >20 m at the South Kara Sea shelf, Geophys. Res. Lett., 40, 3962–3967, https://doi.org/10.1002/grl.50735, 2013.
Rachold, V., Bolshiyanov, D. Y., Grigoriev, M. N., Hubberten, H.-W., Junker, R., Kunitsky, V. V., Merker, F., Overduin, P., and Schneider, W.: Nearshore arctic subsea permafrost in transition, EOS T. Am. Geophys. Un., 88, 149–150, https://doi.org/10.1029/2007EO130001, 2007.
Radujković, D., Verbruggen, E., Sigurdsson, B. D., Leblans, N. I. W., Janssens, I. A., Vicca, S., and Weedon, J. T.: Prolonged exposure does not increase soil microbial community compositional response to warming along geothermal gradients, FEMS Microbiol. Ecol., 94, 1–10, https://doi.org/10.1093/femsec/fix174, 2018.
Rath, K. M. and Rousk, J.: Salt effects on the soil microbial decomposer community and their role in organic carbon cycling?: A review, Soil Biol. Biochem., 81, 108–123, https://doi.org/10.1016/j.soilbio.2014.11.001, 2015.
Rietz, D. N. and Haynes, R. J.: Effects of irrigation-induced salinity and sodicity on soil microbial activity, Soil Biol. Biochem., 35, 845–854, https://doi.org/10.1016/S0038-0717(03)00125-1, 2003.
Rinnan, R., Michelsen, A., Baath, E., and Jonasson, S.: Fifteen years of climate change manipulations alter soil microbial communities in a subarctic heath ecosystem, Glob. Change Biol., 13, 28–39, https://doi.org/10.1111/j.1365-2486.2006.01263.x, 2007.
Rivkina, E. M., Friedmann, E. I., and Mckay, C. P.: Metabolic Activity of Permafrost Bacteria below the Freezing Point, Appl. Environ. Microbiol., 66, 3230–3233, https://doi.org/10.1128/AEM.66.8.3230-3233.2000, 2000.
Romanovskii, N. N. and Hubberten, H. W.: Results of permafrost modelling of the lowlands and shelf of the Laptev Sea Region, Russia, Permafrost Periglac., 12, 191–202, https://doi.org/10.1002/ppp.387, 2001.
Romanovskii, N. N., Hubberten, H. W., Gavrilov, A. V, Tumskoy, V. E., and Kholodov, A. L.: Permafrost of the east Siberian Arctic shelf and coastal lowlands, Quaternary Sci. Rev., 23, 1359–1369, https://doi.org/10.1016/j.quascirev.2003.12.014, 2004.
Romanovskii, N. N., Hubberten, H. W., Gavrilov, A. V., Eliseeva, A. A., and Tipenko, G. S.: Offshore permafrost and gas hydrate stability zone on the shelf of East Siberian Seas, Geo-Mar. Lett., 25, 167–182, https://doi.org/10.1007/s00367-004-0198-6, 2005.
Rousk, J., Elyaagubi, F. K., Jones, D. L., and Godbold, D. L.: Bacterial salt tolerance is unrelated to soil salinity across an arid agroecosystem salinity gradient, Soil Biol. Biochem., 43, 1881–1887, https://doi.org/10.1016/j.soilbio.2011.05.007, 2011.
Rui, J., Li, J., Wang, S., An, J., Liu, W., Lin, Q., Yang, Y., He, Z., and Li, X.: Responses of Bacterial Communities to Simulated Climate Changes in Alpine Meadow Soil of the Qinghai-Tibet Plateau, Appl. Environ. Microbiol., 81, 6070–6077, https://doi.org/10.1128/AEM.00557-15, 2015.
Schimel, J., Balser, T. C., and Wallenstein, M.: Microbial Stress-Response Physiology and Its Implications for Ecosystem Function, Ecology, 88, 1386–1394, https://doi.org/10.1890/06-0219, 2007.
Schindlbacher, A., Rodler, A., Kuffner, M., Kitzler, B., Sessitsch, A., and Zechmeister-Boltenstern, S.: Experimental warming effects on the microbial community of a temperate mountain forest soil, Soil Biol. Biochem., 43, 1417–1425, https://doi.org/10.1016/j.soilbio.2011.03.005, 2011.
Schmidt, T. M.: Multiplicity of Ribosomal RNA Operons in Prokaryotic Genomes, in: Bacterial Genomes, Springer US, Boston, MA, 221–229, 1998.
Schuur, E. A. G., Bockheim, J., Canadell, J. G., Euskirchen, E., Field, C. B., Goryachkin, S. V, Hagemann, S., Kuhry, P., Lafleur, P. M., Lee, H., Mazhitova, G., Nelson, F. E., Rinke, A., Romanovsky, V. E., Shiklomanov, N., Tarnocai, C., Venevsky, S., Vogel, J. G., and Zimov, S. A.: Vulnerability of permafrost carbon to climate change: Implications for the global carbon cycle, Bioscience, 58, 701–714, https://doi.org/10.1641/B580807, 2008.
Schuur, E. A. G., Vogel, J. G., Crummer, K. G., Lee, H., Sickman, J. O., and Osterkamp, T. E.: The effect of permafrost thaw on old carbon release and net carbon exchange from tundra, Nature, 459, 556–559, https://doi.org/10.1038/Nature08031, 2009.
Seto, M. and Yanagiya, K.: Rate of CO2 evolution from soil in relation to temperature and amount of dissolved organic carbon, Japanese J. Ecol., 33, 199–205, 1983.
Shakhova, N., Semiletov, I., Salyuk, A., Yusupov, V., Kosmach, D., and Gustafsson, Ö.: Extensive Methane Venting to the Atmosphere from Sediments of the East Siberian Arctic Shelf, Science, 327, 1246–1250, https://doi.org/10.1126/science.1229223, 2010.
Shakhova, N., Semiletov, I., Leifer, I., Sergienko, V., Salyuk, A., Kosmach, D., Chernykh, D., Stubbs, C., Nicolsky, D., Tumskoy, V., and Gustafsson, Ö.: Ebullition and storm-induced methane release from the East Siberian Arctic Shelf, Nat. Geosci., 7, 64–70, https://doi.org/10.1038/ngeo2007, 2014.
Skogland, T., Lomeland, S., and Goksøyr, J.: Respiratory burst after freezing and thawing of soil: Experiments with soil bacteria, Soil Biol. Biochem., 20, 851–856, https://doi.org/10.1016/0038-0717(88)90092-2, 1988.
Smolander, A. and Kitunen, V.: Soil microbial activities and characteristics of dissolved organic C and N in relation to tree species, Soil Biol. Biochem., 34, 651–660, https://doi.org/10.1016/S0038-0717(01)00227-9, 2002.
Spencer, R. G. M., Mann, P. J., Dittmar, T., Eglinton, T. I., McIntyre, C., Holmes, R. M., Zimoc, N., and Stubbins, A.: Detecting the signature of permafrost thaw in Arctic rivers, Geophys. Res. Lett., 42, 1–6, https://doi.org/10.1002/2015GL063498, 2015.
Starnawski, P., Bataillon, T., Ettema, T. J. G., Jochum, L. M., Schreiber, L., Chen, X., Lever, M. a., Polz, M. F., Jørgensen, B. B., Schramm, A., and Kjeldsen, K. U.: Microbial community assembly and evolution in subseafloor sediment, P. Natl. Acad. Sci. USA, 114, 2940–2945, https://doi.org/10.1073/pnas.1614190114, 2017.
Steven, B., Léveillé, R., Pollard, W. H., and Whyte, L. G.: Microbial ecology and biodiversity in permafrost, Extremophiles, 10, 259–267, https://doi.org/10.1007/s00792-006-0506-3, 2006.
Stokstad, E.: Ancient DNA Pulled From Soil, Science, 300, 407–407, https://doi.org/10.1126/science.300.5618.407a, 2003.
Sun, L., Perdue, E. M., Meyer, J. L., and Weis, J.: Use of elemental composition to predict bioavailability of dissolved organic matter in a Georgia river, Limnol. Oceanogr., 42, 714–721, https://doi.org/10.4319/lo.1997.42.4.0714, 1997.
Svendsen, J. I., Alexanderson, H., Astakhov, V. I., Demidov, I., Dowdeswell, J. a., Funder, S., Gataullin, V., Henriksen, M., Hjort, C., Houmark-Nielsen, M., Hubberten, H. W., Ingólfsson, Ó., Jakobsson, M., Kjær, K. H., Larsen, E., Lokrantz, H., Lunkka, J. P., Lyså, A., Mangerud, J., Matiouchkov, A., Murray, A., Möller, P., Niessen, F., Nikolskaya, O., Polyak, L., Saarnisto, M., Siegert, C., Siegert, M. J., Spielhagen, R. F., and Stein, R.: Late Quaternary ice sheet history of northern Eurasia, Quaternary Sci. Rev., 23, 1229–1271, https://doi.org/10.1016/j.quascirev.2003.12.008, 2004.
Tarnocai, C., Canadell, J. G., Schuur, E. A. G., Kuhry, P., Mazhitova, G., and Zimov, S.: Soil organic carbon pools in the northern circumpolar permafrost region, Global Biogeochem. Cy., 23, GB2023, https://doi.org/10.1029/2008gb003327, 2009.
Taş, N., Prestat, E., Wang, S., Wu, Y., Ulrich, C., Kneafsey, T., Tringe, S. G., Torn, M. S., Hubbard, S. S., and Jansson, J. K.: Landscape topography structures the soil microbiome in arctic polygonal tundra, Nat. Commun., 9, 777, https://doi.org/10.1038/s41467-018-03089-z, 2018.
Taylor, J. P., Wilson, B., Mills, M. S., and Burns, R. G.: Comparison of microbial numbers and enzymatic activities in surface soils and subsoils using various techniques, Soil Biol. Biochem., 34, 387–401, https://doi.org/10.1016/S0038-0717(01)00199-7, 2002.
Thornton, B. F., Geibel, M. C., Crill, P. M., Humborg, C., and Mörth, C. M.: Methane fluxes from the sea to the atmosphere across the Siberian shelf seas, Geophys. Res. Lett., 43, 5869–5877, https://doi.org/10.1002/2016GL068977, 2016.
Tuorto, S. J., Darias, P., Mcguinness, L. R., Panikov, N., Zhang, T., Häggblom, M. M., and Kerhof, L. J.: Bacterial genome replication at subzero temperatures in permafrost, ISME J., 8, 139–149, https://doi.org/10.1038/ismej.2013.140, 2014.
Vasil'chuk, Y. K.: Reconstruction of the paleoclimate of the Late Pleistocene and Holocene of the basis of isotope studies of subsurface ice and waters of the permafrost zone, Water Resour., 17, 640–647, 1991.
Vetter, A., Vieth, A., Mangelsdorf, K., Lerm, S., Alawi, M., Wolfgramm, M., Seibt, A., and Wurdemann, H.: Biogeochemical Characterisation of Geothermally Used Groundwater in Germany, in: Proceedings World Geothermal Congress, Bali, 1–6, 2010.
Vuillemin, A., Ariztegui, D., Leavitt, P. R., Bunting, L., and the PASADO Science Team: Recording of climate and diagenesis through sedimentary DNA and fossil pigments at Laguna Potrok Aike, Argentina, Biogeosciences, 13, 2475–2492, https://doi.org/10.5194/bg-13-2475-2016, 2016.
Vuillemin, A., Ariztegui, D., Horn, F., Kallmeyer, J., Orsi, W. D., Anselmetti, F., Corbella, H., Francus, P., Lücke, A., Maidana, N. I., Ohlendorf, C., Zolitschka, B., Schabitz, F., and Wastegård, S.: Microbial community composition along a 50 000-year lacustrine sediment sequence, FEMS Microbiol. Ecol., 94, 1–14, https://doi.org/10.1093/femsec/fiy029, 2018.
Wagner, D., Gattinger, A., Embacher, A., Pfeiffer, E.-M., Schloter, M., and Lipski, A.: Methanogenic activity and biomass in Holocene permafrost deposits of the Lena Delta, Siberian Arctic and its implication for the global methane budget, Glob. Change Biol., 13, 1089–1099, https://doi.org/10.1111/j.1365-2486.2007.01331.x, 2007.
Waldrop, M. P., Wickland, K. P., White, R., Berhe, A. A., Harden, J. W., and Romanovsky, V. E.: Molecular investigations into a globally important carbon pool: Permafrost-protected carbon in Alaskan soils, Glob. Change Biol., 16, 2543–2554, https://doi.org/10.1111/j.1365-2486.2009.02141.x, 2010.
Walker, T. W. N., Kaiser, C., Strasser, F., Herbold, C. W., Leblans, N. I. W., Woebken, D., Janssens, I. A., Sigurdsson, B. D., and Richter, A.: Microbial temperature sensitivity and biomass change explain soil carbon loss with warming, Nat. Clim. Chang., 8, 885–889, https://doi.org/10.1038/s41558-018-0259-x, 2018.
Ward, C. P. and Cory, R. M.: Chemical composition of dissolved organic matter draining permafrost soils, Geochim. Cosmochim. Ac., 167, 63–79, https://doi.org/10.1016/j.gca.2015.07.001, 2015.
Watanabe, K. and Mizoguchi, M.: Amount of unfrozen water in frozen porous media saturated with solution, Cold Reg. Sci. Technol., 34, 103–110, https://doi.org/10.1016/S0165-232X(01)00063-5, 2002.
Weedon, J. T., Kowalchuk, G. A., Aerts, R., van Hal, J., van Logtestijn, R., Taş, N., Röling, W. F. M., and van Bodegom, P. M.: Summer warming accelerates sub-arctic peatland nitrogen cycling without changing enzyme pools or microbial community structure, Glob. Change Biol., 18, 138–150, https://doi.org/10.1111/j.1365-2486.2011.02548.x, 2012.
Weedon, J. T., Kowalchuk, G. A., Aerts, R., Freriks, S., Röling, W. F. M., and van Bodegom, P. M.: Compositional stability of the bacterial community in a climate-sensitive Sub-Arctic Peatland, Front. Microbiol., 8, 1–11, https://doi.org/10.3389/fmicb.2017.00317, 2017.
Wegner, C., Hölemann, J. A., Dmitrenko, I., Kirillov, S., and Kassens, H.: Seasonal variations in Arctic sediment dynamics – Evidence from 1-year records in the Laptev Sea (Siberian Arctic), Global Planet. Change, 48, 126–140, https://doi.org/10.1016/j.gloplacha.2004.12.009, 2005.
Weiss, J.: Ionenchromatographie, 3rd ed., Wiley-VHC, Weinheim, 2001.
Wen, X., Yang, S., Horn, F., Winkel, M., and Wagner, D.: Global Biogeographic Analysis of Methanogenic Archaea Identifies Community-Shaping Environmental Factors of Natural Environments, Front. Microbiol., 8, 1339, https://doi.org/10.3389/fmicb.2017.01339, 2017.
Wen, X., Unger, V., Jurasinski, G., Koebsch, F., Horn, F., Rehder, G., Sachs, T., Zak, D., Lischeid, G., Knorr, K.-H., Böttcher, M. E., Winkel, M., Bodelier, P. L. E., and Liebner, S.: Predominance of methanogens over methanotrophs in rewetted fens characterized by high methane emissions, Biogeosciences, 15, 6519–6536, https://doi.org/10.5194/bg-15-6519-2018, 2018.
Willerslev, E., Hansen, A. J., Rønn, R., Brand, T. B., Barnes, I., Wiuf, C., Gilichinsky, D., Mitchell, D., and Cooper, A.: Long-term persistence of bacterial DNA, Curr. Biol., 14, 13–14, https://doi.org/10.1016/j.cub.2003.12.012, 2004.
Winkel, M., Mitzscherling, J., Overduin, P. P., Horn, F., Winterfeld, M., Rijkers, R., Grigoriev, M. N., Knoblauch, C., Mangelsdorf, K., Wagner, D., and Liebner, S.: Anaerobic methanotrophic communities thrive in deep submarine permafrost, Sci. Rep., 8, 1–13, https://doi.org/10.1038/s41598-018-19505-9, 2018.
Winterfeld, M., Schirrmeister, L., Grigoriev, M. N., Kunitsky, V. V., Andreev, A., Murray, A., and Overduin, P. P.: Coastal permafrost landscape development since the Late Pleistocene in the western Laptev Sea, Siberia, Boreas, 40, 697–713, https://doi.org/10.1111/j.1502-3885.2011.00203.x, 2011.
Xiong, J., Sun, H., Peng, F., Zhang, H., Xue, X., Gibbons, S. M., Gilbert, J. A., and Chu, H.: Characterizing changes in soil bacterial community structure in response to short-term warming, FEMS Microbiol. Ecol., 89, 281–292, https://doi.org/10.1111/1574-6941.12289, 2014.
Xu, G., Chen, J., Berninger, F., Pumpanen, J., Bai, J., Yu, L., and Duan, B.: Labile, recalcitrant, microbial carbon and nitrogen and the microbial community composition at two Abies faxoniana forest elevations under elevated temperatures, Soil Biol. Biochem., 91, 1–13, https://doi.org/10.1016/J.SOILBIO.2015.08.016, 2015.
Yergeau, E., Hogues, H., Whyte, L. G., and Greer, C. W.: The functional potential of high Arctic permafrost revealed by metagenomic sequencing, qPCR and microarray analyses, ISME J., 4, 1206–1214, https://doi.org/10.1038/ismej.2010.41, 2010.
Zhang, J., Kobert, K., Flouri, T., and Stamatakis, A.: PEAR: A fast and accurate Illumina Paired-End reAd mergeR, Bioinformatics, 30, 614–620, https://doi.org/10.1093/bioinformatics/btt593, 2014.
Zhang, K., Shi, Y., Jing, X., He, J. S., Sun, R., Yang, Y., Shade, A., and Chu, H.: Effects of short-term warming and altered precipitation on soil microbial communities in alpine grassland of the tibetan plateau, Front. Microbiol., 7, 1–11, https://doi.org/10.3389/fmicb.2016.01032, 2016.
Zhang, T., Barry, R. G., Knowles, K., Ling, F., and Armstrong, R. L.: Distribution of seasonally and perennially frozen ground in the Northern Hemisphere, in Proceedings of the 8th International Conference on Permafrost, edited by A. Phillips, Springman, Permafrost, Zürich, 1289–1294, 2003.
Zhang, W., Parker, K. M., Luo, Y., Wan, S., Wallace, L. L., and Hu, S.: Soil microbial responses to experimental warming and clipping in a tallgrass prairie, Glob. Change Biol., 11, 266–277, https://doi.org/10.1111/j.1365-2486.2005.00902.x, 2005.
Zhou, J., Bruns, M. A., and Tiedje, J. M.: DNA recovery from soils of diverse composition, Appl. Environ. Microbiol., 62, 316–322, 1996.
Zimov, S. A., Schuur, E. A., and Chapin 3rd, F. S.: Permafrost and the global carbon budget, Science, 312, 1612–1613, https://doi.org/10.1126/science.1128908, 2006.
Zogg, G. P., Zak, D. R., Ringelberg, D. B., White, D. C., MacDonald, N. W., and Pregitzer, K. S.: Compositional and Functional Shifts in Microbial Communities Due to Soil Warming, Soil Sci. Soc. Am. J., 61, 475–481, https://doi.org/10.2136/sssaj1997.03615995006100020015x, 1997.