the Creative Commons Attribution 4.0 License.
the Creative Commons Attribution 4.0 License.
 | 11 Apr 2019
Atmospheric deposition fluxes over the Atlantic Ocean: a GEOTRACES case study
Jan-Lukas Menzel Barraqueta
Jessica K. Klar
Martha Gledhill
Christian Schlosser
Rachel Shelley
Hélène F. Planquette
Bernhard Wenzel
Geraldine Sarthou
Eric P. Achterberg
Atmospheric deposition is an important source of micronutrients to the ocean, but atmospheric deposition fluxes remain poorly constrained in most ocean regions due to the limited number of field observations of wet and dry atmospheric inputs. Here we present the distribution of dissolved aluminium (dAl), as a tracer of atmospheric inputs, in surface waters of the Atlantic Ocean along GEOTRACES sections GA01, GA06, GA08, and GA10. We used the surface mixed-layer concentrations of dAl to calculate atmospheric deposition fluxes using a simple steady state model. We have optimized the Al fractional aerosol solubility, the dAl residence time within the surface mixed layer and the depth of the surface mixed layer for each separate cruise to calculate the atmospheric deposition fluxes. We calculated the lowest deposition fluxes of 0.15±0.1 and 0.27±0.13 g m−2 yr−1 for the South and North Atlantic Ocean (>40∘ S and >40∘ N) respectively, and the highest fluxes of 1.8 and 3.09 g m−2 yr−1 for the south-east Atlantic and tropical Atlantic Ocean, respectively. Overall, our estimations are comparable to atmospheric dust deposition model estimates and reported field-based atmospheric deposition estimates. We note that our estimates diverge from atmospheric dust deposition model flux estimates in regions influenced by riverine Al inputs and in upwelling regions. As dAl is a key trace element in the GEOTRACES programme, the approach presented in this study allows calculations of atmospheric deposition fluxes at high spatial resolution for remote ocean regions.
- Article
(8053 KB) -
Supplement
(729 KB) - BibTeX
- EndNote


Atmospheric deposition is a major source of micronutrients, especially iron, for the surface ocean (Martin et al., 1991; Moore et al., 2004). Aerosol deposition of iron in the tropical and subtropical North Atlantic stimulates N2 fixation (Moore et al., 2009), and in high-latitude waters with high-nitrate–low-chlorophyll conditions it can enhance primary productivity (Baker et al., 2013). Consequently, atmospheric deposition is considered to support up to 50 % of global export production (Jickells et al., 2014). Therefore, by supplying growth-limiting elements to marine microorganisms, atmospheric deposition can have important direct impacts on the marine carbon cycle and indirectly influence global climate (Mahowald et al., 2014).
The size distribution of mineral dust is considered a continuum. However, mineral dust is often described to have a bimodal size distribution and thus aerosols are classified into a fine (radius 0.1–0.25 µm) or coarse mode (radius 1–2.5 µm) (Maring et al., 2003). The classification facilitates us to assign aerosol deposition velocities for the aerosol size classes for the quantification of dry deposition fluxes (Slinn and Slinn, 1980). Mineral dust mobilization mainly depends on vegetation cover, surface soil moisture content, and wind friction speed (Mahowald et al., 2014; Zender et al., 2003). Once mobilized by wind and lofted into the troposphere, mineral dust can be transported thousands of kilometres from source regions following major air mass movements. In the North Atlantic the trade winds transport dust from North Africa to the Caribbean and the Americas (Prospero et al., 2010) in about 1 week (Ott et al., 1991). Along the transport path of atmospheric aerosols, the size distribution of aerosol tends to decrease with increasing distance from the source regions. Chemical and physical transformation processing of aerosol in clouds, such as photoreduction and dissolution, can enhance the fraction of trace metals that are released upon deposition into the surface ocean (Duce and Tindale, 1991). Thus, the degree of atmospheric processing can be a critical factor in determining the impact of atmospheric deposition on marine ecosystems (Baker and Croot, 2010; Mahowald et al., 2011).
In the Atlantic Ocean, mineral dust deposition is highest in tropical regions located downwind of the major aerosol source regions of the Sahara Desert and Sahel (Jickells et al., 2005; Prospero and Carlson, 1972). Moreover, the Intertropical Convergence Zone (ITCZ) in the Atlantic Ocean (located at ∼5–10∘ N in winter and in summer) features intense wet deposition which effectively strips the aerosols from the atmosphere, thereby depositing trace elements to the surface ocean in solution (Kim and Church, 2002; Schlosser et al., 2014). Other important mineral dust source regions include the Namib Desert and Patagonia for the South Atlantic Ocean (Chance et al., 2015; Mahowald et al., 2005; Wagener et al., 2008). In remote marine areas such as the far North and South Atlantic, removed from major desert dust sources, aerosols are of a mixture of marine origin, shipping emissions, industrial and agricultural emissions from the continents (Baker et al., 2013; Chance et al., 2015; Shelley et al., 2017), seasonal emissions of proglacial till (Bullard et al., 2016) and occasional volcanic ash emissions (Achterberg et al., 2013). In addition, aerosols in these remote regions may also have a mineral dust component, depending on the meteorological conditions (Prospero, 1996a).
Atmospheric deposition flux determinations have a relatively high uncertainty (Zender et al., 2003) due to large inter-annual and inter-seasonal variabilities. Several approaches are used to calculate atmospheric deposition fluxes from geochemical tracers or proxies (Anderson et al., 2016). Geochemical methods determine atmospheric deposition fluxes from elemental concentrations in aerosols and/or rain, or chemical concentrations, or signatures of tracers of atmospheric deposition in seawater (Anderson et al., 2016). A commonly used geochemical method to determine total (wet + dry) deposition fluxes is to measure elemental concentrations in aerosols collected on filters and in rain water, multiplying the aerosol concentration data with deposition velocities (dry deposition flux) and multiplying the rainwater concentration data by a precipitation rate (wet deposition flux) (Baker et al., 2003; Prospero, 1996a; Shelley et al., 2018). Atmospheric dry deposition fluxes are subject to a 2–3-fold uncertainty due to the use of a single deposition velocity in the flux calculation (Duce and Tindale, 1991); thus the varying deposition velocities of different mineral dust sizes are not considered. However, when size segregated sampling approaches are used more than one deposition velocity is applied, thereby decreasing the uncertainty in the calculated deposition flux. The uncertainty may be even larger for wet deposition fluxes because of the uncertainties associated with precipitation rates and scavenging ratios (Shelley et al., 2018). A different approach that tries to reduce the uncertainties associated with the deposition velocity and precipitation rates uses the inventory of 7Be in the surface mixed layer and the ratio of trace elements to 7Be in aerosols to calculate atmospheric deposition fluxes on seasonal timescales (Kadko et al., 2015; Kadko and Prospero, 2011). Other approaches used to determine atmospheric fluxes of trace elements use particle collection by sediment traps (Jickells et al., 1998; Kohfeld and Harrison, 2001) or analyse mineral dust tracers in surface ocean waters (Dammshäuser et al., 2011). Modern atmospheric models consider aerosol characteristics (e.g. size distribution, particle type) and field observations to estimate atmospheric deposition fluxes (Mahowald et al., 2005; Zender et al., 2003; Zhang et al., 2015). Often, modelling approaches simulate atmospheric deposition fluxes more accurately in regions downwind from the main aerosol sources (Huneeus et al., 2011; Wagener et al., 2008) because the aerosol characteristics, due to extensive datasets in these regions, are better constrained in proximity to their source. Modelled atmospheric deposition fluxes often rely on satellite-derived climatologies. The satellite-derived climatologies use properties (i.e aerosol optical depth) which suffer from cloud coverage and are biased towards clear-sky conditions (Huneeus et al., 2011).
In this paper we present surface ocean dissolved aluminium (dAl) concentration data for the Atlantic Ocean and use these to calculate atmospheric deposition fluxes using the MADCOW model (Measures and Brown, 1996). The strength of this approach is that it can be used to fill gaps where there are relatively few direct aerosol observations. This study compares the MADCOW model outputs with field and model-derived atmospheric deposition flux estimates from the North to the South Atlantic Ocean. We provide some of the first atmospheric deposition fluxes based on high-resolution surface mixed-layer concentrations of dAl for remote regions including the Labrador Sea, south-east Atlantic and South Atlantic Ocean (ca. 40∘ S). Our results are discussed in light of the assumptions and limitations of the MADCOW model, and are compared to available atmospheric deposition flux estimates from modelling and geochemical approaches.
2.1 Regional, sampling, and processing settings
Seawater samples for dAl were collected during the GEOTRACES section cruises GA01, GA06, GA08, and GA10 (Fig. 1). GEOTRACES section GA01 (Sarthou et al. 2018) sailed aboard the research vessel Pourquoi Pas? on 15 May (2014) from Lisbon (Portugal) and arrived on 30 June (2014) in St. John's (Canada). GEOTRACES section GA06 sailed aboard RRS Discovery on 7 February (2011) from Tenerife (Canary Islands, Spain) and returned on 19 March (2011) to Tenerife. GEOTRACES section GA08, on board FS Meteor, sailed from Walvis Bay (Namibia) on 14 November (2015) and returned there on 27 December (2015). GEOTRACES section GA10, on board RRS James Cook, sailed on 24 December (2011) from Port Elizabeth (South Africa) and arrived on 27 January (2012) in Montevideo (Uruguay). The four expeditions crossed several biogeochemical provinces (Longhurst, 2010) which are shown in Fig. 1 and listed in Table S1 in the Supplement along with their geographical boundaries, ecological and physical properties. Figure S1 in the Supplement shows the station numbers associated with each cruise.
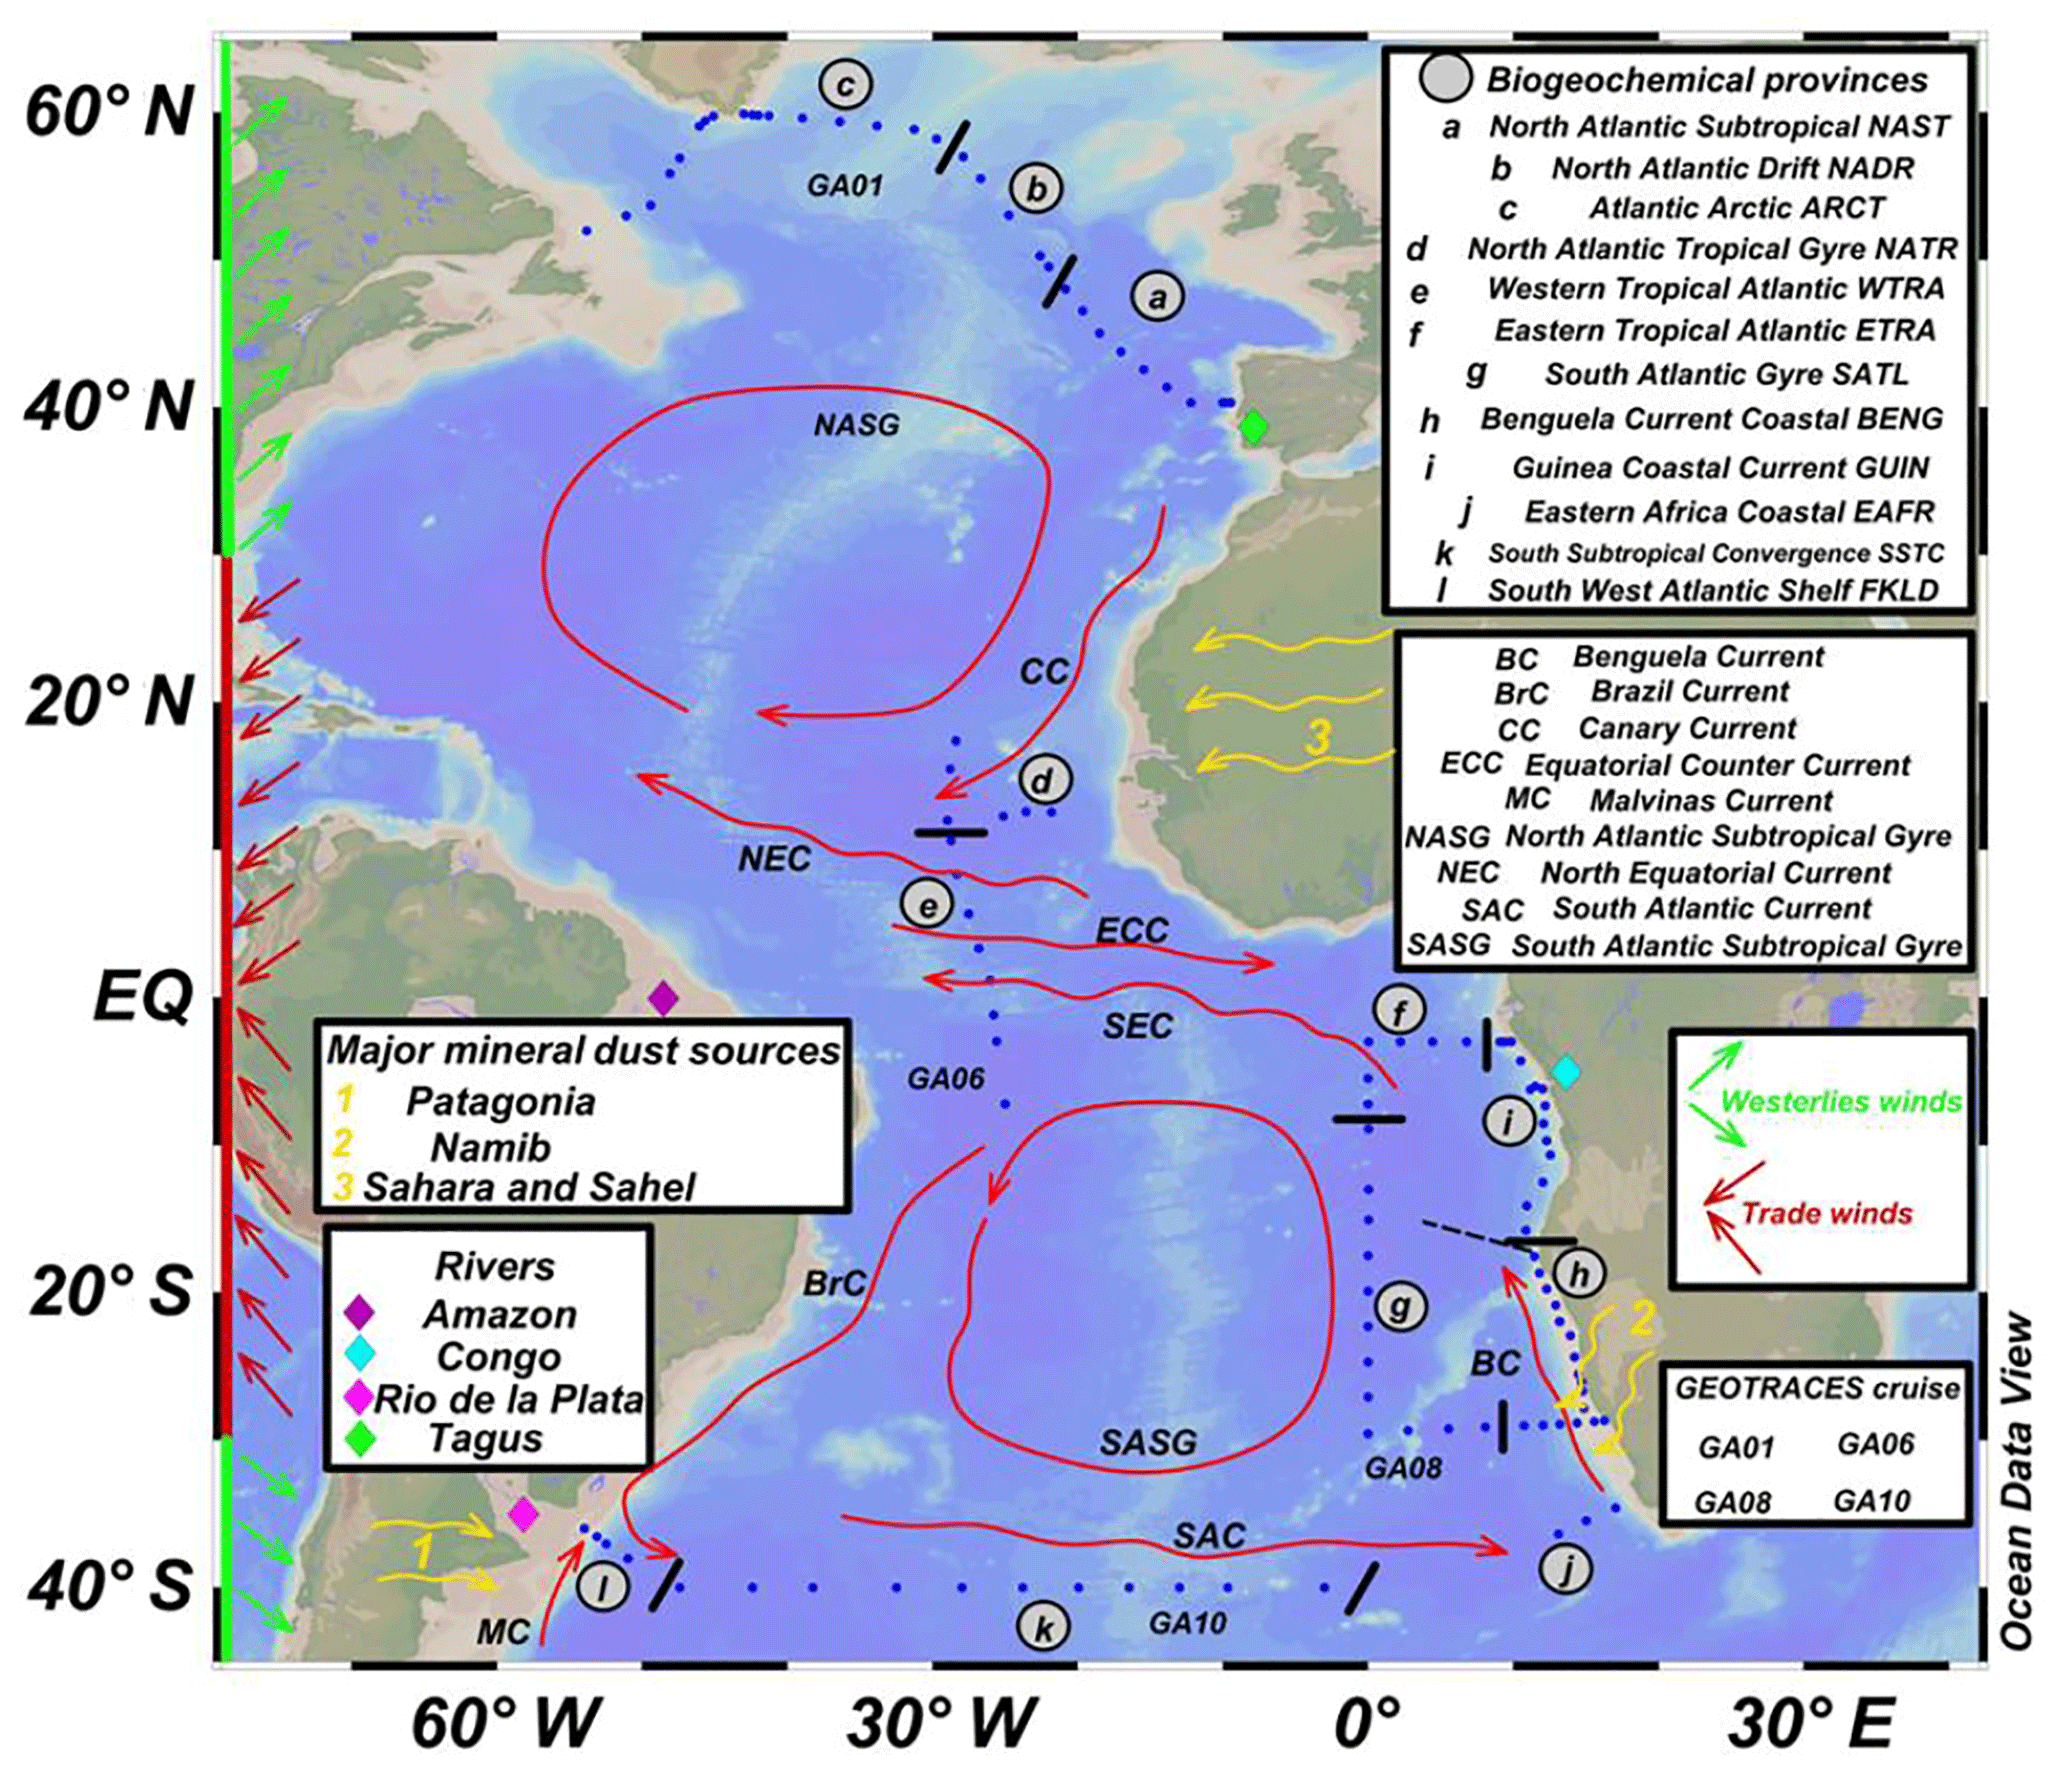
Figure 1 Map showing the location of the four GEOTRACES cruises. Red lines represent the main surface ocean currents. The diamonds represent rivers. Yellow arrows represent approximate areas which act as the main mineral dust sources to the Atlantic Ocean (Prospero et al., 2002). Black lines divide different biogeochemical provinces used in this study which are labelled with letters. Blue dots represent stations. For station numbers for each cruise please refer to Fig. S1.
In total, seawater samples were collected at 108 stations, with 32 stations sampled during GA01, 14 stations during GA06, 52 stations during GA08 and 18 stations during GA10. Although the different teams used slightly different conductivity–temperature–depth (CTD) set-ups for sampling the seawater (Table S2), all samples were collected using trace metal clean CTD rosettes and followed the GEOTRACES sampling protocols (http://geotraces.org, last access: 1 January 2018). All seawater samples for the determination of dAl were filtered (Table S2 for filter type and pore size) and collected in 125 mL low-density polyethylene bottles (LDPE; Nalgene) cleaned using a three-step wash protocol (as per GEOTRACES cookbook; http://www.geotraces.org, last access: 1 January 2018). After collection, the samples were acidified to pH ≈ 1.8 with ultra-clean hydrochloric acid (UpA, Romil, 0.024 M) and double bagged until analysis. Analysis of dAl during GA01, GA06, and GA10 used the flow injection analysis (FIA) method developed by Resing and Measures (1994) and further modified by Brown and Bruland (2008). Dissolved Al during GA08 cruise was analysed using the batch lumogallion method (Hydes and Liss, 1976). The analytical figures of merit for the dAl datasets can be found in Table S2.
2.2 Atmospheric deposition flux determinations: the MADCOW model
The MADCOW (Measurement of Aluminium for Dust Calculation in Ocean Waters) model (Measures and Vink, 2000; Measures and Brown, 1996) determines total (dry + wet) atmospheric deposition fluxes to the surface ocean from the concentration of dAl in the surface mixed layer. The primary model assumption is that dAl in the surface waters is in steady state with respect to inputs from soluble Al provided by the dissolution of mineral dust on contact with seawater and rain deposition, removal via scavenging of Al onto particle surfaces, and subsequent transfer to depth by sinking. The model itself is provided by the following equation:
where G is the total dust flux in g m−2 yr−1, [Al] is the concentration of dAl (mol m−3) in the surface mixed layer, MLD is the depth of the mixed layer in metres (m), τ is the residence time in years (yr), S is the fractional solubility of Al in dust (%), and D is the concentration of Al in dust (8.1 %, mol g−1). The limitations of the MADCOW model and extended discussions on the inherent assumptions of the MADCOW model have been acknowledged in previous investigations (e.g. Measures and Vink, 2000; Measures and Brown, 1996). We describe how each parameter is derived for each of the cruises in the following sections and describe the assumptions used by the MADCOW model for the determination of the atmospheric deposition fluxes.
2.2.1 Quantification of surface mixed-layer depths
We used two different MLDs. First, a measured mixed-layer depth (MLDms) was obtained for each station using a potential density difference criterion Δσθ=0.125 kg m−3 (Monterey and Levitus, 1997) calculated from the salinity and temperature retrieved from the sensors mounted in the CTDs. Second, annual (MLDar) and seasonal (MLDwi, MLDsp, MLDsu and MLDau, for winter, spring, summer, and autumn, respectively) MLDs were extracted for each station of the four cruises in a 1×1∘ bin in latitude and longitude from the Argo mixed-layer climatology (http://mixedlayer.ucsd.edu/, last access: September 2017) (Holte et al., 2017).
2.2.2 Fractional solubility of Al
Seasonal (April to June and September to November) Al fractional solubilities were obtained from the compilation of Baker et al. (2013), based on aerosol samples collected at high spatial resolution over several years in the Atlantic Ocean. The soluble fraction was based on the results of an ammonium acetate leach at pH 4.7 for 1–2 h, following Sarthou et al. (2003). Baker et al. (2013) divided the Atlantic Ocean into various regions and subregions (Fig. S2) based on air mass back trajectories and the relative contribution of the air masses over the two seasons in each region. Along with Fig. S2 we provide an explanatory note on the relative contribution of each air mass for each region which we then compiled in Table S3. They calculated the fractional Al solubility for each subregion. Baker et al. (2013) provide a good spatial coverage of the Atlantic Ocean, thus allowing us to assign values of Al fractional solubility for different biogeochemical regions (Fig. 1) based on field observations. However, the aerosols Al fractional solubility might not be representative over an annual timescale due to, for example, the pulses of Saharan dust and where the mineral dust falls which is related to the position of the ITCZ. Yet, it is still the largest dataset on aerosol Al fractional solubility over the Atlantic Ocean. We produced a single weighted averaged aerosol Al fractional-solubility percentage value for each area of interest based on the Al fractional solubility for each air mass to the relative contribution of that air mass to a certain area (Table S3). Furthermore, we assumed that the chosen Al solubility was representative for the whole annual cycle as our atmospheric aerosol deposition flux estimates are given in g m−2 yr−1. As the compilation of Baker et al. (2013) does not cover regions north of 50∘ N in the North Atlantic, we used Al fractional solubilities from Shelley et al. (2018) derived from aerosol samples collected during the GA01 cruise.
2.2.3 Al residence time in the surface mixed layer
The residence time is defined as the ratio of the dAl inventory in the surface mixed layer to the rate of input or removal. Residence times of dAl in the surface mixed layer were obtained from Han et al. (2008) and are based on an extensive surface water dAl observational database (including 22 cruises in the Atlantic Ocean). The latter residence times were derived using a fixed mixed-layer depth (50 m) and a constant Al fractional solubility (5 %) and take into account Al sources to the surface mixed layer from atmospheric deposition, advection, and mixing. The MADCOW model does not account for advection and mixing processes which, for example, occur in equatorial regions (van Hulten et al., 2013). Thus, the use of modelled residence times which account for advection and mixing sources could partially counterbalance the error associated with our modelled atmospheric deposition fluxes. We acknowledge that the use of residence times derived from using a fixed mixed-layer depth and constant Al solubility may underestimate or overestimate the real residence time. The latter affects regions of large seasonal variability such as the tropical Atlantic (see Sect. 3.2.2 and 3.6.2).
3.1 Mixed-layer depth (MLD)
The surface mixed layer is considered a quasi-homogenous layer based on physical properties (salinity and temperature). The properties display gradients at the bottom of the layer. The bottom depth of the surface mixed layer varies due to atmospheric forcing, with turbulent mixing caused by wind stress (Risien and Chelton, 2008), convection caused by heat exchange (Yu and Weller, 2007), in addition to salinity changes due to evaporation and precipitation at the surface (Schanze et al., 2010). Thus, the thickness of the MLD is an indication of the amount of water that directly interacts with the atmosphere.
Figure 2 shows a box and whisker plot with the quantified MLDs (MLDms and MLDar) for each of the four study regions. Table S4 shows the calculated MLDs for each station and Fig. S3a, b, c and d show a comparison plot for each cruise between the MLDms, MLDar, MLDmw (mixed-layer depth original MADCOW model) and the Argo average MLD during the season when each cruise took place.
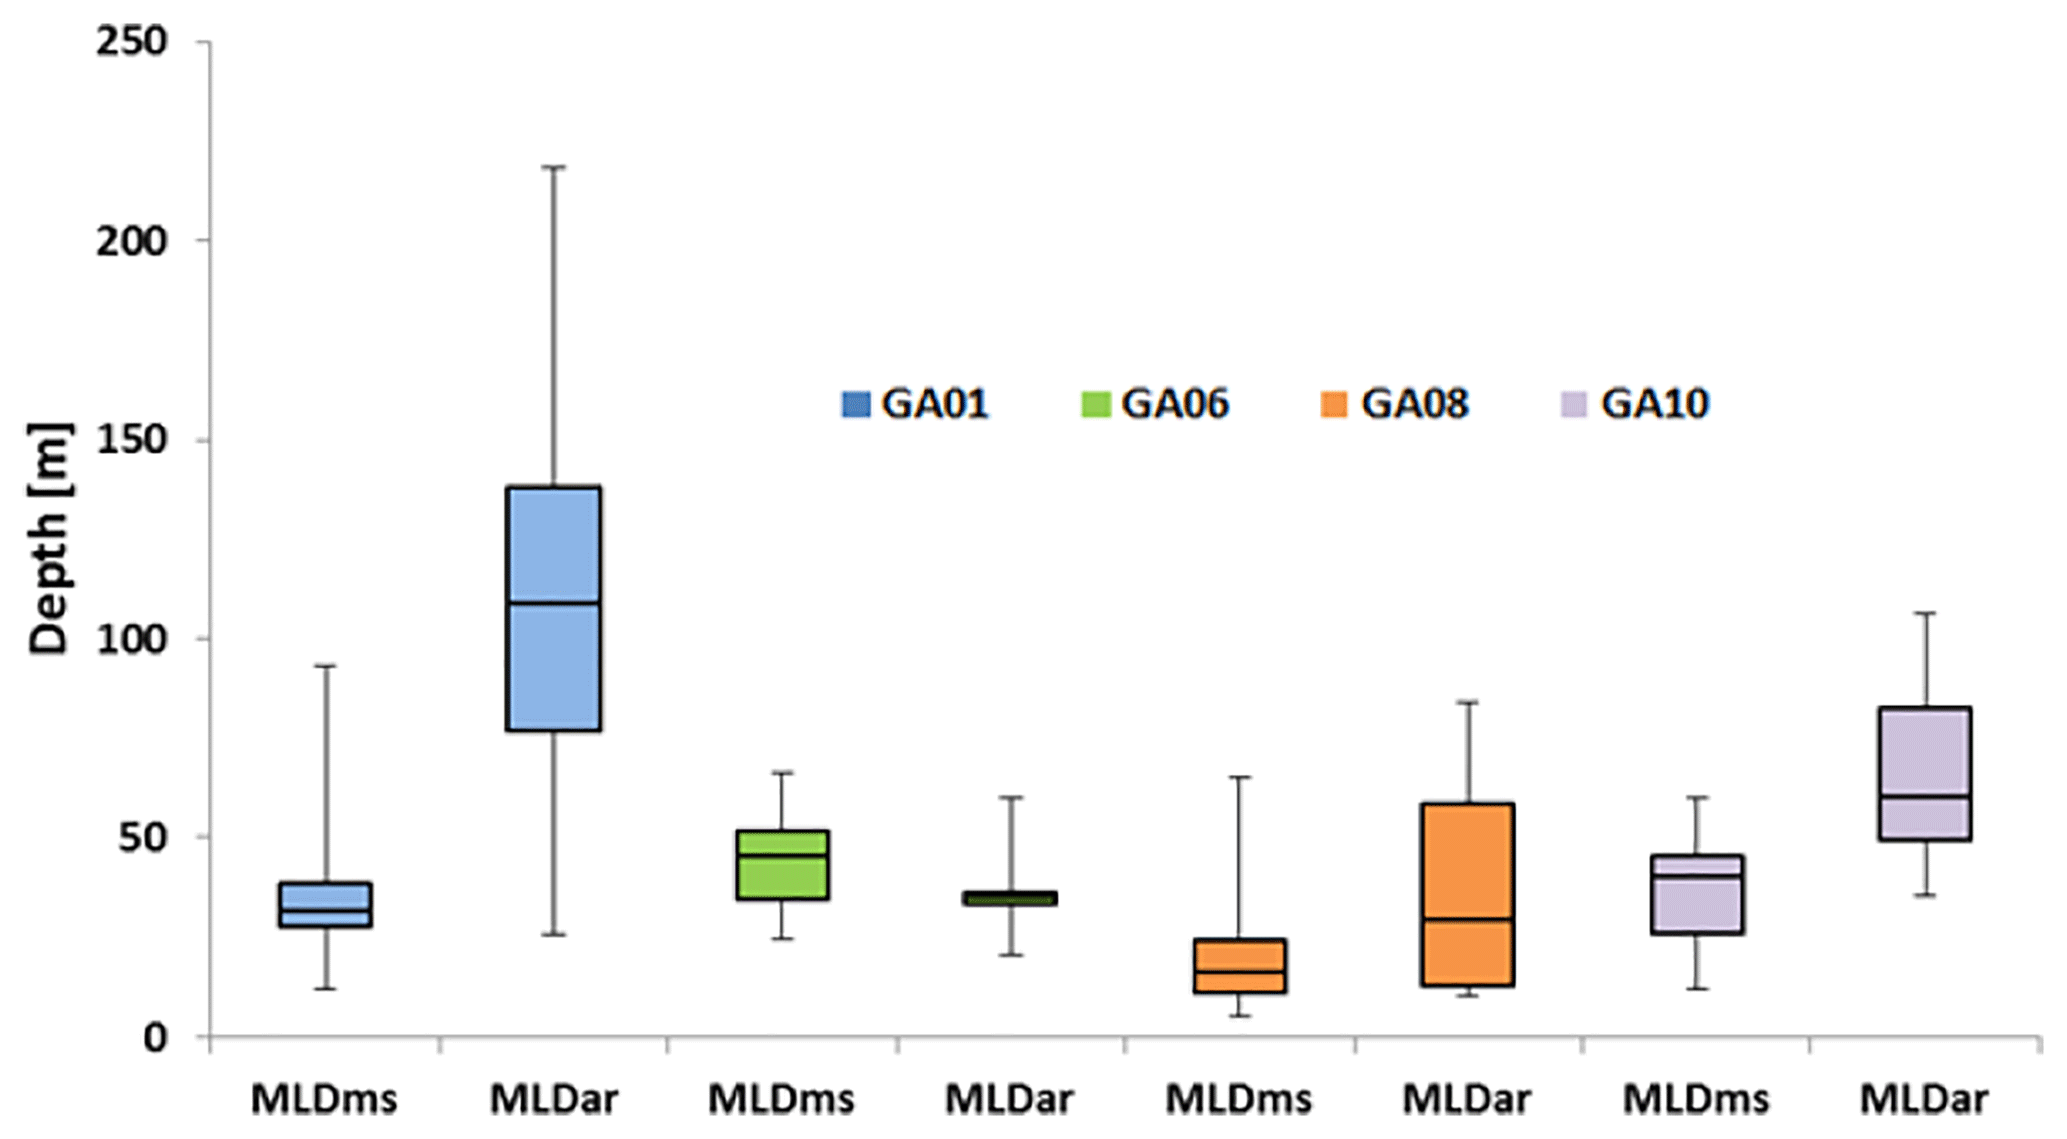
Figure 2Box whisker plot for the MLD determined using in situ measurements (MLDms) and annual mixed-layer climatology (MLDar) (http://mixedlayer.ucsd.edu/, last access: September 2017) (Holte et al., 2017).
In the North Atlantic (GA01) and South Atlantic (GA10) Ocean, large differences were observed between median MLDms and MLDar (differences of 77 and 20 m, respectively). Smaller differences were detected between median MLDms and MLDar in the tropical (GA06) and south-east Atlantic (GA08) Ocean (differences of 7 and 10 m, respectively). Maximum MLDar and MLDms were greatest in the North Atlantic (up to 218 m), followed by the South Atlantic (106 m), the south-east Atlantic (83 m), and tropical Atlantic (66 m). The large differences in maximum MLDar and between the MLDms and MLDar medians, between the North Atlantic Ocean and the other three study areas, were due to strong deep mixing taking place in the North Atlantic Ocean during winter (Kara et al., 2003). In the tropical Atlantic Ocean, the MLD is largely controlled by changes in temperature (net heat flux) and salinity (evaporation to precipitation ratios) (Chahine, 1992; Webster, 1994). In our study, deeper MLDs relative to shallower MLDs imply that higher quantities of aerosols need to be supplied to a specific region in order to maintain the observed dAl concentrations in the MLD. As an input parameter for the MADCOW model we have chosen a single MLD value for each cruise. This is the median value between the MLDms and MLDar. We acknowledge that choosing a single MLD value may not be the best approach but it gives us the opportunity for an intra-comparison of atmospheric fluxes within the same cruise.
3.2 Distributions of dAl in the surface mixed layer
Figure 3 shows the average dAl concentration in the surface mixed layer along the four sections. Occasionally, when no sample was collected, the closest underway surface water sample collected with a tow fish was used. A detailed description for the surface mixed-layer dAl concentrations of the four cruises relative to physical and biological parameters is given in the following sections. Overall, a large range in surface dAl concentrations was observed, ranging between <0.5 and 784 nM (median 5.1 nM; n=108 stations). The highest dAl concentrations were observed in the tropical Atlantic Ocean between 1–15∘ N and ca. 26∘ W, and in coastal waters off Portugal, Greenland, Argentina, Angola, Democratic Republic of the Congo, and Gabon in association with the highest atmospheric inputs and continental inputs (rivers, glacial flour, and ice melt). In contrast, low dAl concentrations (<5 nM) due to low atmospheric deposition and/or scavenging of dAl by particles were found in the North Atlantic (GA01), in the south-east Atlantic (GA08), and in the South Atlantic Ocean (GA10).
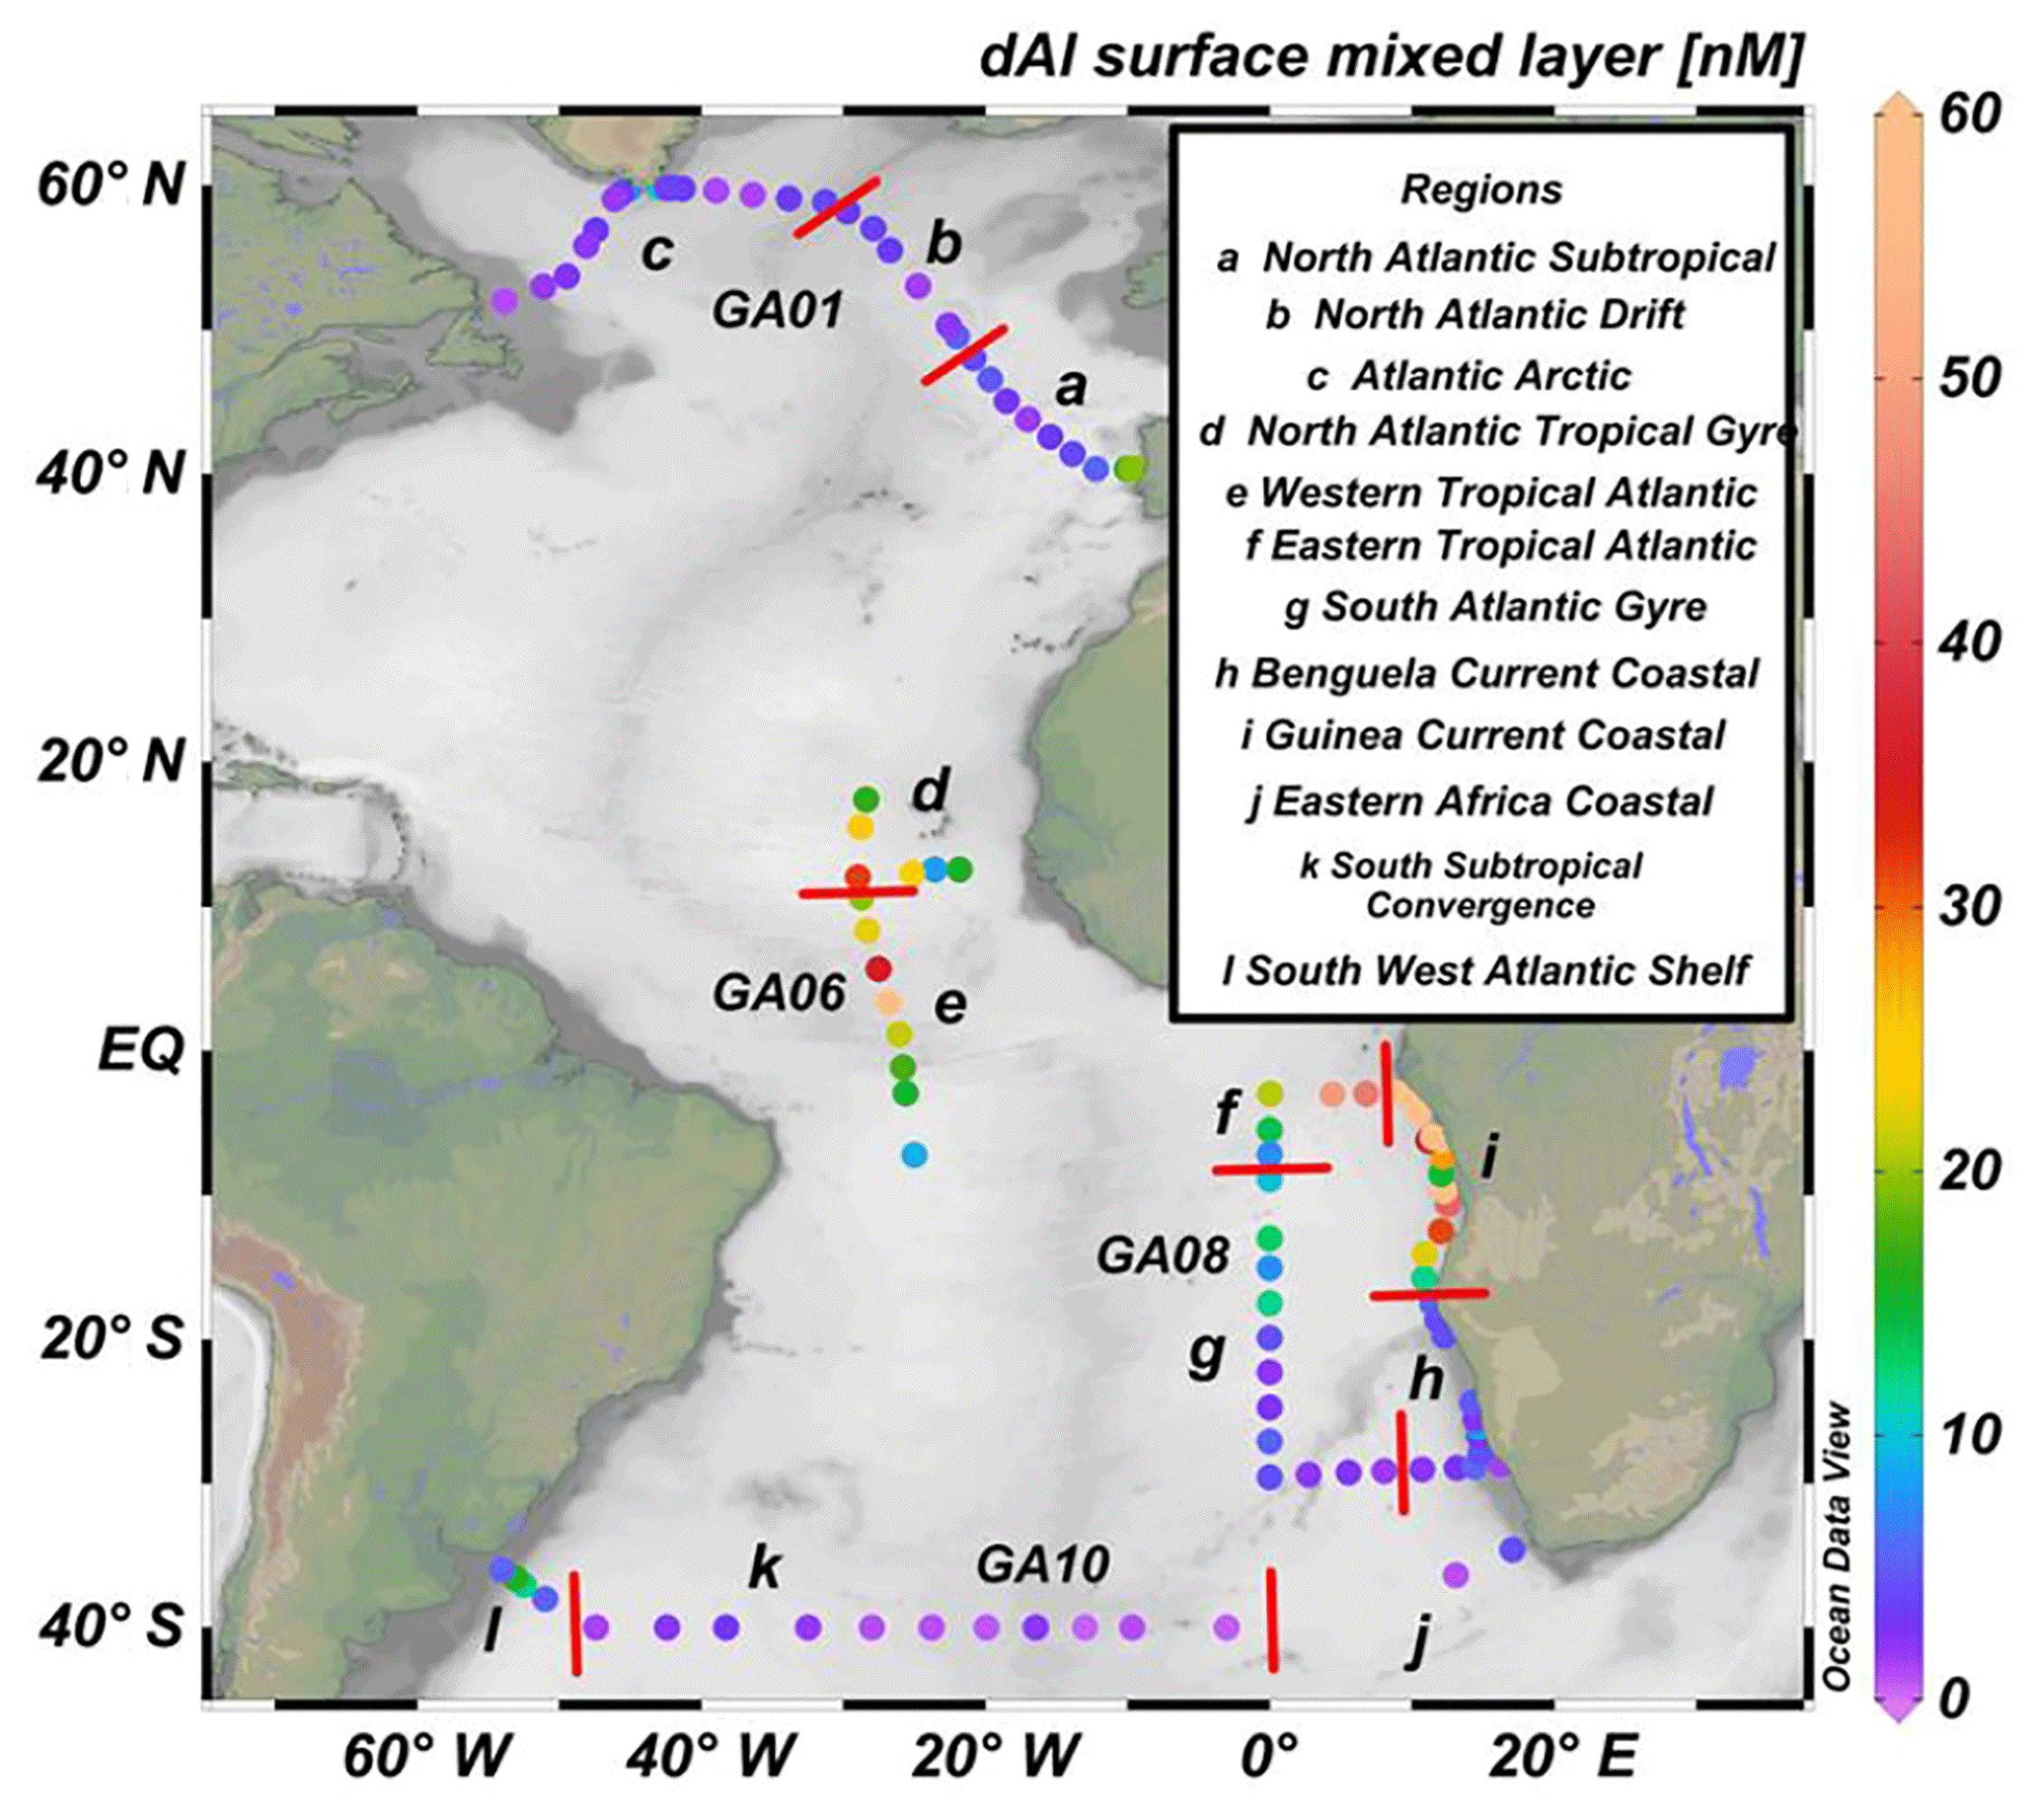
Figure 3Surface mixed-layer dAl concentrations (nM) for the cruises used in this study (GA01, GA06, GA08, and GA10). Red lines divide the different biogeochemical provinces used in this study.
3.2.1 Dissolved Al in the surface mixed layer of the North Atlantic Ocean (GA01)
Along GEOTRACES GA01 section in the North Atlantic (Fig. 1), the highest (>15 nM) dAl surface mixed-layer concentrations were found in the North Atlantic Subtropical Gyre region (NAST) off Portugal (stations 1, 2 and 4) and are attributed to riverine inputs from the Tagus Estuary (Menzel Barraqueta et al., 2018). An additional source of dAl off Portugal involves episodic deposition of mineral dust originating from the Sahara and Sahel regions (Prospero, 1996a), and wet deposition events as observed during the GA01 cruise (Shelley et al., 2017). Enhanced dAl surface mixed-layer concentrations (>5 nM) were also observed in the Atlantic Arctic region (ARCT) off south-east and south-west Greenland (stations 53 and 61) as a consequence of runoff and ice melt, respectively (Menzel Barraqueta et al., 2018). In addition, enhanced dust inputs delivered from proglacial tills in Greenland occur from June to September (Bullard et al., 2016), coinciding with the time of sample collection off Greenland. Excluding the stations with continental Al inputs, mixed-layer dAl concentrations were low, reflecting low contributions of atmospheric deposition (median dAl = 2.9 nM), and were not significantly different from east to west due to differences in the intensity of biological removal processes as described by Menzel Barraqueta et al. (2018). A more detailed explanation on the surface distribution for dAl along the GA01 cruise and comparison to previous studies is given in Menzel Barraqueta et al. (2018).
3.2.2 Dissolved Al in the surface mixed-layer of the tropical Atlantic Ocean (GA06)
The tropical Atlantic has a large coverage of dAl measurements, compiled in Han et al. (2008), related to the importance of dust delivering micronutrients (e.g. Fe) to the surface ocean. Along the GEOTRACES GA06 section, dAl concentrations were high and ranged from 8 nM in the North Atlantic Tropical Gyre region (NATR) to 67 nM in the western tropical Atlantic region (WTRA). In the southern part of the section at ∼8∘ S, at the boundary between the South Atlantic Gyre (SAG) and the South Equatorial Current (SEC) in the WTRA (Fig. 1), dAl displayed low concentrations (∼8.8 nM) with elevated salinity (36.54) (Fig. 4). The latter region is known to have low rainfall, high rates of evaporation (Yoo and Carton, 1990) and receives large volumes of mineral dust deposition (Prospero, 1996b). Vink and Measures (2001) observed similarly low levels of dAl (8 nM) but somewhat further south at 15∘ S. Similarly, on the westward transect at ca. 12.5∘ N, low dAl concentrations were observed (down to 8 nM), and are associated with enhanced removal of dAl by biogenic particles. Enhanced primary production as a consequence of upwelling of nutrient-rich deep water resulted in a high abundance of biogenic particles; Measures et al. (2015) reported similar conditions for the region. Also, the low levels observed could be associated with the westward transport of depleted Al waters arising from the African upwelling region (Gelado-Caballero et al., 1996). High dAl concentrations (15–28 nM) were found north of 3∘ S and were related to enhanced deposition of mineral dust as the sampling stations were located along the flow path of the trade winds that carry mineral dust from the Sahara and Sahel regions (Mahowald et al., 2005; Prospero et al., 2002). Maximum concentrations of dAl (up to 68 nM) were observed at ca. 3∘ N, 26∘ W (station 14) and coincided with reduced salinity (down to 35) (Fig. 4), suggesting freshwater inputs from rainfall occurring in the ITCZ. The ITCZ was positioned between ca. 3∘ S and 3∘ N with the core situated at 1∘ N during the cruise period (Schlosser et al., 2014). Precipitation in the ITCZ effectively scavenges dust from the atmosphere and supplies Al to surface waters in the form of wet deposition (Schlosser et al., 2014). Similarly, high dAl concentrations (or total Al, e.g. up to 74 nM) (Van Der Loeff et al., 1997) for the region have been reported (Barrett et al., 2015; Bowie et al., 2002; Dammshäuser et al., 2011; Helmers and Rutgers van der Loeff, 1993; Measures, 1995; Measures et al., 2015, 2008; Measures and Vink, 2000; Pohl et al., 2011; Schlosser et al., 2014). These studies relate the high Al values either to wet deposition and/or large dry deposition pulses.
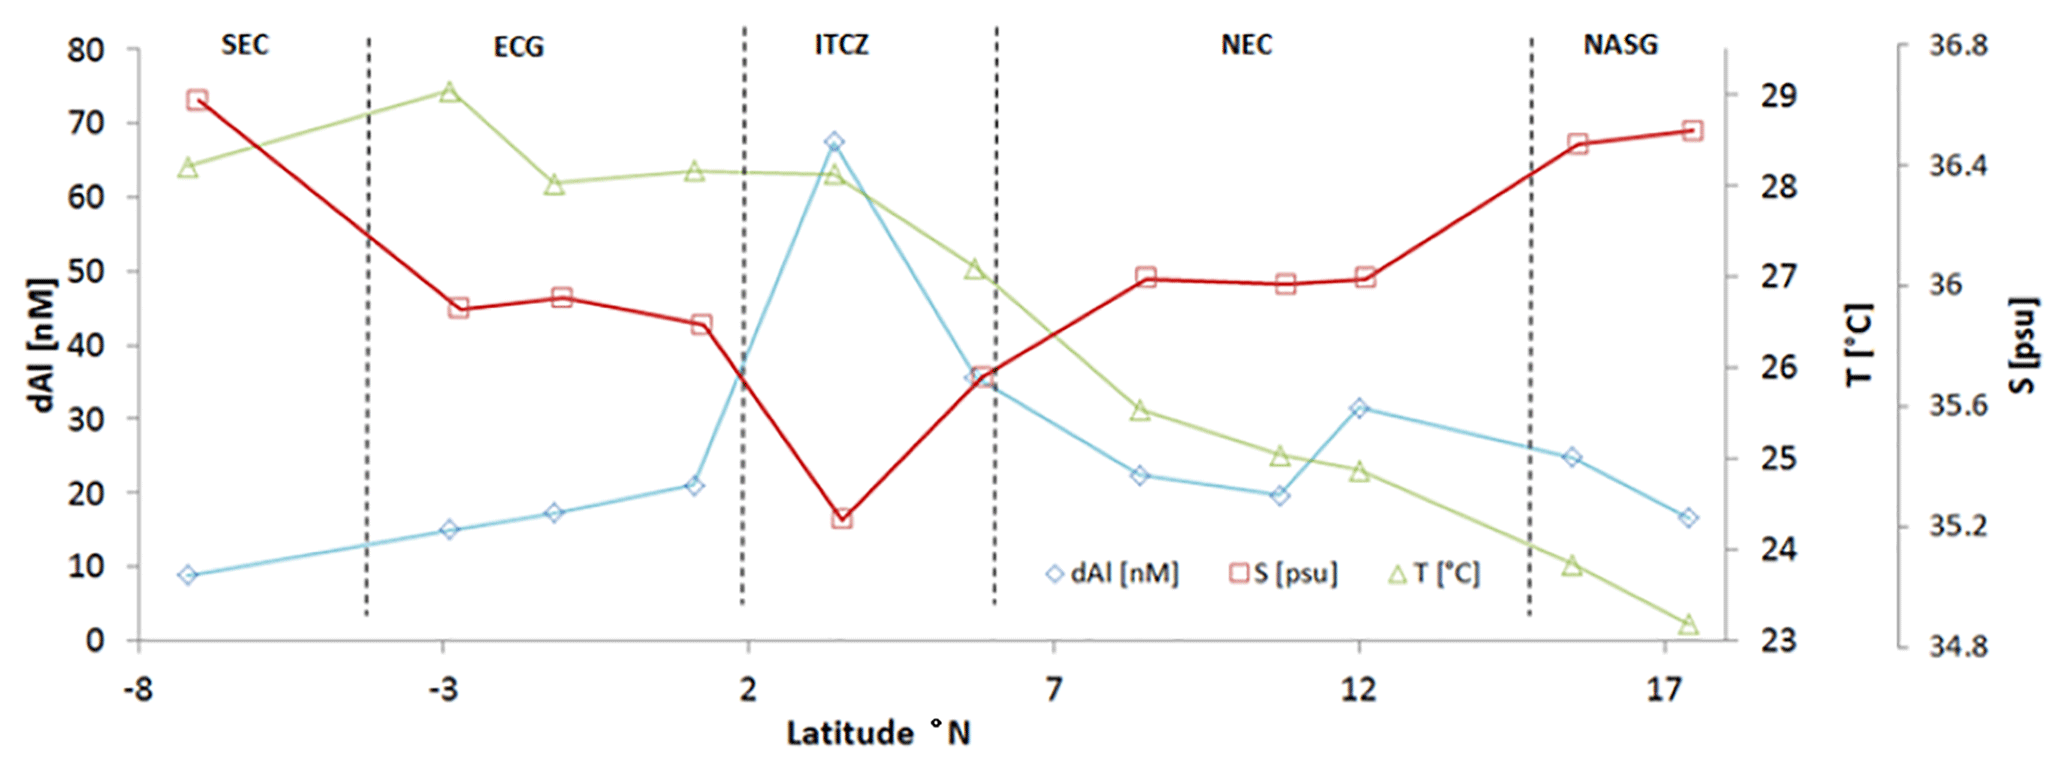
Figure 4Distribution of dAl (nM), salinity and temperature for the northward transect in the tropical Atlantic (GA06). SEC, South Equatorial Current; ECG, Equatorial Gyre; ITCY, Intertropical Convergence Zone; NEC, North Equatorial Current; NASG, North Atlantic Subtropical Gyre.

Figure 5Compilation of aluminium (Al) data for the tropical Atlantic Ocean. Solid and dashed lines represent minimum, maximum, and average Al (filtered and unfiltered) and salinity for several cruises in different seasons and years. For each degree in latitude available Al data have been averaged. For specific seasons and specific references to a dataset please refer to Fig. S5.
Figure 5 shows average, maximum and minimum Al concentration data (filtered and unfiltered) collected over several cruises from approximately 25∘ S to 25∘ N. The single datasets used for the figure are shown in Fig. S4. From Figs. 5 and S4 we can observe that Al values between 8∘ S and 17∘ N are highly variable with a large range between maximum and minimum values. This high variability is a consequence of seasonal migration of the ITCZ and the seasonal nature of mineral dust plumes which vary in intensity on a daily basis (Patey et al., 2015). These factors, in addition to equatorial upwelling (Vink and Measures, 2001), will impact particle fluxes (biogenic and non-biogenic) (Chester, 1982; Kuss et al., 2010) which, in turn, impact the residence time of Al in the tropical Atlantic and our ability to accurately calculate atmospheric fluxes (see Sect. 3.6.2). The influence of sporadic inputs of Al (either wet or dry) is critical as it has been demonstrated that dAl concentrations in surface waters can change substantially within weeks after sporadic inputs (de Jong et al., 2007; Schlosser et al., 2014). Deciphering the seasonal variability of dAl in the tropical Atlantic seems a difficult task. The deciphering of seasonal variability, if done by only using Al surface concentrations, would struggle to yield precise outcomes.
3.2.3 Dissolved Al in the surface mixed-layer of the south-east Atlantic Ocean (GA08)
Along GEOTRACES section GA08 in the south-east Atlantic, dAl concentrations (Fig. 3) ranged from 1.2 (station 45) to 784 nM (station 15) (median 9 nM; n=44). The lowest dAl concentrations were found south of 20∘ S at stations along the prime meridian and at ca. 30∘ S and 1 to 10∘ E as a consequence of low aerosol deposition to the South Atlantic Gyre (SAG) region. Similar low concentrations of surface dAl associated with low productivity waters in the South Atlantic Gyre have been reported (Measures, 1995). Low dAl concentrations (down to 1.3 nM) were observed during GA08 in the Benguela Coastal Current (BENG) region off Namibia coinciding with high chlorophyll a (Chl a) concentrations (Fig. S5) and thus enhanced dAl scavenging onto biogenic particles. The enhanced scavenging of dAl by particles is supported by elevated concentrations of total dissolvable Al (unfiltered) observed during the AMT-6 cruise (Bowie et al., 2002). Bowie et al. (2002) argued that the enhanced total dissolvable Al was a consequence of Al-rich upwelled waters. Significant correlations between increased number of biogenic particles, and low dAl and high particulate Aluminium (pAl) concentrations have recently been reported (Menzel Barraqueta et al., 2018; Barret et al., 2018), indicating the control of biogenic particles on Al cycling in surface waters. The highest dAl concentrations (up to 784 nM) were observed along the SW African coast north of 6∘ S (stations 14 to 23) in the Guinea Current Coastal region (GUIN) and were associated with freshwater inputs from the Congo River. Similar observations were made by van Bennekom and Jager (1978), and enhanced levels of dAl (up to 50 nM) associated with inputs from the Congo River have been reported as far as 1200 km (6∘ S 0∘ E) from the river mouth (Van Der Loeff et al., 1997). Between the Congo River mouth (6∘ S) and the Angola-Benguela frontal zone (ca. 11∘ S) (Fig. 1) elevated dAl was observed (20–40 nM) (Fig. 3). Possible sources for the elevated dAl concentrations are urban emissions and atmospheric mineral dust from West Africa. Prospero (1996a) argued that when the ITCZ migrates south of the Equator, additional southward transfer to the Gulf of Guinea of atmospheric dust from the Sahara and the Sahel regions can occur during austral summer. In addition, the low Chl a concentrations in the GUIN region would facilitate dAl accumulation in the surface mixed layer due to a lack of adsorption onto biogenic particles.
3.2.4 Dissolved Al in the surface mixed-layer of the South Atlantic Ocean (GA10)
Along GEOTRACES section GA10 in the South Atlantic Ocean, dAl concentrations were generally low and ranged between 0.3 nM in the South Atlantic Current (SAC) and 15.8 nM on the Argentine shelf (n=17, median = 1.6 nM) (Fig. 3). Highest concentrations (up to 16 nM) were observed on the south-west Atlantic Shelf region (FKLD). The FKLD is thought to be influenced by dAl inputs from the Rio de la Plata, shelf sources, and possibly atmospheric deposition from Patagonian sources (Chance et al., 2015; Jickells et al., 2005; Mahowald et al., 2005; Wagener et al., 2008). However, the correlation between surface salinity and dAl for the FKLD is weak (n=4, R2=0.13) and suggests a minor influence on Al concentrations from freshwater sources. Thus, it is unlikely that the Rio de la Plata was a major source of dAl at the time of the cruise. An additional input of dAl could be associated from the advection of Al-rich waters from the southward flowing Brazil Current (Vink and Measures, 2001). However, this feature has been observed somewhat further north at 34∘ S and the influence of the Brazil Current at our latitude may been counterbalanced by the northward flowing Malvinas Current (Fig. 1). Similar dAl concentrations in the vicinity of the South American continent were observed during expeditions ANT IX/1 (Van Der Loeff et al., 1997) and AMT-3 (Bowie et al., 2002), and attributed to recent dust deposition. In the South Subtropical Convergence region (SSTC), the dAl concentrations were low (<5 nM), reflecting low Al inputs from atmospheric deposition (Mahowald et al., 2005) and/or removal via particle scavenging in the SSTC along ca. 40∘ S. Our observations agree with measurements of low concentration of dAl in the high-latitude South Atlantic Ocean (Middag et al., 2011).
3.3 Fractional solubility of Al (Alsol%)
The fractional solubility of trace metals from aerosols is controlled by the following: (1) chemical processing during atmospheric transport which is influenced by the relative humidity of the particles (Keene et al., 2002), by the balance of acid species enhanced by anthropogenic sources, e.g. fossil fuel combustion (Ito, 2015; Sholkovitz et al., 2012) and by the phase partitioning of NH3 (Hennigan et al., 2015); and (2) composition and type of particle; aerosols from different sources have different mineralogies and size distributions which influence the solubility of metals (Baker and Jickells, 2017). Reported aerosol Al fractional solubilities in aerosols span a large range from 0.5 % to 100 % (Baker et al., 2006; Buck et al., 2010; Measures et al., 2010; Prospero et al., 1987; Shelley et al., 2017). A modelling approach by Han et al. (2012) resulted in a global Al fractional solubility of 4.1 (3.8 and 7 for the North and South Atlantic, respectively). However, the Han model uses Al fractional solubility data of three cruises due to the lack of available field data at that time. One of the reasons for this large range is likely the lack of standardization in aerosol leaching methods (Aguilar-Islas et al., 2010). An up to 20-fold (1 to 20 g m−2 yr−1) difference between atmospheric deposition fluxes, estimated from Al fractional solubility values following two different aerosol leaching methods, has been reported by Anderson et al. (2016). However, based on aerosol Fe solubility experiments, the largest differences resulted from aerosols from different sources (Aguilar-Islas et al., 2010; Fishwick et al., 2014).
In an early study which used dAl concentrations in the surface mixed layer to derive atmospheric deposition fluxes, Measures and Brown (1996), chose an Al fractional solubility range of 1.5 % to 5 % for the tropical Atlantic, with the upper limit derived from aerosols and rain data by Prospero et al. (1987). Measures and Brown (1996) discussed that the chosen upper boundary for Al fractional solubility may have been too low, as earlier studies (Maring and Duce, 1987) reported an Al fractional solubility of 9 %, which was attributed to cloud processing during long-range atmospheric transport to the mid-Pacific Ocean, and thus not directly applicable to tropical Atlantic aerosols.
As our study region spans the entire Atlantic Ocean, we expect a large range in Al fractional solubility due to multiple aerosol sources (Baker and Jickells, 2017; Baker et al., 2006). Table S3 shows the Al fractional solubility for each region and subregion (Fig. S2) and the relative abundance of air mass back trajectories. The Al fractional solubility partially reflects the different aerosol sources. The lowest Al fractional solubility values (5 %–7.7 %) were estimated for the NATR and WTRA (GA06) and for the GUIN and BENG region in the south-east Atlantic (GA08) due to the dominance of mineral dust. The highest Al fractional solubility (11.6 %–21 %) was calculated at high latitudes (GA01 and GA10) and in the SATL (GA08) which was likely due to the greater distances from the aerosol source regions and/or higher degree of atmospheric processing that these aerosols have undergone during transport (e.g. Shelley et al., 2017). Overall, the Al fractional solubility used in this study ranged from 5 % to 20 %. The higher the Al fractional solubility value, the less aerosol material is required to maintain the observed dAl surface mixed-layer concentrations.
We acknowledge the lack of use of Al solubility values in rain, which has been estimated to account for 89 % of the total deposition to the ocean (Zender et al., 2003). However, the amount of published data of Al fractional solubility in rain is still minor (Heimburger et al., 2013; Losno et al., 1993). The option to link the few values to global precipitation models (Liu et al., 2012) seems, at this stage, a more qualitative than quantitative approach in comparison to the larger amount of Al fractional solubility data available for dry aerosols.
3.4 Residence time of dAl
The residence time of dAl in the surface mixed layer is a balance between atmospheric, riverine and sedimentary inputs, and removal processes which are dominated by scavenging of dAl by biogenic particles (Orians and Bruland, 1986). Short residence times are associated with regions of enhanced mineral dust deposition (Dammshäuser et al., 2011; Schüßler et al., 2005) such as the tropical North Atlantic and regions of enhanced biological activity (primary productivity) such as the North Atlantic (north of 40∘ N). In contrast, long Al residence times are associated with regions of low mineral dust deposition and low biological activity (Dammshäuser et al., 2011; Jickells, 1999) such as the South Atlantic Subtropical Gyre. The residence time of dAl in the upper ocean has been estimated to range from ∼0.2 to more than 17 years (Dammshäuser et al., 2011; Jickells, 1999; Jickells et al., 1994; Orians and Bruland, 1986) and up to 73 years in modelling studies (Han et al., 2008). In this study, we used short Al residence times in the surface mixed layer for the North Atlantic (GA01), tropical Atlantic (GA06), along the upwelling regions in the south-east Atlantic (GA08), and for the South Atlantic along the South Subtropical Convergence region (SSTC) (GA10). Longer Al residence times were used for the south-east Atlantic Ocean, more precisely along the prime meridian as a consequence of low removal rates removal due to low primary productivity and low atmospheric deposition. Overall, the Al residence times used in this study (Table 1) were derived for each biogeochemical province from the estimates provided in Han et al. (2008), and ranged between 0.75 and 3 years.
Table 1Input values to estimate total atmospheric deposition fluxes using the MADCOW model. MLD, average between the median MLDms and MLDar; τ, Al residence time derived from Han et al. (2008) for the different biogeochemical provinces; Alsol%, Al fractional solubility percentage calculated from Baker et al. (2013). For reference to the biogeochemical provinces please refer to Table S1.
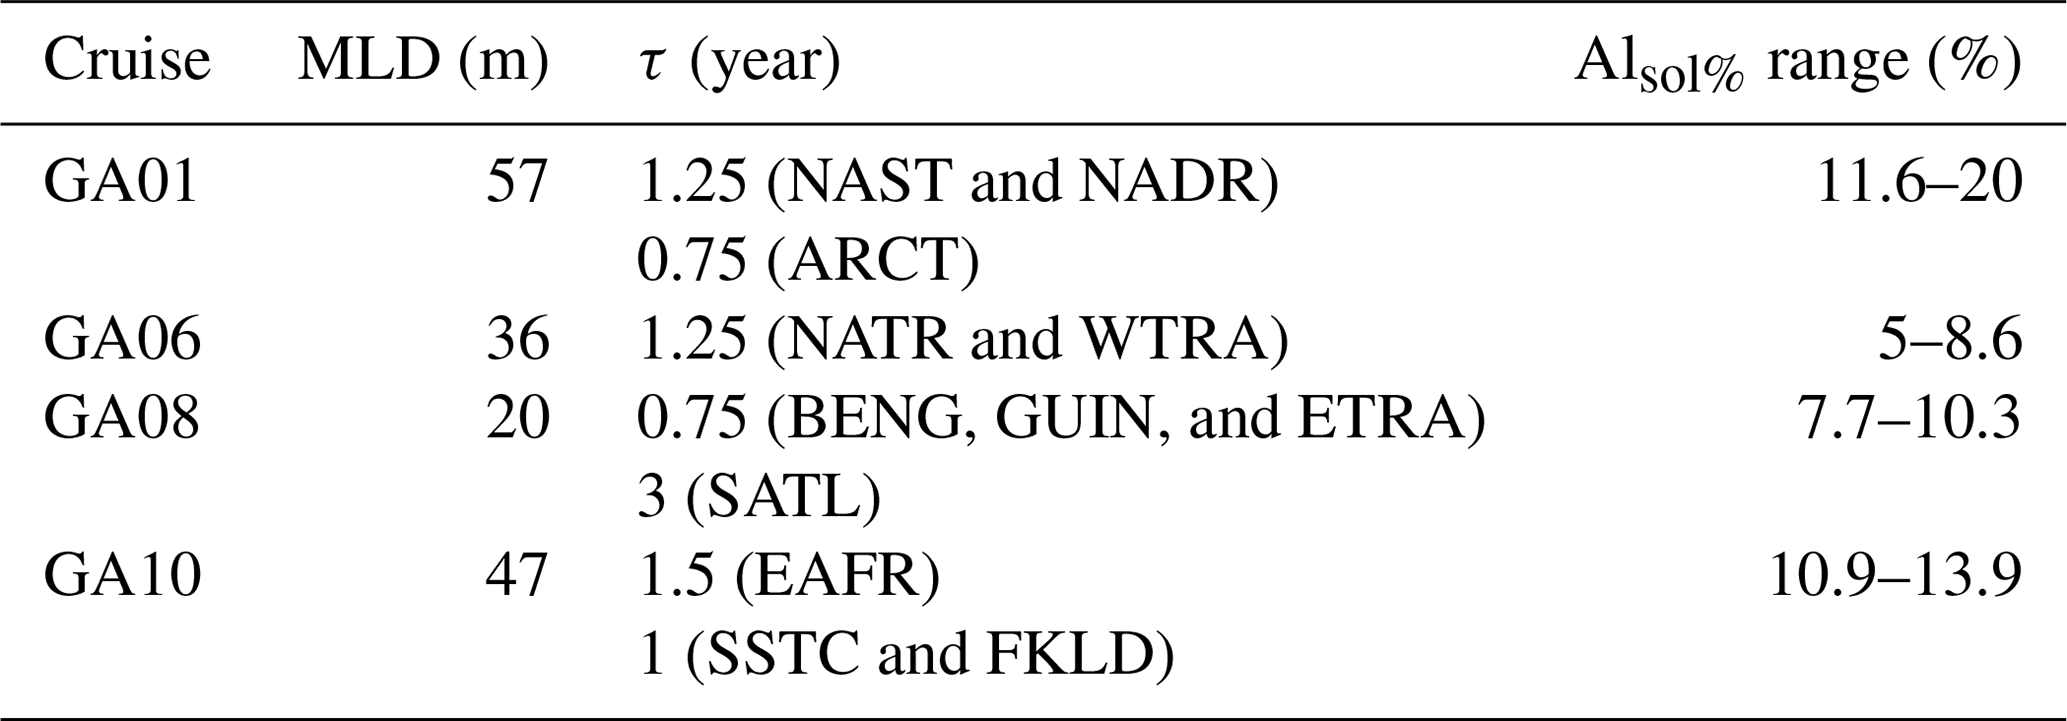
Table 2Average atmospheric deposition fluxes estimated for each biogeochemical province. For reference on the different regions please refer to Table S1. The deposition fluxes are given in g m−2 yr−1. Mahowald, Duce, and Zender refer to the atmospheric deposition flux results provided in Mahowald et al. (2005), Duce et al. (1991), and Zender et al. (2003), respectively. GUIN* refers to deposition results affected by additional Al inputs from the Congo River plume.

3.5 Application of the MADCOW model to derive total atmospheric deposition fluxes in the study area
3.5.1 MADCOW input parameter assumptions
The original MADCOW model (Measures and Brown, 1996) assumed a uniform residence time of 5 years for dAl in the surface mixed layer, an invariant content of Al in dust of 8 %, a fixed MLD of 30 m, and an aerosol Al fractional solubility of between 1.5 % and 5 %. The total dust deposition was calculated by multiplying the concentration of dAl in the mixed layer by 0.133 and 0.04 (factors for unit conversion) for a solubility of 1.5 % and 5 %, respectively. Our study region spans the whole Atlantic Ocean, with a range in MLDs, in fractional Al solubilities, and in residence times of Al in the surface mixed layer. The different input parameters used for the dust flux calculations for each of the four study regions can be found in Table 1 and relate to the factors described in Sects. 2 and 3. Mixed layer depths were deeper for GA01 and GA10, and shallower for GA06 and GA08. The residence time of dAl in the surface mixed layer along the four transects was quite uniform and ranged from 0.75 to 3 years. The largest variability was noted for the aerosol Al fractional solubility due to the following: inter-annual and inter-seasonal variability in the contribution of different aerosol sources, incomplete spatial coverage, and wet to dry deposition balance, etc. As a consequence, for each cruise we chose a lower and upper limit of Al fractional solubility. Thus we obtained an upper and lower range in atmospheric deposition fluxes for each cruise. The total range on aerosol Al fractional solubility used in this study was 5 % to 20 %, which is up to 3× and 4× higher than the lower and upper limit used by Measures and Brown (1996). Higher Al fractional solubilities were used for GA01 and GA10, and lower values for GA08 and GA06.
3.6 Atmospheric deposition fluxes
Figure 6 shows the average atmospheric deposition flux (wet + dry) for each station. In addition, Fig. 7a, b, c and d show a comparison of calculated average total atmospheric deposition fluxes (this study) and total atmospheric deposition fluxes for each station extracted from the models of Mahowald et al. (2005) and Zender et al. (2003). In Table 2, we present our total atmospheric deposition fluxes values for each biogeochemical province compared to the model estimates from Mahowald et al. (2005), Zender et al. (2003), and Duce et al. (1991). Overall, we found good agreement along GA01, GA08, and GA10. Weaker agreement was found in the tropical Atlantic along GA06. In the following sections we describe our atmospheric deposition fluxes in more detail.

Figure 6(a) Average atmospheric deposition fluxes determined for the four GEOTRACES cruises. (b) Average atmospheric deposition fluxes determined from GEOTRACES GA03 and A16N-2003 cruises are plotted (Measures et al., 2015). Black dashed lines define boundaries of atmospheric deposition from Duce et al. (1991).
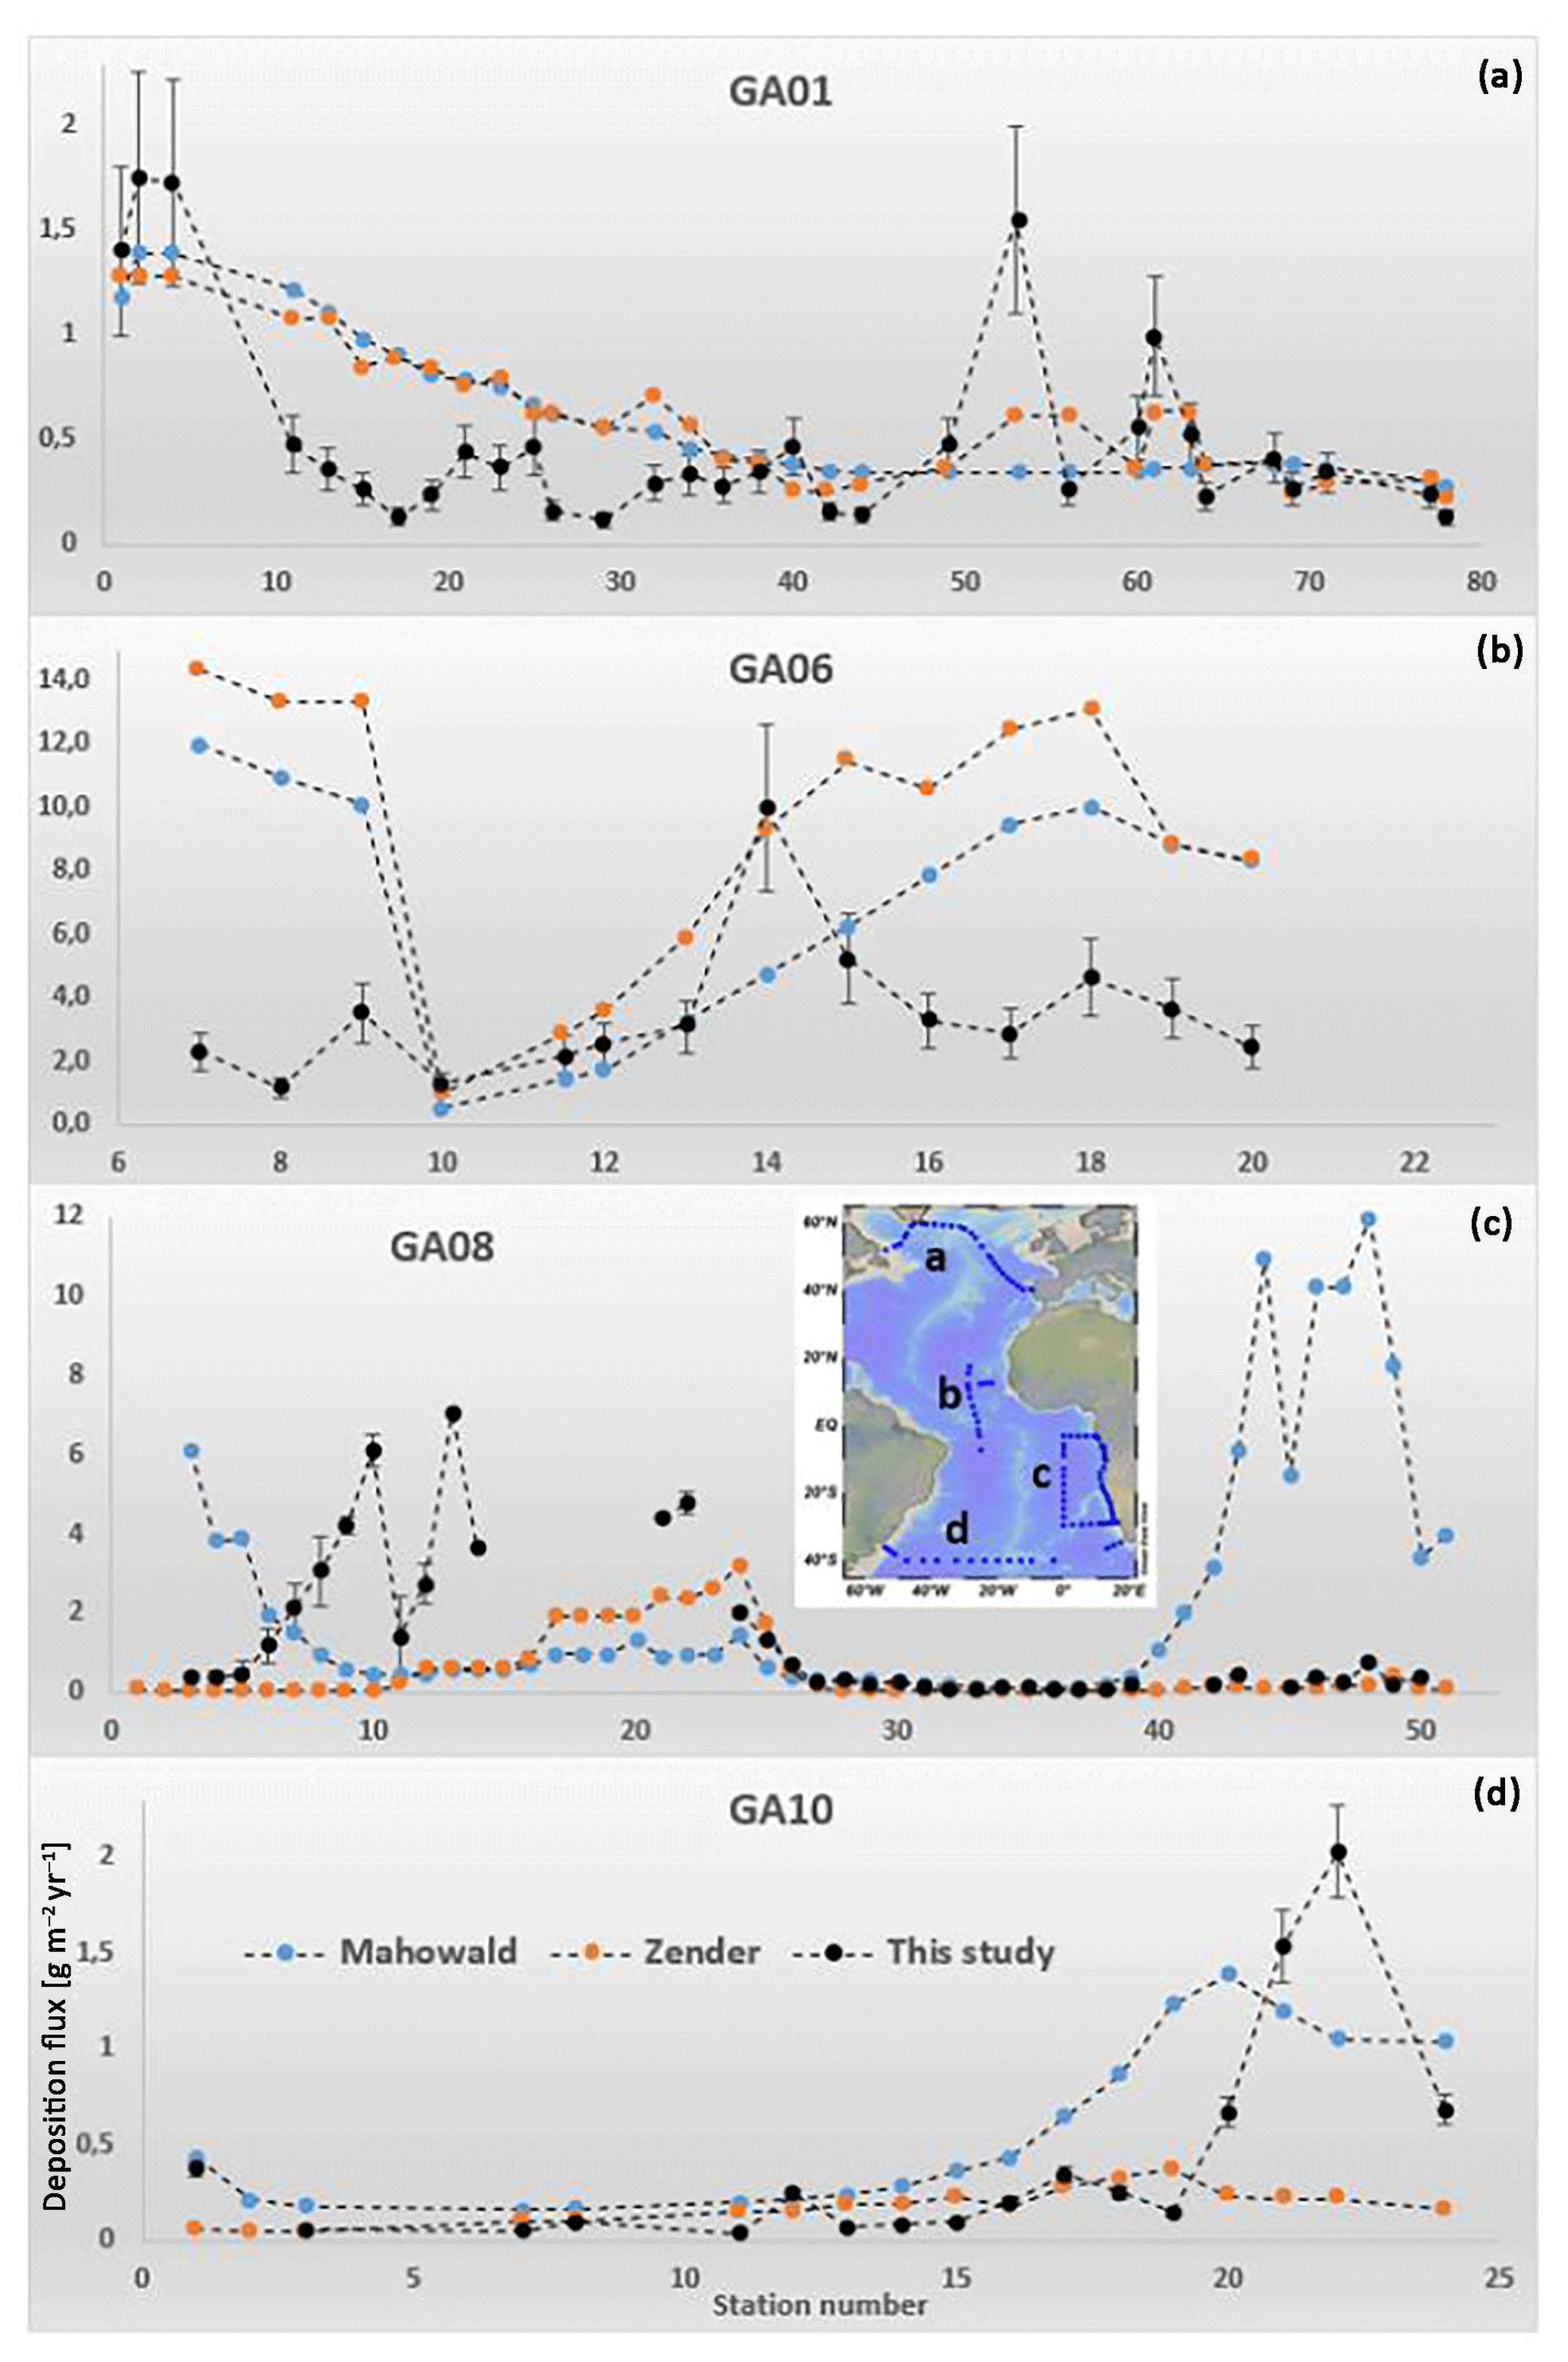
Figure 7Total average atmospheric deposition fluxes (this study, black circles) and model atmospheric deposition estimates from Mahowald et al. (2005) (blue circles) and Zender et al. (2003) (orange circles). For stations numbers associated to each cruise please refer to Fig. S1.
3.6.1 Atmospheric deposition fluxes to the North Atlantic and Labrador Sea (GA01)
In the North Atlantic, along the GA01 section, our calculated atmospheric deposition fluxes ranged from 1.75±0.71 g m−2 yr−1 (Station 2) near the Iberian Peninsula in the NAST region to 0.12±0.05 g m−2 yr−1 (Station 78) above the Newfoundland margin in the ARCT region (Figs. 6 and 7a). The average atmospheric deposition flux was 0.49±0.46 g m−2 yr−1. The highest atmospheric deposition fluxes were calculated in the vicinity of land masses (i.e. Iberian Peninsula and Greenland) and could be partly due to overestimations by the MADCOW model. An overestimation would arise if there were additional Al sources, rather than Al being input solely from atmospheric deposition. The coastal stations (1, 2 and 4; Fig. S1) near the Iberian Peninsula received additional Al inputs from the Tagus Estuary (Menzel Barraqueta et al., 2018), while the coastal stations (53 and 63; Fig. S1) near Greenland were influenced by additional Al inputs from glacial run-off and ice melt (Menzel Barraqueta et al., 2018). With these stations removed, the average atmospheric deposition flux along GA01 decreased to 0.28±0.12 g m−2 yr−1 (n=24). Although the atmospheric deposition fluxes near the Iberian Peninsula were high relative to the rest of the transect, they are comparable to modelled atmospheric aerosol deposition fluxes (Mahowald et al., 2005; Zender et al., 2003) (Table 2 and Fig. 6). Measures et al. (2015) reported an atmospheric deposition flux of ca. 0.91 g m−2 yr−1 (station USGT10-02) close to the Iberian Peninsula along GEOTRACES section GA03 (Fig. 6b), which is somewhat lower than our average deposition flux for stations 1, 2 and 4 (1.63±0.08 g m−2 yr−1). Our calculated fluxes derived from dAl at coastal stations near the Iberian Peninsula may be on the high end of the scale due to additional Al inputs from the Tagus Estuary which did not influence the nearby stations sampled by Measures et al. (2015). In the NAST we derived an average dust flux for stations 21, 23 and 25 of 0.42±0.17 g m−2 yr−1. This is in good agreement with the calculated atmospheric deposition fluxes for the same region during the 2003 CLIVAR A16N cruise (Measures et al., 2015) using aerosol Al concentrations from Buck et al. (2010) (Fig. 6b). Shelley et al. (2017) reported atmospheric deposition fluxes for a suite of elements for the GA01 cruise using two different approaches: (1) aerosol and precipitation concentration data (which they termed “traditional approach”) and (2) 7Be in aerosols and the surface mixed layer. They divided the GA01 section into two areas: (i) Area 1 = west of 30∘ W and (ii) Area 2 = east of 30∘ W (Fig. 1). For Area 1 they derived atmospheric deposition fluxes of 0.03 and 0.1 g m−2 yr−1 using the traditional and 7Be approaches, respectively. For Area 2, the atmospheric deposition fluxes were 0.19 and 0.14 g m−2 yr−1 for the traditional and 7Be approaches, respectively. With the MADCOW model we calculated average atmospheric deposition fluxes of 0.27±0.16 and 0.3±0.12 g m−2 yr−1 for Area 1 and 2, respectively. The average modelled flux estimates for the same areas from Mahowald et al. (2005) were 0.36±0.03 and 0.76±0.32 g m−2 yr−1. It is encouraging that the different flux results are of a similar order of magnitude, although the dust flux estimates derived from Mahowald et al. (2005) were always highest. It is possible that the dust deposition model (Mahowald et al., 2005) may have overestimated atmospheric deposition in the North Atlantic (north of 50∘ N) due to the limited number of field observations available at the time. Interestingly, a higher atmospheric deposition flux was calculated with the MADCOW model than with either the aerosol approach or the 7Be method. This could be due to the different timescales over which each approach integrates. The MADCOW model approach integrates the total atmospheric deposition flux over a period of ca. 1 year prior (based on our choice of dAl surface mixed-layer residence time) to the GA01 cruise, while the 7Be approach integrates over a period of 3 months, and the aerosol approach provides a snapshot over a period of days. The elevated atmospheric deposition flux for the traditional compared to the 7Be approach in area 2 was attributed to 7Be scavenging onto biogenic particles near the Iberian Peninsula (Shelley et al., 2017).
3.6.2 Atmospheric deposition fluxes to the tropical Atlantic (GA06)
Overall, the atmospheric deposition fluxes calculated for the tropical Atlantic using MADCOW are generally of the same order of magnitude compared to modelled atmospheric deposition fluxes (Mahowald et al., 2005; Zender et al., 2003) (Table 2 and Figs. 6, 7b). Along GA06, the calculated atmospheric deposition fluxes range from 1.19±0.45 g m−2 yr−1 at station 8 to 9.96±3.72 g m−2 yr−1 at station 14 (Figs. S1 and 6, 7b). The average calculated atmospheric deposition flux along the cruise was 3.46±2.18 g m−2 yr−1. In contrast, in the WTRA, our average atmospheric deposition flux of 3.82±2.72 g m−2 yr−1 agrees very well with modelled atmospheric deposition fluxes (4.4±3.2 and 7.15±4.35 g m−2 yr−1 for “Mahowald” and “Zender”). However, in the NATR, large discrepancies are observed between our and modelled atmospheric deposition fluxes (Table 2, Fig. 7b). The largest differences are found along the east–west transect and north of 8∘ N. Along the east–west transect (Station 7 to 9) at ca. 12∘ N and north of 8∘ N, our atmospheric deposition fluxes range between 1.19±0.44 and 3.54±1.32 g m−2 yr−1, while modelled dust fluxes are above 8 g m−2 yr−1 and reach up to 12 g m−2 yr−1 (Fig. 7b).
The discrepancy could result from differences in the solubility of aerosols in the east and west of the basin. A combination of more soluble aerosols transported from mineral dust sources regions in North Africa, via the trade winds to the western tropical Atlantic, and from American sources, may result in higher levels of dAl in the western tropical Atlantic than in the eastern tropical Atlantic (Measures et al., 2015; Sedwick et al., 2007). In addition, the Mahowald model uses extensive field data and monthly satellite retrievals over many years. Thus, the Mahowald model may better capture the high degree of inter-annual and inter-seasonal variability in dust. Whilst there is more dust being deposited in the eastern tropical Atlantic (e.g. 18 g m−2 yr−1, annual average; Powell et al., 2015) than in the western tropical Atlantic (e.g 1.71 g m−2 yr−1 in the Sargasso Sea; Jickells et al., 1994), MADCOW calculates higher atmospheric deposition fluxes in the western tropical Atlantic than in the eastern tropical Atlantic (this study and Measures et al., 2008, 2015).
The NATR region is influenced by strong seasonal variations (e.g. intensity of rainfalls, episodic dust events) which influence primary productivity (i.e. number of particles). Therefore, these variations have a strong influence in seasonal variability in Al concentrations (Pohl et al., 2011) as well as seasonal variability of particle fluxes (i.e. potential reducers of dAl concentrations in surface waters). This implies an added difficulty in assessing a residence time for Al. The residence time in the NATR could be lower, in the range of weeks, as postulated in previous works (Croot et al., 2004). Assuming a residence time of 0.3 years (original residence time set up to 1.25 years), for the NATR region would yield atmospheric deposition fluxes ranging between 4.96±1.86 and 19.37±7.25 g m−2 yr−1 (average 12.32±4.66 g m−2 yr−1) which, within uncertainty, are equal to those provided by modelling approaches (see above, Mahowald et al., 2005; Duce et al., 1991; Zender et al., 2003).
These results do not match the observations (from field data and satellite retrievals) and this suggests that atmospheric deposition fluxes calculated with the MADCOW model are less reliable and likely underestimated in the tropical North Atlantic Ocean if seasonal variations in the residence time of Al are not accounted for.
3.6.3 Atmospheric deposition fluxes to the south-east Atlantic (GA08)
The MADCOW model overestimates atmospheric aerosol deposition fluxes to the GUIN region north of 6∘ S with fluxes ranging from 38 to 163 g m−2 yr−1. We have omitted stations 14 to 21 from the average atmospheric deposition flux, as they are strongly influenced by additional dAl inputs from the Congo River (Figs. 3 and S1). Following this removal, atmospheric deposition fluxes along GA08 (Figs. 6, 7c) ranged from 0.04±0.01 g m−2 yr−1 in the South Atlantic Gyre region (SATL) to 7.08±1.44 g m−2 yr−1 in the Guinea Current coastal region (GUIN) at ca. 12∘ S (Table 2). The average calculated atmospheric deposition flux to the south-east Atlantic was 1.33±1.85 g m−2 yr−1. The MADCOW model may underestimate atmospheric deposition fluxes in the BENG region, which is influenced by eastern boundary upwelling processes, supplying nutrients from deep to surface waters, and resulting in enhanced primary productivity with high levels of Chl a (Fig. S5). The BENG region receives mineral dust inputs from the Namib Desert (Prospero et al., 2002), but the large abundance of biogenic particles likely results in low surface dAl concentrations (<7 nM) (Fig. 3) due to enhanced scavenging. Mahowald et al. (2005) calculated an average atmospheric deposition flux for the BENG region of 5.2±4.16 g m−2 yr−1 with deposition values of up to 11.96 g m−2 yr−1 (station 48). However, our atmospheric deposition fluxes and Zender's ones for this region are rather low with an average of 0.36±0.18 g m−2 yr−1 and 0.1±0.09 g m−2 yr−1, respectively. In contrast, our MADCOW-derived atmospheric deposition fluxes in the SATL region (0.17±0.18 g m−2 yr−1) are in close agreement with model estimates (0.22±0.09 g m−2 yr−1).
3.6.4 Atmospheric deposition fluxes to the South Atlantic Ocean (GA10)
Along GA10, the calculated atmospheric deposition fluxes ranged from 0.15±0.1 g m−2 yr−1 in the South Subtropical Convergence (SSTC) region to 1.23±0.67 g m−2 yr−1 in the south-west Atlantic shelf (FKLD) region off Argentina. The average atmospheric deposition flux calculated along the 40∘ S section was 0.21 g m−2 yr−1. The highest atmospheric deposition flux was estimated in the FKLD (1.23±0.67 g m−2 yr−1) downwind from South America, with Patagonian dust reported as the main source of mineral dust to the South Atlantic Ocean (Johnson et al., 2010; Wagener et al., 2008). Our atmospheric deposition fluxes in the FKLD agree with model estimates for the same region from Mahowald et al. (2005) (Table 2, Figs. 6, 7d) and Wagener et al. (2008). In contrast, the “Zender” model atmospheric deposition flux within the FKLD (0.21±0.03 g m−2 yr−1) is significantly lower than the deposition flux from our study (Mahowald et al.,2005; Wagener et al.,2008). Some discrepancies exist between the region of maximum atmospheric deposition. Indeed, Wagener et al. (2008) acknowledged this issue stating that the largest uncertainty in their estimates occurred downwind from South America as their field data were collected on cruises in the South Pacific and South Indian oceans. The lowest atmospheric aerosol deposition was found along the SSTC region (0.15±0.1 g m−2 yr−1), and was somewhat lower than model results but identical in the calculated uncertainties (Table 2). In the EAFR, we calculated an average atmospheric deposition flux of 0.21±0.22 g m−2 yr−1. This flux agrees very well with total atmospheric deposition fluxes for the same region calculated from aerosol samples collected on the Falkland Islands (0.18 g m−2 yr−1) (Chance et al., 2015) and with model results (Mahowald et al., 2005; Zender et al., 2003). It is possible that the South Atlantic Ocean also receives additional mineral dust inputs from South African sources although Patagonian dust is considered the major source of aerosols to this region (Gaiero et al., 2003; Wagener et al., 2008).
Dissolved Al concentrations in the surface ocean are a balance between input and removal processes. In this context, we can use the concentration of dAl in the mixed layer along with the residence time of dAl in the mixed layer to calculate atmospheric deposition fluxes. Overall, in oceanic regions beyond the shelf break, we found good agreement between our calculated MADCOW atmospheric deposition fluxes and modelled atmospheric deposition fluxes (Mahowald et al., 2005; Zender et al., 2003). The agreement between our MADCOW deposition flux calculations and model results was poor in regions with additional Al inputs (e.g. river run off, ice melt, and benthic) and strong Al depletion by biogenic particles (e.g. upwelling regions). Our atmospheric deposition fluxes were lower than model fluxes in areas of the Atlantic Ocean regions removed from the main aerosol sources regions. This observation suggests that these regions receive fewer atmospheric inputs than the models indicate or that MADCOW underestimates atmospheric inputs to these regions. As such, this work provides new constraints for models of atmospheric deposition for the largely under-sampled regions of the Atlantic Ocean (e.g. Labrador Sea, South Atlantic and south-east Atlantic Ocean). Specifically, Mahowald et al. (2008) note that there are few aerosol measurements reported for the region between 30 and 60∘ S, due to a lack of island sites for deployment of aerosol samplers and the remoteness of the region presenting logistical challenges for research cruises. In the GEOTRACES programme, a concerted effort has been made to cover these under-sampled regions of the ocean. Dissolved Al is a key trace element of the GEOTRACES programme and as such it is measured on all the GEOTRACES cruises which provides a great chance to use the MADCOW model. We acknowledge that there are regions of the Atlantic for which the application of the MADCOW model has limitations (i.e. tropical Atlantic Ocean). In these regions, more work is needed to constrain parameters such as aerosol Al fractional solubility and the residence time of Al within the surface mixed layer. Realistic residence time values would significantly improve our atmospheric deposition flux results. We suggest that forthcoming expeditions should use more than one technique to calculate atmospheric deposition fluxes as different methods provide us with complementary information. The new Intermediate Data Product 2017 (Schlitzer et al., 2018) from the GEOTRACES programme along with upcoming dAl datasets will give us a better coverage of under-sampled regions which, combined with historical data, will help us to refine atmospheric deposition fluxes (i.e. capturing seasonal and inter-annual variability).
Data used for this study are available in the Supplement.
The supplement related to this article is available online at: https://doi.org/10.5194/bg-16-1525-2019-supplement.
CS, HFP, JKK, JLMB, and RS collected the samples. JKK, JLMB, and BW analyzed the samples. JLMB conceived the study and wrote the paper. All authors commented on previous versions of the paper.
The authors declare that they have no conflict of interest.
This article is part of the special issue “GEOVIDE, an international GEOTRACES study along the OVIDE section in the North Atlantic and in the Labrador Sea (GA01)”. It is not associated with a conference.
We are greatly thankful to the captains and crews of expeditions GA01, GA06,
GA08 and GA10 for their support during the cruises. Special thanks go to
the trace metal colleagues on board GA01, GA06, GA08, and GA10. We thank all
three anonymous reviewers, and Gideon Henderson and Laurent Boop for editorial
work. We also want to thank Charlie Zender and Nathalie Mahowald for
providing guidance on their model outputs. This work was funded by a PhD
fellowship awarded to Jan-Lukas Menzel Barraqueta from the Department of Scientific
Politics of the Basque Government, with further financial support from GEOMAR
Helmholtz Center for Ocean Research Kiel. GEOTRACES GA01 was led by France,
GA06 and GA08 by the UK, and GA10 by Germany.
The article processing charges for this open-access
publication were covered by a Research
Centre
of the Helmholtz Association.
Edited by:
Laurent Bopp
Reviewed by: three anonymous referees
Achterberg, E. P., Moore, C. M., Henson, S. A., Steigenberger, S., Stohl, A., Eckhardt, S., Avendano, L. C., Cassidy, M., Hembury, D., and Klar, J. K.: Natural iron fertilization by the Eyjafjallajökull volcanic eruption, Geophys. Res. Lett., 40, 921–926, 2013.
Aguilar-Islas, A. M., Wu, J., Rember, R., Johansen, A. M., and Shank, L. M.: Dissolution of aerosol-derived iron in seawater: Leach solution chemistry, aerosol type, and colloidal iron fraction, Mar. Chem., 120, 25–33, 2010.
Anderson, R. F., Cheng, H., Edwards, R. L., Fleisher, M. Q., Hayes, C. T., Huang, K.-F., Kadko, D., Lam, P. J., Landing, W. M., Lao, Y., Lu, Y., Measures, C. I., Moran, S. B., Morton, P. L., Ohnemus, D. C., Robinson, L. F., and Shelley, R. U.: How well can we quantify dust deposition to the ocean?, Philos. T. R. Soc A, 374, https://doi.org/10.1098/rsta.2015.0285, 2016.
Baker, A., Adams, C., Bell, T., Jickells, T., and Ganzeveld, L.: Estimation of atmospheric nutrient inputs to the Atlantic Ocean from 50∘ N to 50∘ S based on large-scale field sampling: Iron and other dust-associated elements, Global Biogeochem. Cy., 27, 755–767, 2013.
Baker, A. R. and Croot, P. L.: Atmospheric and marine controls on aerosol iron solubility in seawater, Mar. Chem., 120, 4–13, 2010.
Baker, A. R. and Jickells, T. D.: Atmospheric deposition of soluble trace elements along the Atlantic Meridional Transect (AMT), Prog. Oceanogr., 158, 41–51, 2017.
Baker, A. R., Kelly, S. D., Biswas, K. F., Witt, M., and Jickells, T. D.: Atmospheric deposition of nutrients to the Atlantic Ocean, Geophys. Res. Lett., 30, 2296, https://doi.org/10.1029/2003GL018518, 2003.
Baker, A. R., Jickells, T. D., Witt, M., and Linge, K. L.: Trends in the solubility of iron, aluminium, manganese and phosphorus in aerosol collected over the Atlantic Ocean, Mar. Chem., 98, 43–58, 2006.
Barrett, P. M., Resing, J. A., Buck, N. J., Landing, W. M., Morton, P. L., and Shelley, R. U.: Changes in the distribution of Al and particulate Fe along A16N in the eastern North Atlantic Ocean between 2003 and 2013: Implications for changes in dust deposition, Mar. Chem., 177, 57–68, 2015.
Barrett, P. M., Resing, J. A., Grand, M. M., Measures, C. I., and Landing, W. M.: Trace element composition of suspended particulate matter along three meridional CLIVAR sections in the Indian and Southern Oceans: Impact of scavenging on Al distributions, Chem. Geol., 502, 15–28, 2018.
Bowie, A. R., Whitworth, D. J., Achterberg, E. P., Mantoura, R. F. C., and Worsfold, P. J.: Biogeochemistry of Fe and other trace elements (Al, Co, Ni) in the upper Atlantic Ocean, Deep-Sea Res. Pt. I, 49, 605–636, 2002.
Brown, M. T. and Bruland, K. W.: An improved flow-injection analysis method for the determination of dissolved aluminum in seawater, Limnol. Oceanogr. Methods, 6, 87–95, 2008.
Buck, C. S., Landing, W. M., Resing, J. A., and Measures, C. I.: The solubility and deposition of aerosol Fe and other trace elements in the north atlantic ocean: observations from the A16N CLIVAR/CO2 repeat hydrography section, Mar. Chem., 120, 57–70, 2010.
Bullard, J. E., Baddock, M., Bradwell, T., Crusius, J., Darlington, E., Gaiero, D., Gasso, S., Gisladottir, G., Hodgkins, R., and McCulloch, R.: High-latitude dust in the Earth system, Rev. Geophys., 54, 447–485, 2016.
Chahine, M. T.: The hydrological cycle and its influence on climate, Nature, 359, 370–380, https://doi.org/10.1038/359373a0, 1992.
Chance, R., Jickells, T. D., and Baker, A. R.: Atmospheric trace metal concentrations, solubility and deposition fluxes in remote marine air over the south-east Atlantic, Mar. Chem., 177, 45–56, 2015.
Chester, R.: Particulate aluminium fluxes in the eastern Atlantic, Mar. Chem., 11, 1–16, 1982.
Croot, P. L., Streu, P., and Baker, A. R.: Short residence time for iron in surface seawater impacted by atmospheric dry deposition from Saharan dust events, Geophys. Res. Lett., 31, L23S08, https://doi.org/10.1029/2004GL020153, 2004.
Dammshäuser, A., Wagener, T., and Croot, P. L.: Surface water dissolved aluminum and titanium: Tracers for specific time scales of dust deposition to the Atlantic?, Geophys. Res. Lett., 38, L24601, https://doi.org/10.1029/2011GL049847, 2011.
de Jong, J. T., Boyé, M., Gelado-Caballero, M. D., Timmermans, K. R., Veldhuis, M. J., Nolting, R. F., van den Berg, C. M. G., and de Baar, H. J.: Inputs of iron, manganese and aluminium to surface waters of the Northeast Atlantic Ocean and the European continental shelf, Mar. Chem., 107, 120–142, 2007.
Duce, R., Liss, P., Merrill, J., Atlas, E., Buat-Menard, P., Hicks, B., Miller, J., Prospero, J., Arimoto, R., and Church, T.: The atmospheric input of trace species to the world ocean, Global Biogeochem. Cy., 5, 193–259, 1991.
Duce, R. A. and Tindale, N. W.: Atmospheric Transport of Iron and Its Deposition in the Ocean, Limnol. Oceanogr., 36, 1715–1726, 1991.
Fishwick, M. P., Sedwick, P. N., Lohan, M. C., Worsfold, P. J., Buck, K. N., Church, T. M., and Ussher, S. J.: The impact of changing surface ocean conditions on the dissolution of aerosol iron, Global Biogeochem. Cy., 28, 1235–1250, 2014.
Gaiero, D. M., Probst, J. L., Depetris, P. J., Bidart, S. M., and Leleyter, L.: Iron and other transition metals in Patagonian riverborne and windborne materials: geochemical control and transport to the southern South Atlantic Ocean, Geochim. Cosmochim. Ac., 67, 3603–3623, 2003.
Gelado-Caballero, M., Torres-Padrón, M., Hernandez-Brito, J., Herrera-Melian, J., and Pérez-Peña, J. J. M. C.: Aluminium distributions in central east Atlantic waters (Canary Islands), Marine Chemistry, 51, 359–372, 1996.
Han, Q., Moore, J. K., Zender, C., Measures, C., and Hydes, D.: Constraining oceanic dust deposition using surface ocean dissolved Al, Global Biogeochem. Cy., 22, GB2003, https://doi.org/10.1029/2007GB002975, 2008.
Han, Q., Zender, C., Moore, J. K., Buck, C. S., Chen, Y., Johansen, A., Measures, C.: Global estimates of mineral dust aerosol iron and aluminum solubility that account for particle size using diffusion-controlled and surface-area-controlled approximations, Biogeochem. Cy., 26, GB2038, https://doi.org/10.1029/2011GB004186, 2012.
Heimburger, A., Losno, R., and Triquet, S.: Solubility of iron and other trace elements in rainwater collected on the Kerguelen Islands (South Indian Ocean), Biogeosciences, 10, 6617–6628, https://doi.org/10.5194/bg-10-6617-2013, 2013.
Helmers, E. and Rutgers van der Loeff, M. M.: Lead and aluminum in Atlantic surface waters (50∘ N to 50∘ S) reflecting anthropogenic and natural sources in the eolian transport, 98, 20261–20273, 1993.
Hennigan, C. J., Izumi, J., Sullivan, A. P., Weber, R. J., and Nenes, A.: A critical evaluation of proxy methods used to estimate the acidity of atmospheric particles, Atmos. Chem. Phys., 15, 2775–2790, https://doi.org/10.5194/acp-15-2775-2015, 2015.
Holte, J., Talley, L. D., Gilson, J., and Roemmich, D.: An Argo mixed layer climatology and database, Geophys. Res. Lett., 44, 5618–5626, 2017.
Huneeus, N., Schulz, M., Balkanski, Y., Griesfeller, J., Prospero, J., Kinne, S., Bauer, S., Boucher, O., Chin, M., Dentener, F., Diehl, T., Easter, R., Fillmore, D., Ghan, S., Ginoux, P., Grini, A., Horowitz, L., Koch, D., Krol, M. C., Landing, W., Liu, X., Mahowald, N., Miller, R., Morcrette, J.-J., Myhre, G., Penner, J., Perlwitz, J., Stier, P., Takemura, T., and Zender, C. S.: Global dust model intercomparison in AeroCom phase I, Atmos. Chem. Phys., 11, 7781–7816, https://doi.org/10.5194/acp-11-7781-2011, 2011.
Hydes, D. and Liss, P.: Fluorimetric method for the determination of low concentrations of dissolved aluminium in natural waters, Analyst, 101, 922–931, 1976.
Ito, A.: Atmospheric processing of combustion aerosols as a source of bioavailable iron, Environ. Sci. Tech. Lett., 2, 70–75, 2015.
Jickells, T.: The inputs of dust derived elements to the Sargasso Sea; a synthesis, Mar. Chem., 68, 5–14, 1999.
Jickells, T., Church, T., Veron, A., and Arimoto, R.: Atmospheric inputs of manganese and aluminium to the Sargasso Sea and their relation to surface water concentrations, Mar. Chem., 46, 283–292, 1994.
Jickells, T., Dorling, S., Deuser, W., Church, T., Arimoto, R., and Prospero, J.: Air-borne dust fluxes to a deep water sediment trap in the Sargasso Sea. Global Biogeochem. Cy., 12, 311–320, 1998.
Jickells, T. D., An, Z. S., Andersen, K. K., Baker, A. R., Bergametti, G., Brooks, N., Cao, J. J., Boyd, P. W., Duce, R. A., Hunter, K. A., Kawahata, H., Kubilay, N., LaRoche, J., Liss, P. S., Mahowald, N., Prospero, J. M., Ridgwell, A. J., Tegen, L., and Torres, R.: Global iron connections between desert dust, ocean biogeochemistry, and climate, Science, 308, 67–71, 2005.
Jickells, T., Boyd, P., and Hunter, K. A.: Biogeochemical impacts of dust on the global carbon cycle, in: Mineral Dust, 359–384, Springer, Dordrecht, 2014.
Johnson, M. S., Meskhidze, N., Solmon, F., Gassó, S., Chuang, P. Y., Gaiero, D. M., Yantosca, R. M., Wu, S., Wang, Y., and Carouge, C.: Modeling dust and soluble iron deposition to the South Atlantic Ocean, J. Geophys. Res.-Atmos., 115, D15202, https://doi.org/10.1029/2009JD013311, 2010.
Kadko, D. and Prospero, J.: Deposition of 7Be to Bermuda and the regional ocean: environmental factors affecting estimates of atmospheric flux to the ocean, J. Geophys. Res.-Oceans, 116, C02013, https://doi.org/10.1029/2010JC006629, 2011.
Kadko, D., Landing, W. M., and Shelley, R. U.: A novel tracer technique to quantify the atmospheric flux of trace elements to remote ocean regions, J. Geophys. Res.-Oceans, 120, 848–858, 2015.
Kara, A. B., Rochford, P. A., and Hurlburt, H. E.: Mixed layer depth variability over the global ocean, J. Geophys. Res.-Oceans, 108, 3079, https://doi.org/10.1029/2000JC000736, 2003.
Keene, W. C., Pszenny, A. A., Maben, J. R., and Sander, R. J. G. R. L.: Variation of marine aerosol acidity with particle size, Geophys. Res. Lett., 29, 5-1–5-4, 2002.
Kim, G. and Church, T. M.: Wet deposition of trace elements and radon daughter systematics in the South and equatorial Atlantic atmosphere, Global Biogeochem. Cy., 16, 1046, https://doi.org/10.1029/2001GB001407, 2002.
Kohfeld, K. E. and Harrison, S. P.: DIRTMAP: the geological record of dust, Earth-Sci. Rev., 54, 81–114, 2001.
Kuss, J., Waniek, J., Kremling, K., and Schulz-Bull, D. E.: Seasonality of particle-associated trace element fluxes in the deep northeast Atlantic Ocean, Deep Sea Res. Pt. I, 57, 785–796, 2010.
Liu, Z., Ostrenga, D., Teng, W., and Kempler, S.: Tropical Rainfall Measuring Mission (TRMM) precipitation data and services for research and applications, B. Am. Meteorol. Soc., 93, 1317–1325, 2012.
Longhurst, A. R.: Ecological geography of the sea, Academic Press, Elsevier, 560 pp., 2010.
Losno, R., Colin, J., Le Bris, N., Bergametti, G., Jickells, T., and Lim, B.: Aluminium solubility in rainwater and molten snow, J. Atmos. Chem., 17, 29–43, 1993.
Mahowald, N., Ward, D. S., Kloster, S., Flanner, M. G., Heald, C. L., Heavens, N. G., Hess, P. G., Lamarque, J.-F., and Chuang, P. Y.: Aerosol impacts on climate and biogeochemistry, Annu. Rev. Env. Resour., 36, 45–74, 2011.
Mahowald, N., Albani, S., Kok, J. F., Engelstaeder, S., Scanza, R., Ward, D. S., and Flanner, M. G.: The size distribution of desert dust aerosols and its impact on the Earth system, Aeolian Res., 15, 53–71, 2014.
Mahowald, N. M., Baker, A. R., Bergametti, G., Brooks, N., Duce, R. A., Jickells, T. D., Kubilay, N., Prospero, J. M., and Tegen, I.: Atmospheric global dust cycle and iron inputs to the ocean, Global Biogeochem. Cy., 19, GB4025, https://doi.org/10.1029/2004GB002402, 2005.
Mahowald, N. M., Engelstaedter, S., Luo, C., Sealy, A., Artaxo, P., Benitez-Nelson, C., Bonnet, S., Chen, Y., Chuang, P. Y., and Cohen, D. D.: Atmospheric iron deposition: global distribution, variability, and human perturbations, Annu. Rev. Mar. Sci., 1, 245–278, 2008.
Maring, H., Savoie, D., Izaguirre, M., Custals, L., and Reid, J.: Mineral dust aerosol size distribution change during atmospheric transport, J. Geophys. Res.-Atmos., 108, 8592, https://doi.org/10.1029/2002JD002536, 2003.
Maring, H. B. and Duce, R. A.: The impact of atmospheric aerosols on trace metal chemistry in open ocean surface seawater, 1. Aluminum, Earth Planet. Sc. Lett., 84, 381–392, 1987.
Martin, J. H., Gordon, M., and Fitzwater, S. E.: The case for iron, Limnol. Oceanogr., 36, 1793–1802, 1991.
Measures, C.: The distribution of Al in the IOC stations of the eastern Atlantic between 30∘ S and 34∘ N, Mar. Chem., 49, 267–281, 1995.
Measures, C. and Vink, S.: On the use of dissolved aluminum in surface waters to estimate dust deposition to the ocean, Global Biogeochem. Cy., 14, 317–327, 2000.
Measures, C., Landing, W., Brown, M., and Buck, C.: High-resolution Al and Fe data from the Atlantic Ocean CLIVAR-CO2 Repeat Hydrography A16N transect: Extensive linkages between atmospheric dust and upper ocean geochemistry, Global Biogeochem. Cy., 2, GB1005, https://doi.org/10.1029/2007GB003042, 2008.
Measures, C., Sato, T., Vink, S., Howell, S., and Li, Y.: The fractional solubility of aluminium from mineral aerosols collected in Hawaii and implications for atmospheric deposition of biogeochemically important trace elements, Mar. Chem., 120, 144–153, 2010.
Measures, C., Hatta, M., Fitzsimmons, J., and Morton, P.: Dissolved Al in the zonal N Atlantic section of the US GEOTRACES 2010/2011 cruises and the importance of hydrothermal inputs, Deep-Sea Res. Pt. II, 116, 176–186, 2015.
Measures, C. I. and Brown, E. T.: Estimating Dust Input to the Atlantic Ocean Using Surface Water Aluminium Concentrations, in: The Impact of Desert Dust Across the Mediterranean, edited by: Guerzoni, S. and Chester, R., 301–311, Springer Netherlands, Dordrecht, 1996.
Menzel Barraqueta, J.-L., Schlosser, C., Planquette, H., Gourain, A., Cheize, M., Boutorh, J., Shelley, R., Contreira Pereira, L., Gledhill, M., Hopwood, M. J., Lacan, F., Lherminier, P., Sarthou, G., and Achterberg, E. P.: Aluminium in the North Atlantic Ocean and the Labrador Sea (GEOTRACES GA01 section): roles of continental inputs and biogenic particle removal, Biogeosciences, 15, 5271–5286, https://doi.org/10.5194/bg-15-5271-2018, 2018.
Middag, R., van Slooten, C., de Baar, H. J. W., and Laan, P.: Dissolved aluminium in the Southern Ocean, Deep-Sea Res. Pt. II, 58, 2647–2660, 2011.
Monterey, G. I. and Levitus, S.: Seasonal variability of mixed layer depth for the world ocean: US Department of Commerce, National Oceanic and Atmospheric Administration, National Environmental Satellite, Data, and Information Service, NOAA Atlas NESDIS 14, 100 pp., U.S. Gov. Print. Off., Washington, D. C., 1997.
Moore, C. M., Mills, M. M., Achterberg, E. P., Geider, R. J., LaRoche, J., Lucas, M. I., McDonagh, E. I., Pan, X., Poulton, A. J., and Rijkenberg, M. J.: Large-scale distribution of Atlantic nitrogen fixation controlled by iron availability, Nat. Geosci., 2, 867–871, 2009.
Moore, J. K., Doney, S. C., and Lindsay, K.: Upper ocean ecosystem dynamics and iron cycling in a global three-dimensional model, Global Biogeochem. Cy., 18, GB4028, https://doi.org/10.1029/2004GB002220, 2004.
Orians, K. J. and Bruland, K. W.: The biogeochemistry of aluminum in the Pacific Ocean, Earth Planet. Sc. Lett., 78, 397–410, 1986.
Ott, S., Ott, A., Martin, D., and Young, J.: Analysis of a trans-Atlantic Saharan dust outbreak based on satellite and GATE data, Mon. Weather Rev., 119, 1832–1850, 1991.
Patey, M. D., Achterberg, E. P., Rijkenberg, M. J., and Pearce, R.: Aerosol time-series measurements over the tropical Northeast Atlantic Ocean: Dust sources, elemental composition and mineralogy, Mar. Chem., 174, 103–119, 2015.
Pohl, C., Croot, P. L., Hennings, U., Daberkow, T., Budeus, G., and Loeff, M. R. v. d.: Synoptic transects on the distribution of trace elements (Hg, Pb, Cd, Cu, Ni, Zn, Co, Mn, Fe, and Al) in surface waters of the Northern- and Southern East Atlantic, J. Marine Syst., 84, 28–41, 2011.
Powell, C., Baker, A., Jickells, T., Bange, H. W., Chance, R., and Yodle, C.: Estimation of the atmospheric flux of nutrients and trace metals to the eastern tropical North Atlantic Ocean, J. Atmos. Sci., 72, 4029–4045, 2015.
Prospero, J.: Saharan dust transport over the North Atlantic Ocean and Mediterranean: an overview, in: The Impact of Desert Dust Across the Mediterranean, 133–151, Springer, Dordrecht, 1996a.
Prospero, J. M.: The atmospheric transport of particles to the ocean. Scope-scientific committee on problems of the environment international council of Scientific unions, 57, Particle Flux in the Ocean, Wiley, New York, 19–52, 1996b.
Prospero, J. M. and Carlson, T. N.: Vertical and areal distribution of Saharan dust over the western equatorial North Atlantic Ocean, J. Geophys. Res., 77, 5255–5265, 1972.
Prospero, J. M., Nees, R. T., and Uematsu, M.: Deposition rate of particulate and dissolved aluminum derived from Saharan dust in precipitation at Miami, Florida, J. Geophys. Res.-Atmos., 92, 14723–14731, 1987.
Prospero, J. M., Ginoux, P., Torres, O., Nicholson, S. E., and Gill, T. E.: Environmental characterization of global sources of atmospheric soil dust derived from the nimbus7 toms absorbing aerosol product, Rev. Geophys., 40, 1–2, 2002.
Prospero, J. M., Landing, W. M., and Schulz, M.: African dust deposition to Florida: Temporal and spatial variability and comparisons to models, J. Geophys. Res.-Atmos., 115, D13304, https://doi.org/10.1029/2009JD012773, 2010.
Resing, J. A. and Measures, C. I.: Fluorometric Determination of Al in Seawater by Flow Injection Analysis with In-Line Preconcentration, Anal. Chem., 66, 4105–4111, 1994.
Risien, C. M. and Chelton, D. B.: A global climatology of surface wind and wind stress fields from eight years of QuikSCAT scatterometer data, J. Phys. Oceanogr., 38, 2379–2413, 2008.
Sarthou, G., Baker, A. R., Blain, S., Achterberg, E. P., Boye, M., Bowie, A. R., Croot, P., Laan, P., de Baar, H. J. W., Jickells, T. D., and Worsfold, P. J.: Atmospheric iron deposition and sea-surface dissolved iron concentrations in the eastern Atlantic Ocean, Deep Sea Res. Pt. I, 50, 1339–1352, 2003.
Sarthou, G., Lherminier, P., Achterberg, E. P., Alonso-Pérez, F., Bucciarelli, E., Boutorh, J., Bouvier, V., Boyle, E. A., Branellec, P., Carracedo, L. I., Casacuberta, N., Castrillejo, M., Cheize, M., Contreira Pereira, L., Cossa, D., Daniault, N., De Saint-Léger, E., Dehairs, F., Deng, F., Desprez de Gésincourt, F., Devesa, J., Foliot, L., Fonseca-Batista, D., Gallinari, M., García-Ibáñez, M. I., Gourain, A., Grossteffan, E., Hamon, M., Heimbürger, L. E., Henderson, G. M., Jeandel, C., Kermabon, C., Lacan, F., Le Bot, P., Le Goff, M., Le Roy, E., Lefèbvre, A., Leizour, S., Lemaitre, N., Masqué, P., Ménage, O., Menzel Barraqueta, J.-L., Mercier, H., Perault, F., Pérez, F. F., Planquette, H. F., Planchon, F., Roukaerts, A., Sanial, V., Sauzède, R., Schmechtig, C., Shelley, R. U., Stewart, G., Sutton, J. N., Tang, Y., Tisnérat-Laborde, N., Tonnard, M., Tréguer, P., van Beek, P., Zurbrick, C. M., and Zunino, P.: Introduction to the French GEOTRACES North Atlantic Transect (GA01): GEOVIDE cruise, Biogeosciences, 15, 7097–7109, https://doi.org/10.5194/bg-15-7097-2018, 2018.
Schanze, J. J., Schmitt, R. W., and Yu, L.: The global oceanic freshwater cycle: A state-of-the- art quantification, J. Mar. Res., 68, 569–595, 2010.
Schlitzer, R., Anderson, R. F., Dodas, E. M., Lohan, M., Geibert, W., Tagliabue, A., Bowie, A., Jeandel, C., Maldonado, M. T., Landing, W. M., Cockwell, D., Abadie, C., Abouchami, W., Achterberg, E. P., Agather, A., Aguliar-Islas, A., van Aken, H. M., Andersen, M., Archer, C., Auro, M., de Baar, H. J., Baars, O., Baker, A. R., Bakker, K., Basak, C., Baskaran, M., Bates, N. R., Bauch, D., van Beek, P., Behrens, M. K., Black, E., Bluhm, K., Bopp, L., Bouman, H., Bowman, K., Bown, J., Boyd, P., Boye, M., Boyle, E. A., Branellec, P., Bridgestock, L., Brissebrat, G., Browning, T., Bruland, K. W., Brumsack, H.-J., Brzezinski, M., Buck, C. S., Buck, K. N., Buesseler, K., Bull, A., Butler, E., Cai, P., Mor, P. C., Cardinal, D., Carlson, C., Carrasco, G., Casacuberta, N., Casciotti, K. L., Castrillejo, M., Chamizo, E., Chance, R., Charette, M. A., Chaves, J. E., Cheng, H., Chever, F., Christl, M., Church, T. M., Closset, I., Colman, A., Conway, T. M., Cossa, D., Croot, P., Cullen, J. T., Cutter, G. A., Daniels, C., Dehairs, F., Deng, F., Dieu, H. T., Duggan, B., Dulaquais, G., Dumousseaud, C., Echegoyen-Sanz, Y., Edwards, R. L., Ellwood, M., Fahrbach, E., Fitzsimmons, J. N., Russell Flegal, A., Fleisher, M. Q., van de Flierdt, T., Frank, M., Friedrich, J., Fripiat, F., Fröllje, H., Galer, S. J. G., Gamo, T., Ganeshram, R. S., Garcia-Orellana, J., Garcia-Solsona, E., Gault-Ringold, M., George, E., Gerringa, L. J. A., Gilbert, M., Godoy, J. M., Goldstein, S. L., Gonzalez, S. R., Grissom, K., Hammerschmidt, C., Hartman, A., Hassler, C. S., Hathorne, E. C., Hatta, M., Hawco, N., Hayes, C. T., Heimbürger, L.-E., Helgoe, J., Heller, M., Henderson, G. M., Henderson, P. B., van Heuven, S., Ho, P., Horner, T. J., Hsieh, Y.-T., Huang, K.-F., Humphreys, M. P., Isshiki, K., Jacquot, J. E., Janssen, D. J., Jenkins, W. J., John, S., Jones, E. M., Jones, J. L., Kadko, D. C., Kayser, R., Kenna, T. C., Khondoker, R., Kim, T., Kipp, L., Klar, J. K., Klunder, M., Kretschmer, S., Kumamoto, Y., Laan, P., Labatut, M., Lacan, F., Lam, P. J., Lambelet, M., Lamborg, C. H., Le Moigne, F. A. C., Le Roy, E., Lechtenfeld, O. J., Lee, J.-M., Lherminier, P., Little, S., López-Lora, M., Lu, Y., Masque, P., Mawji, E., McClain, C. R., Measures, C., Mehic, S., Menzel Barraqueta, J.-L., van der Merwe, P., Middag, R., Mieruch, S., Milne, A., Minami, T., Moffett, J. W., Moncoiffe, G., Moore, W. S., Morris, P. J., Morton, P. L., Nakaguchi, Y., Nakayama, N., Niedermiller, J., Nishioka, J., Nishiuchi, A., Noble, A., Obata, H., Ober, S., Ohnemus, D. C., van Ooijen, J., O'Sullivan, J., Owens, S., Pahnke, K., Paul, M., Pavia, F., Pena, L. D., Peters, B., Planchon, F., Planquette, H., Pradoux, C., Puigcorbé, V., Quay, P., Queroue, F., Radic, A., Rauschenberg, S., Rehkámper, M., Rember, R., Remenyi, T., Resing, J. A., Rickli, J., Rigaud, S., Rijkenberg, M. J. A., Rintoul, S., Robinson, L. F., Roca-Martí, M., Rodellas, V., Roeske, T., Rolison, J. M., Rosenberg, M., Roshan, S., Rutgers van der Loeff, M. M., Ryabenko, E., Saito, M. A., Salt, L., A., Sanial, V., Sarthou, G., Schallenberg, C., Schauer, U., Scher, H., Schlosser, C., Schnetger, B., Scott, P., Sedwick, P. N., Semiletov, I., Shelley, R., Sherrell, R. M., Shiller, A. M., Sigman, D. M., Singh, S. K., Slagter, H. A., Slater, E., Smethie, W. M., Snaith, H., Sohrin, Y., Sohst, B., Sonke, J. E., Speich, S., Steinfeldt, R., Stewart, G., Stichel, T., Stirling, C. H., Stutsman, J., Swarr, G. J., Swift, J. H., Thomas, A., Thorne, K., Till, C. P., Till, R., Townsend, A. T., Townsend, E., Tuerena, R., Twining, B. S., Vance, D., Velazquez, S., Venchiarutti, C., Villa-Alfageme, M., Vivancos, S. M., Voelker, A. H. L., Wake, B., Warner, M. J., Watson, R., van Weerlee, E., Alexandra Weigand, M., Weinstein, Y., Weiss, D., Wisotzki, A., Woodward, E. M. S., Wu, J., Wu, Y., Wuttig, K., Wyatt, N., Xiang, Y., Xie, R. C., Xue, Z., Yoshikawa, H., Zhang, J., Zhang, P., Zhao, Y., Zheng, L., Zheng, X.-Y., Zieringer, M., Zimmer, L. A., Ziveri, P., Zunino, P., and Zurbrick, C.: The GEOTRACES Intermediate Data Product 2017, Chem. Geol., 493, 210–223, 2018.
Schlosser, C., Klar, J. K., Wake, B. D., Snow, J. T., Honey, D. J., Woodward, E. M. S., Lohan, M. C., Achterberg, E. P., and Moore, C. M.: Seasonal ITCZ migration dynamically controls the location of the (sub)tropical Atlantic biogeochemical divide, P. Natl. Acad. Sci. USA, 111, 1438–1442, 2014.
Schüßler, U., Balzer, W., and Deeken, A.: Dissolved Al distribution, particulate Al fluxes and coupling to atmospheric Al and dust deposition in the Arabian Sea, Deep-Sea Res. Pt. II, 52, 1862–1878, 2005.
Sedwick, P. N., Sholkovitz, E. R., and Church, T. M.: Impact of anthropogenic combustion emissions on the fractional solubility of aerosol iron: Evidence from the Sargasso Sea, Geochem. Geophy. Geosy., 8, Q10Q06, https://doi.org/10.1029/2007GC001586, 2007.
Shelley, R. U., Roca-Martí, M., Castrillejo, M., Masqué, P., Landing, W. M., Planquette, H., and Sarthou, G.: Quantification of trace element atmospheric deposition fluxes to the Atlantic Ocean (>40∘ N; GEOVIDE, GEOTRACES GA01) during spring 2014, Deep-Sea Res. Pt. I, 119, 34–49, 2017.
Shelley, R. U., Landing, W. M., Ussher, S. J., Planquette, H., and Sarthou, G.: Regional trends in the fractional solubility of Fe and other metals from North Atlantic aerosols (GEOTRACES cruises GA01 and GA03) following a two-stage leach, Biogeosciences, 15, 2271–2288, https://doi.org/10.5194/bg-15-2271-2018, 2018.
Sholkovitz, E. R., Sedwick, P. N., Church, T. M., Baker, A. R., and Powell, C. F.: Fractional solubility of aerosol iron: Synthesis of a global-scale data set, Geochim. Cosmochim. Ac., 89, 173–189, 2012.
Slinn, S. and Slinn, W.: Predictions for particle deposition on natural waters, Atmos. Environ. (1967), 14, 1013–1016, 1980.
van Bennekom, A. J. and Jager, J. E.: Dissolved aluminium in the Zaire river plume, Neth. J. Sea Res., 12, 358–367, 1978.
Van Der Loeff, M. R., Helmers, E., and Kattner, G.: Continuous transects of cadmium, copper, and aluminium in surface waters of the Atlantic Ocean, 50∘ N to 50∘ S: correspondence and contrast with nutrient-like behaviour, Geochim. Cosmochim. Ac., 61, 47–61, 1997.
van Hulten, M. M. P., Sterl, A., Tagliabue, A., Dutay, J. C., Gehlen, M., de Baar, H. J. W., and Middag, R.: Aluminium in an ocean general circulation model compared with the West Atlantic Geotraces cruises, J. Mar. Syst., 126, 3–23, 2013.
Vink, S. and Measures, C. I.: The role of dust deposition in determining surface water distributions of Al and Fe in the South West Atlantic, Deep-Sea Res. Pt. II, 48, 2787–2809, 2001.
Wagener, T., Guieu, C., Losno, R., Bonnet, S., and Mahowald, N.: Revisiting atmospheric dust export to the Southern Hemisphere ocean: Biogeochemical implications, Global Biogeochem. Cy., 22, GB2006, https://doi.org/10.1029/2007GB002984, 2008.
Webster, P. J.: The role of hydrological processes in ocean-atmosphere interactions, Rev. Geophys., 32, 427–476, 1994.
Yoo, J.-M. and Carton, J. A.: Annual and interannual variation of the freshwater budget in the tropical Atlantic Ocean and the Caribbean Sea, J. Phys. Oceanogr., 20, 831–845, 1990.
Yu, L. and Weller, R. A.: Objectively analyzed air-sea heat fluxes for the global ice-free oceans (1981–2005), B. Am. Meteorol. Soc., 88, 527–539, 2007.
Zender, C. S., Bian, H., and Newman, D.: Mineral Dust Entrainment and Deposition (DEAD) model: Description and 1990s dust climatology, J. Geophys. Res.-Atmos., 108, 4416, https://doi.org/10.1029/2002JD002775, 2003.
Zhang, Y., Mahowald, N., Scanza, R. A., Journet, E., Desboeufs, K., Albani, S., Kok, J. F., Zhuang, G., Chen, Y., Cohen, D. D., Paytan, A., Patey, M. D., Achterberg, E. P., Engelbrecht, J. P., and Fomba, K. W.: Modeling the global emission, transport and deposition of trace elements associated with mineral dust, Biogeosciences, 12, 5771–5792, https://doi.org/10.5194/bg-12-5771-2015, 2015.