the Creative Commons Attribution 4.0 License.
the Creative Commons Attribution 4.0 License.
 | 20 Sep 2018
Silicon cycle in the tropical South Pacific: contribution to the global Si cycle and evidence for an active pico-sized siliceous plankton
Karine Leblanc
Véronique Cornet
Peggy Rimmelin-Maury
Olivier Grosso
Sandra Hélias-Nunige
Camille Brunet
Hervé Claustre
Joséphine Ras
Nathalie Leblond
Bernard Quéguiner
This article presents data regarding the Si biogeochemical cycle during two oceanographic cruises conducted in the tropical South Pacific (BIOSOPE and OUTPACE cruises) in 2005 and 2015. It involves the first Si stock measurements in this understudied region, encompassing various oceanic systems from New Caledonia to the Chilean upwelling between 8 and 34∘ S. Some of the lowest levels of biogenic silica standing stocks ever measured were found in this area, notably in the southern Pacific gyre, where Chlorophyll a concentrations are the most depleted worldwide. Integrated biogenic silica stocks are as low as 1.08±0.95 mmol m−2 and are the lowest stocks measured in the South Pacific. Size-fractionated biogenic silica concentrations revealed a non-negligible contribution of the pico-sized fraction (<2–3 µm) to biogenic silica standing stocks, representing 26%±12% of total biogenic silica during the OUTPACE cruise and 11%±9% during the BIOSOPE cruise. These results indicate significant accumulation in this size class, which was undocumented for 2005, but has since then been related to Si uptake by Synechococcus cells. Si uptake measurements carried out during BIOSOPE confirmed biological Si uptake by this size fraction. We further present diatoms community structure associated with the stock measurements for a global overview of the Si cycle in the tropical South Pacific.


Siliceous phytoplankton, especially diatoms, are often associated with nutrient-rich eutrophic ecosystems. However, the global budget of biogenic silica production by Nelson et al. (1995) already pointed out the importance of these organisms in oligotrophic areas where, despite their low concentration and due to the geographical extension of these systems, their silica production would be comparable to that of areas overlying major diatomaceous sediment accumulation zones. However, studies that have documented the Si cycle in the Pacific Ocean, the largest oligotrophic area of the World Ocean, mainly focused on the equatorial region, and the northern subtropical gyre. This article presents the first set of field results from the South Pacific Ocean between 8 and 34∘ S, spanning from New Caledonia over to the Chilean upwelling, and notably, from the most Chlorophyll a-depleted region at a worldwide scale (Ras et al., 2008): the South Pacific gyre (SPG).
Diatoms are known to contribute more importantly to primary production in meso- to eutrophic systems, yet several studies have emphasized that even if they are not dominant in oligotrophic regions, they may still contribute up to 10 %–20 % of C primary production in the equatorial Pacific (Blain et al., 1997). In the oligotrophic Sargasso Sea (BATS station), their contribution was estimated to be as high as 26 %–48 % of new annual primary production (Brzezinski and Nelson, 1995) and to represent up to 30 % of particulate organic carbon (POC) export, leading to an upward revision of the contribution of oligotrophic gyres to global Si budgets (Nelson and Brzezinski, 1997). Similar studies carried out in the North Pacific (HOT station) led to new estimates, as diatoms were found to be less important contributors to primary production. A combination of both Atlantic and North Pacific oligotrophic gyre budgets led to a revised contribution of 13 Tmol Si yr−1, a 51 % diminution of the previous estimate (Brzezinski et al., 2011).
In the eastern equatorial Pacific (EEP), it has been shown that diatoms experience chronic Si limitation along the eastern equatorial divergence in the so-called high-nutrient low-silicate low-chlorophyll (HNLSiLC) system (Dugdale and Wilkerson, 1998) as well as Si–Fe colimitation (Blain et al., 1997; Leynaert et al., 2001). Furthermore, oligotrophic regions are known to experience considerable variability in nutrient injections, leading to episodical blooms depending on the occurrence of internal waves (Wilson, 2011), meso-scale eddies (Krause et al., 2010), storms (Krause et al., 2009), or local upwellings or dust deposition events (Calil et al., 2011; Wilson, 2011). In nitrogen-depleted areas, punctual diatom blooms in the form of diatom–diazotroph associations (DDAs) are also known to occur and to contribute both to new primary production (Brzezinski et al., 2011; Dore et al., 2008) and to non-diazotrophic diatoms through secondary N release (Bonnet et al., 2016; Leblanc et al., 2016).
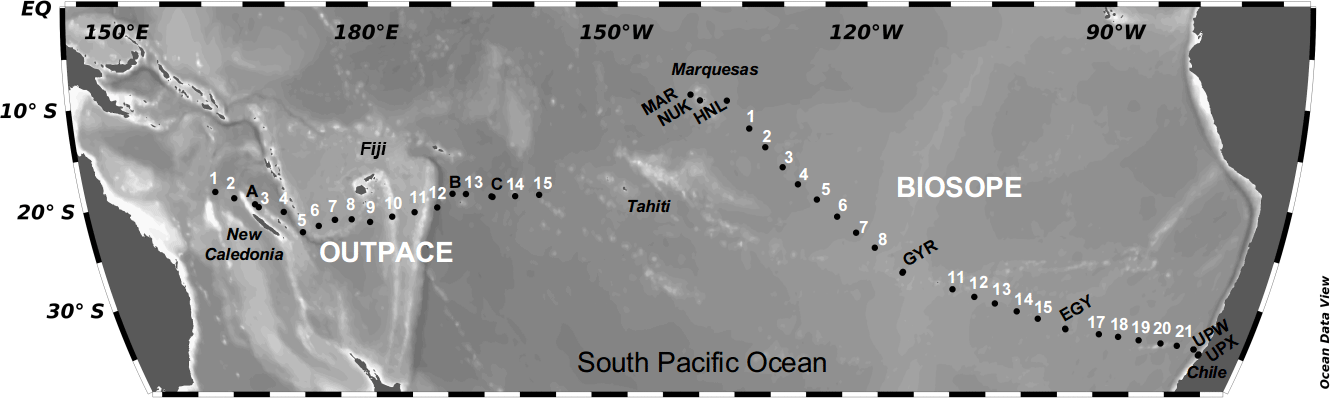
Figure 1Bathymetric map of the stations sampled in the South Pacific Ocean during the OUTPACE cruise (February–April 2015) and the BIOSOPE cruise (October–November 2004). Short-duration stations are indicated in white, and long-duration stations (typically 2–3 days) in black.
While biogenic silica was classically associated with the largest size fractions, especially microplankton, a series of recent studies provide evidence for a role for picophytoplankton such as Synechococcus in the Si cycle, showing that this ubiquitous lineage is able to take up and accumulate Si (Brzezinski et al., 2017; Krause et al., 2017; Ohnemus et al., 2016). This was evidenced in the field in the equatorial Pacific, the Sargasso Sea, and in culture work, suggesting a widespread diffuse role for this organism, which could be more prominent in oligotrophic environments where diatoms are in low abundance. In the EEP, and despite very variable cellular Si content, Synechococcus represented for instance 40 % of water column biogenic silica (BSi) inventory compared to diatoms in 2004, and twice that of diatoms the following year (Baines et al., 2012). The role of small nano-sized diatoms has also probably been overlooked and we recently pointed out their general occurrence at the worldwide scale and their occasional regional importance in diatom blooms (Leblanc et al., 2018).
Here we present the first set of field results from the South Pacific Ocean between 8 and 34∘ S, spanning from New Caledonia over to the Chilean upwelling and, notably, from the most depleted Chl a region worldwide (Ras et al., 2008), the SPG. Results were obtained from two cruises carried out a decade apart following longitudinal sections first in the southeastern Pacific (SEP) between the Marquesas Islands and the Chilean upwelling, crossing the South Pacific gyre (BIOSOPE cruise, October–December 2004), and then in the southwestern Pacific (SWP) between New Caledonia and Tahiti (OUTPACE cruise, February–April 2015). Very similar sampling strategies and analyses were conducted regarding the Si cycle and provide new data in this under-sampled region. We detail size-fractionated BSi inventories in the water column, Si export fluxes, associated diatom community structure composition and Si uptake and kinetic rates in the South Pacific. Our key results show some of the lowest BSi stocks ever measured, which may warrant for a new revision of the contribution of oligotrophic areas to the global Si cycle, and confirm recent findings of an active biological uptake of Si in the pico-sized fraction.
2.1 Sampling strategy
Results presented here encompass data from two French oceanographic cruises located in the South Pacific Ocean (from 10 to 30∘ S), covering two transects that employed a common sampling strategy of short- and long-duration stations. The BIOSOPE (BIogeochemistry and Optics SOuth Pacific Experiment) cruise was undertaken in 2004, while the OUTPACE cruise took place in 2015, both aboard the R/V L'Atalante. The BIOSOPE transect was sampled between the Marquesas Islands (141∘ W, 8∘ S) and Concepción (Chile) (72∘ W, 35∘ S), between 24 October 12 and November 2004. The OUTPACE transect was sampled between New Caledonia (159∘ W, 22∘ S) and Tahiti (160∘ W, 20∘ S) between 18 February and 3 April 2015 (Fig. 1).
2.2 Hydrology
Water sampling and measurements of temperature and salinity were performed using a SeaBird SBE 911plus CTD/Carousel system fitted with an in situ fluorometer and 24 Niskin bottles. More details about the BIOSOPE cruise strategy are given in the Biogeosciences special issue introductory article by Claustre et al. (2008) while the OUTPACE cruise strategy is detailed in Moutin et al. (2017). Euphotic layer depths (Ze) were calculated as described in Raimbault et al. (2008) and Moutin et al. (2017). Sampling depths were adjusted to on-deck incubator screen attenuation using measurements from an in situ PAR (photosynthetically active radiation) sensor (LI-COR instrument) mounted on the CTD (conductivity–temperature–depth) frame.
2.2.1 Inorganic nutrients
Nutrients were collected in 20 mL PE vials and analyzed directly on-board on a SEAL Analytical auto-analyzer following Aminot and Kérouel (2007) during BIOSOPE and at the laboratory during OUTPACE from frozen (0 ∘C) samples. During BIOSOPE, the nitrate () detection limit was 0.05 µM (accuracy of ±0.05 µM), phosphate () detection limit was 0.02 µM (accuracy of ±0.05 µM), and orthosilicic acid (Si(OH)4) detection limit was 0.05 µM (accuracy of ±0.05 µM). During OUTPACE the quantification limit was 0.05 µM for all nutrients.
2.2.2 Particulate organic carbon (POC)
Seawater samples (∼2 L) were filtered through precombusted (for 4 h at 450 ∘C) 25 mm GF/F filters, dried at 60 ∘C and stored in 1.5 mL Eppendorf PE tubes. POC was analyzed on a CHN elemental analyzer (combustion temperature at 925 ∘C) (Perkin Elmer, 2400 series).
2.2.3 Total Chlorophyll a (TChl a)
For pigment analyses, 2 L of seawater were filtered through 25 mm GF/F filters and stored in liquid nitrogen at −80 ∘C until processing. Extraction was carried out in 3 mL 100 % methanol, followed by sonication and clarification by filtration on a new GF/F filter. Extracted pigments (Chl a and fucoxanthin) were then analyzed by HPLC (high-performance liquid chromatography) according to the procedure detailed in Ras et al. (2008).
2.2.4 Particulate biogenic and lithogenic silica (BSi and LSi)
Samples were collected for silicon stocks as particulate biogenic and lithogenic silica (BSi and LSi) and dissolved orthosilicic acid (Si(OH)4) similarly on both cruises. For BSi and LSi, between 1.5 and 2.5 L Niskin samples were filtered through stacked polycarbonate 47 mm filters. During BIOSOPE, whole samples were filtered through three stacked filters of 0.2, 2, and 10 µm. During OUTPACE, the size fractionation used was 0.4 and 3 µm respectively. Filters were rinsed with 0.2 µm filtered seawater, folded in quarters and placed in plastic Petri dishes and dried overnight at 60 ∘C. Filters were then stored at room temperature and analyzed in the laboratory. BSi and LSi were measured using Paasche (1973) as modified by Nelson et al. (1989): BSi and LSi were extracted on the same filter after successive basic and acid treatments. BSi was extracted during a hot sodium hydroxide (NaOH 0.2 N) digestion (60 min), which converted BSi into the dissolved orthosilicic acid form. Si(OH)4 was then quantified using the Strickland and Parsons (1972) spectrophotometric method. After the first basic digestion, filters were rinsed free of remaining Si(OH)4 and dried again at 60 ∘C. LSi, preserved in the sample, was then treated with hydrofluoric acid (HF 2.9 N) for 48 h. Samples were then diluted in saturated boric acid (H3BO3). In the same way, LSi was measured through quantification of the dissolved Si(OH)4 form. The detection limit was 1 nmol L−1 for both BSi and LSi and quantification limits were 5 and 6 nmol L−1 for BSi and LSi respectively. It has been demonstrated that for coastal samples, significant leaching of orthosilicic acid from LSi could occur during the first NaOH digestion (up to 15 %) (Ragueneau and Tréguer, 1994). This is particularly the case when high LSi concentrations are present. Kinetic assays of orthosilicic acid were conducted in some samples from the Marquesas Islands, gyre, eastern gyre and near-upwelling stations during BIOSOPE to determine the optimal extraction time for BSi digestion, and results revealed negligible LSi interferences after an extraction time of 60 min. Biogenic silica export fluxes were determined from drifting sediment traps deployed for 4 consecutive days at three depths (153, 328, 519 m) at the three long-duration (LD) stations of the OUTPACE cruise. For each trap sample, 160 mL was filtered onto 0.6 µm polycarbonate membranes and the filters were treated following a two-step digestion as described above. In addition to the BSi measurements, the dissolved Si measured directly in the supernatant of each trap at the time of subsampling minus the initial dissolved Si content in the seawater used to fill the trap was added to the final BSi concentrations, to account for BSi dissolution in the trap samples during storage. This step proved necessary, as BSi dissolution ranged between 16 % and 90 % depending on the samples.
2.3 Size-fractionated bulk Si and specific uptake rates (ρSi & VSi)
During BIOSOPE, dawn-to-dawn in situ Si uptake experiments were performed using an immersed production line, at six incubation depths (50 %, 25 %, 15 %, 8 %, 4 % and 1 % light level). Seawater (275 mL) samples were spiked with 632 Bq of radiolabeled 32Si-silicic acid solution (specific activity of 23.46 kBq mug-Si−1). For all samples, Si(OH)4 addition did not exceed 0.4 % of the initial concentration. After incubation, samples were filtered through stacked polycarbonate membranes (0.2, 2 and 10 µm, 47 mm). Filters were rinsed with filtered (0.2 µm) seawater, and placed in scintillation vials. The 32Si uptake was measured in a Packard 1600-TR scintillation counter by the Cerenkov effect, following the method described by Tréguer and Lindner (1991) and Leynaert (1993). Precision of the method averages 10 % to 30 % for the less productive station, estimated from repeated counts. Diatom doubling times k (in d−1) were calculated as follows :
2.4 Siliceous phytoplankton determinations
Seawater samples collected from the same CTDs and Niskins as particulate Si samples were preserved with acidified Lugol's solution and stored at 4 ∘C. For the BIOSOPE cruise, a 500 mL aliquot of the sample was concentrated by sedimentation in glass cylinders for 6 days. Diatoms were counted following the method described by Gómez et al. (2007). For the OUTPACE cruise, a 100 mL aliquot of the sample was concentrated in an Utermöhl sedimentation chamber for 48 h. Diatom sizes were measured for each species for an average number of 20 cells when possible, and converted to biovolume and C biomass following the method described in Leblanc et al. (2012). C biomass per species was then compared to chemically determined POC concentrations to yield a percentage contribution to C biomass.
2.5 Phytoplankton net samples
During the OUTPACE cruise, additional WP2 phyto-net hauls (mouth opening 0.26 m2; 35 µm mesh size) were undertaken at each site integrating the 0–150 m water column, except at stations LD-C, 14 and 15 where they integrated the 0–200 m water column due to the presence of a very deep “deep chlorophyll a maximum” (DCM). Samples were preserved in acidified lugol and observed in a Sedgewick-rafter chamber. A semiquantitative species list (dominant, common, rare) was established.

Figure 2Nutrient distribution (a orthosilicic acid, b nitrate, c phosphate, in µM) along the OUTPACE cruise transect, with potential density (in kg m−3) as white isoline overlay.
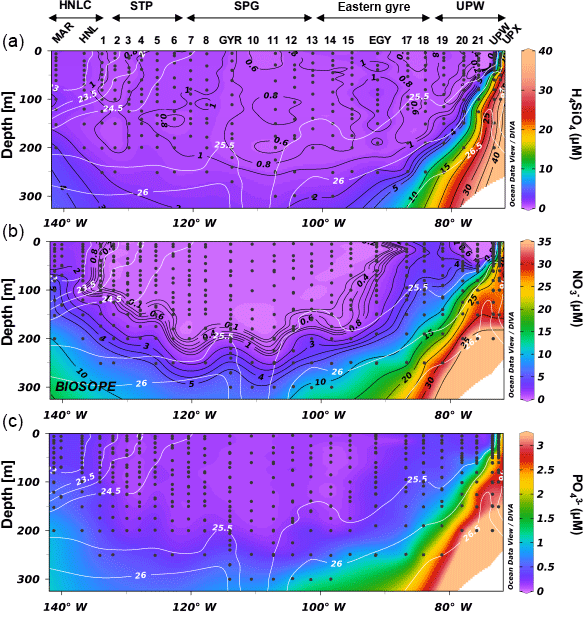
Figure 3Nutrient distribution (a orthosilicic acid, b nitrate, c phosphate, in µM) along the BIOSOPE cruise transect, with potential density (in kg m−3) as white isoline overlay.
3.1 Hydrological systems and nutrient availability
The hydrological structures crossed during the two transects have been carefully detailed in companion papers (Claustre et al., 2008; Fumenia et al., 2018; Moutin et al., 2017) and will not be presented in detail here. For the sake of clarity in the present article, the main hydrological systems are described as follows. During the BIOSOPE cruise, five main hydrological systems were defined from west to east:
-
the HNLC system, comprising long-duration stations MAR (Marquesas), HNL and station 1;
-
the tropical South Pacific (STP) system from stations 2 to 6;
-
the central part of the SPG from station 7 to 13, including the LD station GYR;
-
the eastern gyre HNLC area from stations 14 to 19, including LD station EGY (eastern gyre);
-
and the coastal Peru–Chile upwelling system from station 20 to 21, including LD stations UPW and UPX.
During OUTPACE, two main systems were encountered, from west to east: the MA (Melanesian Archipelago) from stations 1 to 12 and including LD stations A and B, and the SPG from stations 13 to 15 and including LD station C. During both cruises, eutrophic to ultra-oligotrophic conditions were encountered. During OUTPACE, Si(OH)4 concentrations were <1 µM at all stations in the surface layer, with values as low as 0.3–0.6 µM at 5 m depth at certain stations (Fig. 2). The 1 µM isoline was centered at ∼100 m in the western part of the MA and deepened to ∼200 m in the SPG. Concentrations at 300 m were quite low (<2 µM) over the entire transect. Nitrate concentrations were similarly depleted in the surface layer, with values <0.05–0.1 µM in the first 80 m in the western part of the MA (until station 6), which deepened to 100 m over the rest of the transect. Yet nitrate concentrations increased with depth more rapidly than orthosilicic acid, reaching concentrations close to 7 µM at 300 m depth. Phosphate was below detection limits in the western part of the MA (stations 1 to 11, and station B) over the first 50 m, but increased to values of between 0.1 and 0.2 µM in the SPG. Concentrations only increased to 0.6–0.7 µM at 300 m depth. During BIOSOPE, both the nitracline and phosphacline extended very deeply (∼200 m) in the regions of the STP, SPG and eastern gyre (Fig. 3). They surfaced at both ends of the transect in the upwelling system and near the Marquesas Islands, but contrary to nitrate, which was severely depleted, phosphate was never found <0.1 µM in the surface layer (except at the subsurface at site 14). Horizontal gradients were not as strong for orthosilicic acid, with general surface values of between 0.5 and 1 µM in the surface layer, except in the western part of the transect from station 1 to the GYR station, and in the upwelling system, where concentrations were >1 µM and up to 8.9 µM at the surface and increasing rapidly with depth.
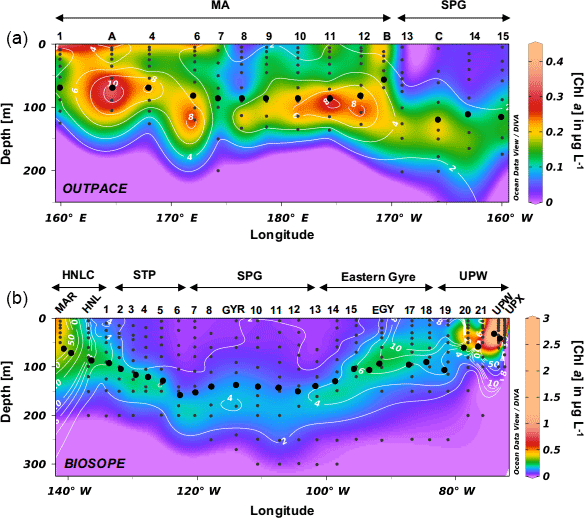
Figure 4(a) TChl a distribution during the OUTPACE cruise in the southwestern Pacific (in µg L−1) with fucoxanthin overlay lines in white (in ng L−1). (b) TChl a distribution during the BIOSOPE cruise in the southwestern Pacific (in µg L−1) with fucoxanthin overlay lines in white (in ng L−1). Black dots indicate the Ze depth.
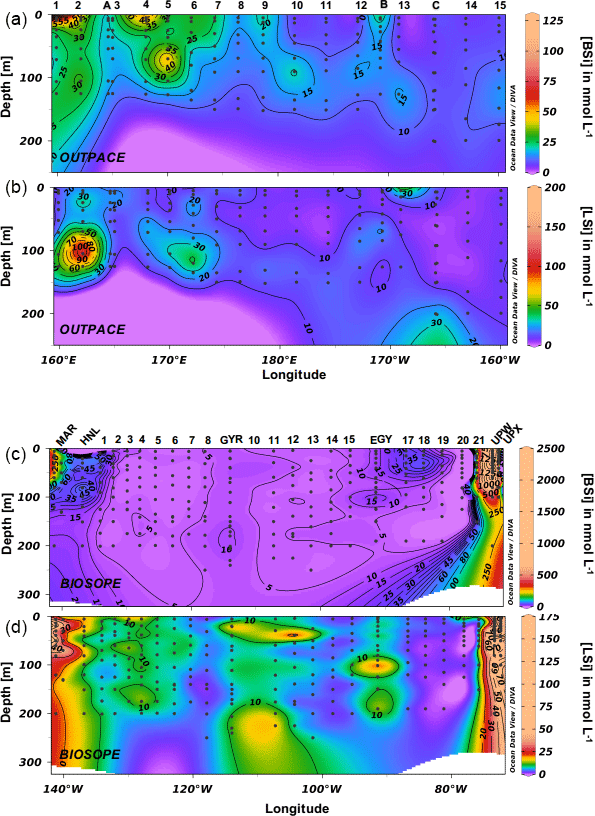
Figure 5(a, c) Biogenic silica (BSi) and (b, d) lithogenic silica (LSi) distribution during the OUTPACE and BIOSOPE cruises (in nmol L−1).
3.2 Total Chl a and fucoxanthin distribution
Total Chl a (TChl a) distributions are presented for both cruises along longitudinal transects together with fucoxanthin concentrations, a diagnostic pigment for diatoms (Fig. 4a, b). During OUTPACE, the Melanesian Archipelago system was clearly enriched in TChl a compared to the South Pacific gyre and showed non-negligible concentrations in surface layers as well as a pronounced DCM reaching up to 0.45 µg L−1 at station 11. The observed DCM progressively deepened eastwards, from 70 m depth at LD-A to 108 m at station 12. The DCM depth generally closely followed the euphotic layer depth (Ze) or was located just below it. The highest surface concentrations were found at stations 1 to 6, between New Caledonia and Vanuatu (0.17 to 0.34 µg L−1), while the SPG surface water stations showed a depletion in Chl a (0.02 to 0.04 µg L−1). A DCM existed in this region, but was observed to be deeper (125 to 150 m) and of lower magnitude (0.17 to 0.23 µg L−1) than in the MA region. Fucoxanthin concentrations closely followed the DCM, but were extremely low over the entire transect, with a maximum concentration of 17 ng L−1 in the MA and of 4 ng L−1 in the SPG. The Chl a distribution during BIOSOPE was similar to that observed during OUPACE, with extremely low surface concentrations and a very deep Chl a maximum located between 180 and 200 m and ranging between 0.15 and 0.18 µg L−1. On both sides of the central SPG, the DCM shoaled towards the surface at the MAR station at the western end of the transect (0.48 µg L−1 at 30 m) and at the UPW station at the eastern end of the transect (3.06 µg L−1 at 40 m). Fucoxanthin concentrations did not exceed 9 ng L−1 at any station between the STP and the eastern gyre (between LD-HNL and station 17), thus showing ranges similar to the OUTPACE cruise measurements. Fucoxanthin increased moderately at the MAR station (85 ng L−1), while it peaked in the Peru–Chile upwelling system, with concentrations reaching 1595 ng L−1 at LD-UPW but remaining much lower at the LD-UPX station (200 ng L−1).
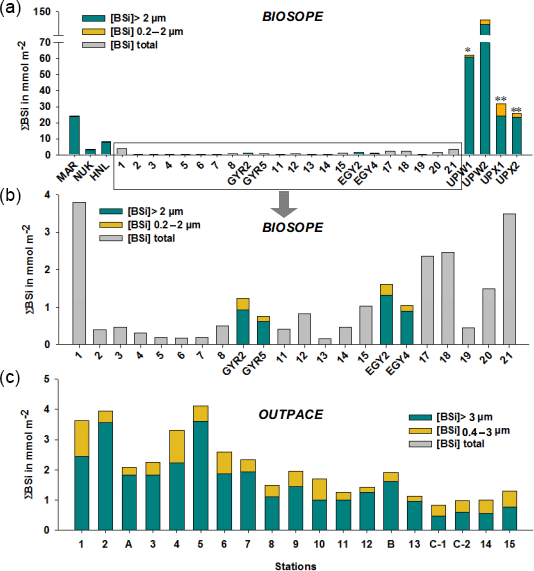
Figure 6(a–b) Size-fractionated integrated biogenic silica (ΣBSi) standing stocks (0–125 m) during the BIOSOPE cruise. UPW1 stations was only integrated over 50 m and UPX1 and UPX2 over 100 m. Panel (b) shows a zoom over the central section where integrated BSi stocks are an order of magnitude lower than at the two extremities of the transect. Gray bars indicate that no size fractionation was conducted and represent the total ΣBSi. (c) Size-fractionated integrated biogenic silica (ΣBSi) standing stocks (0–125 m) during the OUTPACE cruise.
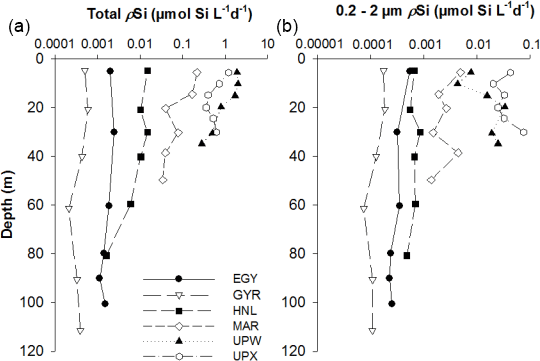
Figure 7(a) Total absolute Si uptake rates (ρSi) vertical profiles (in µmol L−1 d−1) at the LD stations MAR, HNL, GYR, EGY, UPX and UPW. (b) ρSi in the 0.2–2 µm size fraction at the same sites. The x axis is in log scale to better show low production profile.
3.3 Total and size-fractionated biogenic and lithogenic silica standing stocks
Total biogenic silica concentrations were extremely low during the OUTPACE cruise (Fig. 5a) and ranged between 2 and 121 nmol L−1 in the surface layers, with an average concentration of 17 nmol L−1 (median value 13 nmol L−1). Similarly to TChl a and fucoxanthin, the highest BSi levels were encountered over the MA, with peak values mostly found at the surface, at stations 1 and 2 and from stations 4 to 7, and with very moderate increases at depth (stations 5 and 10). The average BSi concentration decreased from 20 to 8 nmol L−1 from the MA to the SPG. In the SPG, maximum BSi levels were found at the DCM, between 125 and 150 m. Total lithogenic silica concentrations were measured in a very similar range (Fig. 5b), between 2 and 195 nmol L−1, with a peak value at station 2 at 100 m. Also, LSi ranged from 5 to 30 nmol L−1 over the transect, with highest values observed close to 100 m, while averaged concentrations followed the same trend as BSi, decreasing from 16 to 9 nmol L−1 between the MA and the SPG. During the BIOSOPE cruise, three main regions could be differentiated: a first region covering the ultra-oligotrophic central area from station 1 to station 20, where average BSi concentrations were as low as 8 nmol L−1 (Fig. 5c). At the western end of the transect, the first three stations in the vicinity of the Marquesas Islands had higher concentrations, with average values of 104 nmol L−1. The eastern end of the transect, located in the Peru–Chile upwelling system, displayed much higher and variable values, averaging 644 nmol L−1, with a maximum concentration of 2440 nmol L−1 at the UPW station at 60 m. At both ends of the transect, siliceous biomass was mainly distributed in the upper 100 m. Lithogenic silica followed the same trends (Fig. 5d), with extremely low values over the central area (average of 7 nmol L−1) and a few peaks close to 30 nmol L−1 (stations 12 and EGY). LSi concentrations were highest at both ends of the transect but concentrations remained below those of BSi, with average LSi values of 26 nmol L−1 close to the Marquesas, and of 57 nmol L−1 in the coastal upwelling system. The maximum values, close to 150 nmol L−1, were associated with the BSi maximums at the UPW sites.
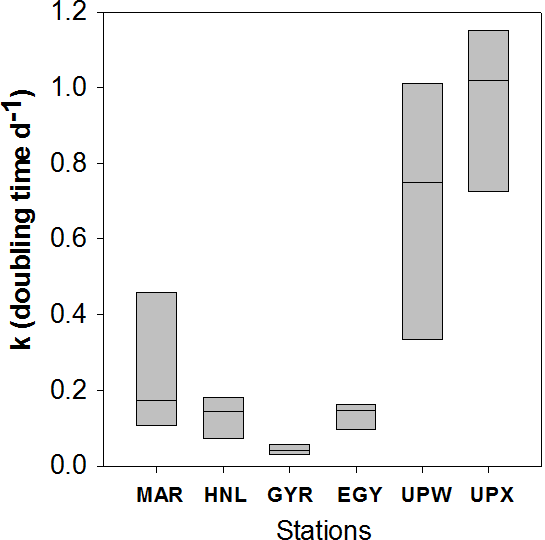
Figure 8Diatom doubling times k (in d−1) as Tukey box plot of all data available per vertical profile for each station of the BIOSOPE cruise.
Size-fractionated integrated BSi stocks were calculated for both cruises over the 0–125 m layer, except for the BIOSOPE cruise at station UPW1, which was only integrated over 50 m and at stations UPX1 and UPX2 which were integrated over 100 m (Fig. 6a, b, Appendix A1). Total BSi stocks were similarly very low in the ultra oligotrophic central gyre and averaged 1 mmol Si m−2 during both cruises. During BIOSOPE, the stocks measured closed to the Marquesas averaged 9.85 mmol Si m−2 (with a peak of 24.12 mmol Si m−2 at the MAR station). On the eastern end of the transect, stocks increased to a peak value of 142.81 mmol Si m−2 at the UPW2 station and averaged 65.68 mmol Si m−2 over the coastal upwelling system. Size fractionation was only carried out at the long-duration stations, but showed an overall non-negligible contribution of the pico-sized fraction (0.2–2 µm) to BSi standing stocks of 11%±9%. This contribution of the pico-sized fraction to integrated siliceous biomass was highest at the GYR, EGY and UPX1 stations, reaching 25 %, 18 % and 24 % respectively.
During OUTPACE, integrated BSi stocks ranged between 1.25 and 4.11 mmol Si m−2 over the MA, and decreased to 0.84 to 1.28 mmol Si m−2 over the SPG (Fig. 6c, Appendix B1). Here, size fractionation was conducted at all sites and the contribution of the 0.4–3 µm, which will be attributed to the pico-sized fraction hereafter, was higher than during BIOSOPE, with an average contribution of 26 %±12 %. The importance of the picoplanktonic Si biomass was higher in the SPG (36 %±12 %, n=14) than over the MA (22 %±10 %, n=5) but not statistically different (p>0.05).
3.4 Si uptake rates
Si uptake rate measurements using the 32Si radioactive isotope were only conducted during the BIOSOPE cruise. Rank order of most productive stations follow the pattern observed for BSi, with the highest values observed at UPW followed by UPX and MAR stations. Vertical profiles of gross production rates (ρSi) confirm the previous stock information and show that the most productive stations, in decreasing order of importance, are the UPW, UPX and MAR stations (Fig. 7a), with 1.98, 1.19 and 0.22 µmol Si L−1 d−1 at 10 m respectively. Si uptake rates remained below 0.015 µmol Si L−1 d−1 at central HNLC and oligotrophic stations HNL, EGY and GYR. Si uptake rates in the picoplanktonic size fraction showed similar trends (Fig. 7b), despite higher values at UPX (0.076 µmol Si L−1 d−1) than at UPW (0.034 µmol Si L−1 d−1). Uptake rates in that size fraction were intermediate at the MAR station, with a maximum value of 0.005 µmol Si L−1 d−1, while it remained below 0.001 µmol Si L−1 d−1 at the central stations. Specific Si uptake (VSi normalized to BSi) rates for the picoplanktonic size fraction were even more elevated and reached maximum values of 3.64, 1.32, 0.75, 0.37 and 0.14 d−1 at the UPW, UPX, HNL, EGY and MAR stations respectively. Total specific Si uptake rates were extremely high in the coastal upwelling system, with values of 2.57 and 1.75 d−1 at UPX and UPW respectively, and lower but still elevated values at the MAR station (0.75 d−1). VSi at the central stations (HNL, EGY, GYR) were moderate to low and ranged between 0.02 and 0.24 d−1.
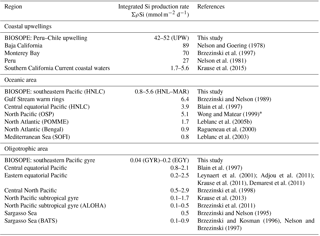
Table 1Size-fractionated integrated Si production rates in mmol Si m−2 d−1 in the SEP (BIOSOPE). Integrated Si production was measured over the 0 %–1 % light depth range for each site (in parenthesis in column 5) and normalized over 100 m, considering a zero production at 100 m in the last column.
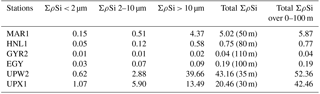
Total ΣρSi reached 52.4 mmol Si m−2 d−1 at UPW2 station, an order of magnitude higher that the rate measured at the MAR station (5.9 mmol Si m−2 d−1) and 3 orders of magnitude higher than at EGY, where the lowest value was obtained (0.04 mmol Si m−2 d−1). Integrated picoplanktonic Si uptake rates (ΣρSi for 0.2–2 µm) were highest at both upwelling stations (Table 1), followed by the MAR station. The relative average contribution of the picoplanktonic size fraction to total Si uptake rates was highest at the central stations (32 % at GYR, 19 % at EGY and 11 % at HNL) while it was lowest on both ends of the transect (5 % at MAR, and 3 % and 7 % at UPW and UPX stations). Diatom doubling times were calculated at each depth following Eq. (1) and are shown in Fig. 8 for each station. The lowest k were found at the HNL, GYR and EGY stations, where median values remained <0.2 d−1. The median value was similar at the MAR station but with a larger interquartile and a higher maximum value of 0.56 d−1. Doubling times were most elevated at the UPW (0.75 d−1) and UPX (0.92 d−1) stations and the maximum value for the cruise was 1.27 d−1 at the UPX station at the surface.
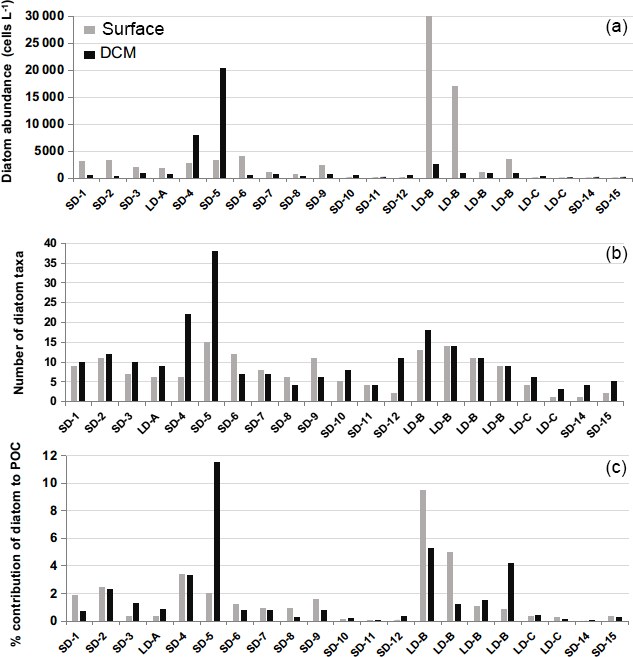
Figure 9Diatoms cellular concentrations (cells L−1) derived from (a), Niskin cell counts, (b) number of taxa and (c) relative contribution to POC biomass (%) at the surface and DCM levels during the OUTPACE cruise.
3.5 Diatom distribution and community structure
Microscopical examinations confirmed the presence of diatoms at every station during both cruises. Diatoms were found in very low abundances during the OUTPACE cruise and only reached maximum values of 20 000–30 000 cells L−1 on two occasions, at stations LD-B at the surface and at station 5 at the DCM (Fig. 9a). Mean diatom concentrations in the MA at the surface were 4440±7650 cells L−1 while at the DCM, mean concentrations were about 2 times lower (2250±4990 cells L−1). Diatom abundance decreased dramatically in the SPG, with values as low as 25±19 cells L−1 at the surface layers and 145±54 cells L−1 at the DCM. The richness of diatoms was higher in the MA than in the SPG, with an average number of taxa of respectively 9±4 and 2±1 in the surface layer (Fig. 9b). The richness increased at the DCM level, with 12±8 taxa in the MA and 5±1 taxa in the SPG. Diatom contribution to biomass was accordingly extremely low and remained below 3 % (Fig. 9c). The diatom contribution to C biomass increased more significantly only at two stations: at station LD-B (9 % at the surface) and at station 5 where the maximum value for the cruise was observed (11.5 % at the DCM).
During BIOSOPE, the central stations showed the lowest diatom abundance, with less than 100 cells L−1 from stations 2 to EGY (Fig. 10). The eastern part of the SPG and the HNL stations were characterized by slightly higher abundances (from 100 to 1000 cells L−1), followed by the UPX station, where abundances were similar to the MAR station at the surface (∼25 000 cells L−1). Highest abundances were observed at the UPW, with bloom values of 256 000 cells L−1 on average (with a peak abundance of 565 000 cells L−1 at the surface). Similar results compared to OUTPACE showed an extremely low richness at all central stations (data not shown), with 3±2 diatom taxa on average, while richness increased at the western HNLC region, with 13±4 taxa at the MAR and HNL stations. Richness was highest at the UPW station, with 20±4 taxa, and decreased again at the UPX station (5±3).
Table 2Dominant diatom species in each main system of the BIOSOPE and OUTPACE cruises. Taxonomic information for the OUTPACE cruise was derived from discrete samplings at the surface and DCM and phytoplankton nets, while information for the BIOSOPE cruise was obtained through an average of six discrete samples over the euphotic layer (see Gomez et al., 2007).
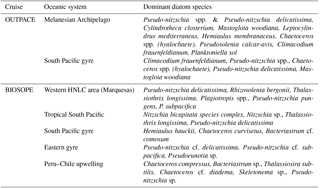
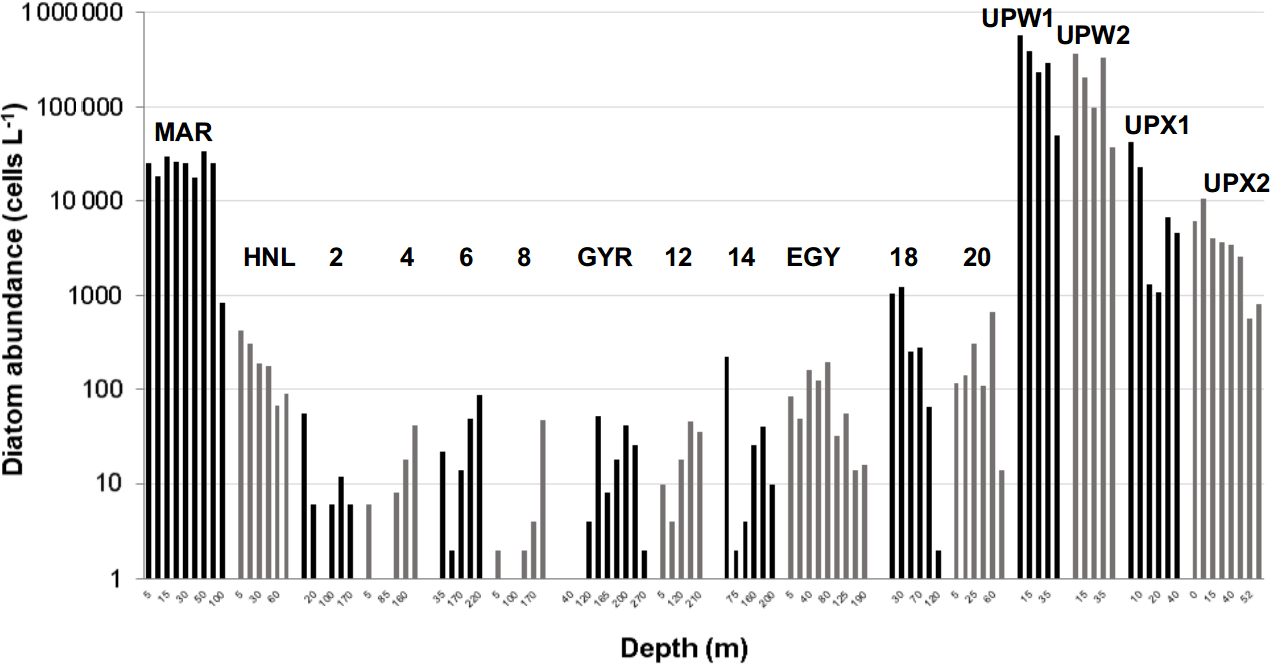
Figure 10Diatom cellular concentrations (cells L−1) derived from Niskin cell counts at several depths during the BIOSOPE cruise (data from Gomez et al., 2007).
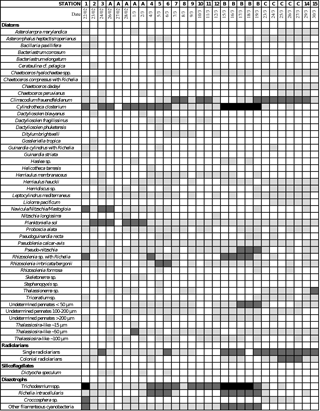
The dominant diatom species for each system sampled over the course of the two cruises are summarized in Table 2 and Appendix C1. During OUTPACE, very similar species were encountered in both regions and were mainly dominated by pennate species such as Pseudo-nitzschia spp., P. delicatissima, Cylindrotheca closterium and Mastogloia woodiana. However, DDAs such as Rhizosolenia styliformis, Climacodium frauenfeldianum and Hemiaulus hauckii were more abundantly found in the MA. Other siliceous organisms such as radiolaria were also more abundant in the SPG and at LD-B than in the MA (Appendix C1). Overall microplanktonic diazotroph abundance were much higher over the MA than in the gyre, with a predominance in plankton nets of Trichodesmium, Richelia intracellularis (alone or in DDAs), Crocosphaera and other filamentous cyanobacteria such as Katagnymene (Appendix C1).
Diatom community structure for the BIOSOPE cruise has already been discussed extensively in Gómez et al. (2007). In summary, the stations characterized by medium diatom abundances such as MAR, HNL, 18, 20 and EGY (Fig. 10) were mainly dominated by the pennate diatom Pseudo-nitzschia delicatissima, in particular at the MAR station, where it represented on average 90 % of all diatoms in the 0–100 m layer. Extremely low abundance stations (<200 cells L−1) from the middle of the SPG (stations 2 to 14) did not show any consistent community, with varying dominant species across stations and along vertical profiles as well. Maximum abundances at these sites were consistently found at depth, between 100 and 200 m. In the Peru–Chile upwelling, diatom community structure was mostly dominated by small and colonial centric species such as Chaetoceros compressus and Bacteriastrum spp. at the UPW station, where abundances were highest (565 000 cells L−1), and such as Skeletonema sp. and Thalassiosira anguste-lineata at the UPX station, where abundances decreased to 10 000–40 000 cells L−1. In this system, the highest abundances were found in the first 10 m.
3.6 Si export fluxes
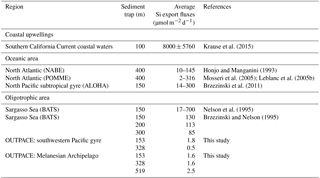
Particulate silica export fluxes were measured from drifting trap deployments at each long-duration station during OUTPACE and are presented in Table 3. BSi daily export fluxes below the mixed layer at 153, 328 and 529 m were extremely low at all sites, with the lowest values at site A (0.5 to 0.1 µmol Si m−2 d−1), highest at site B (3 to 5 µmol Si m−2 d−1) and intermediate at site C (0.5 to 2 µmol Si m−2 d−1).
Table 3Particulate biogenic and lithogenic (BSi and LSi) silica in drifting sediment traps at each long-duration station during OUTPACE cruise, at 153, 328 and 519 m depth.
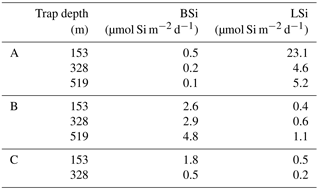
Table 4Integrated Si production rates in various systems for comparison with our study, from direct 32Si uptake measurements or from indirect silicate utilization (ΔSiO4) estimates (∗).
4.1 Si budgets for the South Pacific
In the following section, values from previous studies are compared (Table 4) with the results obtained across this under-studied region of the Pacific Ocean, which is characterized by the most oligotrophic and Chl a-depleted waters worldwide (Ras et al., 2008). We obtained size-fractionated biomass and export fluxes during the OUTPACE program, and size-fractionated production and biomass budgets during the BIOSOPE program. Regarding values obtained at both ends of the BIOSOPE transects, i.e., in the Peru–Chile upwelling system and in the HNLC system surrounding the Marquesas Islands, ΣρSi rates compare well with previous studies from other similar regions (Table 4). Integrated Si production rates at the UPW stations are in the middle range (42–52 mmol Si m−2 d−1) of what was previously found in coastal upwellings. Values are, however, almost double what was previously observed in the Peru upwelling by Nelson et al. (2013), although they are lower than those in the Monterey Bay and Baja Californian upwelling systems (Brzezinski and Phillips, 1997; Nelson and Goering, 1978). For oceanic HNLC areas, values obtained (0.8 to 5.6 mmol Si m−2 d−1) cover the range of rates measured in HNLC to mesotrophic systems of the North Atlantic, central equatorial Pacific and Mediterranean Sea. However, integrated rates obtained for the oligotrophic area of the southeastern Pacific gyre are to our knowledge among the lowest ever measured, even taking into account the error associated with budget estimates this close to analytical detection limits. Values range from 0.04 to 0.20 mmol Si m−2 d−1; they are thus lower than average values previously measured at BATS and ALOHA stations (0.42 and 0.19 mmol Si m−2 d−1 respectively) (Brzezinski and Kosman, 1996; Brzezinski et al., 2011; Nelson and Brzezinski, 1997). However, they are similar to measurements performed in autumn (0.04–0.08 mmol Si m−2 d−1) in a severely Si-limited regime of the North Atlantic (Leblanc et al., 2005b). Previous studies have documented limitation of diatom Si production by Si (Leynaert et al., 2001), but more recently evidence of co-limitation by both Si and Fe was found in the central equatorial Pacific (Brzezinski et al., 2008). This would more than likely be the scenario for the SPG, given the very low silicic acid (Figs. 2 and 3) and Fe concentrations (0.1 nM and ferricline below 350 m depth, Blain et al., 2008) measured during both cruises.
Table 5Summary of ΣBSi stocks (in mmol Si m−2) for the OUTPACE and BIOSOPE and other oceanic and oligotrophic systems.
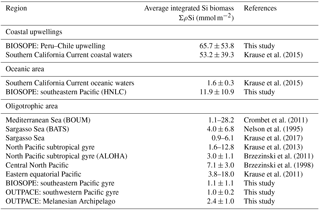
Table 6Summary of Si export fluxes in sediment traps at various depths (in µmol Si m−2 d−1) for the OUTPACE cruise compared to other studies.
The approximate surface area of midocean gyres was estimated to be 1.3×10⁸ km2 (representing approximately one-third of the global ocean), yielding a global contribution of only 26 Tmol Si yr−1 gross silica production, i.e., approximately 9–13 % of the budget calculated for the global ocean of 240 Tmol Si yr−1 according to Nelson et al. (1995). This budget has been recently revised down to 13 Tmol Si yr−1 when considering budgets from the North Pacific (Nelson and Brzezinski, 1997) reducing the contribution of subtropical gyres to 5 %–7 % of global marine silica production (Brzezinski et al., 2011; Tréguer and De La Rocha, 2013). However, the range provided in Nelson et al. (1995) in the calculation of their global Si production fluxes for midocean gyres was of 0.2–1.6 mmol m−2 d−1. Our values would, once again, lower the contribution of these vast oceanic regions to global Si production, although the present data are only based on two production station measurements and warrant further measurements for this region. Nevertheless, it can be expected that the most ultra-oligotrophic region of the world ocean would contribute even less to total Si production than the other oligotrophic systems listed in Table 4 and that, in particular, the Si production in the ultra-oligotrophic southern tropical gyre would be lower than the northern tropical gyre.
Integrated Si biomass also reflects the very low contribution of diatoms in this system, which was more than 2 times lower in the South Pacific gyre than in the Melanesian Archipelago (Table 5). In the SPG, the lowest Si stocks were measured (∼1 mmol Si m−2) and were similar to lower-end values found in the ultra-oligotrophic eastern Mediterranean Basin in autumn and in other oligotrophic areas of the North Pacific subtropical gyre and of the Sargasso Sea (Table 5 and references therein). It is probable that ΣρSi production and BSi stocks could have been slightly higher less than a month earlier in the season in the western part of the OUTPACE transect in the MA. Indeed, the satellite-based temporal evolution of Chl a at stations LD-A and LD-B showed decreasing concentrations at the time of sampling (de Verneil et al., 2018), while the situation did not show any temporal evolution for the SPG, thus suggesting that the biogenic silica budget for this area is quite conservative under a close to steady-state situation.
Lastly, our Si export flux measurements by drifting sediment traps are the lowest ever measured and are about 2 orders of magnitude lower than those from other oligotrophic sites such as BATS in the Atlantic or ALOHA in the Pacific Ocean (Table 6). They represent a strongly negligible fraction of surface Si stocks, implying no sedimentation at the time of sampling, and that active recycling and grazing occurred in the surface layer. Indeed, surface temperatures higher than 29 ∘C at all long-duration sites may favor intense dissolution in the upper layer, while active zooplankton grazing was also documented, removing between 3 % and 21 % of phytoplankton stocks daily (Carlotti et al., 2018). The virtual absence of silica export from the surface layer agrees well with the conclusion of Nelson et al. (1995) that no siliceous sediment is accumulating beneath the central ocean gyres.
4.2 Siliceous plankton community structure in the tropical South Pacific
The main feature observed during OUTPACE was a bi-modal distribution of diatom communities, either at the surface and/or at the DCM level depending on stations, which deepened towards the east, following the increasing oligotrophy gradient, similarly to what was previously described in the Mediterranean Sea (Crombet et al., 2011). A similar feature, showing a particularly deep DCM, up to 190 m in the SPG at 1.2 times the euphotic depth (Ras et al., 2008), was observed during BIOSOPE, revealing a known strategy for autotrophic plankton cells in nutrient-depleted waters to stay at the depth where the best light vs. nutrient ratio is obtained (Quéguiner, 2013). While DCMs are common in midocean gyres and are known to be often dominated by pico-sized phytoplankton (Chavez et al., 1996), studies documenting phytoplankton community structure in the tropical South Pacific Ocean, an area formerly called a “biological desert”, are still very scarce. In the review of planktonic diatom distribution by Guillard and Kilham (1977), which references biocenoses for all main oceanic water bodies and for which thousands of articles were processed, the diatom composition for the southern tropical region was referred to as “No species given (flora too poor)”. Since then only a few studies mentioning phytoplankton community structure, mostly located along the equator were published, such as Chavez et al. (1990), Chavez et al. (1991), Iriarte and Fryxell (1995), Kaczmarska and Fryxell (1995) and Blain et al. (1997). In Semina and Levashova (1993) some biogeographical distribution of phytoplankton, including diatoms, is given for the entire Pacific region, yet the southern tropical region is limited to more historical Russian data and relies on very few stations. The only diatom distribution for the southern tropical gyre was published for the present data set by Gómez et al. (2007) in the BIOSOPE special issue. Hence the present data contribute to documenting a severely understudied yet vast area of the world ocean. The oceanic regions covered during both cruises may be clustered into three main ecological systems with relatively similar diatom community structures: the nutrient-rich coastal upwelling system near the Peru–Chile coast, where diatom concentrations exceeded 100 000 cells L−1; the Fe-fertilized areas of the Melanesian Archipelago and west of the Marquesas Islands, where concentrations could locally exceed 10 000 cells L−1; and all the other ultra-oligotrophic regions (mainly the South Pacific gyre system) characterized by extremely low diatom abundances, usually <200 cells L−1. The upwelling area was characterized by a distinct community, not found in the other regions, composed of typical neritic and centric colonial species such as Skeletonema sp., Bacteriastrum spp., Chaetoceros compressus, Thalassiosira subtilis and T. anguste-lineata. These first three species were already documented as abundant in the Chile upwelling by Avaria and Munoz (1987), whereas T. anguste-lineata was reported along the Chilean coast from 20 to 36∘ S (Rivera et al., 1996) and was also documented in the upwelling system west of the Galapagos Islands (Jimenez, 1981). The highest ρSi production values were measured at the offshore UPW station where Bacteriastrum spp. and Chaetoceros compressus co-occurred as the two dominant species, whereas ρSi rates were halved at the closest coastal station UPX, associated with lower abundances of diatoms, with co-occurring dominance by Skeletonema sp. and Thalassiosira anguste-lineata. The HNLC regions off the Marquesas Islands and in the eastern gyre (stations 14–20, BIOSOPE) and the oligotrophic region (N-deprived but Fe-fertilized region of the MA), with bloom situations at stations 5 and LD-B (OUTPACE), showed strong similarities in terms of diatom community structure and were all mainly dominated by the medium-sized pennate diatoms of the Pseudo-nitzschia delicatissima and subpacifica species complex. These pennate species are commonly reported for the central and equatorial Pacific Ocean (Blain et al., 1997; Guillard and Kilham, 1977; Iriarte and Fryxell, 1995). During BIOSOPE, Pseudo-nitzschia delicatissima were often seen forming “needle balls” of ∼100 µm diameter, which suggests an antigrazing strategy from micrograzers (Gómez et al., 2007), a strategy already described by several authors (Buck and Chavez, 1994; Hasle, 1959; Iriarte and Fryxell, 1995). Predominance of pennate diatoms over centrics has previously been observed in the N-depleted environment of the equatorial Pacific (Blain et al., 1997; Kobayashi and Takahashi, 2002) and could correspond to an ecological response to diffusion-limited uptake rates, favoring elongated shapes, as suggested by Chisholm (1992). Furthermore, net samples from the OUTPACE cruise showed a numerically dominant contribution of Cylindrotheca closterium over 0–150 m at most stations of the MA (Appendix C1), with a strong dominance at LD-B, even though their contribution to biomass is minor given their small size. However, it should be noted that if small fast-growing pennates were numerically dominant, their relative contribution to C biomass was very small compared to that of few larger centrics such as Pseudosolenia calcar-avis, which when present dominated in terms of biomass, similarly to what had already been observed in the South Pacific with large Rhizosolenia (Shipe et al., 1999). Pseudo-nitzschia sp. and Cylindrotheca closterium have been shown to bloom upon Fe-addition experiments (Assmy et al., 2007; Chavez et al., 1991; Fryxell and Kaczmarska, 1994; Leblanc et al., 2005a) and may reflect the significantly higher dissolved Fe concentrations measured in the MA (average 1.9 nM in the first 100 m) compared to the SPG (0.3 nM) (Guieu et al., 2018). In the equatorial Pacific, Fe-amendment experiments evidenced the rapid growth of Cylindrotheca closterium, with a high doubling rate close to 3 d−1 (Fryxell and Kaczmarska, 1994), which can explain why this species is often numerically dominant.
Fast-growing colonial centric diatoms such as Chaetoceros spp. were notably absent from the MA, except at stations 5 and LD-B, where mesoscale circulation increased fertilization (de Verneil et al., 2018) and allowed a moderate growth (observed in both Niskin samples and net hauls), resulting in an increased contribution of diatoms to total C biomass of approximately 10 % (Fig. 9c). Other typical bloom species such as Thalassiosira spp. were completely absent from the species from the Niskin samples but observed at low abundance in some net haul samples. Nonetheless, very large centrics typical of oligotrophic waters such as Rhizsolenia calcar-avis (Guillard and Kilham, 1977) were present in low numbers at all stations and in all net hauls, and they represented a non-negligible contribution to biomass despite their low abundance.
One difference with the N-replete Marquesas HNLC system was that the hydrological conditions of the MA were highly favorable for the growth of diazotrophs, with warm waters (>29 ∘C) and depleted N in the surface layer associated with high Fe levels, while P was likely the ultimate controlling factor of N input by N2 fixation in this region (Moutin et al., 2008, 2018). N2-fixation rates were among the highest ever measured in the open ocean during OUTPACE in this region (Bonnet et al., 2017), and the development of a mixed community composed of filamenteous cyanobacteria such as Trichodesmium spp. and other spiraled-shaped species, unicellular diazotrophs such as UCYN, Crocosphaera watsonii, and DDAs was observed (Appendix C1). The highest rates were measured at the surface at stations 1, 5, 6 and LD-B (Caffin et al., 2018) and the major contributor to N2 fixation in MA waters was by far Trichodesmium (Bonnet et al., 2018). In the Niskin cell counts, diatoms known to live in association with the diazotroph Richelia intracellularis (such as Hemiaulus hauckii, Chaetoceros compressus and several species of Rhizosolenia such as R. styliformis, R. bergonii, R. imbricata and the centric Climacodium frauenfeldianum known to harbor a genus related to Cyanothece sp.; Carpenter, 2002) were all found in low abundance in the water sample cell counts, contributing to less than 1 % of total diatoms. Exceptions were observed at sites 1 and 2, where their contributions increased to 2.3 % and 8 % respectively. The low contribution of DDAs to the diazotrophs community was confirmed by direct cell counts and nifH gene sequencing (Stenegren et al., 2018). Notably, the presence of Richelia intracellularis was not observed in the Niskin lugol-fixed water samples, but Rhizosolenia styliformis with Richelia, and some isolated Richelia cells were observed abundantly in net hauls. The latter were found to be dominant at stations 1 and LD-B, where the highest fixation rates were measured. Richelia cells, alone or in association with R. styliformis, were much less abundant in the South Pacific gyre, where Fe is prone to be the limiting nutrient for N2-fixation rates despite higher P availability, pointing to less favorable growth conditions for diazotrophs. Yet, the overall dominance of Trichodesmium, Crocosphaera and other filamenteous cyanobacteria (Appendix C1) in the net samples reveals that DDAs were very minor contributors to N2 fixation during OUTPACE. This was also evidenced through NanoSIMS analyses (Caffin et al., 2018).
In order to explain the growth of diatoms in this severely N-depleted region, one can quote the use of diazotroph-derived nitrogen (DDN), i.e., the secondary release of N2 fixed by diazotrophs, which was shown to be efficiently channeled through the entire plankton community during the VAHINE mesocosm experiment (Bonnet et al., 2016). In this latter study off the shore of New Caledonia, Cylindrotheca closterium grew extensively after stimulation with diazotrophy after P addition in large-volume in situ mesocosms in New Caledonia (Leblanc et al., 2016). As previous studies had already observed a co-occurrence of elevated C. closterium with several diazotrophs (Bonnet et al., 2016; Devassy et al., 1978), this recurrent association tends to confirm our previous hypothesis of a likely efficient use of DDN released as NH4 by this fast-growing species (Leblanc et al., 2016). This could be another factor, besides Fe availability, explaining its success. A similar hypothesis may be invoked for the presence of Mastogloia woodiana, a pennate diatom known to be occasionally dominant in the North Pacific subtropical gyre blooms (Dore et al., 2008; Villareal et al., 2011). It is also a characteristic species of oligotrophic areas (Guillard and Kilham, 1977), often observed in association with other DDAs, which could similarly benefit from secondary N release (Krause et al., 2013; Villareal et al., 2011).
Lastly, the ultra-oligotrophic region of the SPG investigated during both OUTPACE and BIOSOPE revealed a common baseline contribution of diatoms with less than 200 cells L−1 at the DCM and close to zero at the surface. In addition, a dominance of small and large pennate species was observed, such as Nitzschia bicapitata, Pseudo-nitzschia delicatissima, Thalassiothrix longissima, Thalassionema elegans and Pseudoeunotia sp., which have already been documented for the equatorial Pacific by Guillard and Kilham (1977). Occasional occurrences of some emblematic species of oligotrophic regions were also observed, such as Chaetoceros dadayi, C. peruvianus, C. tetrastichon or Planktoniella sol. It can be noted that radiolarians were also more abundant and more diverse in the ultra-oligotrophic SPG during OUTPACE than in the MA, while unfortunately no information regarding radiolarians is available for the BIOSOPE cruise.
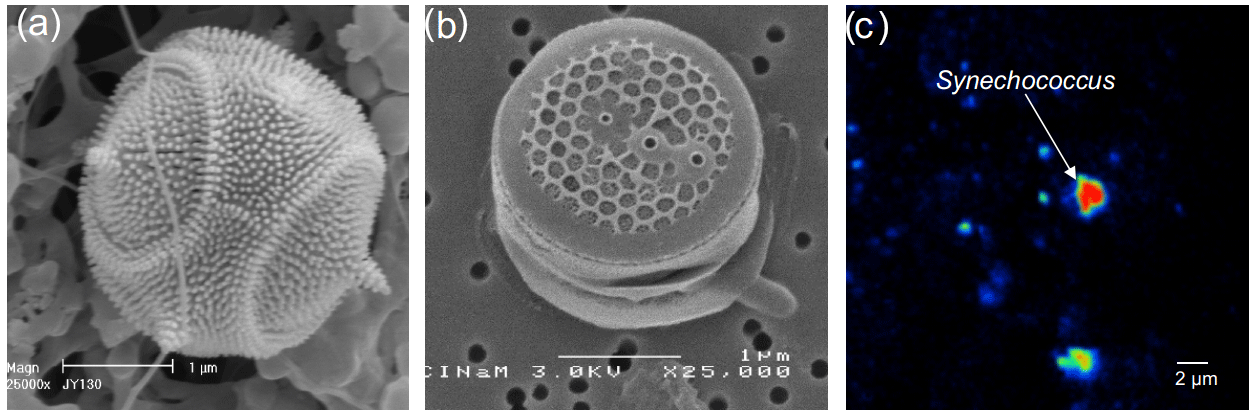
Figure 11Potential siliceous organisms in the picoplanktonic (<2–3 µm) size fraction. (a) Siliceous scale-bearing Parmale (Tetraparma pelagica in SEM, photo courtesy of J. Young), (b) centric diatom (Minidiscus trioculatus), (c) Synechoccocus cell showing Si assimilation in red (28Si) in NanoSIMS (photo courtesy of Mathieu Caffin).
4.3 Evidence for active Si uptake in the picoplanktonic size fraction in the tropical South Pacific
The pico-sized fraction (<2–3 µm) represented 11 % of BSi stocks on average during BIOSOPE, and 26 % of BSi stocks during OUTPACE (Fig. 6), which is a non-negligible contribution. The significant contribution of the pico-sized fraction to the BSi stocks during both cruises could be explained by the presence of detrital components; however, its contribution to Si(OH)4 uptake during BIOSOPE was really surprising but can be explained in the light of new findings. Indeed, recent studies have evidenced that the picophytoplanktonic cyanobacteria Synechococcus can assimilate Si (Baines et al., 2012; Brzezinski et al., 2017; Krause et al., 2017; Ohnemus et al., 2016), which could explain why Si stocks were detected in this size fraction. The first hypothesis was to consider broken fragments of siliceous cells passing through the filter or interferences by lithogenic silica, but these hypotheses were invalidated during BIOSOPE when Si uptake measurements using 32Si were also carried out on this pico-sized fraction and revealed a non-negligible uptake, mainly in the Chilean upwelling systems (Fig. 7). Our results are thus in line with previous findings, as no other organisms below 2–3 µm are known to assimilate Si, except some small-sized Parmales, a poorly described siliceous armored planktonic group which span over the 2–10 µm size class, such as Tetraparma sp. (Ichinomiya et al., 2016), or small nanoplanktonic diatoms such as Minidiscus (Leblanc et al., 2018), close to the 2 µm limit (Fig. 11a, b). The latter two species could occur in the 2–3 µm size fraction, but are very easily missed in light microscopy and require SEM imaging or molecular work for correct identification. The presence of Parmales or nanoplanktonic diatoms may explain the measurement of BSi in this 0.4–3 µm size-class for the OUTPACE cruise, but can be excluded as responsible for the Si uptake measured during BIOSOPE on filters below 2 µm. Rather, during OUTPACE, NanoSIMS imaging revealed that cytometrically sorted Synechococcus cells accumulated Si (Fig. 11c), confirming their potential role in the Si cycle in the southern tropical gyre.
According to Baines et al. (2012), the Si content of Synechococcus, in some cases, could exceed that of diatoms, but these authors suggested that they might exert a larger control on the Si cycle in nutrient-poor waters where these organisms are dominant. In the present study, the largest contribution of the pico-sized fraction to absolute ΣρSi uptake rates occurred at both ends of the transect in the Peru–Chile upwelling region and at the MAR station (Table 1), locations which also corresponded to the highest concentrations of Synechococcus observed (Grob et al., 2007). However, compared to diatoms, this only represented 1 % to 5 % of total ΣρSi uptake, which is not likely to drive the Si drawdown in this environment. This low relative contribution to ΣρSi was similarly found at the other end of the transect at HNL and MAR station, but where absolute uptake rates were moderate. The largest contribution of the pico-sized fraction was measured in the SPG (GYR and EGY sites), where despite very low ρSi values, the relative ΣρSi uptake between 0.2 and 2 µm reached 16 % to 25 %. Station GYR as well as stations 13 to 15 are areas that are highly depleted in orthosilicic acid, with concentrations <1 µM from the surface to as deep as 240 m. Hence, it is probable that Synechococcus could play a role in depleting the Si of surface waters in this area, which are devoid of diatoms.
During the OUTPACE cruise, there were no clear correlations between Synechococcus distributions and the measured 0.4–3 µm BSi concentrations. This could be explained by the extremely wide range of individual cellular Si quotas estimated to vary between 1 and 4700 amol Si cell−1 (with an average value of 43) from cells collected in the northwestern Atlantic (Ohnemus et al., 2016), where Synechococcus contributed up to 23.5 % of ΣBSi (Krause et al., 2017). In the latter study, a first-order estimate of the contribution of Synechococcus to the global annual Si production flux amounted to 0.7 %–3.5 %, which is certainly low, but comparable to some other important input or output fluxes of Si (Tréguer and De La Rocha, 2013). Using the range of measured Si cellular content per Synechococcus cells given in Ohnemus et al. (2016) of 14 to 64 amol Si cell−1 and Synechococcus abundance data from the same casts obtained in flow cytometry (data courtesy of S. Duhamel, Lamont Doherty, NY), this yields a potential contribution of 3 % to 14 % of Synechococcus to the small BSi fraction, which is close to the previous estimates.
The Sargasso Sea (BATS) and the tropical North Pacific Ocean (ALOHA) were until now the only two subtropical gyres where the Si cycle was fully investigated during time-series surveys. In this paper, we provide the first data from two cruises documenting production, biomass and export fluxes from the oligotrophic to ultra-oligotrophic conditions in the tropical South Pacific gyre, which may lower the estimates of diatom contribution to primary productivity and export fluxes for the Pacific Ocean and for midocean gyres in general. The midocean gyres (representing one-third of the global ocean) are severely under-sampled regarding the Si cycle, and may encompass very different situations, in particular in the vicinity of islands and archipelagos with reduced bathymetry, nutrient-fertilized surface waters, HNLC waters and even HNLSiLC along the equatorial divergence (Dugdale and Wilkerson, 1998). The midocean gyres contribution to Si production was recently revised down to 5 %–7 % of the total by Brzezinski et al. (2011) building on estimates from the northern subtropical Pacific gyre. The present study points to even lower values for the South Pacific gyre, confirming its ultra-oligotrophic nature, and should further decrease this estimate. These findings underscore the differences in functioning of different subtropical oligotrophic gyres between the North Atlantic, North Pacific and South Pacific and clearly warrant improved coverage of these areas and more complete elemental studies (from Si production to export).
Diatom community structure and contribution to total biomass could be summarized by differentiating 3 main ecosystems: (i) the eutrophic Peru–Chile coastal upwelling, where colonial neritic centric diatoms such as Skeletonema sp., Chaetoceros sp. and Thalassiosira sp. contributed to elevated abundances (>100 000 cells L−1) and very high Si uptake rates; (ii) the HNLC region off the Marquesas Islands and the nutrient-depleted but Fe-fertilized region of the Melanesian Archipelago, where a distinct community largely dominated by small and medium-sized pennates such as Cylindrotheca closterium and Pseudo-nitzschia delicatissima developed to moderate levels (<30 000 cells L−1), while Fe levels in the MA further stimulated diazotrophs and DDAs that could have stimulated diatom growth through secondary N release; (iii) the SPG, characterized by ultra-oligotrophic conditions and Fe limitation, where diatoms reached negligible abundances (<200 cells L−1) with species typical of oligotrophic regions, such as Nitzschia bicapitata, Mastogloia woodiana and Planktoniella sol as well as radiolarians.
Finally, thanks to both size-fractionated biomass and Si uptake measurements, we were able to confirm a potential role for Synechococcus cells or Parmales in Si uptake in all environments, which may be of importance relative to diatoms in oligotrophic regions, but are probably negligible in highly productive regions such as coastal upwellings. Mechanisms linked to Si uptake in Synechococcus and its ecological function still need to be elucidated, and further attention to the Si cycle needs to be placed on this elusive pico- and nano-sized fraction.
All data are available upon request through both cruises databases, for BIOSOPE (http://www.obs-vlfr.fr/proof/vt/op/ec/biosope/bio.htm, last access: 30 August 2018) (BIOSOPE, 2018) and OUTPACE (http://www.obs-vlfr.fr/proof/php/outpace/outpace.php, last access: 30 August 2018) (OUTPACE, 2018). For the Si stocks and flux and diatom abundance data for the OUTPACE cruise, see http://www.seanoe.org/data/00446/55743/ (last access: 30 August 2018) (Leblanc and Cornet, 2018). For the Si stocks and flux data for the BIOSOPE cruise, see http://www.seanoe.org/data/00446/55722/ (last access: 30 August 2018) (Quéguiner and Rimmelin, 2018).
Table A1Integrated size-fractionated biogenic silica concentrations (ΣBSi) in the southeastern Pacific (BIOSOPE cruise) over 0–125 m (0–50 m for ∗ and 0–100 m for ).
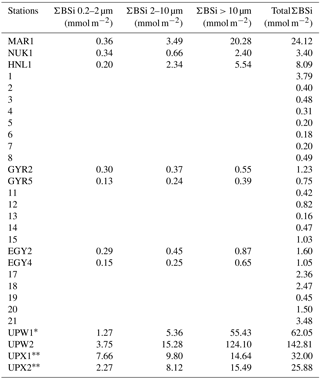
Table B1Integrated size-fractionated biogenic silica concentrations (ΣBSi) in the southwestern Pacific (OUTPACE cruise) over 0–125 m (0–200 m for ∗).
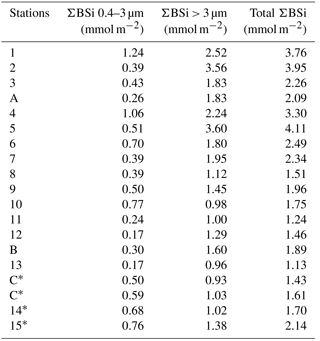
Table C1Semiquantitative contribution of siliceous plankton (diatoms, radiolarians, silicoflagellates) and diazotrophs in plankton nets hauls of 35 µm mesh size (over 0–150 m at all sites except but over 0–200 m at stations 14 and 15) during the OUTPACE cruise. Long-duration stations were sampled every day. Light gray, medium gray and dark gray correspond to minor, common and dominant abundances respectively.
KL treated all data and wrote the paper. BQ and PR sampled on board and analyzed Si data from the BIOSOPE cruise. SHN and OG collected nutrient samples on board and analyzed nutrient data from the OUTPACE cruise. VC sampled all BSi data and diatom diversity on board and analyzed plankton net samples on the OUTPACE cruise. CB analyzed all Si data and ran diatom cell counts during her Masters thesis. HC and JR were in charge of all pigment data for both cruises. NL collected and analyzed Si export flux data from the OUTPACE drifting sediment traps.
The authors declare that they have no conflict of interest.
This article is part of the special issue “Interactions between planktonic organisms and biogeochemical cycles across trophic and N2 fixation gradients in the western tropical South Pacific Ocean: a multidisciplinary approach (OUTPACE experiment)”. It is not associated with a conference.
This work is part of the OUTPACE Experiment project
(https://outpace.mio.univ-amu.fr/, last access: 10 September 2018) funded by the Agence Nationale de la
Recherche (grant ANR-14-CE01-0007-01), the LEFE-CyBER program (CNRS-INSU),
the Institut de Recherche pour le Développement (IRD), the GOPS program
(IRD) and the CNES (BC T23, ZBC 4500048836), and the European FEDER Fund
under project 1166-39417. The OUTPACE cruise
(https://doi.org/10.17600/15000900) was managed by the MIO (OSU Institut
Pytheas, AMU) from Marseilles (France). The BIOSOPE project was funded by the
Centre National de la Recherche Scientifique (CNRS), the Institut des
Sciences de l'Univers (INSU), the Centre National d'Etudes Spatiales (CNES), the European Space Agency (ESA), The National Aeronautics and Space
Administration (NASA), and the Natural Sciences and Engineering Research
Council of Canada (NSERC). This is a contribution to the BIOSOPE project of
the LEFE-CYBER program. The project leading to this publication has received
funding from the European FEDER Fund under project 1166-39417. We warmly thank
the captain, crew and CTD operators on board R/V l'Atalante during both
cruises. We further acknowledge Fernando Gomez for providing diatom cell
counts during BIOSOPE, Nicole Garcia and Patrick Raimbault for nutrient analyses
during BIOSOPE, Jeremy Young at University College of London for allowing
the use of Parmale image from the Nannotax website, and Mathieu Caffin for
providing a NanoSIMS image of Synechococcus collected during OUTPACE showing
cellular Si accumulation.
Edited by: Douglas G. Capone
Reviewed by: three anonymous referees
Aminot, A. and Kérouel, R.: Dosage automatique des nutriments dans les eaux marines: méthodes en flux continu, Editions Quae, Ifremer, Brest, France, 189 pp., 2007. a
Assmy, P., Henjes, J., Klaas, C., and Smetacek, V.: Mechanisms determining species dominance in a phytoplankton bloom induced by the iron fertilization experiment EisenEx in the Southern Ocean, Deep-Sea Res. Pt. I, 54, 340–362, https://doi.org/10.1016/j.dsr.2006.12.005, 2007. a
Avaria, S. and Munoz, P.: Effects of the 1982-1983 El Nino on the marine phytoplankton off Northern Chile, J. Geophys. Res., 92, 14369–14382, 1987. a
Baines, S. B., Twining, B. S., Brzezinski, M. A., Krause, J. W., Vogt, S., Assael, D., and McDaniel, H.: Significant silicon accumulation by marine picocyanobacteria, Nat. Geosci., 5, 886–891, https://doi.org/10.1038/ngeo1641, 2012. a, b, c
BIOSOPE: BIOSOPE cruise database, available at: http://www.obs-vlfr.fr/proof/vt/op/ec/biosope/bio.htm, last access: 30 August 2018.
Blain, S., Leynaert, A., Tréguer, P. J., Chrétiennot-Dinet, M.-J., and Rodier, M.: Biomass, growth rates and limitation of Equatorial Pacific diatoms, Dep-Sea Res. Pt. I, 44, 1255–1275, https://doi.org/10.1016/S0967-0637(97)00014-9, 1997. a, b, c, d
Blain, S., Bonnet, S., and Guieu, C.: Dissolved iron distribution in the tropical and sub tropical South Eastern Pacific, Biogeosciences, 5, 269–280, https://doi.org/10.5194/bg-5-269-2008, 2008. a
Bonnet, S., Berthelot, H., Turk-Kubo, K., Fawcett, S., Rahav, E., L'Helguen, S., and Berman-Frank, I.: Dynamics of N2 fixation and fate of diazotroph-derived nitrogen in a low-nutrient, low-chlorophyll ecosystem: results from the VAHINE mesocosm experiment (New Caledonia), Biogeosciences, 13, 2653–2673, https://doi.org/10.5194/bg-13-2653-2016, 2016. a, b, c
Bonnet, S., Caffin, M., Berthelot, H., and Moutin, T.: Hot spot of N2fixation in the western tropical South Pacific pleads for a spatial decoupling between N2 fixation and denitrification, P. Natl. Acad. Sci. USA, 114, E2800–E2801, https://doi.org/10.1073/pnas.1619514114, 2017. a
Bonnet, S., Caffin, M., Berthelot, H., Grosso, O., Benavides, M., Helias-Nunige, S., Guieu, C., Stenegren, M., and Foster, R. A.: In-depth characterization of diazotroph activity across the western tropical South Pacific hotspot of N2 fixation (OUTPACE cruise), Biogeosciences, 15, 4215–4232, https://doi.org/10.5194/bg-15-4215-2018, 2018. a
Brzezinski, M. A. and Kosman, C. A.: Silica production in the Sargasso Sea during spring 1989, Mar. Ecol. Prog. Ser., 142, 39–45, 1996. a
Brzezinski, M. A. and Nelson, D. M.: The annual silica cycle in the Sargasso Sea near Bermuda, Deep-Sea Res. Pt. I, 42, 1215–1237, https://doi.org/10.1016/0967-0637(95)93592-3, 1995. a
Brzezinski, M. A. and Phillips, D. R.: Evaluation of 32Si as a tracer for measuring silica production rates in marine waters, Limnol. Oceanogr., 42, 856–865, https://doi.org/10.4319/lo.1997.42.5.0856, 1997. a
Brzezinski, M. A., Dumousseaud, C., Krause, J. W., Measures, C. I., and Nelson, D. M.: Iron and silicic acid concentrations together regulate Si uptake in the equatorial Pacific Ocean, Limnol. Oceanogr., 53, 875–889, https://doi.org/10.4319/lo.2008.53.3.0875, 2008. a
Brzezinski, M. A., Krause, J. W., Church, M. J., Karl, D. M., Li, B., Jones, J. L., and Updyke, B.: The annual silica cycle of the North Pacific subtropical gyre, Deep-Sea Res. Pt. I, 58, 988–1001, https://doi.org/10.1016/j.dsr.2011.08.001, 2011. a, b, c, d, e
Brzezinski, M. A., Krause, J. W., Baines, S. B., Collier, J. L., Ohnemus, D. C., and Twining, B. S.: Patterns and regulation of silicon accumulation in Synechococcus spp., J. Phycol., 53, 746–761, https://doi.org/10.1111/jpy.12545, 2017. a, b
Buck, K. R. and Chavez, F. P.: Diatom aggregates from the open ocean, J. Plankton Res., 16, 1449–1457, https://doi.org/10.1093/plankt/16.10.1449, 1994. a
Caffin, M., Berthelot, H., Cornet-Barthaux, V., Barani, A., and Bonnet, S.: Transfer of diazotroph-derived nitrogen to the planktonic food web across gradients of N2 fixation activity and diversity in the western tropical South Pacific Ocean, Biogeosciences, 15, 3795–3810, https://doi.org/10.5194/bg-15-3795-2018, 2018. a, b
Calil, P. H., Doney, S. C., Yumimoto, K., Eguchi, K., and Takemura, T.: Episodic upwelling and dust deposition as bloom triggers in low-nutrient, low-chlorophyll regions, J. Geophys. Res.-Oceans, 116, 1–16, https://doi.org/10.1029/2010JC006704, 2011. a
Carlotti, F., Pagano, M., Guilloux, L., Donoso, K., Valdés, V., and Hunt, B. P. V.: Mesozooplankton structure and functioning in the western tropical South Pacific along the 20∘ parallel south during the OUTPACE survey (February–April 2015), Biogeosciences Discuss., https://doi.org/10.5194/bg-2017-573, in review, 2018. a
Carpenter, E. J.: Marine Cyanobacterial Symbioses, Biol. Environ., 102B, 15–18, 2002. a
Chavez, F. P., Buck, K. R., and Barber, R. T.: Phytoplankton taxa in relation to primary production in the equatorial Pacific, Deep-Sea Res., 37, 1733–1752, https://doi.org/10.1016/0198-0149(90)90074-6, 1990. a
Chavez, F. P., Buck, K. R., Coale, K. H., Martin, J. H., DiTullio, G. R., Welschmeyer, N. A., Jacobson, A. C., and Barber, R. T.: Growth rates, grazing, sinking, and iron limitation of equatorial Pacific phytoplankton, Limnol. Oceanogr., 36, 1816–1833, https://doi.org/10.4319/lo.1991.36.8.1816, 1991. a, b
Chavez, F. P., Buck, K. R., Service, S. K., Newton, J., and Barber, R. T.: Phytoplankton variability in the central and eastern tropical Pacific, Deep-Sea Res. Pt. II, 43, 835–870, https://doi.org/10.1016/0967-0645(96)00028-8, 1996. a
Chisholm, S. W.: Phytoplankton Size, in: Primary Productivity and Biogeochemical Cycles in the Sea, Springer US, Boston, MA, USA, 213–237, https://doi.org/10.1007/978-1-4899-0762-2_12, 1992. a
Claustre, H., Sciandra, A., and Vaulot, D.: Introduction to the special section bio-optical and biogeochemical conditions in the South East Pacific in late 2004: the BIOSOPE program, Biogeosciences, 5, 679–691, https://doi.org/10.5194/bg-5-679-2008, 2008. a, b
de Verneil, A., Rousselet, L., Doglioli, A. M., Petrenko, A. A., Maes, C., Bouruet-Aubertot, P., and Moutin, T.: OUTPACE long duration stations: physical variability, context of biogeochemical sampling, and evaluation of sampling strategy, Biogeosciences, 15, 2125–2147, https://doi.org/10.5194/bg-15-2125-2018, 2018. a, b
Devassy, V., Bhattathiri, P., and Qasim, S.: Trichodesmium phenomenon, Indian J. Mar. Sci., 7, 168–186, 1978. a
Dore, J. E., Letelier, R. M., Church, M. J., Lukas, R., and Karl, D. M.: Summer phytoplankton blooms in the oligotrophic North Pacific Subtropical Gyre: Historical perspective and recent observations, Prog. Oceanogr., 76, 2–38, https://doi.org/10.1016/j.pocean.2007.10.002, 2008. a, b
Dugdale, R. C. and Wilkerson, F. P.: Silicate regulation of new production in the equatorial Pacific upwelling, Nature, 391, 270–273, https://doi.org/10.1038/34630, 1998. a, b
Fryxell, G. A. and Kaczmarska, I.: Specific variability in Fe-enriched cultures from the equatorial Pacific, J. Plankton Res., 16, 755–769, https://doi.org/10.1093/plankt/16.7.755, 1994. a, b
Fumenia, A., Moutin, T., Bonnet, S., Benavides, M., Petrenko, A., Helias Nunige, S., and Maes, C.: Excess nitrogen as a marker of intense dinitrogen fixation in the Western Tropical South Pacific Ocean: impact on the thermocline waters of the South Pacific, Biogeosciences Discuss., https://doi.org/10.5194/bg-2017-557, in review, 2018. a
Gómez, F., Claustre, H., Raimbault, P., and Souissi, S.: Two High-Nutrient Low-Chlorophyll phytoplankton assemblages: the tropical central Pacific and the offshore Perú-Chile Current, Biogeosciences, 4, 1101–1113, https://doi.org/10.5194/bg-4-1101-2007, 2007. a, b, c, d
Grob, C., Ulloa, O., Claustre, H., Huot, Y., Alarcón, G., and Marie, D.: Contribution of picoplankton to the total particulate organic carbon concentration in the eastern South Pacific, Biogeosciences, 4, 837–852, https://doi.org/10.5194/bg-4-837-2007, 2007. a
Guieu, C., Bonnet, S., Petrenko, A., Menkes, C., Chavagnac, V., Desboeufs, K., Maes, C., and Moutin, T.: Iron from a submarine source impacts the productive layer of the Western Tropical South Pacific (WTSP), Sci. Rep.-UK, 8, 9075, https://doi.org/10.1038/s41598-018-27407-z, 2018. a
Guillard, R. R. L. and Kilham, P.: The ecology of marine planktonic diatoms, in: The biology of diatoms, Blackwell, Oxford, UK, 13, 372–469, 1977. a, b, c, d, e
Hasle, G. R.: A quantitative study of phytoplankton from the equatorial Pacific, Deep-Sea Res., 6, 38–59, https://doi.org/10.1016/0146-6313(59)90055-3, 1959. a
Ichinomiya, M., dos Santos, A. L., Gourvil, P., Yoshikawa, S., Kamiya, M., Ohki, K., Audic, S. S., De Vargas, C., Noël, M. H., Vaulot, D., Kuwata, A., Noel, M.-H., Vaulot, D., and Kuwata, A.: Diversity and oceanic distribution of the Parmales (Bolidophyceae), a picoplanktonic group closely related to diatoms, ISME J., 10, 2419–2434, https://doi.org/10.1038/ismej.2016.38, 2016. a
Iriarte, J. L. and Fryxell, G. A.: Micro-phytoplankton at the equatorial Pacific (140∘ W) during the JGOFS EqPac Time Series studies: March to April and October 1992, Deep-Sea Res. Pt. II, 42, 559–583, https://doi.org/10.1016/0967-0645(95)00031-K, 1995. a, b, c
Jimenez, R.: Composition and distribution of phytoplankton in the upwelling system of the Galapagos Islands, Coast. Est. S., 1, 39–43, https://doi.org/10.1029/CO001p0327, 1981. a
Kaczmarska, I. and Fryxell, G. A.: Micro-phytoplankton of the equatorial Pacific: 140∘ W meridianal transect during the 1992 El Niño, Deep-Sea Res. Pt. II, 42, 535–558, https://doi.org/10.1016/0967-0645(95)00039-S, 1995. a
Krause, J. W., Nelson, D. M., and Lomas, M. W.: Biogeochemical responses to late-winter storms in the Sargasso Sea, II: Increased rates of biogenic silica production and export, Deep-Sea Res. Pt. I, 56, 861–874, https://doi.org/10.1016/j.dsr.2009.01.002, 2009. a
Krause, J. W., Nelson, D. M., and Lomas, M. W.: Production, dissolution, accumulation, and potential export of biogenic silica in a Sargasso Sea mode-water eddy, Limnol. Oceanogr., 55, 569–579, https://doi.org/10.4319/lo.2009.55.2.0569, 2010. a
Krause, J. W., Brzezinski, M. A., Villareal, T. A., and Wilson, C.: Biogenic silica cycling during summer phytoplankton blooms in the North Pacific subtropical gyre, Deep-Sea Res. Pt. I, 71, 49–60, https://doi.org/10.1016/j.dsr.2012.09.002, 2013. a
Krause, J. W., M. A. Brzezinski, S. B. Baines, J. L. Collier, B. S. Twining, and D. C. Ohnemus.: Picoplankton contribution to biogenic silica stocks and production rates in the Sargasso Sea, Global Biogeochem. Cy., 31, 762–774, https://doi.org/10.1002/2017GB005619, 2017. a, b, c
Leblanc, K. and Cornet, V.: Biogenic and lithogenic particulate silica, diatom abundance and C biomass data during the OUTPACE (2015) cruise, SEANOE, available at: https://doi.org/10.17882/55743, 2018.
Leblanc, K., Hare, C. E., Boyd, P. W., Bruland, K. W., Sohst, B., Pickmere, S., Lohan, M. C., Buck, K. N., Ellwood, M. J., and Hutchins, D. A.: Fe and Zn effects on the Si cycle and diatom community structure in two contrasting high and low-silicate HNLC areas, Deep-Sea Res. Pt. I, 52, 1842–1864, https://doi.org/10.1016/j.dsr.2005.06.005, 2005a. a
Leblanc, K., Leynaert, A., Fernandez, C. I., Rimmelin, P., Moutin, P., Raimbault, P., Ras, J., and Quéguiner, B.: A seasonal study of diatom dynamics in the North Atlantic during the POMME experiment (2001): Evidence for Si limitation of the spring bloom, J. Geophys. Res., 110, C07S14, https://doi.org/10.1029/2004JC002621, 2005b. a
Leblanc, K., Arístegui, J., Armand, L., Assmy, P., Beker, B., Bode, A., Breton, E., Cornet, V., Gibson, J., Gosselin, M.-P., Kopczynska, E., Marshall, H., Peloquin, J., Piontkovski, S., Poulton, A. J., Quéguiner, B., Schiebel, R., Shipe, R., Stefels, J., van Leeuwe, M. A., Varela, M., Widdicombe, C., and Yallop, M.: A global diatom database – abundance, biovolume and biomass in the world ocean, Earth Syst. Sci. Data, 4, 149–165, https://doi.org/10.5194/essd-4-149-2012, 2012. a
Leblanc, K., Cornet, V., Caffin, M., Rodier, M., Desnues, A., Berthelot, H., Turk-Kubo, K., and Heliou, J.: Phytoplankton community structure in the VAHINE mesocosm experiment, Biogeosciences, 13, 5205–5219, https://doi.org/10.5194/bg-13-5205-2016, 2016. a, b, c
Leblanc, K., Quéguiner, B., Diaz, F., Cornet, V., Michel-Rodriguez, M., Durrieu De Madron, X., Bowler, C., Malviya, S., Thyssen, M., Grégori, G., Rembauville, M., Grosso, O., Poulain, J., De Vargas, C., Pujo-Pay, M., and Conan, P.: Nanoplanktonic diatoms are globally overlooked but play a role in spring blooms and carbon export, Nat. Commun., 9, 9, 1–12, https://doi.org/10.1038/s41467-018-03376-9, 2018. a, b
Leynaert, A.: La production de silice biogenique dans l'océan: de la mer de Weddell à l'océan antarctique, phD, Paris, France, 1993.
Leynaert, A., Tréguer, P. J., Lancelot, C., and Rodier, M.: Silicon limitation of biogenic silica production in the Equatorial Pacific, Deep-Sea Res. Pt. I, 48, 639–660, https://doi.org/10.1016/S0967-0637(00)00044-3, 2001. a, b
Moutin, T., Karl, D. M., Duhamel, S., Rimmelin, P., Raimbault, P., Van Mooy, B. A. S., and Claustre, H.: Phosphate availability and the ultimate control of new nitrogen input by nitrogen fixation in the tropical Pacific Ocean, Biogeosciences, 5, 95–109, https://doi.org/10.5194/bg-5-95-2008, 2008. a
Moutin, T., Doglioli, A. M., de Verneil, A., and Bonnet, S.: Preface: The Oligotrophy to the UlTra-oligotrophy PACific Experiment (OUTPACE cruise, 18 February to 3 April 2015), Biogeosciences, 14, 3207–3220, https://doi.org/10.5194/bg-14-3207-2017, 2017. a, b, c
Moutin, T., Wagener, T., Caffin, M., Fumenia, A., Gimenez, A., Baklouti, M., Bouruet-Aubertot, P., Pujo-Pay, M., Leblanc, K., Lefevre, D., Helias Nunige, S., Leblond, N., Grosso, O., and de Verneil, A.: Nutrient availability and the ultimate control of the biological carbon pump in the western tropical South Pacific Ocean, Biogeosciences, 15, 2961–2989, https://doi.org/10.5194/bg-15-2961-2018, 2018. a
Nelson, D. M. and Brzezinski, M. A.: Diatom growth and productivity in an oligo-trophic midocean gyre: A 3-yr record from the Sargasso Sea near Bermuda, Limnol. Oceanogr., 42, 473–486, https://doi.org/10.4319/lo.1997.42.3.0473, 1997. a, b, c
Nelson, D. M. and Goering, J. J.: Assimilation of silicic acid by phytoplankton in the Baja California and northwest Africa upwelling systems, Limnol. Oceanogr., 23, 508–517, https://doi.org/10.4319/lo.1978.23.3.0508, 1978. a
Nelson, D. M., Smith, W. O., Muench, R. D., Gordon, L. I., Sullivan, C. W., and Husby, D. M.: Particulate matter and nutrient distributions in the ice-edge zone of the Weddell Sea: relationship to hydrography during late summer, Deep-Sea Res., 36, 191–209, https://doi.org/10.1016/0198-0149(89)90133-7, 1989. a
Nelson, D. M., Tréguer, P. J., Brzezinski, M. A., Leynaert, A., and Quéguiner, B.: Production and dissolution of biogenic silica in the ocean: Revised global estimates, comparison with regional data and relationship to biogenic sedimentation, Global Biogeochem. Cy., 9, 359–372, https://doi.org/10.1029/95GB01070, 1995. a, b, c
Nelson, D. M. Goering, J. J., and Boisseau, D. W.: Consumption and Regeneration of Silicic Acid in Three Coastal Upwelling Systems, American Geophysical Union (AGU), 242–256, https://doi.org/10.1029/CO001p0242, 2013. a
Ohnemus, D. C., Rauschenberg, S., Krause, J. W., Brzezinski, M. A., Collier, J. L., Geraci-Yee, S., Baines, S. B., and Twining, B. S.: Silicon content of individual cells of Synechococcus from the North Atlantic Ocean, Mar. Chem., 187, 16–24, https://doi.org/10.1016/j.marchem.2016.10.003, 2016. a, b, c, d
OUTPACE: OUTPACE cruise database, available at: http://www.obs-vlfr.fr/proof/php/outpace/outpace.php, last access: 30 August 2018.
Paasche, E.: Silicon and the ecology of marine plankton diatoms. I. Thalassiosira pseudonana (Cyclotella nana) grown in a chemostat with silicate as limiting nutrient, Mar. Biol., 19, 117–126, https://doi.org/10.1007/BF00353582, 1973. a
Quéguiner, B.: Iron fertilization and the structure of planktonic communities in high nutrient regions of the Southern Ocean, Deep-Sea Res. II, 90, 43–54, https://doi.org/10.1016/j.dsr2.2012.07.024, 2013. a
Quéguiner, B. and Rimmelin, P.: Biogenic and lithogenic particulate silica collected during the BIOSOPE (2004) cruise, SEANOE, available at: https://doi.org/10.17882/55722, 2018.
Raimbault, P., Garcia, N., and Cerutti, F.: Distribution of inorganic and organic nutrients in the South Pacific Ocean – evidence for long-term accumulation of organic matter in nitrogen-depleted waters, Biogeosciences, 5, 281–298, https://doi.org/10.5194/bg-5-281-2008, 2008. a
Ras, J., Claustre, H., and Uitz, J.: Spatial variability of phytoplankton pigment distributions in the Subtropical South Pacific Ocean: comparison between in situ and predicted data, Biogeosciences, 5, 353–369, https://doi.org/10.5194/bg-5-353-2008, 2008. a, b, c, d, e
Rivera, P., Herrera, L., and Barrales, H.: Report of two species of Thalassiosira (Bacillariophyceae): T. rotula Meunier and T. anguste-lineata (A. Schmidt) Fryxell et Hasle, as new to northern Chile, Cryptogamie Algol., 17, 123–130, 1996. a
Semina, H. and Levashova, S.: the Biogeography of Tropical Phytoplankton Species in the Pacific-Ocean, Int. Rev. Ges. Hydrobio., 78, 243–262, 1993. a
Shipe, R. F., Brzezinski, M. A., Pilskaln, C., and Villareal, T. A.: Rhizosolenia mats: An overlooked source of silica production in the open sea, Limnol. Oceanogr., 44, 1282–1292, 1999. a
Stenegren, M., Caputo, A., Berg, C., Bonnet, S., and Foster, R. A.: Distribution and drivers of symbiotic and free-living diazotrophic cyanobacteria in the western tropical South Pacific, Biogeosciences, 15, 1559–1578, https://doi.org/10.5194/bg-15-1559-2018, 2018. a
Strickland, J. D. H. and Parsons, T. R.: A practical handbook of seawater analysis, Fisheries Research Board of Canada Bulletin, Ottawa, Canada, 167, 65–70, 1972. a
Tréguer, P. J. and De La Rocha, C. L.: The world ocean silica cycle, Annu. Rev. Mar. Sci., 5, 477–501, https://doi.org/10.1146/annurev-marine-121211-172346, 2013. a, b
Tréguer, P. and Van Bennekom, A. J.: The annual production of biogenic silica in the Antarctic Ocean, Mar. Chem., 35, 477–487, 1991.
Villareal, T. A., Adornato, L., Wilson, C., and Schoenbaechler, C. A.: Summer blooms of diatom-diazotroph assemblages and surface chlorophyll in the North Pacific gyre: A disconnect, J. Geophys. Res., 116, C03001, https://doi.org/10.1029/2010JC006268, 2011. a, b
Wilson, C.: Chlorophyll anomalies along the critical latitude at 30N in the NE Pacific, Geophys. Res. Lett., 38, 1–6, https://doi.org/10.1029/2011GL048210, 2011. a, b