the Creative Commons Attribution 4.0 License.
the Creative Commons Attribution 4.0 License.
 | 21 Feb 2020
Intercomparison of four methods to estimate coral calcification under various environmental conditions
Miguel Gómez Batista
Marc Metian
François Oberhänsli
Simon Pouil
Peter W. Swarzenski
Eric Tambutté
Jean-Pierre Gattuso
Carlos M. Alonso Hernández
Frédéric Gazeau
Coral reefs are constructed by calcifiers that precipitate calcium carbonate to build their shells or skeletons through the process of calcification. Accurately assessing coral calcification rates is crucial to determine the health of these ecosystems and their response to major environmental changes such as ocean warming and acidification. Several approaches have been used to assess rates of coral calcification, but there is a real need to compare these approaches in order to ascertain that high-quality and intercomparable results can be produced. Here, we assessed four methods (total alkalinity anomaly, calcium anomaly, 45Ca incorporation, and 13C incorporation) to determine coral calcification of the reef-building coral Stylophora pistillata. Given the importance of environmental conditions for this process, the study was performed under two starting pH levels (ambient: 8.05 and low: 7.2) and two light (light and dark) conditions. Under all conditions, calcification rates estimated using the alkalinity and calcium anomaly techniques as well as 45Ca incorporation were highly correlated. Such a strong correlation between the alkalinity anomaly and 45Ca incorporation techniques has not been observed in previous studies and most probably results from improvements described in the present paper. The only method which provided calcification rates significantly different from the other three techniques was 13C incorporation. Calcification rates based on this method were consistently higher than those measured using the other techniques. Although reasons for these discrepancies remain unclear, the use of this technique for assessing calcification rates in corals is not recommended without further investigations.
- Article
(1117 KB) -
Supplement
(168 KB) - BibTeX
- EndNote


Calcification is the fundamental biological process by which organisms precipitate calcium carbonate. Calcifying organisms take up calcium and carbonate or bicarbonate ions to build their biomineral structures (aragonite, calcite, and/or vaterite) which have physiological, ecological, and biogeochemical functions. Moreover, calcium carbonate plays a major role in the services provided by ecosystems to human societies. The ocean has absorbed large amounts of anthropogenic CO2 since the start of the industrial revolution and is currently sequestering about 22 % of CO2 emissions (average 2008–2017; Le Quéré et al., 2018). This massive input of CO2 in the ocean impacts seawater chemistry with a decrease in seawater pH and carbonate ion concentrations [] and an increase in CO2 and bicarbonate concentrations []. These fundamental changes to the carbonate system are referred to as “ocean acidification” (OA; Gattuso and Hansson, 2011). Models project that the average surface water pH will drop by 0.06 to 0.32 pH units by the end of the century (IPCC, 2014).
The effect of OA is currently the subject of intense research with particular attention to organisms producing CaCO3. For instance, coral communities have already proven to be particularly vulnerable to rapidly changing global environmental conditions (e.g., Albright et al., 2018). In order to help project the future of coral reefs, accurate estimates of calcification rates during realistic perturbation experiments are necessary in order to produce high-quality and intercomparable results (Cohen et al., 2017; Gazeau et al., 2015; Langdon et al., 2010; Riebesell et al., 2010; Schoepf et al., 2017).
Several methods are available to quantify rates of coral calcification. Calcification can be measured as the increase in CaCO3 mass (e.g., the buoyant weight technique; Jokiel et al., 1978) or following the incorporation of radio-labeled carbon or calcium in the skeleton (Goreau, 1959), but also through the quantification of changes in a seawater constituent that is stoichiometrically related to the amount of CaCO3 precipitated. For instance, the alkalinity anomaly technique (Smith and Key, 1975) has been widely used to estimate net calcification of organisms and communities, especially of corals and coral reef environments (e.g., Smith and Kinsey, 1978; Gazeau et al., 2015; Albright et al., 2016; Cyronak et al., 2018). Total alkalinity (AT) is directly influenced by bicarbonate and carbonate ion concentrations together with a multitude of other minor compounds (Wolf-Gladrow et al., 2007). Calcification consumes carbonate or bicarbonate, following the reversible reaction
Calcification consumes 2 mol of , hence decreasing AT by 2 mol mol−1 of CaCO3 produced (Reaction R1). It is possible to derive the rate of net calcification (gross calcification – dissolution) by measuring AT before and after incubating an organism or a community. This method assumes, however, that calcification is the only biological process influencing AT (Smith and Key, 1975). Nitrogen assimilation through photosynthetic activities, nitrification, and aerobic and anaerobic remineralization of organic matter is known to impact AT through the consumption or release of nutrients (ammonium, nitrate, and phosphate) and protons (Wolf-Gladrow et al., 2007). While for some group of species (e.g., bivalves, sea urchins), corrections appear necessary to take into account the effect of nutrient release on AT, changes in nutrient concentrations during incubations of isolated corals are too low (i.e., several orders of magnitude lower than changes in AT) to introduce a significant bias in the calculations (Gazeau et al., 2015).
In contrast to AT, the concentration of calcium (Ca2+) in seawater is only biologically influenced by net calcification, and a 1 : 1 relationship can be used to derive net calcification rates (Reaction R1). The depletion of AT and Ca2+ needs to be corrected for gains of AT and Ca2+ resulting from evaporation. These corrections can be applied through the incubation of seawater in the absence of coral (Schoepf et al., 2017). Both the alkalinity anomaly and calcium anomaly methods are nondestructive and typically show a good agreement (Chisholm and Gattuso, 1991; Murillo et al., 2014; Gazeau et al., 2015).
The 45Ca incorporation technique has been used since the 1950s (Goreau and Bowen, 1955; Goreau, 1959). While earlier techniques showed low reproducibility, methodological improvements led to a significant reduction of the deviations between replicates (see Tambutté et al., 1995, for more details). The strength of this method is that it is extremely sensitive for measuring short-term variations in gross calcification rates. However, in contrast to the AT and Ca2+ anomaly techniques, it is a sample-destructive method.
Previous studies designed to compare calcification rate estimates using the 45Ca incorporation and AT anomaly methods revealed subtle discrepancies. For example, Smith and Kinsey (1978) reported an overestimation of rates based on the 45Ca method. In contrast, Tambutté et al. (1995) and Cohen et al. (2017) reported a decrease in AT without concomitant incorporation of 45Ca, therefore suggesting an overestimation of calcification derived from AT measurements. However, during these studies, in order to avoid radioactive contamination of laboratory equipment, estimates of calcification were not performed during the same incubations, but rather during incubations performed over 2 consecutive days.
In contrast to the 45Ca incorporation method, to the best of our knowledge, no studies have used carbon-based incorporation techniques to estimate coral calcification rates in the framework of ocean acidification. Past studies that compared carbon and calcium incorporation rates in coral skeletons based on a double labeling technique with H14CO3 and 45Ca showed that only a minor proportion of the labeled seawater carbon is incorporated in the skeleton (e.g., Marshall and Wright, 1998) and that the major source of dissolved inorganic carbon for calcification is metabolic CO2 (70 %–75 % of the total CaCO3 deposition; Furla et al., 2000). Consequently, under both light and dark conditions, the rate of 45Ca deposition appears greater than the rate of 14C incorporation (Furla et al., 2000). To the best of our knowledge, only one study estimated calcification rates of a benthic calcifier (coralline algae) using a stable carbon isotopic technique through addition of 13C-labeled bicarbonate (McCoy et al., 2016). The present study aimed at comparing calcification rates measured using the alkalinity and calcium anomaly methods, as well as the 45Ca and 13C incorporation techniques, under different pH and light conditions.
Colonies of the reef-building coral Stylophora pistillata were incubated in the laboratory, in both the light and dark, under ambient and lowered pH conditions. At ambient pH (experiment conducted in July–August 2017), two sets of incubations were performed using either 45Ca or 13C additions, and calcification rates based on these techniques were compared to those derived, during the same incubations, by the alkalinity and calcium anomaly techniques. At lowered pH (experiment conducted in August 2018), no incubations with 13C addition were conducted and only the three other techniques were compared.
2.1 Biological material and experimental set-up
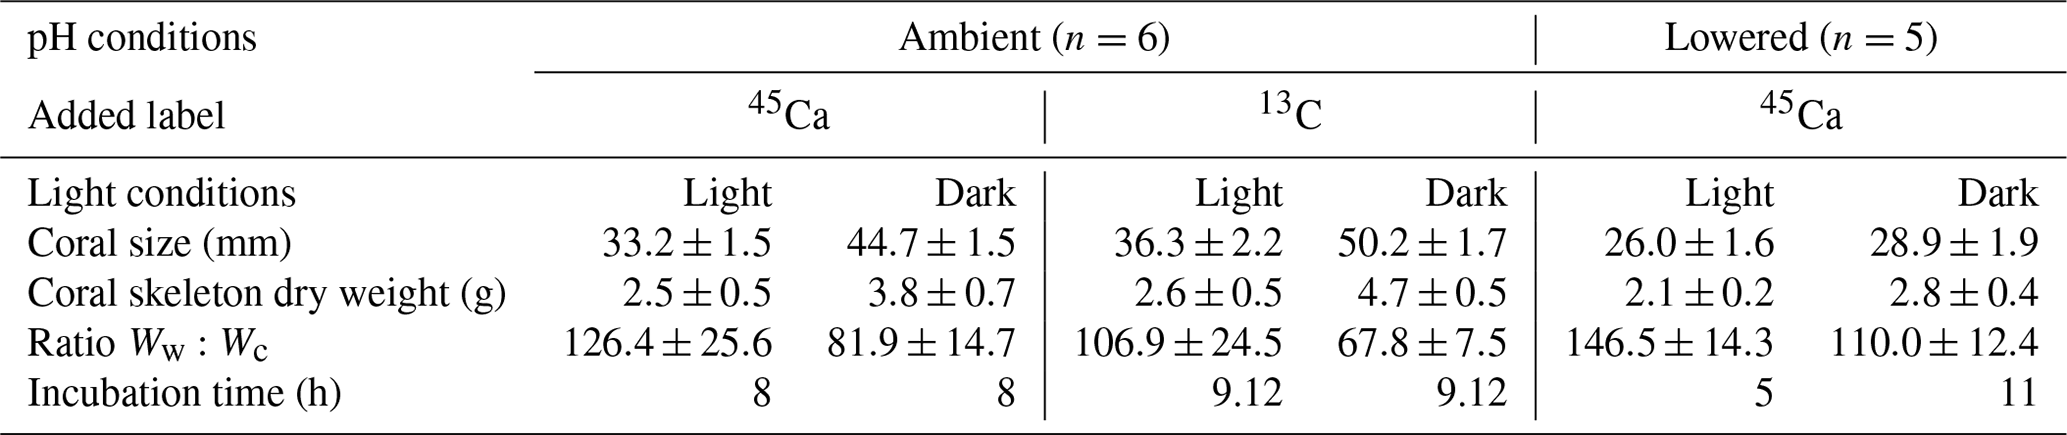
Specimens used in this experiment originated from colonies of the coral Stylophora pistillata (Esper 1797) initially sampled in the Gulf of Aqaba (Red Sea, Jordan) and transferred to the Scientific Centre of Monaco where they were cultivated under controlled conditions for several years. In June 2017, 40 terminal portion branches of S. pistillata, free of boring organisms, were cut from four different parent colonies (10 branches per parent colony) and suspended by nylon lines to allow tissues to fully cover the exposed skeleton for at least 5 weeks (Tambutté et al., 1995; Houlbrèque et al., 2015). The nubbins were fed with rotifers (once a day) and Artemia nauplii (twice a week; ca. 1 nauplius mL−1) and kept in 70 L aquaria (water renewal: 2 L min−1) under an irradiance of 200 µmol photons m−2 s−1 (12 : 12 light : dark photoperiod, light banks: HQI 250W Nepturion – BLV, Germany), a seawater temperature of 25±0.5 ∘C, and a salinity of 38±0.5. Water motion was provided by a submersible pump (Mini-jet MN 606; RENA©). Before the start of the experiment, specimens were transferred to the International Atomic Energy Agency (IAEA). For the second set of experiments in 2018, nubbins were prepared in June 2018 and cultured, under the conditions described above, at IAEA except that colonies were fed twice a week with newly hatched brine shrimp nauplii (ca. 1 nauplius mL−1). Biometric parameters (size, weight) of the biological material are shown in Table 1.
Table 1Experimental details for the series of incubations of the coral Stylophora pistillata performed under ambient and low pH, and in the light and dark following 45Ca or 13C labeling. The ratio Ww:Wc corresponds to the ratio between seawater weight (g) and skeletal dry weight (g). Values represent mean ± standard deviation (SD); n is the number of true replicates considered for each experiment. All incubations were conducted at 25±0.5 ∘C.
Different types of incubations were conducted. In July–August 2017; one set of incubations was performed under ambient pH conditions with the addition of radioactive calcium dichloride (45CaCl2). During the same period, another set of incubations was performed, under ambient pH conditions, with the addition of 13C-labeled sodium bicarbonate (13C-NaHCO3 99 %). Finally, in August 2018, one set of incubations was performed under lowered pH conditions (see thereafter for more details) with the addition of 45CaCl2. For all sets of incubations, organisms were incubated for 5 to 11 h (Table 1), in both the light and dark, in 500 mL polyethylene beakers equipped with a magnetic stirrer (Fig. 1). Six and five replicates were used, respectively, at ambient and low pH. Furthermore, for all sets of incubations, one beaker was incubated, under the same conditions as the other beakers, without coral and served as a control.

Figure 1Scheme of the polyethylene container in which a coral nubbin is suspended with a nylon line and covered with a transparent film.
For each set of incubations, 2.4 L of seawater, pumped continuously from offshore of the IAEA Monaco premises at 60 m depth, was filtered onto 0.2 µm (GF/F, 47 mm). For incubations performed at lowered pH conditions, pure CO2 was bubbled in the 2.4 L initial seawater batch using an automated pH-stat system (IKS Aquastar©) until the target pH was reached. The pH electrode from the pH-stat system was intercalibrated using a glass combination electrode (Metrohm, Ecotrode Plus) calibrated on the total scale using a TRIS buffer solution with a salinity of 35 (provided by Andrew Dickson, Scripps Institution of Oceanography, San Diego). Initial pHT (total scale) levels were set to ∼7.2. It must be stressed that pH levels were not regulated during the incubations. For 45Ca incubations, this initial batch was spiked with 45CaCl2 to reach a nominal activity of ∼15 Bq mL−1. As we anticipated lower calcification rates during the set of experiments conducted at low pH, initial nominal activity was set to ∼30 Bq mL−1. Before distributing seawater to the experimental beakers, a 1 mL aliquot of seawater was removed for the precise determination of the initial activity. Samples were stored, in the dark, in high-performance glass vials for 24 h before counting. For 13C incubations, to determine the seawater background isotopic level (δ13C) of the dissolved inorganic carbon pool (δ13C-CT), three 27 mL samples were collected and gently transferred to glass vials avoiding bubbles. Then, ∼8.95 mg of 13C NaHCO3 was added to the batch of filtered ambient seawater to increase δ13C-CT to ca. 1500 ‰. For the determination of δ13C-CT after enrichment, two 27 mL samples were handled as described above. The vials were then sealed after being poisoned with 10 µL of saturated mercuric chloride (HgCl2) and stored upside-down at room temperature in the dark for subsequent analysis.
For all sets of incubations, samples for the measurements of pHT, AT (200 mL), and Ca2+ concentrations (50 mL) were taken before distributing seawater to the experimental beakers. While pHT was measured immediately after sampling, samples for AT measurements were poisoned with 40 µL of 50 % saturated HgCl2 and stored in the dark at 4 ∘C pending analysis less than 2 weeks later. Samples for [Ca2+] measurements were not poisoned and were stored in the dark at 4 ∘C pending analysis less than 2 weeks after sampling.
Gravimetrically determined amounts of filtered seawater (ca. 300 g) were transferred to the incubation containers which were placed in a temperature-controlled (IKS Aquastar©) water bath maintained at 25±0.5 ∘C. Coral nubbins were suspended with a nylon line in the experimental beakers 5 cm below the water level covered with transparent film to limit evaporation (Fig. 1). During the low-pH incubations conducted in 2018, to avoid physiological stress, coral nubbins were acclimated by gradually lowering pH to the target levels during 24 h. This acclimation was performed in an open-flow 20 L aquarium (one full water renewal per hour) using a pH-stat system as previously described and with a pH decrease of ca. 0.03 units h−1.
Incubations in the light were performed at an irradiance of 200 µmol photons m−2 s−1 during daytime whereas dark incubations were conducted at night. Incubation times were not fixed based on scientific considerations and differed between the different incubations due to practical constrains (i.e., access to the lab). Before the beginning of the incubations, all beakers (containing corals) were precisely weighed at ±0.01 g (Sartorius BP 310S).
At the conclusion of the incubations, all beakers were precisely weighed to evaluate evaporation, and seawater samples were analyzed for pHT, AT, and [Ca2+] as well as for 45Ca activity or δ13C-CT depending on the type of incubations. pHT was measured immediately and samples for AT and [Ca2+] determinations were filtered at 0.2 µm (GF/F, Ø 47 mm), poisoned with saturated HgCl2 (only for AT), and stored in the dark at 4 ∘C pending analysis (within 2 weeks). The corals were then removed from the beakers for the analysis of incorporated 45Ca or 13C. Three additional corals which were not incubated were processed for carbon isotopic composition of the previously accreted calcium carbonate (see Sect. 2.3).
2.2 Analytical techniques
Immediately after sampling, pHT was measured on a Metrohm 826 mobile pH logger, and a glass electrode (Metrohm, Ecotrode Plus) was calibrated on the total scale using a TRIS buffer of salinity 35 (provided by Andrew Dickson, Scripps University, USA). AT was determined in triplicate 50 mL subsamples by potentiometric titration on a titrator Titrando 888 (Metrohm) coupled to a glass electrode (Metrohm, Ecotrode Plus) and a thermometer (pt1000). The pH electrode was calibrated before every set of measurements on the total scale using a TRIS buffer of salinity 35 (provided by Andrew Dickson, Scripps University, USA). Measurements were carried out at a constant temperature of 25 ∘C and AT was calculated as described in Dickson et al. (2007). Certified reference material (CRM; batches 143 and 156) provided by Andrew Dickson (Scripps University, USA) was used to check precision (standard deviation within measurements of the same batch) and accuracy (deviation from the certified nominal value). Over the six series of AT measurements performed during the experiment, mean accuracy and precision (± SD) were respectively 7.2±1.2 and 1.2±0.2 µmol kg−1. [Ca2+] was determined in triplicate using the ethylene glycol tetra acetic acid (EGTA) potentiometric titration (Lebel and Poisson, 1976). About 10 g of sampled seawater and 10 g of HgCl2 solution (ca. 1 mmol L−1) were accurately weighed out. Then, about 10 g of a concentrated EGTA solution (ca. 10 mmol L−1, also by weighing) was added to completely complex Hg2+ and to complex nearly 95 % of Ca2+. After adding 10 mL of borate buffer (pHNBS ∼ 10) to increase the pH of the solution, the remaining Ca2+ was titrated by a diluted solution of EGTA (ca. 2 mmol L−1) using a titrator (Titrando 888, Metrohm) coupled to an amalgamated silver combined electrode (Ag Titrode, Metrohm). Following Cao and Dai (2011), the volume of EGTA necessary to titrate the remaining ca. 5 % of Ca2+ was obtained by manually fitting a polynomial function to the first derivative of the titration curve using the function “loess” of the R software (R Development Core Team, 2018). The EGTA solution was calibrated prior to each measurement series using International Association for the Physical Sciences of the Oceans (IAPSO) standard seawater (salinity = 38.005). Mean [Ca2+] precision obtained using this technique was 2.9 µmol kg−1 (n=40), corresponding to a coefficient of variation (CV) of 0.026 %.
To determine the specific activity in radio-labeled seawater, the 1 mL aliquots were transferred to 20 mL glass scintillation vials and mixed in proportion 1 : 10 (v:v) with scintillation liquid Ultima Gold™ XR. According to a method adapted from Tambutté et al. (1995), at the end of incubation sampled nubbins were immersed for 30 min in beakers containing 300 mL of unlabeled seawater to achieve isotopic dilution of the 45Ca contained in the gastrovascular cavity. Constant water motion was provided in the efflux medium by magnetic stirring bars. Tissues were then dissolved completely in 1 mol L−1 NaOH at 90 ∘C for 20 min. The skeleton was rinsed twice in 1 mL NaOH and twice in 5 mL of Milli-Q water. It was then dried for 72 h at 60 ∘C, precisely weighed at ±0.01 g using a Sartorius BP 310S (referred to thereafter as skeleton dry weight), and dissolved in 12 N HCl. Three 200 µL aliquots from each skeleton dissolution were transferred to 20 mL glass scintillation vials and mixed with 10 mL scintillation liquid Ultima Gold™ XR. Radioactive samples were thoroughly mixed to homogenize the solution and kept in the dark for 24 h before counting. The radioactivity of 45Ca was counted using a Tri-Carb 2900 liquid scintillation counter. Counting time was adapted to obtain a propagated counting error of less than 5 % (maximal counting duration was 90 min). Radioactivity was determined by comparison with standards of known activities, and measurements were corrected for counting efficiency and physical radioactive decay.
The analyses of seawater δ13C-CT as well as of the 13C signature of coral calcified tissues were performed at Leuven University. For δ13C-CT analyses, a helium headspace (5 mL) was created in the vials and samples were acidified with 2 mL of phosphoric acid (H3PO4, 99 %). Samples were left to equilibrate overnight to transfer all CT to gaseous CO2. Samples were injected in the carrier gas stream of an EA-IRMS (Thermo EA1110 and Delta V Advantage), and data were calibrated with NBS-19 and LSVEC standards (Gillikin and Bouillon, 2007). Corals were treated following the same protocol as for 45Ca incorporation measurements and powdered. Triplicate subsamples of carbonate powder (∼100 µg) were placed into gas-tight vials, flushed with helium, and converted into CO2 with H3PO4. After 24 h, subsamples of the released CO2 were injected into the EA-IRMS system as described above. Data were calibrated with NBS-19 and LSVEC. Carbon isotope data are expressed in the delta notation (δ) relative to the Vienna Pee Dee Belemnite (VPDB) standard and were calculated as
2.3 Computations and statistics
The carbonate chemistry was assessed using pHT and AT and the R package seacarb (Gattuso et al., 2019). Propagation of errors on computed parameters was performed using the new function “error” of the package seacarb (Orr et al., 2018) on the R software, considering errors associated with the estimation of AT as well as errors on dissociation constants.
Estimates of coral calcification rates based on changes in AT and [Ca2+] during incubations were computed following Eqs. (2) and (3), respectively. As shown in these equations, initial levels of AT and [Ca2+] are not necessary to compute calcification rates and only final values in the incubations with corals and without corals (controls) were used:
where AT1 and Ca1 are AT and Ca2+ concentrations at the start of the incubations (µmol kg−1; not used in the computations); AT2∕AT2c and Ca2∕Ca2c are AT and Ca2+ concentrations at the end of the incubations, respectively with and without corals; t is the incubation duration in hours; and Ww and Wc are respectively the mass of seawater (average between initial and final weights) and the coral skeleton dry weight (g; DW). and GCa are therefore expressed in µmol CaCO3 g DW−1 h−1. Error propagation was used to estimate errors.
Here and correspond to standard errors associated with the measurement of three analytical replicates per sample for AT and Ca2+ at the end of the incubations, respectively with and without corals; t is the incubation duration in hours; and Ww and Wc are respectively the mass of seawater (average between initial and final weights) and the coral skeleton dry weight (g DW).
Coral calcification rates based on 45Ca incorporation were estimated using measured seawater activity and activity recorded in the skeleton digest. Rates were then normalized per gram of skeleton dry weight using the formula
where Activitysample is the average of counts per minute (CPMs) of three 200 µL aliquots from the dissolved skeleton sample, Activityseawater is the total CPMs in the 1 mL seawater samples, Ca is the [Ca2+] measured in the corresponding samples (average between initial and final values, µmol kg−1) and further converted to µmol L−1 considering a temperature of 25 ∘C and a salinity of 38, Wc is the skeleton dry weight (in grams), and t is the incubation duration (in hours). is therefore expressed in µmol CaCO3 g DW−1 h−1. The standard errors for these calcification rate estimates were propagated based on standard errors associated with the measurements of triplicate samples for both Activitysample and [Ca2+].
The precipitation of calcium carbonate minerals (G) during the incubation interval was also estimated using measured δ13C values and isotope mass balance calculations (Eqs. 7 and 8 below). The CO2 released during phosphoric acid digestion is derived from two sources: new coral CaCO3 and previously accreted skeletal carbonate mineral. The new carbon acquired in each measured nubbin (δ13CN) was assumed to have the same carbon isotope composition as the labeled seawater CT (average between initial and final level, δ13C-CT ∼ 1400 ‰–1700 ‰). The previously accreted skeletal material was assumed to have a δ13C value equal to the measured value for the background sample (δ13CP). The δ13C value (δ13CM), representing the mixture of new calcified material and previously accreted carbonate mineral, is then calculated with the following mixing equation:
where fG is the fraction of the calcium carbonate mineral precipitated during the experiment, and δ13CN and δ13CP are the carbon isotope compositions of the newly precipitated and previously accreted calcium carbonate, respectively. Equation (7) was solved for fG to determine the calcium carbonate precipitated during the incubation using
where is the molar mass of calcium carbonate (g mol−1) and t is the incubation duration in hours. is therefore expressed in µmol CaCO3 g DW−1 h−1. The standard errors for these calcification rate estimates were calculated based on standard errors associated with the triplicate measurements of δ13CP and δ13CN.
Model II linear regressions (Sokal and Rohlf, 1995) were used to compare net calcification rates obtained with the different methods. All regressions were performed using the function “lmodel2” of the package lmodel2 (Legendre and Oksanen, 2018) with the R software.
Environmental conditions at the start of the different incubations are shown in Table 2. All values in Table 2 as well as in the text below correspond to the average between replicates (or incubations) ± standard deviation (SD). All incubations performed under ambient pHT (∼8.05) were conducted under carbonate chemistry favorable to calcification with saturation states with respect to aragonite (Ωa) well above 1 (average of 4.0±0.1 over the four incubations). In contrast, during experiments at low pHT (initial pHT ∼7.2), seawater was corrosive with respect to aragonite (Ωa ∼0.75). However, as pH was not regulated during the incubations (see previous section), it increased, at lowered pH, to an average of 7.75±0.03 (n=5) in dark conditions and to an average of 7.84±0.03 in light conditions (n=5). Evolution of pH in control beakers (final pHT of 7.78 and 7.48; n=1 in both the light and the dark, respectively) showed that the observed increase in beakers with corals was due to the additive effects of biological control (photosynthesis minus respiration and calcification) and exchanges at the interface in the light, and mostly due to CO2 exchange with air during the much longer incubations performed in the dark. Assuming linear variations with time, the average conditions of the carbonate chemistry in the lowered pH experiments were slightly favorable to aragonite production ( in the dark, n=5 and 1.6±0.05 in the light, n=5). Under ambient pH conditions (for both 45Ca and 13C incubations), pH did not change during incubations in the light (average final pHT of 8.05±0.03, n=12, data not shown) while it decreased in the dark, due to respiration and calcification, to reach an average pHT level of 7.62±0.07, n=12 (data not shown). In control beakers under ambient pH, pHT slightly increased in the light (8.09, n=2) and did not change in the dark (8.05, n=2).
Table 2Environmental conditions at the start of incubations of the coral Stylophora pistillata. pH on the total scale (pHT), partial pressure of CO2 (pCO2, µatm), total alkalinity (AT, µmol kg−1), dissolved inorganic carbon (CT, µmol kg−1), saturation states with respect to aragonite (Ωa) and calcite (Ωc), and calcium concentrations ([Ca2+], µmol kg−1) are presented. Labeled seawater 45Ca activity (Activityseawater, Bq mL−1) and the isotopic level, after enrichment, of the seawater dissolved inorganic carbon pool (δ13C-CT, ‰) are also shown. Means ± standard deviation (SD) of analytical triplicates (duplicates for δ13C-CT) are shown when available. All incubations were conducted at 25±0.5 ∘C.
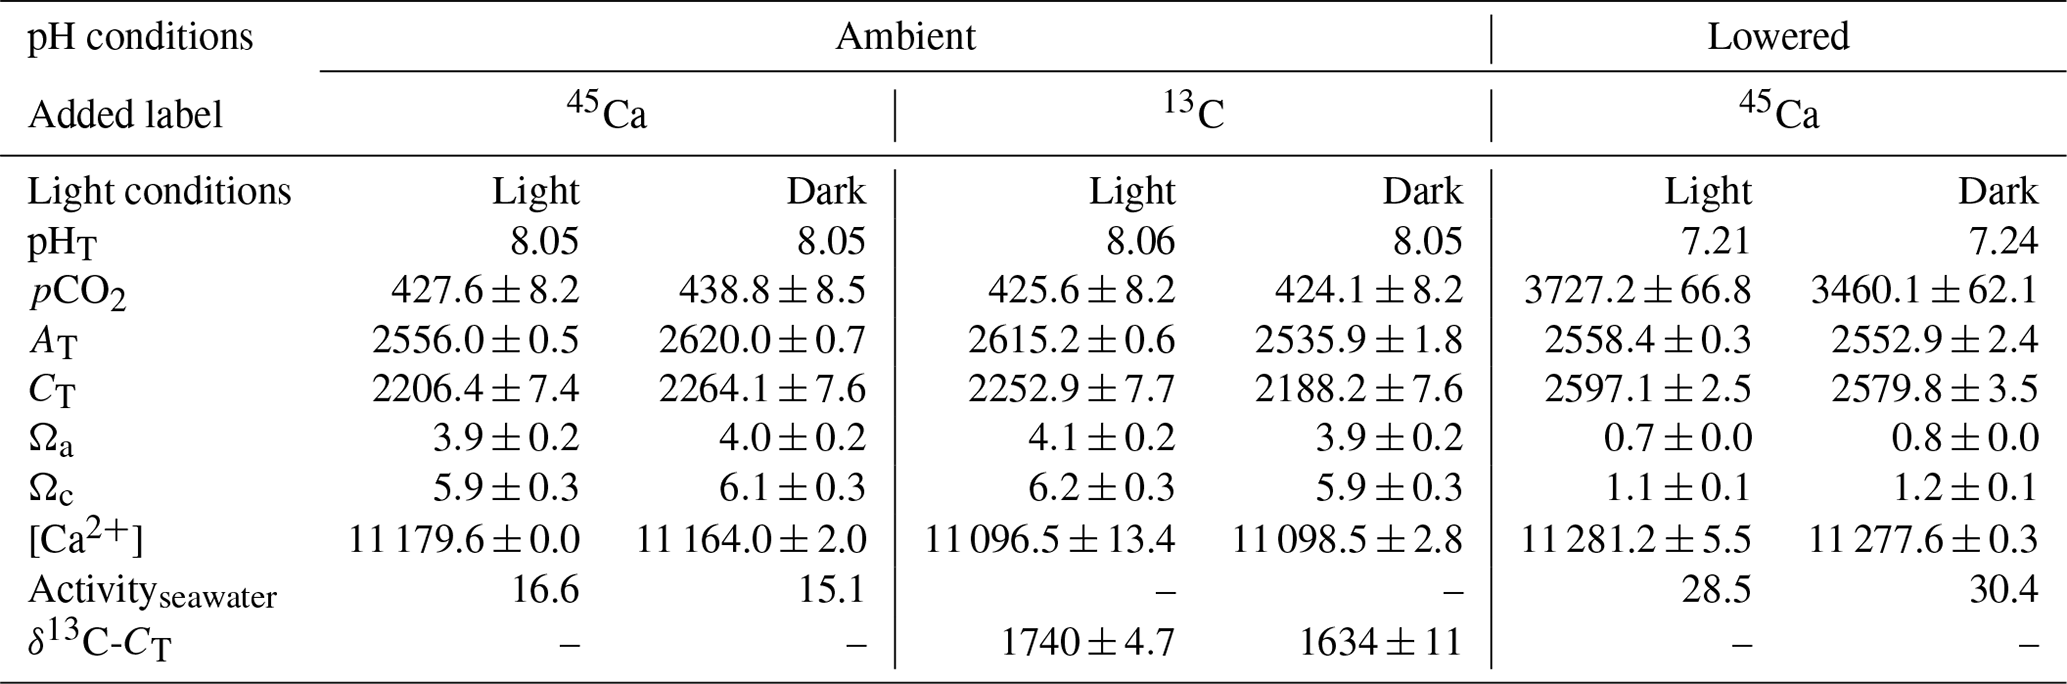
45Ca activities in seawater did not change during the incubations, reaching a final activity of 16.1±1.2 (n=12) and 28.5±0.6 (n=10) Bq mL−1 under ambient and lowered pH conditions, respectively (including both dark and light incubations, data not shown). Furthermore, for all incubations, these values were similar to those measured in beakers without corals (control, data not shown). Under ambient pH levels (no incubation at lowered pH), seawater was enriched in 13C (δ13C-CT) from a background level of 0.26±0.05 ‰ (n=3) to 1740±4.7 ‰ (n=2) and 1634±11 ‰ (n=2) in the light and dark, respectively. During light-condition incubations, δ13C-CT levels decreased to an average of 1636±10 ‰ (n=6, data not shown) while they decreased to an average of 1466±24 ‰ in dark conditions (n=6, data not shown). Incubations in control beakers (without corals) showed that the majority of δ13C-CT loss for both types of incubations (light and dark) was due to 13C incorporation by corals with a minor effect of gas exchanges at the interface (data not shown).
Both AT and [Ca2+] declined in all incubations as a consequence of coral calcification (Table 3). Changes in AT during incubations in control beakers (data not shown) comprised between 0.1 % and 1.1 % of the initial level. Similar results were observed for [Ca2+] with a relative change that comprised between 0.05 % and 1.15 % of the initial value. These minimal changes were corroborated with no measurable changes in seawater weight between the start and the end of all incubations (data not shown), showing that evaporation, if any, was minimal using our experimental setup over the considered incubation times. At ambient pH levels, decreases in AT and [Ca2+] (average of and µmol kg−1 for both parameters, respectively, n=24 including both 45Ca and 13C incubations) were roughly similar under light and dark conditions although coral specimens used for dark incubations were ca. 166 % heavier (skeleton dry weight; see Table 1). Incubations performed under lowered pH levels showed much lower AT and [Ca2+] net consumption rates than under ambient pH levels. Under these pH conditions, an extremely high AT consumption rate was observed in one beaker (dark incubation; see Table 3) while no changes in [Ca2+] were observed in a total of three beakers (see Table 3). These estimates (n=4) have been considered as outliers, marked with an asterisk in Table 3 and not included in the following analyses.
Table 3Changes in total alkalinity (AT) and calcium concentrations ([Ca2+]) during the different types of incubations compared to control beakers: , , both expressed in micromoles per kilogram. Standard errors (SE) have been calculated as and for AT and [Ca2+], respectively, where SE corresponds to standard errors associated with the measurement of three analytical replicates per sample. 45Ca activity (Activitysample, Bq) and 13C incorporation (δ13CM, ‰) of sampled corals are also shown. Values of 45Ca activity and δ13C are mean ± standard error of the mean (SE) associated with the measurement of three aliquots for each coral. Outliers (n=4; see text for details) are identified with an asterisk.
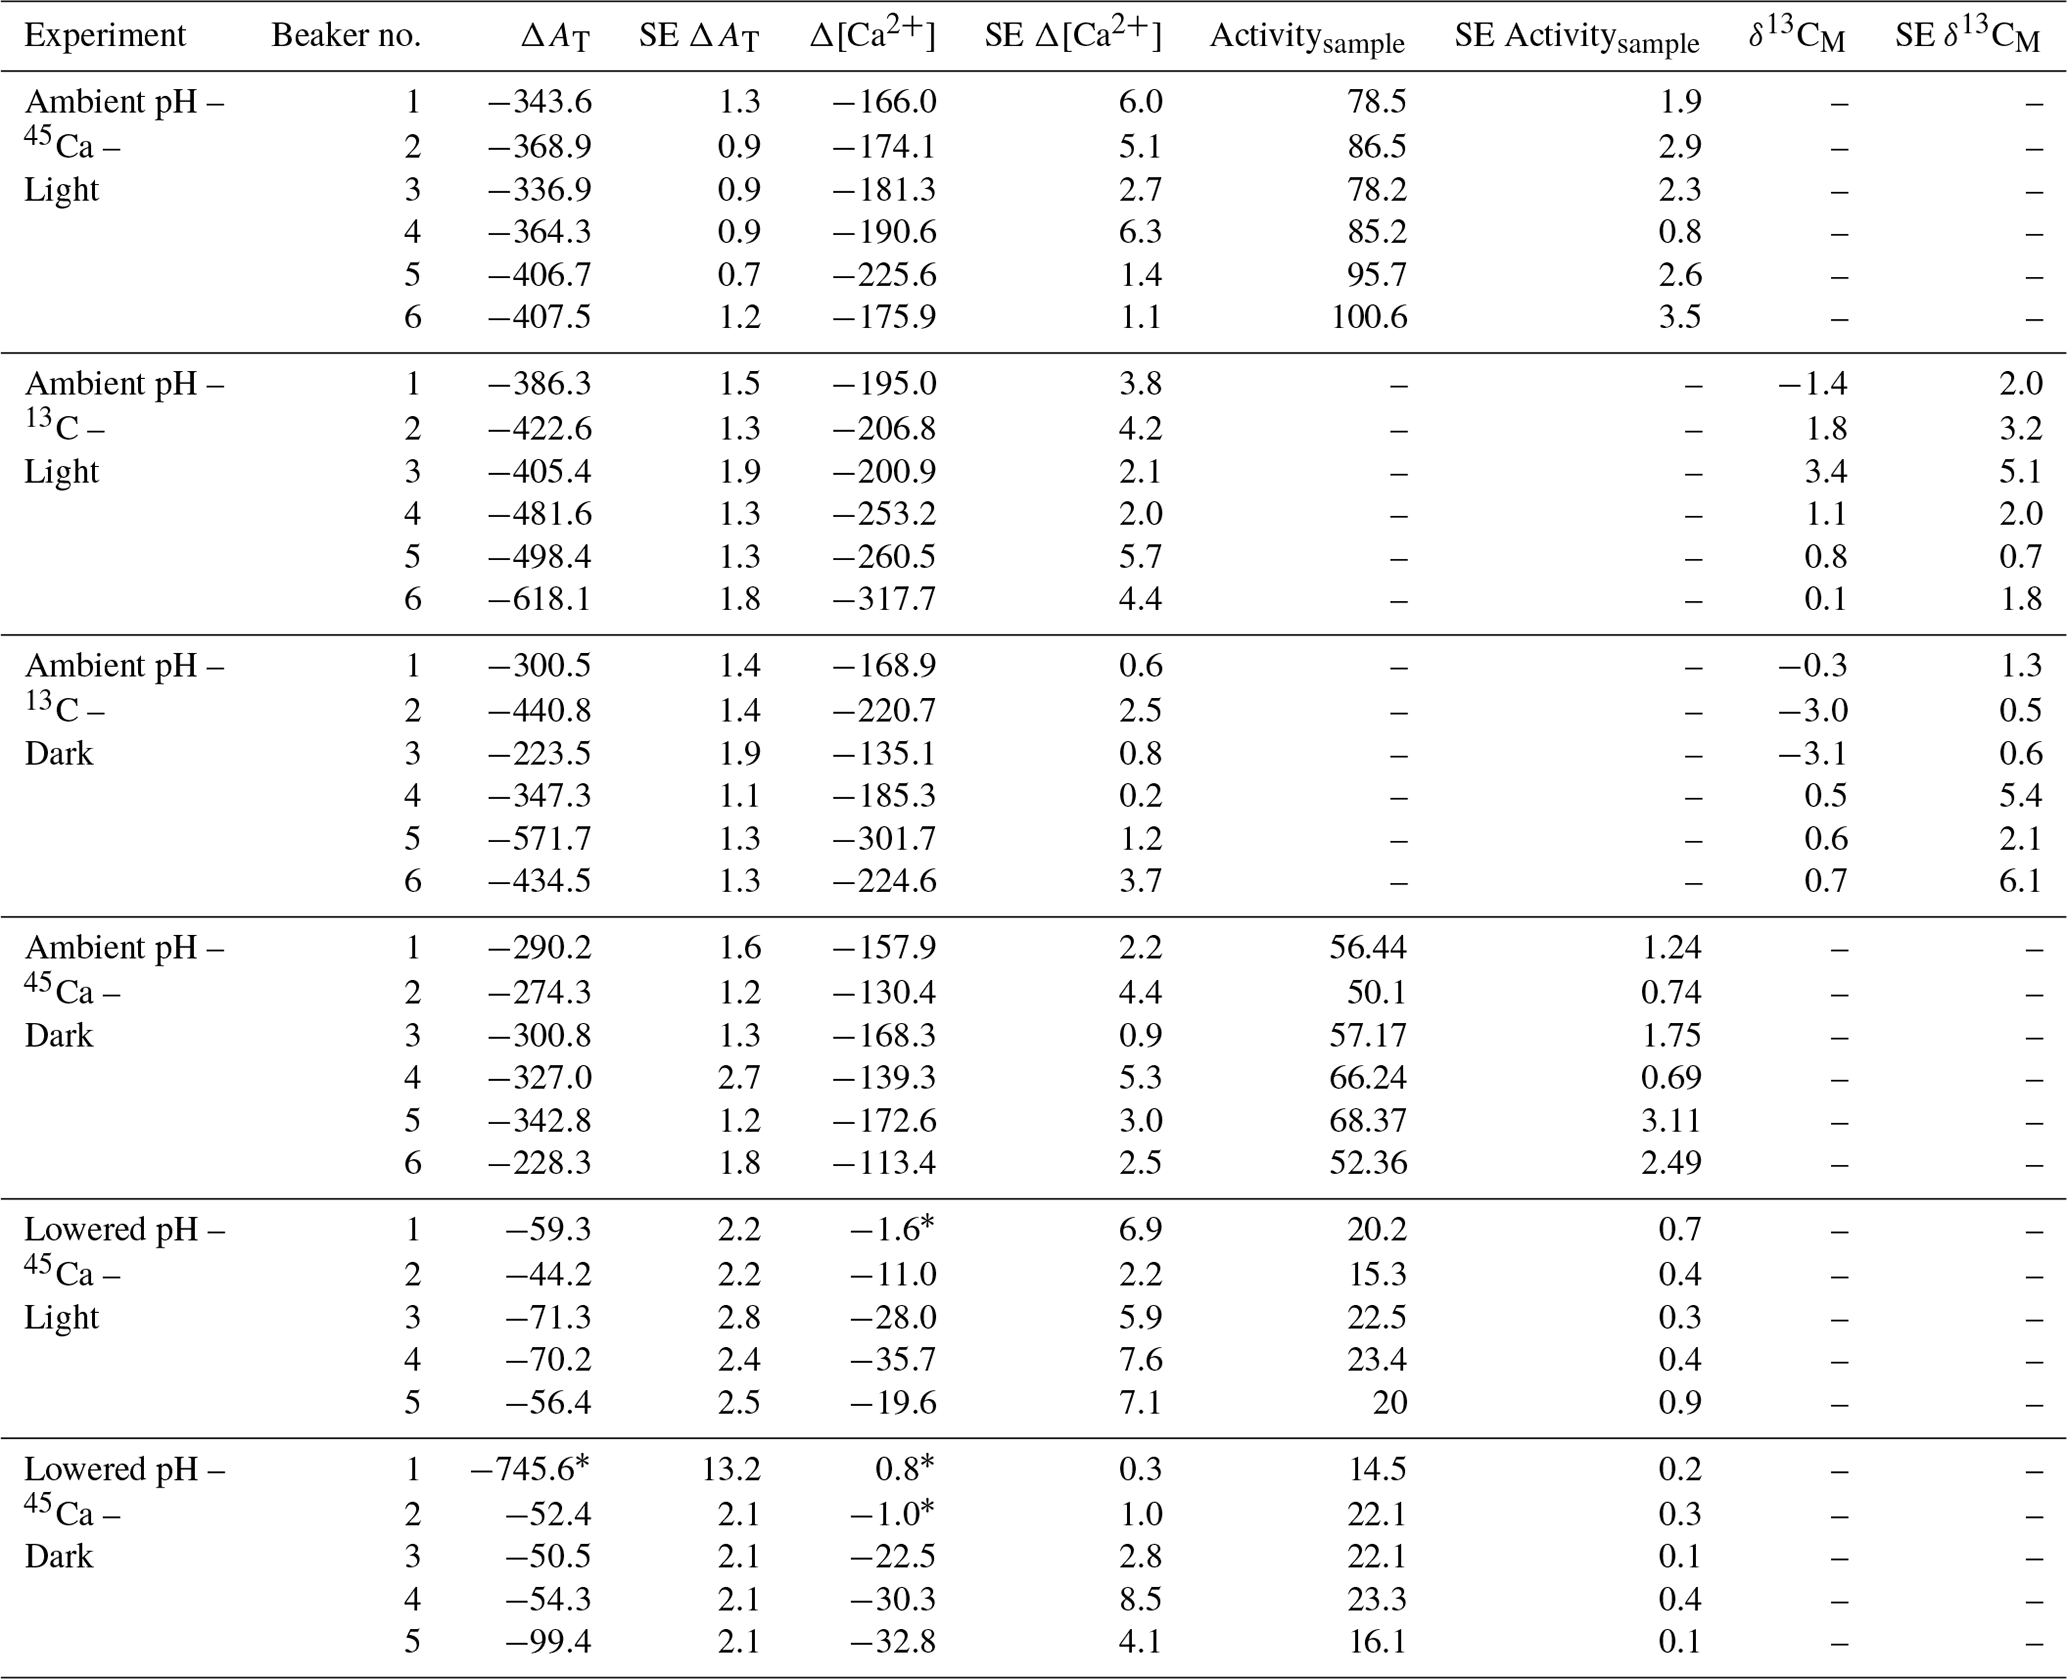
45Ca activities in coral skeleton reached maximum levels under ambient pH and light conditions (average of 87.5±9.1 Bq, n=6). Although seawater was more enriched in 45Ca at the lower pH levels (see above), 45Ca activity in corals incubated under these conditions was much lower, with the lowest values measured in the dark (average of 19.6±9.1 Bq, n=5). δ13C levels measured in coral skeletons (−3.69 ‰ to 8.92 ‰) showed significant enrichment compared to background levels ( ‰, n=9).
Calcification rates using the different techniques were higher in the light than in the dark and much lower rates were estimated at lowered pH (Table S1 in the Supplement, Figs. 2, 3 and 4). The rates measured by alkalinity anomaly () and calcium anomaly (GCa) techniques were highly correlated (Fig. 2; R2=0.98, p<0.01, n=34). No significant difference was observed between rates measured by the two methods (see Table 4 for the 95 % confidence intervals of the slope and intercept). The 45Ca method also provided rates very similar to those of the two previous approaches (Fig. 3; GCa vs. not shown), although the slope and the intercept of the geometric regression between and were significantly different from 1 and 0, respectively. Finally, the only approach that did not provide similar rates to the others was the 13C incorporation technique. Calcification rates based on this method were systematically higher than those measured using the other three techniques (see Table 4), and rates were not always significantly related (e.g., R2=0.33, p>0.05, n=12 for vs. ; see Fig. 4; other relationships not shown).
Table 4Model II regression results of the comparison between calcification rates estimated using the different methods considered in this study: the alkalinity and calcium anomaly techniques ( and GCa, respectively) as well as the 45Ca and 13C incorporation techniques ( and , respectively). The number of samples (n), the regression coefficient (R2), the slope and intercept (including their 95 % confidence intervals, 95 % CI), and the p value are shown for each comparison. Few identified outliers (n=4) have been removed from the analyses; see Tables 3 and S1 in the Supplement.
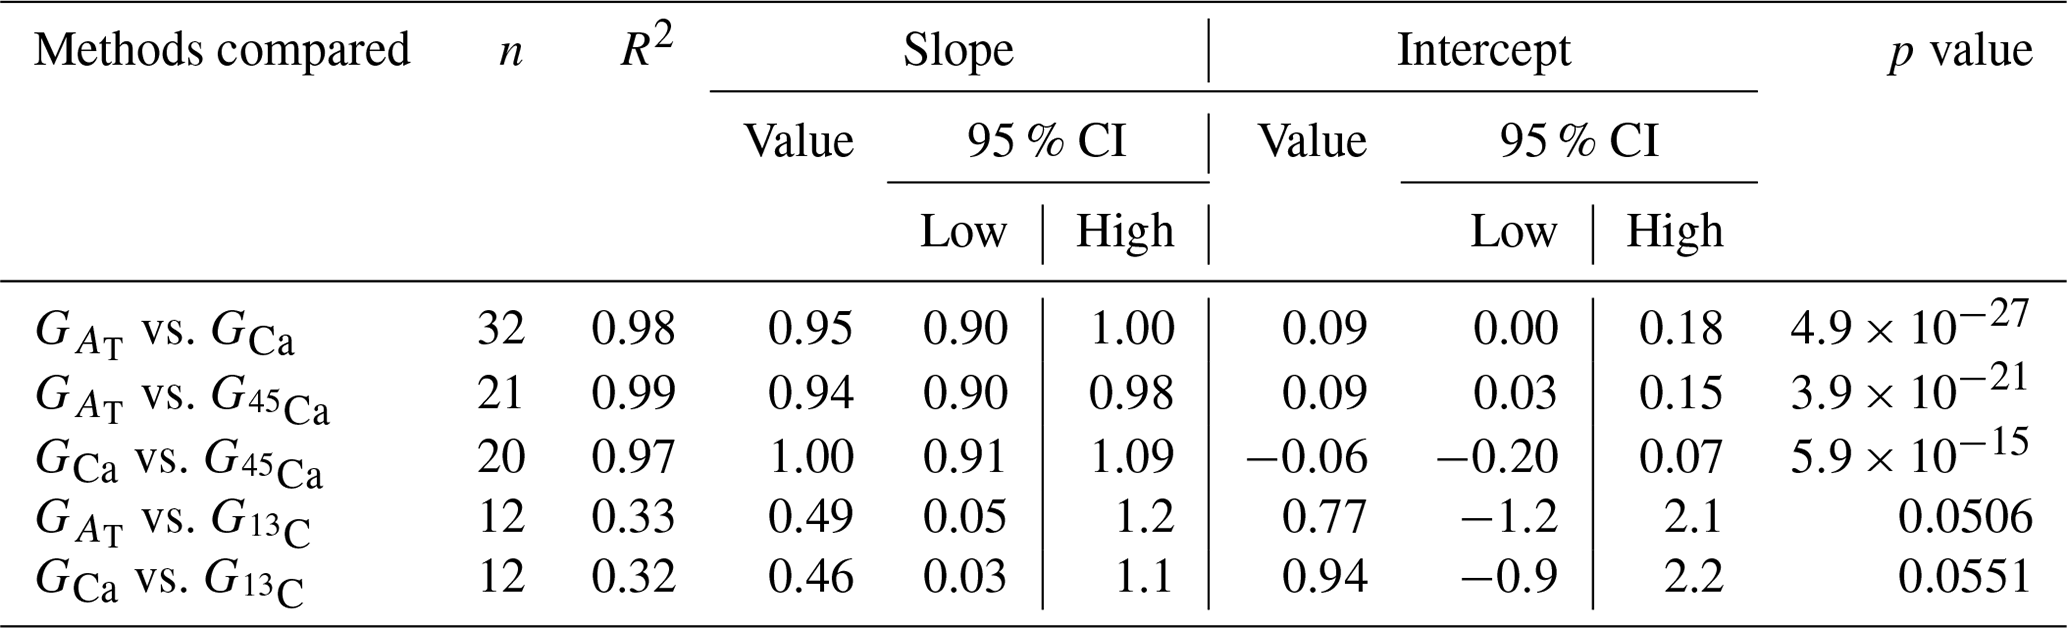
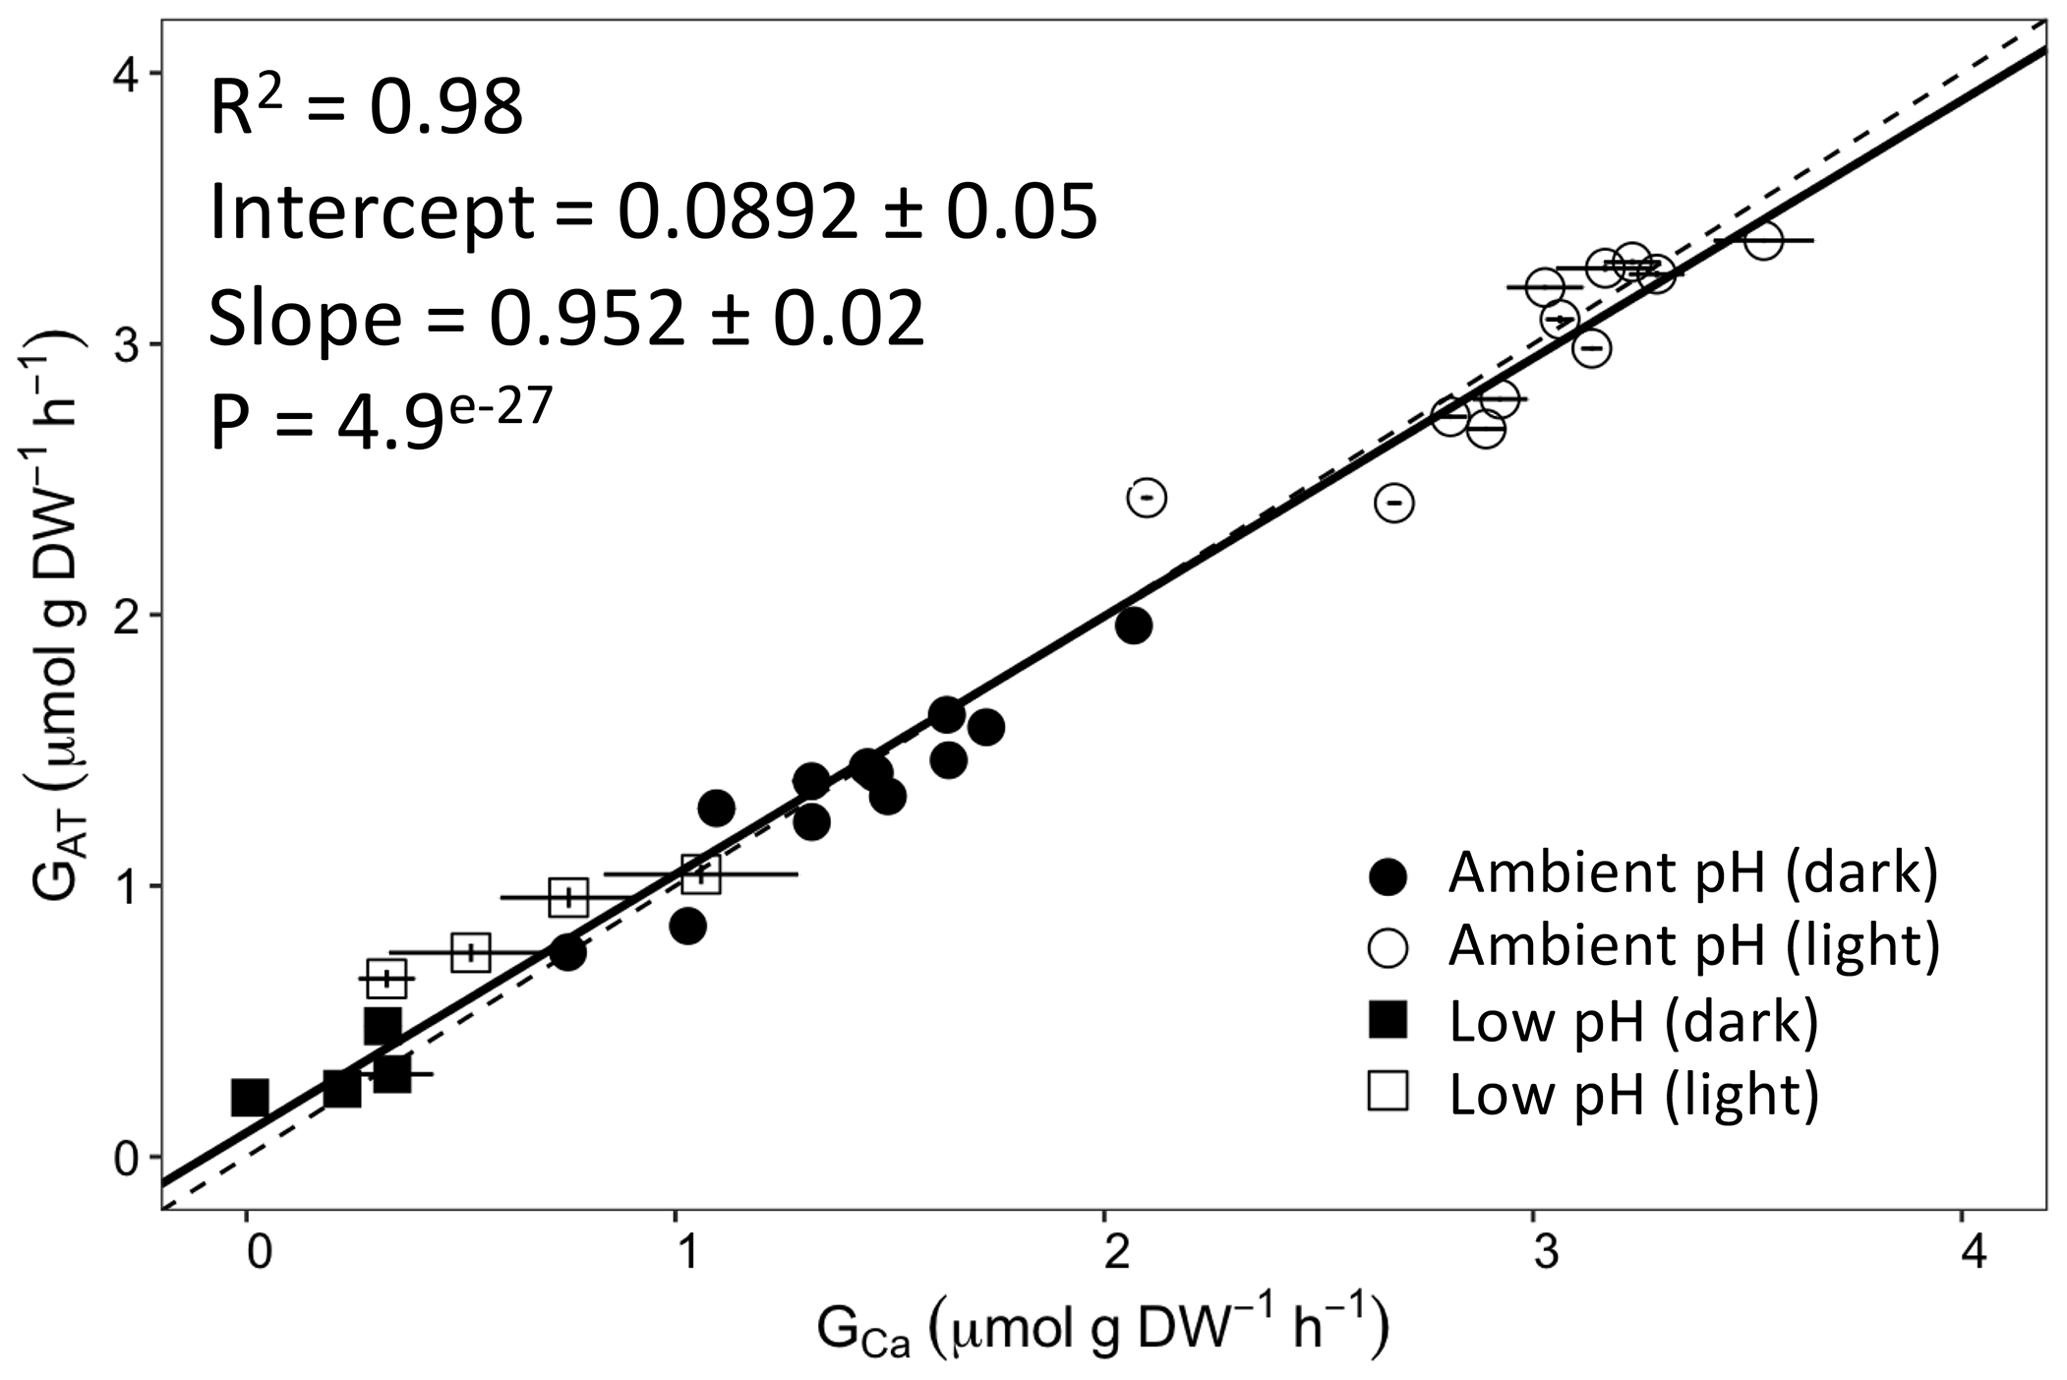
Figure 2Calcification rates estimated based on the alkalinity anomaly technique () as a function of calcification rates estimated based on the calcium anomaly technique (GCa). The dashed line represents the 1:1 relationship while the full line represents the model II regression relationship. Horizontal error bars represent standard errors (SE) associated with the estimation of GCa. Vertical error bars representing SE associated with the estimation of are too small to be visible. The corresponding dataset can be found in Table S1.
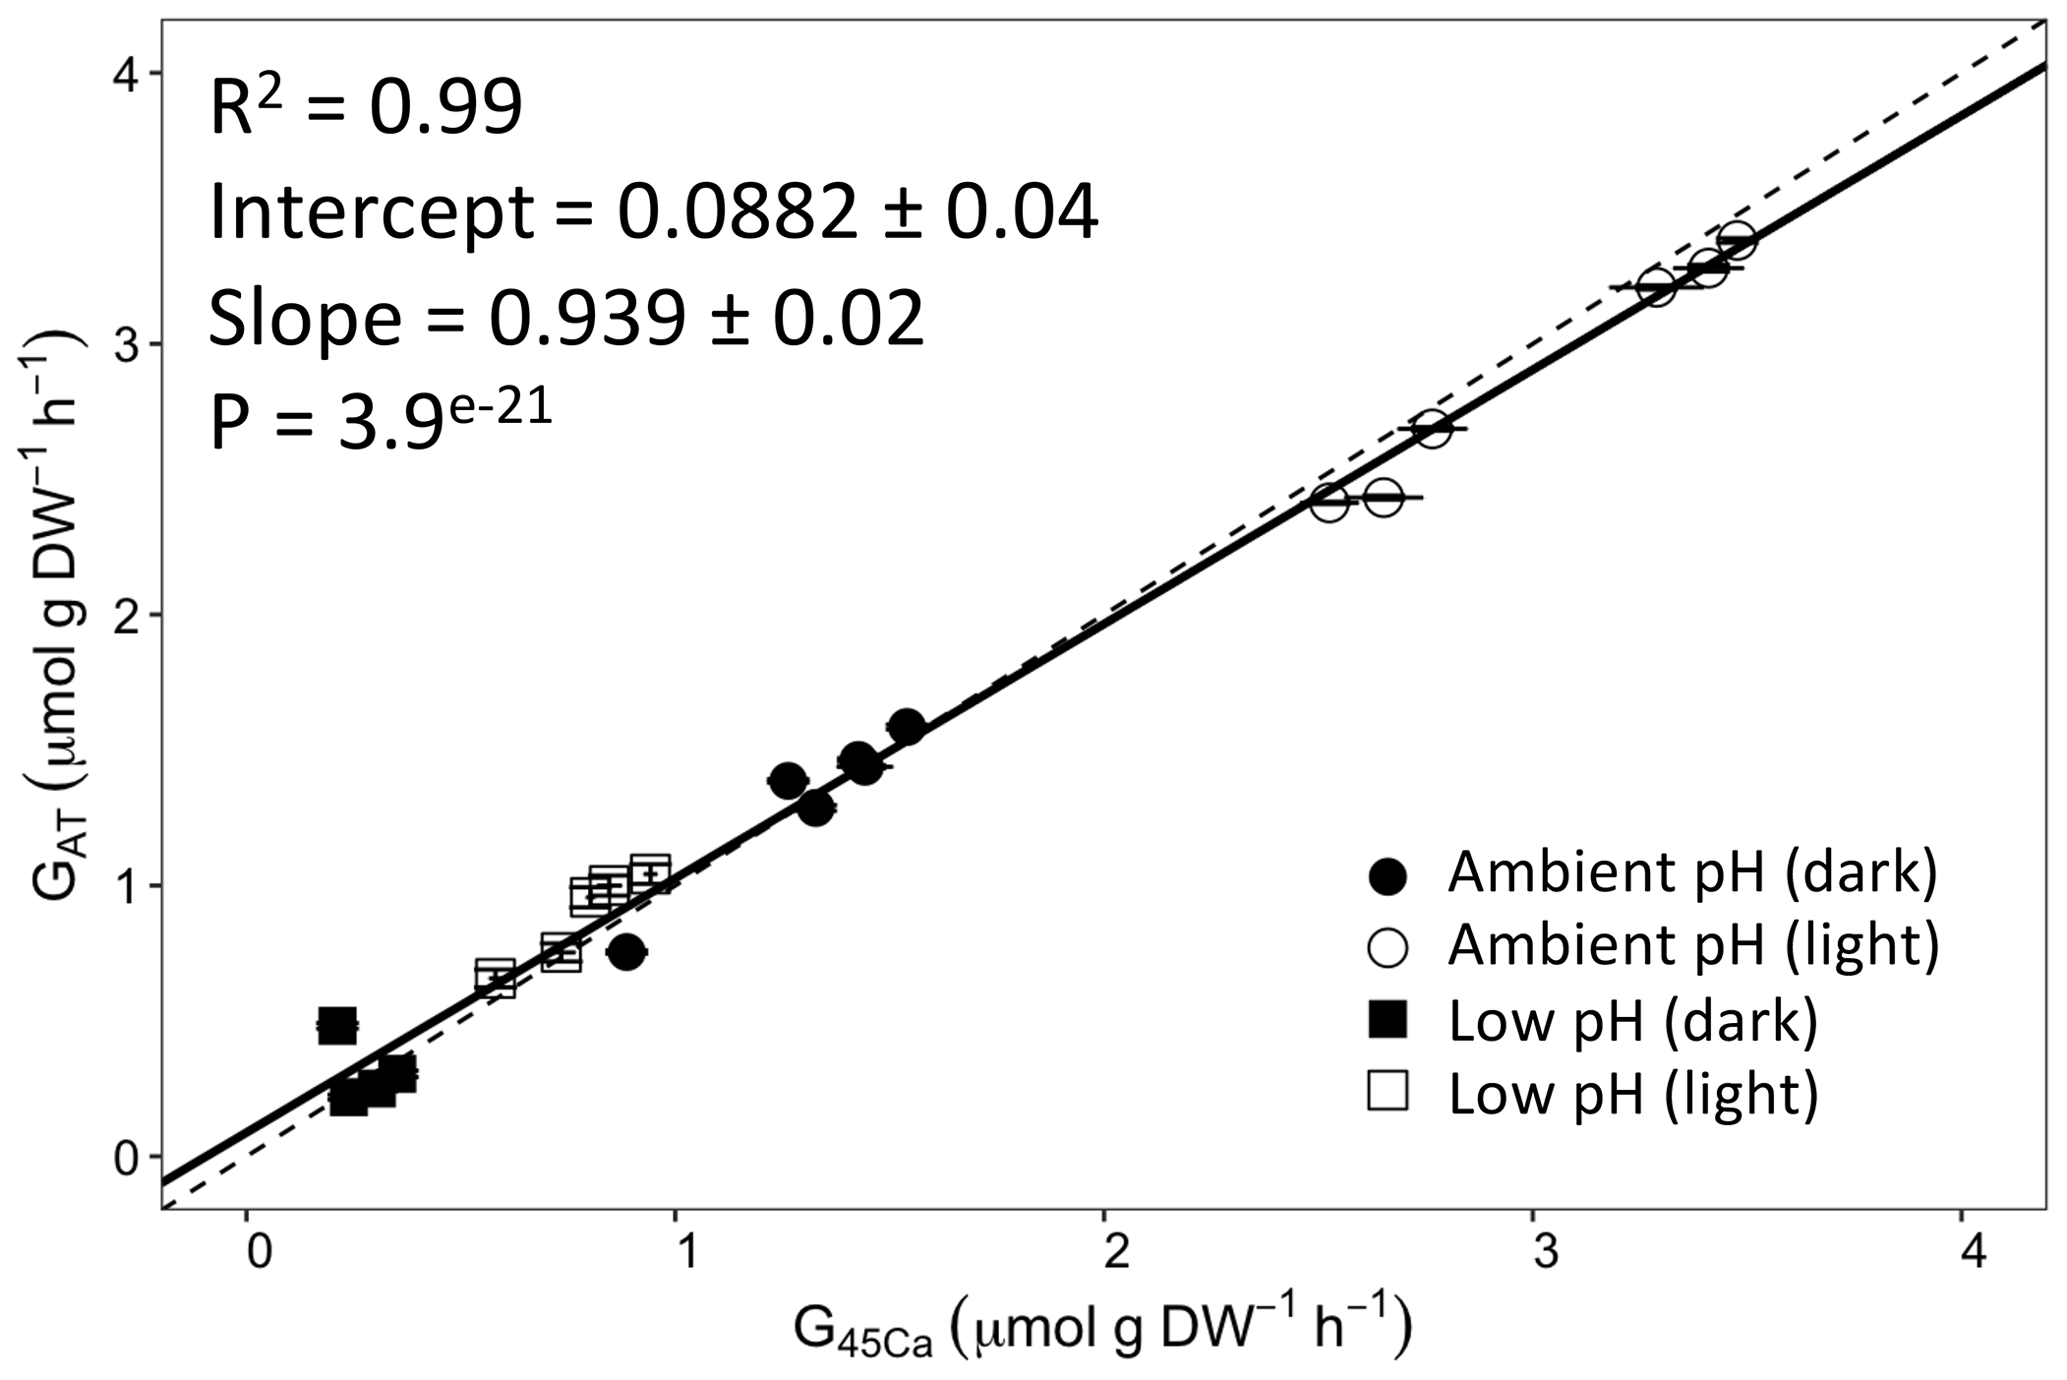
Figure 3Calcification rates estimated based on the alkalinity anomaly technique () as a function of calcification rates estimated based on the 45Ca incorporation technique (). The dashed line represents the 1:1 relationship while the full line represents the model II regression relationship. Horizontal error bars represent standard errors (SE) associated with the estimation of . Vertical error bars representing SE associated with the estimation of are too small to be visible. The corresponding dataset can be found in Table S1.

Figure 4Calcification rates estimated based on the alkalinity anomaly technique () as a function of calcification rates estimated based on 13C incorporation technique (). The dashed line represents the 1:1 relationship while the full line represents the model II regression relationship. Horizontal error bars represent standard errors (SE) associated with the estimation of . Vertical error bars representing SE associated with the estimation of are too small to be visible. The corresponding dataset can be found in Table S1.
Under all experimental conditions (ambient pH vs. low pH, light vs. dark), significant consumption rates of AT and Ca2+ as well as significant incorporation rates of 45Ca and 13C were observed in the zooxanthellate coral Stylophora pistillata. For all methods, calcification rates were lower in dark than in light conditions. Such trends are expected as it has long been established that calcification rates increase in zooxanthellate corals during periods in which photosynthesis is occurring (Yonge, 1931), a process known as light-enhanced calcification (e.g., Gattuso et al., 1999). Even under lowered pH conditions, at pH levels far below those predicted to occur in the next decades (starting pHT of ca. 7.2, average pHT during incubations of ca. 7.5), all corals appeared to produce calcifying structures under both light and dark conditions. The organisms selected for this experiment were fully coated with tissues with no exposed calcareous structures which can explain the absence of observable net dissolution such as reported by Cohen et al. (2017) in a similar study. Since our experimental protocol was not designed to address the potential impact of decreasing pH levels on calcification rates of this species (no control of carbonate chemistry during incubations, no acclimation of the organisms), we will not discuss further the observed decrease in calcification rates identified by the three techniques used at these pH levels.
Under all experimental conditions, rates of calcification calculated using the alkalinity and the calcium anomaly techniques were highly correlated with a slope of 1 and no significant intercept. These results are consistent with previously published data on colonies of Pocillopora damicornis (Chisholm and Gattuso, 1991), Cladocora caespitosa (Gazeau et al., 2015), and several other coral species (Murillo et al., 2014). Although the precision obtained on Ca2+ measurements is among the highest reported to date (Gazeau et al., 2015), the alkalinity anomaly technique appears as the most appropriate to estimate calcification rates of isolated corals (better precision, stronger signals). As observed by Murillo et al. (2014), this is not true when an entire community including sediment is investigated. The occurrence of several processes in the sediment that can impact AT prevents the use of this technique. It is therefore recommended to use the calcium anomaly technique when working in natural settings, assuming that Ca2+ concentrations are measured with an analytical technique as precise as the one used in our study (CV < 0.05 %). Similarly, although corrections are possible when applying the alkalinity anomaly technique on organisms that significantly release nutrients (echinoderms, bivalves, etc.), the use of the calcium anomaly technique is highly recommended instead (Gazeau et al., 2015).
Calcification rate estimates based on changes of AT or Ca2+ were highly correlated with estimates based on 45Ca incorporation in corals. These results are not consistent with those reported by Smith and Kinsey (1978), Tambutté et al. (1995), and Cohen et al. (2017). These studies revealed discrepancies between the alkalinity anomaly and the 45Ca incorporation techniques. Smith and Kinsey (1978) found that rates measured with the 45Ca method were higher than those measured using the alkalinity anomaly technique (significant 45Ca incorporation at ΔAT=0). Results from both Tambutté et al. (1995) and Cohen et al. (2017) suggested the opposite with a decrease in AT consumption without any concomitant 45Ca incorporation. A number of reasons may explain these discrepancies. First, the present study is the first one comparing these techniques in the same incubations, in contrast to the other ones in which incubations for AT anomaly and 45Ca incorporation were performed over 2 consecutive days (due to radioactive contamination issues). Second, calcification expressed as absolute changes in AT during incubations, measured during our experiment, were at least 1 order of magnitude higher than measured during these studies (44 200 to 745 600 nmol vs. less than 4000 nmol in previous experiments). Cohen et al. (2017) have shown that such discrepancies were much higher at very low rates and that the ratio between rates estimated based on 45Ca incorporation and AT consumption were getting closer to 1 with increasing calcification rates. Nevertheless, even at the highest levels of calcification computed during these studies, 45Ca-based rates were still significantly different from ΔAT-based rates, which is in contrast with our results.
As already mentioned, although calcification rates of the present study were lower at lowered pH levels, there was still a close to perfect agreement between the different techniques. While the 45Ca labeling technique is thought to provide rates of gross calcification, there is no doubt that both the AT and Ca2+ anomaly techniques allow the estimation of net calcification rates (gross calcification – dissolution). A full agreement of rates computed from these methods further suggests that no dissolution of previously precipitated CaCO3 structures occurred during our study, even under lowered pH conditions. The corals used in our experiment were fully covered with tissues, which is likely the reason why no dissolution was measured.
Furthermore, we must note that the protocol for 45Ca incorporation considered in our study differed from the one used in the abovementioned past studies. A much smaller activity was used (0.025 kBq mL−1) compared to that of Tambutté et al. (1995; 40 kBq mL−1) and Cohen et al. (2017; 9 kBq mL−1). Moreover, in contrast to Cohen et al. (2017), rates were not corrected for 45Ca incorporation on the skeleton of dead corals. This choice was motivated by the absence of detectable radioactivity on bare skeletons exposed for 7 h and treated with the same protocol as the one used in our study (Chantal Lanctôt, personal communication, 2018).
To the best of our knowledge, this is the first study comparing calcification rates measured using the 13C labeling technique to the more widely used alkalinity and calcium anomaly techniques. It shows that 13C-derived rates were systematically higher and much more variable (with large uncertainties) than the ones estimated using the two other techniques. As already mentioned, several studies have shown that most of the carbon precipitated in the skeleton comes from coral and its symbiotic zooxanthellae (e.g., Erez, 1978; Furla et al., 2000), leading to an underestimation of calcification rates based on labeled, radioactive carbon incorporation. As there is no reason for 13C to behave differently, our results appear inconsistent with a metabolic source of carbon. As the nubbins were treated following the same protocol as for 45Ca incorporation measurements, it is unclear why much stronger 13C incorporation was obtained and why variability was so high. Before better insights into such discrepancies can be developed, we recommend to avoid this technique to estimate coral calcification rates.
Table 5Incubation times (tmin; h) necessary to obtain significant signals using the three methods: the alkalinity anomaly technique (AT), the calcium anomaly technique (Ca2+), and the 45Ca incorporation techniques (45Ca); see text for calculation procedures. tmax (h) is the maximum incubation time to maintain carbonate chemistry within an acceptable range (ΔpHT<0.06 and ΔCT<10 % and ΔAT<10 %). The ratios between incubation volume (V, in milliliters) and the size of the nubbins (S, in centimeters), considered in our study for the different sets of incubations (ambient pH vs. low pH; light vs. dark), are also shown. tmin values are noted in bold when higher than tmax.
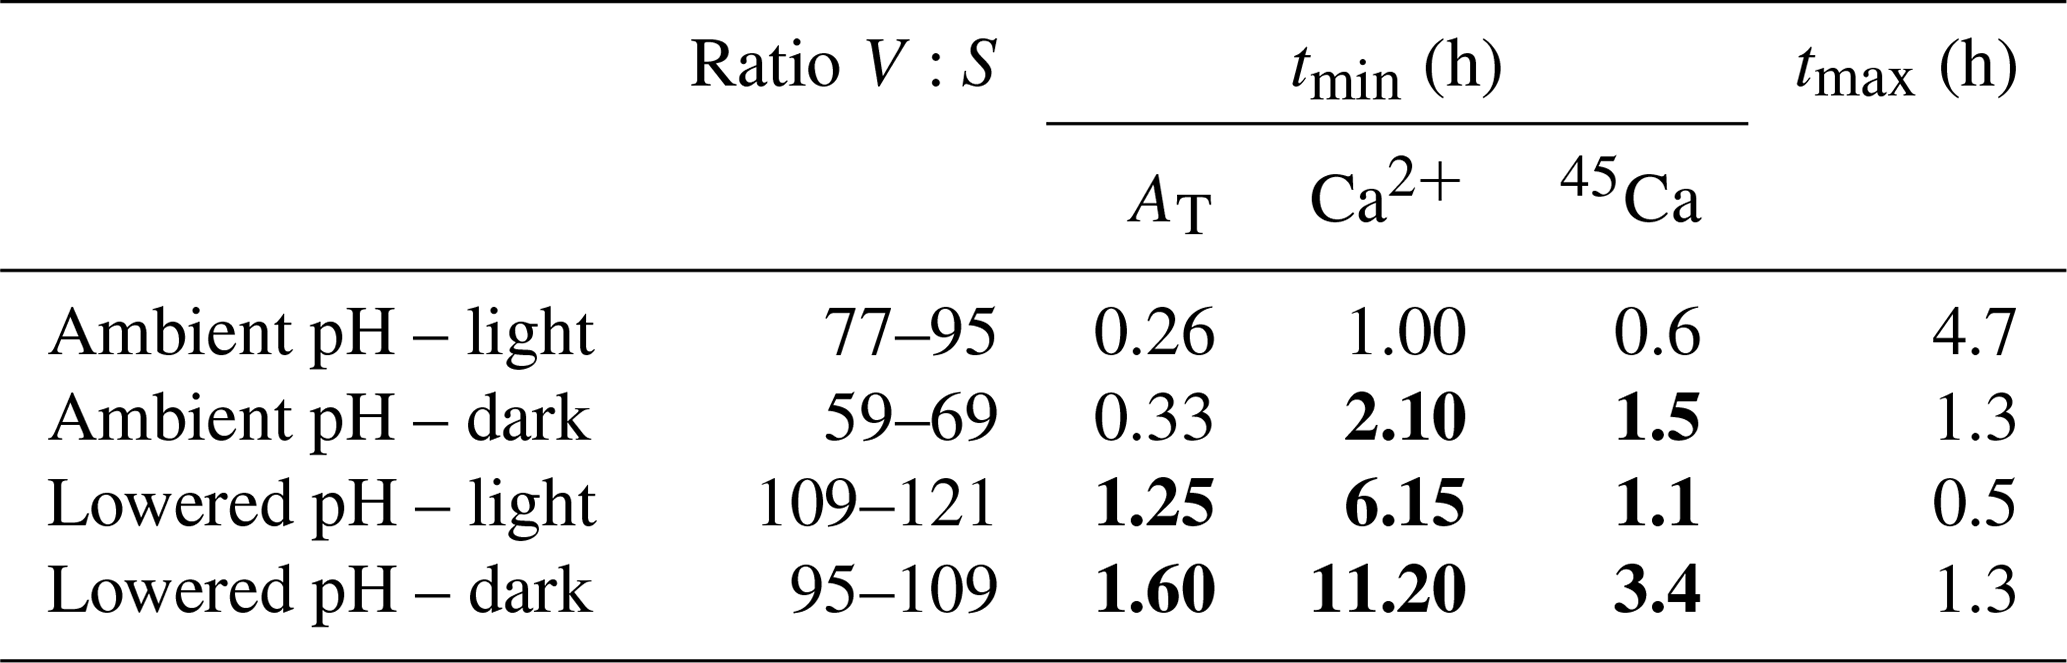
Our study was designed to compare different techniques to estimate calcification rates and not to define the best experimental approach to study the effects of ocean acidification on coral species using these different approaches. As such, the chosen experimental protocol (e.g., incubation times) was not optimal and led, in some cases, to significant changes in the carbonate chemistry during incubations. However, our results provide some insights that we further discuss in the following section. Measuring and comparing calcification rates of organisms under varying pH conditions requires the careful choice of a volume and a time interval such that the precision of the calcification rate measurement is large enough to observe significant signals and that the change in carbonate chemistry parameters between the beginning and end of the incubation is small compared to the range of these parameters in the different treatments (Langdon et al., 2010). Table 5 illustrates the incubation time necessary to obtain measurable changes for each method (tmin) considering the ratio between incubation volume and coral size chosen for our study. As the 13C incorporation method did not provide reliable rates, this technique was not considered in this analysis. The threshold for significant signals was set at 10-fold the analytical precision of the instruments (Langdon et al., 2010) for AT and Ca2+ measurements (1.2 and 2.9 µmol kg−1, respectively) and above the detection limit of 15 CPM for 45Ca activity estimated. Maximum incubation times are more difficult to estimate. Langdon et al. (2010) and Riebesell et al. (2010) recommend considering incubation times short enough to maintain AT and CT within an acceptable range (ΔAT and ΔCT <10 %). As it is more difficult to estimate what changes in pH are acceptable, we have arbitrarily considered a maximal change in pH of 0.06, corresponding to the lowest change in global surface ocean pH projected for 2100 (IPCC, 2014). Maximal incubation times, as presented in Table 5 (tmax), correspond then to incubation times that should not be exceeded in order to maintain acceptable conditions of the carbonate chemistry (ΔpHT<0.06 and ΔAT<10 % and ΔCT<10 %).
Under light and ambient pH conditions, even if the ratio between incubation volume and nubbin size is much higher than for previous similar studies (e.g., Cohen et al., 2017), all methods would allow a precise estimation of calcification rates over very short incubation times (∼15 min to 1 h, depending on the method) while leading to moderate changes in carbonate chemistry. In the dark, and under ambient pH conditions, in the absence of pH increase due to photosynthesis, the decrease in pH due to respiration narrows the possible incubation period to 1.3 h. While this is still larger than the incubation time allowing us to obtain a significant signal with the alkalinity anomaly technique (∼20 min), the other two methods necessitate longer incubation times to obtain precise estimates (>1.5 h). At lower pH, under both light and dark conditions, and using open systems without a continuous pH regulation as in our study, it is obvious that all techniques are not well adapted to this experimental protocol. Indeed, as a consequence of lower calcification rates at lower pH and significant CO2 degassing, incubation times necessary to obtain significant signals using these techniques are too large to maintain the carbonate parameters within an acceptable range. This is not insurmountable as a continuous regulation of pH using for instance pure CO2 bubbling or incubations performed in a closed container (i.e., without contact with the atmosphere) would alleviate these problems.
In conclusion, the present study is the first one allowing a direct (i.e., during the same incubations) comparison of three methods used to estimate coral calcification rates, the calcium and alkalinity anomaly techniques and the 45Ca incorporation technique. These methods provided very consistent calcification rates of the coral Stylophora pistillata independently of the conditions set for the incubations (light vs. dark, ambient vs. low pH). Among these three methods, the alkalinity anomaly and the 45Ca incorporation techniques appear to be the most sensitive, allowing the quantification of coral calcification rates without significant changes in targeted environmental conditions. In contrast, the 13C incorporation technique did not provide reliable calcification rates and its use is not recommended until further investigations clarify the discrepancies. Finally, this study was restricted to a single coral species and used nubbins fully covered with tissues. Conducting similar comparison studies with other coral species as well as other major calcifying groups widely studied in the context of ocean acidification (e.g., coralline algae, mollusks) would be necessary for a better understanding of ocean acidification impacts on ecosystem services provided by calcifying organisms.
All data used in this manuscript are freely available at: https://doi.pangaea.de/10.1594/PANGAEA.912222 (Gómez Batista et al., 2020).
The supplement related to this article is available online at: https://doi.org/10.5194/bg-17-887-2020-supplement.
FG and MM designed and supervised the study. MGB conducted the research, and MGB and FG wrote the paper with contributions from all authors.
The authors declare that they have no conflict of interest.
We thank the Monaco government and the Centre Scientifique de Monaco for propagating and maintaining the coral nubbins and Samir Alliouane for technical assistance for total alkalinity and calcium measurements. The authors are also grateful to the editor and two anonymous reviewers whose comments and suggestions helped improve the paper.
This work was supported by the IAEA's Ocean Acidification International Coordination Center (OA-ICC) and the IAEA-ICTP Sandwich Training Educational Programme (STEP) and the project “Strengthening the National System for Analysis of the Risks and Vulnerability of Cuban Coastal Zone Through the Application of Nuclear and Isotopic Techniques” National Program PNUOLU/4-1/2 No. /2017 of the National Nuclear Agency (AENTA).
This paper was edited by Lennart de Nooijer and reviewed by two anonymous referees.
Albright, R., Caldeira, L., Hosfelt, J., Kwiatkowski, L., Maclaren, J. K., Mason, B. M., Nebuchina, Y., Ninokawa, A., Pongratz, J., Ricke, K. L., Rivlin, T., Schneider, K., Sesboüé, M., Shamberger, K., Silverman, J., Wolfe, K., Zhu, K., and Caldeira, K.: Reversal of ocean acidification enhances net coral reef calcification, Nature, 531, 362–365, https://doi.org/10.1038/nature17155, 2016.
Albright, R., Takeshita, Y., Koweek, D. A., Ninokawa, A., Wolfe, K., Rivlin, T., Nebuchina, Y., Young, J., and Caldeira, K.: Carbon dioxide addition to coral reef waters suppresses net community calcification, Nature, 555, 516–519, https://doi.org/10.1038/nature25968, 2018.
Cao, Z. and Dai, M.: Shallow-depth CaCO3 dissolution: Evidence from excess calcium in the South China Sea and its export to the Pacific Ocean, Global Biogeochem. Cy., 25, GB2019, https://doi.org/10.1029/2009GB003690, 2011.
Chisholm, J. R. M. and Gattuso, J.-P.: Validation of the alkalinity anomaly technique for investigating calcification and photosynthesis in coral reef communities, Limnol. Oceanogr., 36, 1232–1239, 1991.
Cohen, S., Krueger, T., and Fine, M.: Measuring coral calcification under ocean acidification: methodological considerations for the 45Ca-uptake and total alkalinity anomaly technique, PeerJ, 5, e3749, https://doi.org/10.7717/peerj.3749, 2017.
Cyronak, T., Andersson, A. J., Langdon, C., Albright, R., Bates, N. R., Caldeira, K., Carlton, R., Corredor, J. E., Dunbar, R. B., Enochs, I., Erez, J., Eyre, B. D., Gattuso, J.-P., Gledhill, D., Kayanne, H., Kline, D. I., Koweek, D. A., Lantz, C., Lazar, B., Manzello, D., McMahon, A., Meléndez, M., Page, H. N., Santos, I. R., Schulz, K. G., Shaw, E., Silverman, J., Suzuki, A., Teneva, L., Watanabe, A., and Yamamoto, S.: Taking the metabolic pulse of the world's coral reefs, PLOS ONE, 13, e0190872, https://doi.org/10.1371/journal.pone.0190872, 2018.
Dickson, A. G., Sabine, C. L., and Christian, J. R.: Guide to best practices for ocean CO2 measurements, PICES Special Publication, 3, 191 pp., 2007.
Erez, J.: Vital effect on stable-isotope composition seen in foraminifera and coral skeletons, Nature, 273, 199–202, https://doi.org/10.1038/273199a0, 1978.
Furla, P., Galgani, I., Durand, I., and Allemand, D.: Sources and mechanisms of inorganic carbon transport for coral calcification and photosynthesis, J. Exp. Biol., 203, 3445–3457, 2000.
Gattuso, J.-P. and Hansson, L. (Eds.): Ocean acidification: background and history, in: Ocean acidification, Oxford University Press, Oxford, 1–20, 2011.
Gattuso, J.-P., Allemand, D., and Frankignoulle, M.: Photosynthesis and calcification at cellular, organismal and community levels in coral reefs: A review on interactions and control by carbonate chemistry, Am. Zool., 39, 160–183, https://doi.org/10.1093/icb/39.1.160, 1999.
Gattuso, J.-P., Epitalon, J. M., Lavigne, H., Orr, J, Gentili, B., Hagens, M., Hofmann, A., Proye, A., Soetaert, K., and Rae, J.: seacarb: Seawater carbonate chemistry, available at: https://cran.r-project.org/package=seacarb, last access: 11 September 2019.
Gazeau, F., Urbini, L., Cox, T. E., Alliouane, S., and Gattuso, J. P.: Comparison of the alkalinity and calcium anomaly techniques to estimate rates of net calcification, Mar. Ecol.-Prog. Ser., 527, 1–12, 2015.
Gillikin, D. P. and Bouillon, S.: Determination of δ18O of water and δ13C of dissolved inorganic carbon using a simple modification of an elemental analyser-isotope ratio mass spectrometer: an evaluation, Rapid Commun. Mass Sp., 21, 1475–1478, https://doi.org/10.1002/rcm.2968, 2007.
Gómez Batista, M., Metian, M., Oberhänsli, F., Pouil, S., Tambutté, E., Gattuso, J.-P., Hernández, C. M. A., and Gazeau, F.: Seawater carbonate chemistry and coral calcification, PANGAEA, https://doi.org/10.1594/PANGAEA.912222, 2020.
Goreau, T. F.: The physiology of skeleton formation in corals. I. A method for measuring the rate of calcium deposition by corals under different conditions, Biol. Bull., 116, 59–75, 1959.
Goreau, T. F. and Bowen, V. T.: Calcium uptake by a coral, Science, 122, 1188–1189, https://doi.org/10.1126/science.122.3181.1188, 1955.
Houlbrèque, F., Reynaud, S., Godinot, C., Oberhänsli, F., Rodolfo-Metalpa, R., and Ferrier-Pagès, C.: Ocean acidification reduces feeding rates in the scleractinian coral Stylophora pistillata, Limnol. Oceanogr., 60, 89–99, https://doi.org/10.1002/lno.10003, 2015.
IPCC: Climate Change 2014: Synthesis Report. Contribution of Working Groups I, II and III to the Fifth Assessment Report of the Intergovernmental Panel on Climate Change, edited by: Team, C. W., Pachauri, R. K., and Meyer, L. A., IPCC, Geneva, Switzerland, 151 pp., 2014.
Jokiel, P. L., Maragos, J. E., and Franzisket, L.: Coral growth: buoyant weight technique, in: Coral reefs: research methods, edited by: Stoddart, D. R. and Johannes, R. E., Unesco, Paris, 379–396, 1978.
Langdon, C., Gattuso, J.-P., and Andersson, A. J.: Measurements of calcification and dissolution of benthic organisms and communities, in: Guide to Best Practices for Ocean Acidification Research and Data Reporting, Publications Office of the European Union, Luxembourg, 213–234, 2010.
Legendre, P. and Oksanen, J.: lmodel2: Model II Regression, Luxembourg, Publications Office of the European Union, available at: https://cran.r-project.org/package=lmodel2 (last access: 11 September 2019), 2018.
Le Quéré, C., Andrew, R. M., Friedlingstein, P., Sitch, S., Hauck, J., Pongratz, J., Pickers, P. A., Korsbakken, J. I., Peters, G. P., Canadell, J. G., Arneth, A., Arora, V. K., Barbero, L., Bastos, A., Bopp, L., Chevallier, F., Chini, L. P., Ciais, P., Doney, S. C., Gkritzalis, T., Goll, D. S., Harris, I., Haverd, V., Hoffman, F. M., Hoppema, M., Houghton, R. A., Hurtt, G., Ilyina, T., Jain, A. K., Johannessen, T., Jones, C. D., Kato, E., Keeling, R. F., Goldewijk, K. K., Landschützer, P., Lefèvre, N., Lienert, S., Liu, Z., Lombardozzi, D., Metzl, N., Munro, D. R., Nabel, J. E. M. S., Nakaoka, S., Neill, C., Olsen, A., Ono, T., Patra, P., Peregon, A., Peters, W., Peylin, P., Pfeil, B., Pierrot, D., Poulter, B., Rehder, G., Resplandy, L., Robertson, E., Rocher, M., Rödenbeck, C., Schuster, U., Schwinger, J., Séférian, R., Skjelvan, I., Steinhoff, T., Sutton, A., Tans, P. P., Tian, H., Tilbrook, B., Tubiello, F. N., van der Laan-Luijkx, I. T., van der Werf, G. R., Viovy, N., Walker, A. P., Wiltshire, A. J., Wright, R., Zaehle, S., and Zheng, B.: Global Carbon Budget 2018, Earth Syst. Sci. Data, 10, 2141–2194, https://doi.org/10.5194/essd-10-2141-2018, 2018.
Lebel, J. and Poisson, A.: Potentiometric determination of calcium and magnesium in seawater, Mar. Chem., 4, 321–332, https://doi.org/10.1016/0304-4203(76)90018-9, 1976.
Marshall, A. T. and Wright, A.: Coral calcification: autoradiography of a scleractinian coral Galaxea fascicularis after incubation in 45Ca and 14C, Coral Reefs, 17, 37–47, https://doi.org/10.1007/s003380050092, 1998.
McCoy, S. J., Pfister, C. A., Olack, G., and Colman, A. S.: Diurnal and tidal patterns of carbon uptake and calcification in geniculate inter-tidal coralline algae, Mar. Ecol., 37, 553–564, https://doi.org/10.1111/maec.12295, 2016.
Murillo, L. J. A., Jokiel, P. L., and Atkinson, M. J.: Alkalinity to calcium flux ratios for corals and coral reef communities: variances between isolated and community conditions, PeerJ, 2, e249, https://doi.org/10.7717/peerj.249, 2014.
Orr, J. C., Epitalon, J.-M., Dickson, A. G., and Gattuso, J.-P.: Routine uncertainty propagation for the marine carbon dioxide system, Mar. Chem., 207, 84–107, doi10.1016/j.marchem.2018.10.006, 2018.
R Development Core Team, R.: A language and environment for statistical computing, available at: https://www.r-project.org/ (last access: 11 September 2019), 2018.
Riebesell, U., Fabry, V. J., Hansson, L., and Gattuso, J.-P.: Guide to best practices for ocean acidification research and data reporting, Rep. Int. Res. Work. best Pract. Ocean Acidif. Res., 19–21 November 2008, Kiel, Germany, 260 pp., https://doi.org/10.2777/58454, 2010.
Schoepf, V., Hu, X., Holcomb, M., Cai, W.-J., Li, Q., Wang, Y., Xu, H., Warner, M. E., Melman, T. F., Hoadley, K. D., Pettay, D. T., Matsui, Y., Baumann, J. H., and Grottoli, A. G.: Coral calcification under environmental change: a direct comparison of the alkalinity anomaly and buoyant weight techniques, Coral Reefs, 36, 13–25, https://doi.org/10.1007/s00338-016-1507-z, 2017.
Smith, S. V. and Key, G. S.: Carbon dioxide and metabolism in marine environments, Limnol.d Oceanogr., 20, 493-495, 1975.
Smith, S. V. and Kinsey, D. W.: Calcification and organic carbon metabolism as indicated by carbon dioxide, in: Coral Reefs: Research Methods, edited by: Stoddart, D. R. and Johannes, R. E., UNESCO, Monographs on Oceanographic Methodology No. 5, Paris, 469–484, 1978.
Sokal, R. R. and Rohlf, F. J.: Biometry, the principles and practice of statistics in biological research, 3rd Edn., W. H. Freeman, New York, 1995.
Tambutté, E., Allemand, D., Bourge, I., Gattuso, J.-P., and Jaubert, J.: An improved Ca45 protocol for investigating physiological mechanisms in coral calcification, Mar. Biol., 122, 453–459, https://doi.org/10.1007/bf00350879, 1995.
Yonge, C.: The significance of the relationship between corals and zooxanthellæ, Nature, 128, 309–311, https://doi.org/10.1038/128309a0, 1931.
Wolf-Gladrow, D. A., Zeebe, R. E., Klaas, C., Körtzinger, A., and Dickson, A. G.: Total alkalinity: the explicit conservative expression and its application to biogeochemical processes, Mar. Chem., 106, 287–300, https://doi.org/10.1016/j.marchem.2007.01.006, 2007.