the Creative Commons Attribution 4.0 License.
the Creative Commons Attribution 4.0 License.
 | 31 Jan 2020
Evidence for preferential protein depolymerization in wetland soils in response to external nitrogen availability provided by a novel FTIR routine
Julia Gensel
Marcus Elvert
Dominik Zak
Phragmites australis litters were incubated in three waterlogged anoxic wetland soils of different nutrient status for 75 d, and litter nitrogen (N) dynamics were analyzed by elemental analyses and Fourier transform infrared spectroscopy (FTIR). At the end of the incubation time, the N content in the remaining litter tissue had increased in most samples. Yet, the increase in N content was less pronounced when litters had been decomposed in a more-N-poor environment. FTIR was used to quantify the relative content of proteins in litter tissue and revealed a highly linear relationship between bulk N content and protein content. Changes in bulk N content thus paralleled and probably were governed by changes in litter protein content. Such changes are the result of two competing processes within decomposing litter: enzymatic protein depolymerization as a part of the litter breakdown process and microbial protein synthesis as a part of microbial biomass growth within the litter. Assuming microbial homeostasis, DNA signals in FTIR spectra were used to calculate the amount of microbial N in decomposed litter which ranged from 14 % to 42 % of the total litter N for all leaf samples. Microbial carbon (C) content and resultant calculated carbon use efficiencies (CUEs) indicate that microbial N in litter accumulated according to predictions of the stoichiometric decomposition theory. Subtracting microbial C and N contributions from litter, however, revealed site-dependent variations in the percentual amount of the remaining still-unprocessed plant N in litter compared to remaining plant C, an indicator for preferential protein depolymerization. For all leaf litters, the coefficient of preferential protein depolymerization (α), which relates N-compound depolymerization to C-compound depolymerization, ranged from 0.74–0.88 in a nutrient-rich detritus mud to 1.38–1.82 in Sphagnum peat, the most nutrient-poor substrate in this experiment. Preferential protein depolymerization from litter decomposing in Sphagnum peat leads to a gradual N depletion in the early phase of litter decomposition, which we propose as a preservation mechanism for vascular litter in Sphagnum peatlands.
- Article
(13058 KB) -
Supplement
(536 KB) - BibTeX
- EndNote


Accounting for 2 %–15 % of tissue dry mass, proteins are a minor biopolymeric constituent of plant litter (Kögel-Knabner, 2002). Yet, protein decomposition, commonly also called gross protein depolymerization, is a decisive subprocess of litter decomposition because proteins contain about 60 % of the total litter nitrogen (N), an essential nutrient for all organisms (Geisseler et al., 2010; Schulten and Schnitzer, 1997). Protein depolymerization is the process by which proteins in dead organic matter are broken down into smaller, N-containing fragments (amino acids) which are readily absorbable by microbial decomposers. Protein depolymerization is often described as a central driver of the terrestrial N cycle as it is the dominant process by which chemically bonded N, inaccessibly stored in litter or soil, becomes accessible for microorganisms or higher plants (Mooshammer et al., 2014a; Schimel and Bennett, 2004; Wild et al., 2015).
Despite its relevance, protein depolymerization is rarely discussed in litter decomposition studies, which may be attributed to analytical constraints in quantifying this process (Schimel and Bennett, 2004). Yet, protein depolymerization and its role in N cycling is not fundamentally distinct when compared to the depolymerization of carbon biopolymers, like lignin or cellulose, and their role in C cycling. Using a simplified picture, microbial decomposers release exoenzymes into their environment, which depolymerize the plant biopolymers in litter (Fig. 1). The thereby liberated monomers (sugars, fatty acids, amino acids, etc.) are assimilated by microorganisms and are either oxidized to generate metabolic energy or used as substrates for microbial biomass growth. While in the first case the depolymerized organic matter is lost from the litter, the fraction of depolymerized organic matter used for growth remains within the litter as newly formed microbial biomass (Reddy and DeLaune, 2008). The critical difference between C cycling and N cycling during litter decomposition is that C losses are an acceptable measure to describe litter decomposition, because the amount of depolymerized C converted into microbial biomass is small compared to conversion into carbon dioxide or dissolved organic carbon (Manzoni et al., 2012; Schimel and Bennett, 2004; Sinsabaugh et al., 2013). A switch from litter C loss or mass loss, which are mineralization-based measures, to C-compound depolymerization is consequently not required to study C dynamics during litter decomposition.
For N cycling, the corresponding processes are protein depolymerization (or more generally N-compound depolymerization) and N mineralization, which is the breakdown of amino acids into ammonium (), CO2, and H2O (Andresen et al., 2015; Miltner and Zech, 1999; Schimel and Bennett, 2004). Yet, litter N losses or formation are inadequate tools to estimate protein depolymerization. Microbial biomass has a protein content of 40 %–60 % dry mass, and the microbial N demand for growth and activity is correspondingly high (Naumann, 2006). The N content in litter, on the other hand, can be very variable and is often low. Microbes do not have to sustain N mineralization for metabolic energy generation as they do for C. They simply use as much N as they need for their metabolic activity and release only N surpluses to the environment. The nitrogen use efficiency (NUE) is consequently more variable than the carbon use efficiency (CUE), with measured values ranging from 15 %, if the substrate is rich in proteins, to 100 %, if protein-poor litter is being decomposed (Mooshammer et al., 2014a). In the latter case, all the N released from plant tissue due to protein depolymerization is converted to microbial biomass N. The net N loss to the environment is zero, and the relative litter N content sharply increases as C is constantly lost. Bulk N losses during litter decomposition are consequently not useful indicators of how much plant protein is being depolymerized, or has been depolymerized, at a certain stage of litter decomposition. To assess N cycling during litter decomposition, there is consequently a need to quantify depolymerized protein in decomposed litter. Yet, the available methods to do so are limited as it is challenging to differentiate the two N fractions in decomposed litter, which are the still-unprocessed plant N and newly formed microbial N (Tremblay and Benner, 2006).

Figure 1A conceptual view of carbon (C) cycling and nitrogen (N) cycling during litter decomposition. Microbial decomposers release exoenzymes (1), which depolymerize plant biopolymers to soluble monomers (2). The relative distribution of formed monomers depends on plant tissue composition and specific enzyme activities. Microbial decomposers assimilate the monomers (3) and either use the contained organic matter for growth or to obtain energy through mineralization (4). Microbial growth leads to an accumulation of microbial biomass within litter. N mineralization leads to a loss of ammonium to the environment (5), but this process is only active if amino acid–N supply (due to protein depolymerization) exceeds microbial N demand. Ammonium from the environment can additionally serve to fulfill microbial N demand (6).
The lack of analytical methods to quantify protein depolymerization furthermore sets a limit on the study of the effects of external N on litter decomposition. In addition to obtaining N through protein depolymerization, microorganisms are capable of using or dissolved organic nitrogen (DON) from the environment to fulfill their N demand. The microbial uptake of and its conversion into biomass is called N immobilization (Schimel and Bennett, 2004). Direct evidence for N immobilization is commonly found when N-poor litter decomposes, in which case the total amount of N in litter can exceed the N amount initially present in the undecomposed litter (net N immobilization) (Tremblay and Benner, 2006). N immobilization can in this case accelerate litter decomposition as an otherwise occurring N limitation, which might limit microbial growth and activity, is prevented (Gulis and Suberkropp, 2003; Rejmánková and Houdková, 2006). Effects of exogenous N on litter N dynamics during decomposition are often found (Moore et al., 2006; Prescott, 2005) and are of high scientific interest due to the potential impact of anthropogenic nutrient inputs on C cycling and N cycling on an ecosystem scale. Results of litter decomposition experiments, however, report contrasting effects. Site N enrichment can increase N accumulation in litter and decomposition rates (Gulis and Suberkropp, 2003; Hobbie and Gough, 2004; Rejmánková and Houdková, 2006), while other studies found no effect of N fertilization (Keuskamp et al., 2015) or even decreasing decomposition rates (Ågren et al., 2001; Zhang et al., 2018). When vascular litter decomposes in Sphagnum peat, unexpectedly high net N losses from litter can occur (Scheffer et al., 2001; Verhoeven et al., 1990). Traditionally, such site-dependent variations in net N mineralization or immobilization are, slightly arbitrarily, seen as variations in the accumulation of microbial N. Variations in the amount of residual, unprocessed plant N as a result of different protein depolymerization rates are rarely discussed as a potential underlying mechanism.
In this study, we report a litter decomposition experiment we performed in anoxic organic soils of three peatlands of different biogeochemical characteristics. As decomposing litter, we chose Phragmites australis leaves and rhizomes from the three sites which spanned a strong gradient in initial N content. To disentangle litter compositional effects and decomposition site effects, leaf litter from each site was decomposed in each organic soil. Although the characterization of litter decomposition in pristine and disturbed peatlands was the initial objective, we in particular found site-dependent variations of net N mineralization in litter. To elucidate the reason for these patterns, we developed a new method to disentangle plant and microbial N in decomposed litter using Fourier transform infrared spectroscopy (FTIR). Our results indicate that site-dependent deviations of N dynamics were not due to variation in the accumulation of microbial N within litter but due to variations in the remaining amount of plant N, an indicator of preferential protein depolymerization.
2.1 Decomposition experiment
To study N cycling in decomposing litter we performed a 75 d litterbag experiment in three organic soils with P. australis leaf litters and P. australis rhizomes in the laboratory. P. australis samples and saturated organic soils were collected from three peatlands in northeastern Germany. Saturated anoxic organic soil substrates were collected in June 2013 and included Sphagnum peat from an oligotrophic kettle-hole mire (peat , mass ratio), sedge–brown-moss peat from a mesotrophic terrestrialization mire (peat ), and a detritus mud from an eutrophic rewetted fen (sediment ). Further site characteristics are presented in Table S1 in the Supplement. All organic soil substrates were sampled into polyethylene containers (), water from the corresponding site was added to maintain waterlogged conditions, and the containers were transported to the lab 3 d before starting the experiment (Fig. 2a). The containers were stored in the dark at 20±1 ∘C during the experiment.
P. australis leaf litter was collected from the same three sites in autumn 2012, air-dried and stored at −20 ∘C until start of the experiment. We only collected brown leaves that were still connected to the plant. Leaves were thawed shortly before starting the experiment. To minimize abiotic leaching in the initial phase of decomposition, all leaves were subject to a preleaching procedure. In detail, subsets of 25 g leaves were leached in 5 L 1.5 mM NaCl solution, prepared from ultrapure water, for 17 h with one water exchange after 14 h. The leachate was discharged, and the leaves were freeze-dried and cut into pieces of 5 cm length, thereby discarding leaf base and apex. During soil sampling, P. australis rhizomes were harvested from 10 to 30 cm below the soil surface from living P. australis stands at all three sites. The rhizomes were directly freeze-dried and cut into pieces of 5 cm length.
At the start of the experiment, litterbags (Nylon, 8 cm×8 cm, 0.5 mm mesh size), filled with 1 g preleached leaves or 3 g rhizomes, were incubated close to the bottom of each soil container (Fig. 2b). Each type of litter was incubated with triplicate litterbags (n=3). Furthermore, leaves from each site were incubated in each soil substrate, while rhizomes were only incubated in their home soil. All litterbags were recovered after 75 d, and litters were gently rinsed with distilled water and freeze-dried. After weighing, litters were milled (Pulverisette 9, Fritsch GmbH) and stored at −20 ∘C in amber glass vials. Three undecomposed subsamples of each litter type were analyzed as were the decomposed samples.
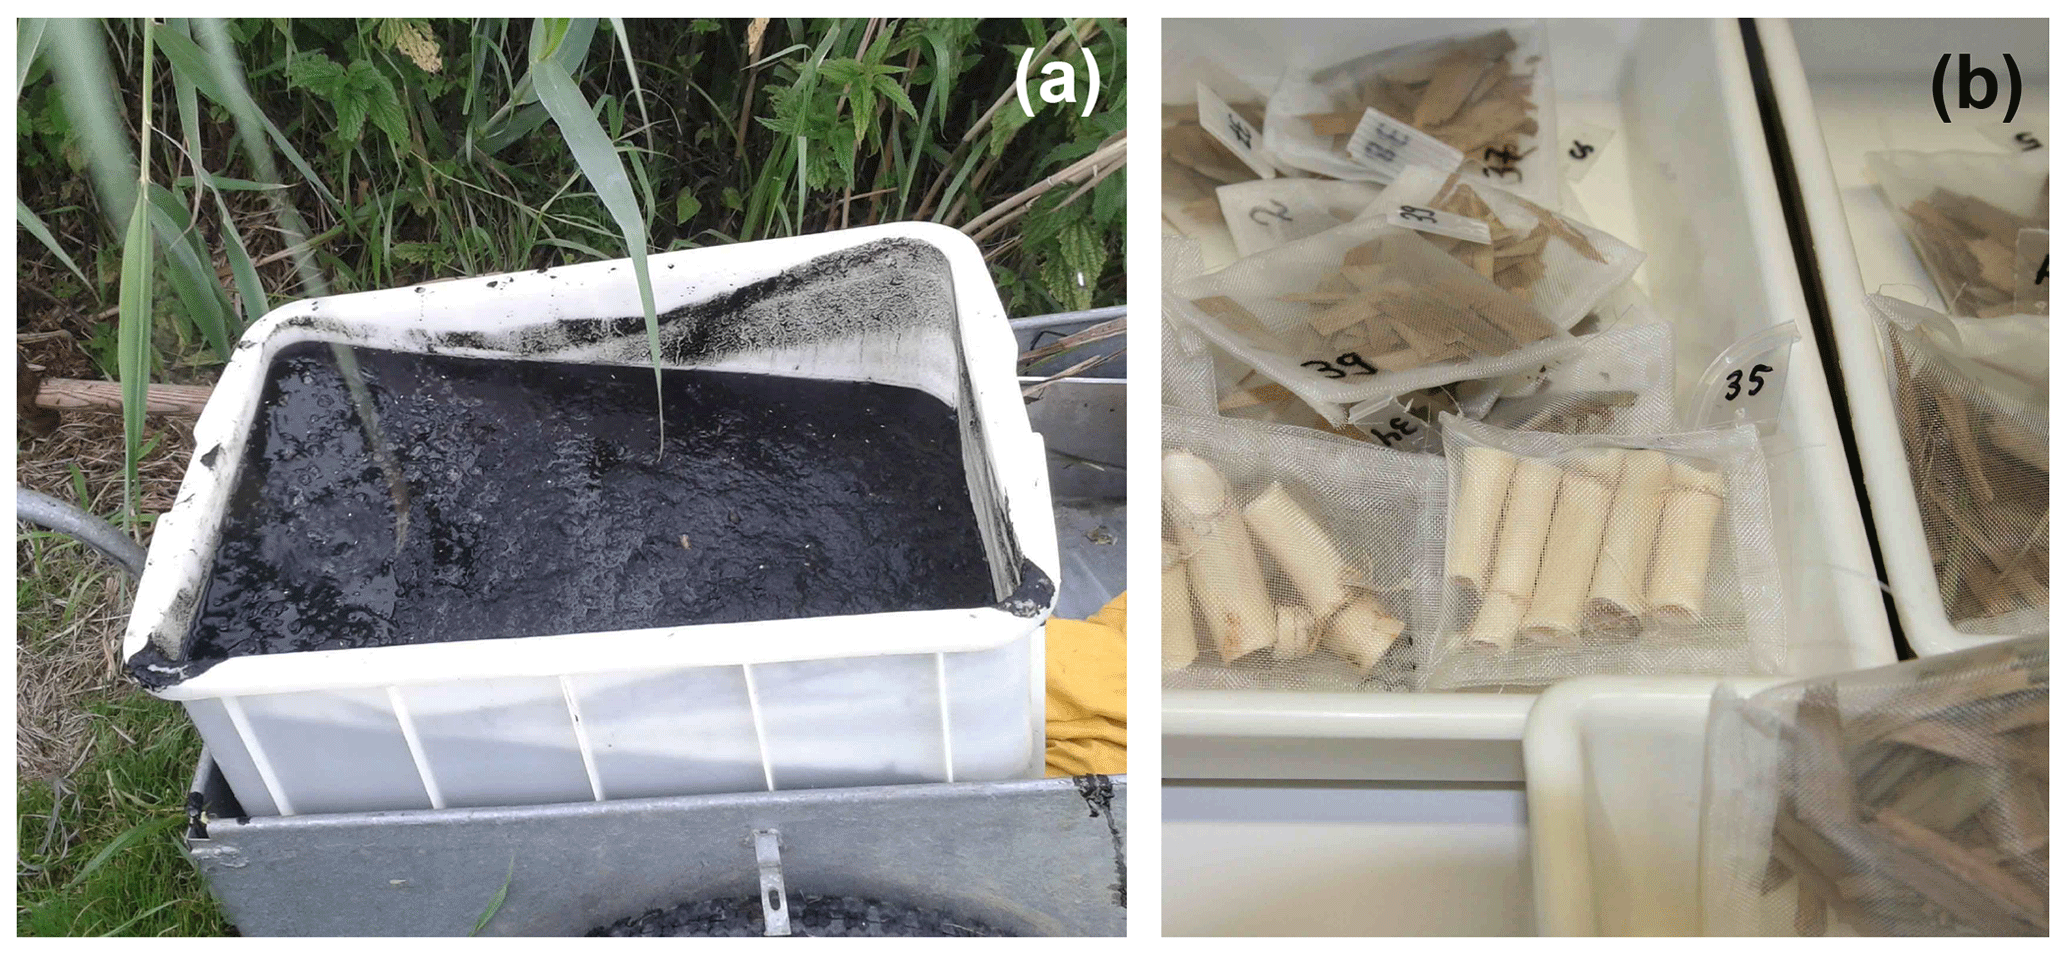
Figure 2(a) The container with the detritus mud (high-N organic soil) from the rewetted Stangenhagen fen. Litterbags were placed in the containers in the anoxic zone of the substrate close to the bottom. (b) Litterbags with leaf and rhizome litter before incubation.
2.2 Chemical analyses
The C and N content of milled samples was measured using an element analyzer (vario EL by Elementar). Porewater analyses were performed according to Zak et al. (2015) and data are presented in Table S1.
Plant litters and soil substrates were analyzed for their lignin phenol contents using the alkaline CuO oxidation method according to Kaiser and Benner (2011) with method modifications according to Reuter et al. (2017). Data on lignin phenol content of the organic soils are presented in Table S1. Data on lignin content of initial and decomposed litters can be accessed through the Pangaea data repository (Reuter et al., 2019).
2.3 Infrared spectroscopy
FTIR spectra of initial and decomposed litter samples were measured in transmittance mode using the KBr pellet technique. A 1 mg finely milled sample was diluted with 300 mg oven-dried KBr (for IR spectroscopy, MERCK) and homogenized with a sample mill. The sample mixture was transferred to an evacuable KBr pellet die, evacuated for 1 min and pressed at 20 000 psi for 4 min to form KBr pellets with a diameter of 13 mm and about 1 mm thickness. FTIR spectra were recorded at a spectral resolution of 4 cm−1 and 200 accumulated scans with a Shimadzu IRTracer-100 spectrophotometer, equipped with a DLaTGS (deuterated L-alanine-doped triglycine sulfate) detector. Background scans were analyzed before each sample run with pellets of pure KBr.
Using the LabSolutions IR software (Shimadzu Corp.), the FTIR spectra were converted into absorbance units and baseline corrected. Second-derivative spectra were calculated with the Savitzky–Golay method with 13 convolution points. After data export, all absorbance and second-derivative spectra were vector-normalized in the spectral range 1900 to 800 cm−1 using Microsoft Excel (version 12.3.6). FTIR difference spectra were calculated by spectral subtraction of specific vector-normalized spectra with the average of the spectra of the three replicate undecomposed samples of the same litter type and multiplied with 100.
A curve fitting was performed in the region 1850 to 1300 cm−1 using OriginPro Peak Analyzer software (version 8.5.0) using Voigt-shaped bands. To achieve reproducible fitting results, constraints were imposed on Gaussian and Lorentzian peak widths and positions, leaving the peak height as the only parameter to be optimized by the software. Before fitting, the baseline was set to zero at 1900 cm−1, which in addition required a renormalization of spectra. Information on peak widths and position can be found in Table S2.
Infrared spectra were used to obtain semiquantitative data on litter protein content and on the accumulation of DNA within the litter due to microbial decomposition. The protein content was determined by the peak area of the plotted amide II band centered at 1541 cm−1. The accumulation of DNA was calculated from the height, as measured from the zero line, of the antisymmetric phosphodiester band νas() at 1220 cm−1 in the second-derivative difference spectra, respectively.
2.4 Statistical analyses
All the statistical analyses were performed using the R software RStudio (version 1.1.383, RStudio, Inc.). To test differences of parameters the Mann–Whitney U test (Wilcoxon rank sum test in R) was performed, and for testing dependencies the Kruskal–Wallis rank sum test in combination with pairwise comparisons using the Wilcoxon rank sum test was performed. The relationships between amide I, amide II, and bulk litter N content were tested with combined data of all initial and decomposed plant litters using the linear regression model of R.
Table 1Bulk nitrogen (N) contents and carbon:nitrogen ratios (C∕N) of initial and anaerobically decomposed Phragmites australis leaves and rhizomes.
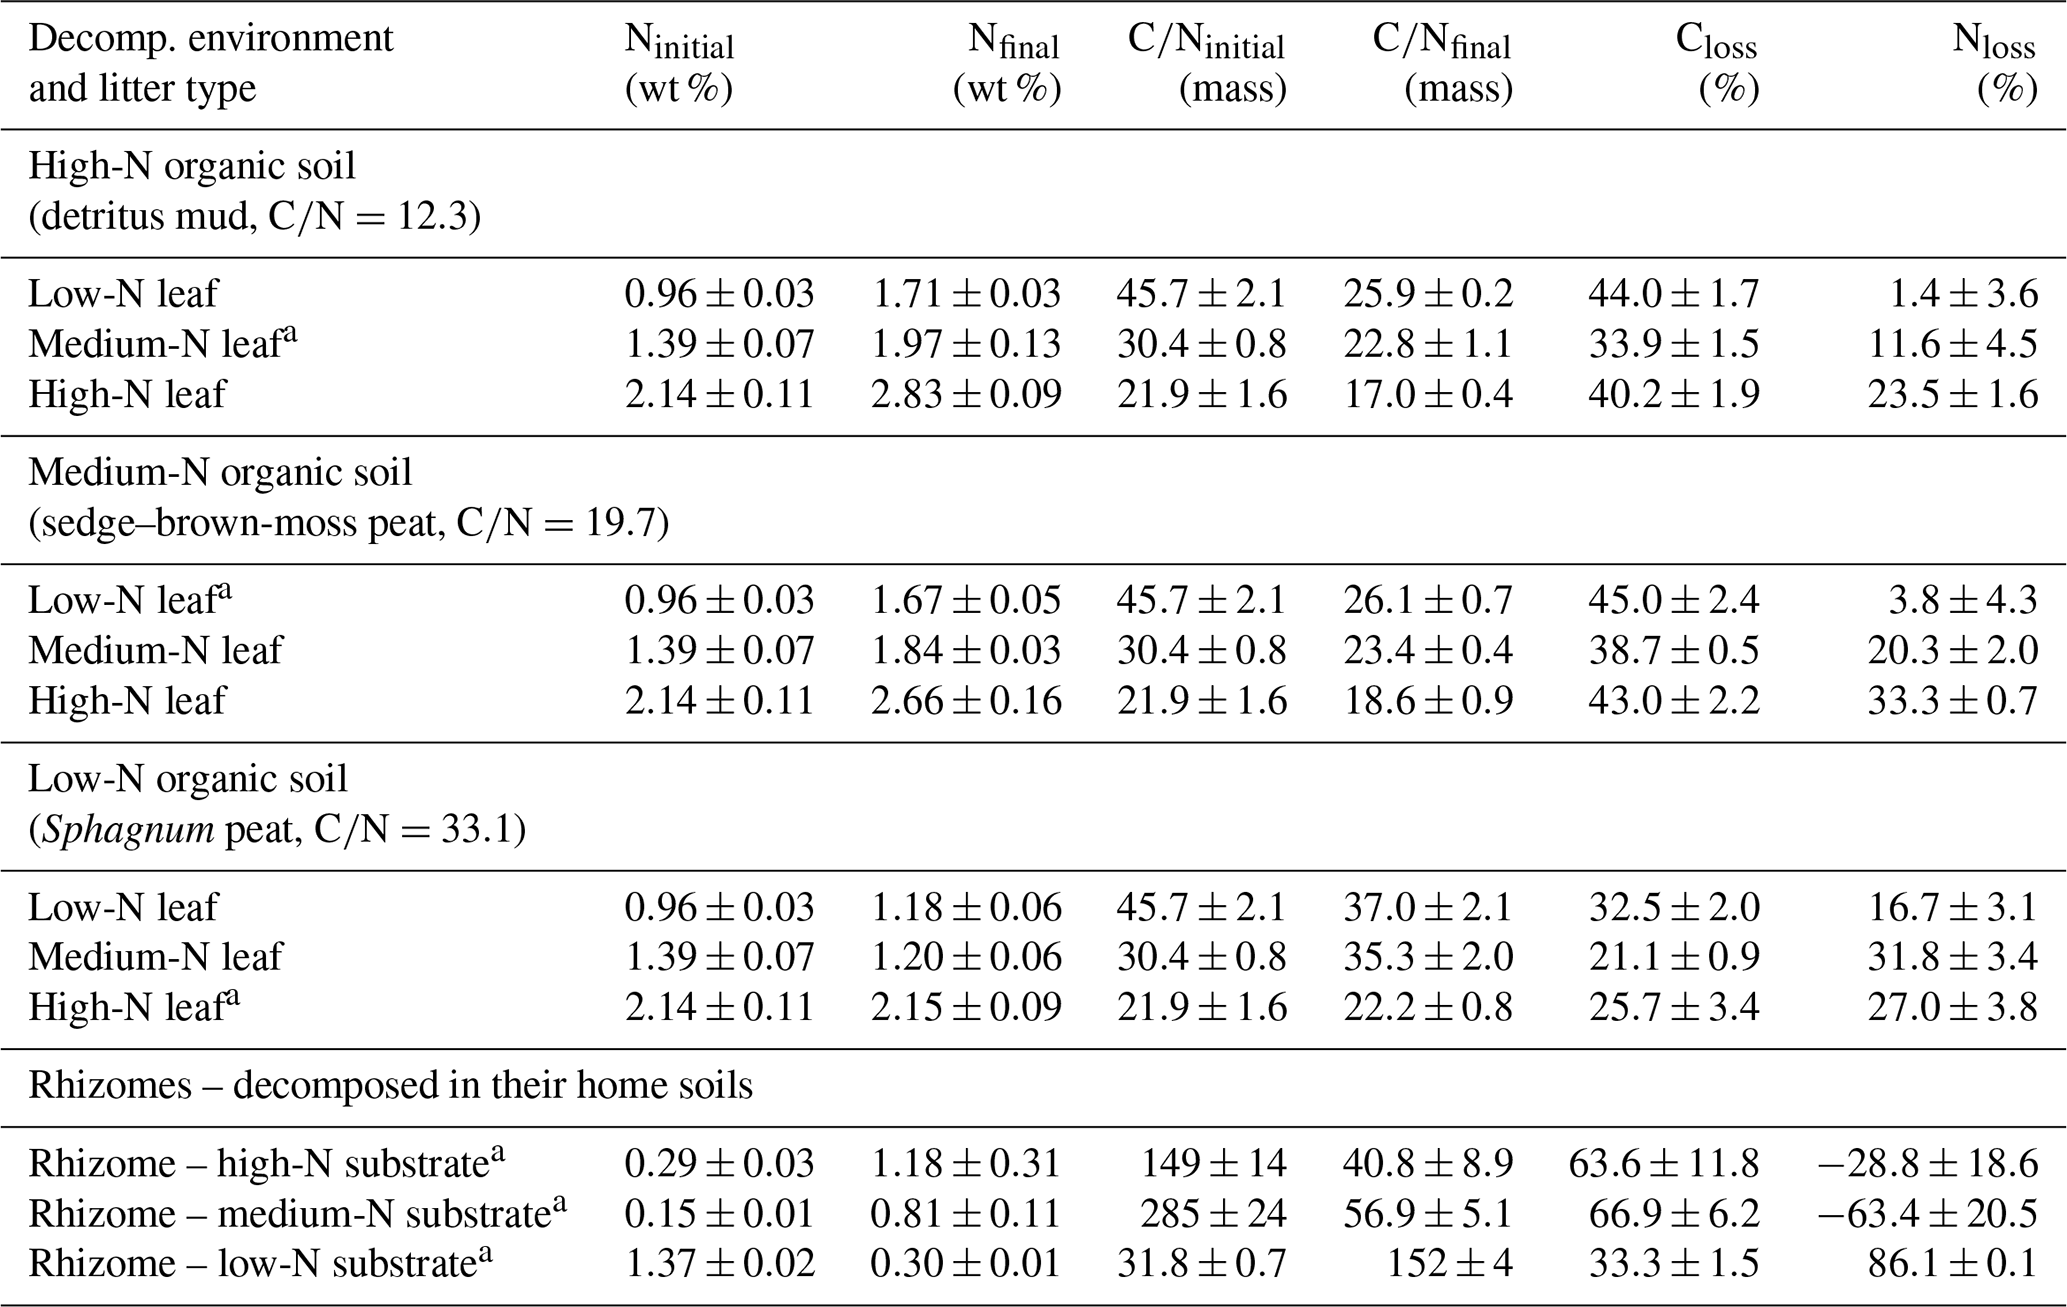
a Decomposition in home soil.
3.1 Bulk C and N losses from litter
P. australis leaves and rhizomes were anaerobically decomposed in three anoxic, waterlogged soil substrates, i.e., two peat substrates and a detritus mud. The detritus mud, sampled from a rewetted fen, had a carbon:nitrogen (C∕N) ratio of 12.3 and 23.4 mg L−1 -N and 8.1 mg L−1 DON in the porewater. A sedge–brown-moss peat substrate had a C∕N of 19.7 and 2.1 mg L−1 -N and 0.7 mg L−1 DON, and a Sphagnum peat had a C∕N of 33.1, about 1.0 mg L−1 -N and 0.8 mg L−1 DON. Further site information is provided in Table S1. For convenience, we will term the three decomposition environments “high-N soil”, “medium-N soil”, and “low-N soil”. Leached P. australis leaf litters from these sites had initial C∕N ratios of 30.4, 45.7, and 21.9. These three leaf litters will be termed “medium-N leaf”, “low-N leaf”, and “high-N leaf”. P. australis rhizome litters from these sites had C∕N ratios of 149, 285, and 31.8, respectively. A discussion of the variability of initial litter C∕N ratios can be found in Reuter et al. (2019).
After 75 d of anaerobic decomposition, leaf litter C losses ranged from 21 % to 45 % (Table 1). In each soil substrate, the medium-N leaves showed the lowest litter C loss, which ranged from 21 % to 34 %. For low-N and high-N leaves, decomposed in the medium-N and high-N substrates, C losses were very similar, ranging from 40 % to 45 %. In the low-N substrate, i.e., the Sphagnum peat, each leaf litter type showed the lowest C loss with values ranging from 21 % to 33 %.
The initial litter C∕N ratio is often used as a measure for litter quality (Aerts, 1997; Coûteaux et al., 1995; Güsewell and Koerselman, 2002; McJannet et al., 1995; Rejmánková and Houdková, 2006). It is assumed that a higher initial N content with respect to C content leads to more N being available for microbial decomposers during enzymatic litter breakdown, which generates favorable decomposition conditions. In our study, this trend is not detected. The highest litter C losses were observed for leaf litter with the lowest initial N content. This suggests that leaf litter decomposition in this experiment was not N limited in terms of initial litter N content, probably due to the prevailing anoxic conditions. Anaerobic decomposers gain less energy per mole of catabolized organic matter; thus, a higher proportion of the depolymerized organic matter must be oxidized, and less C remains for biomass growth. CUE values for anaerobic decomposers range from 5 % to 10 %, and this low value also reduces the required amount of N the litter must provide (Manzoni and Porporato, 2009; Reddy and DeLaune, 2008).
In line with these considerations, total leaf litter N losses in this experiment were positively correlated with the initial litter N content (R2=0.51, p<0.001). In the medium-N soil, for example, net N losses accounted for 4 %, 20 %, and 33 % for litter of an initial N content of 0.96 %, 1.39 %, and 2.14 %. With respect to stoichiometric considerations, it can be concluded that, during litter breakdown, excess N was depolymerized from litter of higher initial N content and N mineralization gained in significance.
Another N flux detected in this study is the immobilization of external N from the soil porewater. Net N immobilization is observed for two rhizome litters. For these samples, the absolute amount of N within the decomposed tissue exceeded the N amount in the initial, undecomposed litter, denoted by negative N loss values in Table 1. Rhizomes decomposed in the N-poor Sphagnum peat, on the other hand, had an initially high N content but showed the highest net N loss of 86.1 %.
For leaf litter samples, the impact of gross immobilization of N from the environment into the litter cannot unequivocally be determined from C and N loss data. Yet, a site effect on N dynamics is apparent because for each leaf litter type the net N losses increased with decreasing site N availability. This is most notable when litter decomposition in the medium-N and high-N substrate (sedge–brown-moss peat vs. detritus mud) is directly compared. The high-N leaves, for example, showed a similar C loss in both substrates. Yet, net N losses differed, accounting for 33 % N after decomposition in the medium-N substrate but only 24 % N in the high-N substrates. The litter N content of this sample increased from 2.14 % to 2.83 % N (wt %) for decomposition in the high-N substrate but only to 2.66 % in the medium-N substrate. In the low-N substrate, on the other hand, net N losses from litter were comparably high and even exceeded C losses for the medium-N leaf litter. The N content of this sample dropped from initially 1.39 % to 1.20 % after 75 decomposition days, a finding that cannot reasonably be explained by variations in CUE or NUE. A net N loss that exceeds the net C loss is an indicator of preferential protein depolymerization.
3.2 Molecular characterization of initial and decomposed litter by FTIR spectroscopy
Changing litter C∕N ratios are one indicator that the chemical composition of litter changed during decomposition. FTIR spectroscopy was used to gain a deeper insight into these changes. FTIR absorption bands can be assigned to molecular subunits present in the litter, which in some cases are specific for single biopolymers like lignin, carbohydrates, lipids, proteins, or nucleic acids (Naumann, 2006; Pandey and Pitman, 2003; Whelan et al., 2014). Intensity changes of such bands due to decomposition allow a semiquantitative analysis of the enrichment or depletion of the specific biopolymer. Figure 3a shows the spectra of initial and decomposed rhizomes from the medium-N site. High C losses of 67 % and the increase in bulk N from initially 0.29 % to 1.18 % are associated with substantial shifts in chemical composition. The preferential loss of cellulose and hemicellulose is revealed by decreasing absorption intensities in the region 1200–900 cm−1. Lignin, on the other hand, relatively accumulated, which is best seen by the increase in the aromatic skeletal vibration νs(Aryl) at 1515 cm−1. These findings are in agreement with other decomposition studies in that the mass loss in the early stage of decomposition is mainly a result of carbohydrate decomposition, while more-decay-resistant lignin accumulates (Berg and McClaugherty, 2003).
Lignin and carbohydrate signals in FTIR spectra predominantly originate from plant tissue. Microbial biomass does contain 10 %–20 % carbohydrates, but with respect to the high amount of carbohydrates in plant tissue, the contribution of microbial carbohydrates in the spectra of decomposed litter can be neglected. The same is true for lignin, which is solely found in plant tissue.
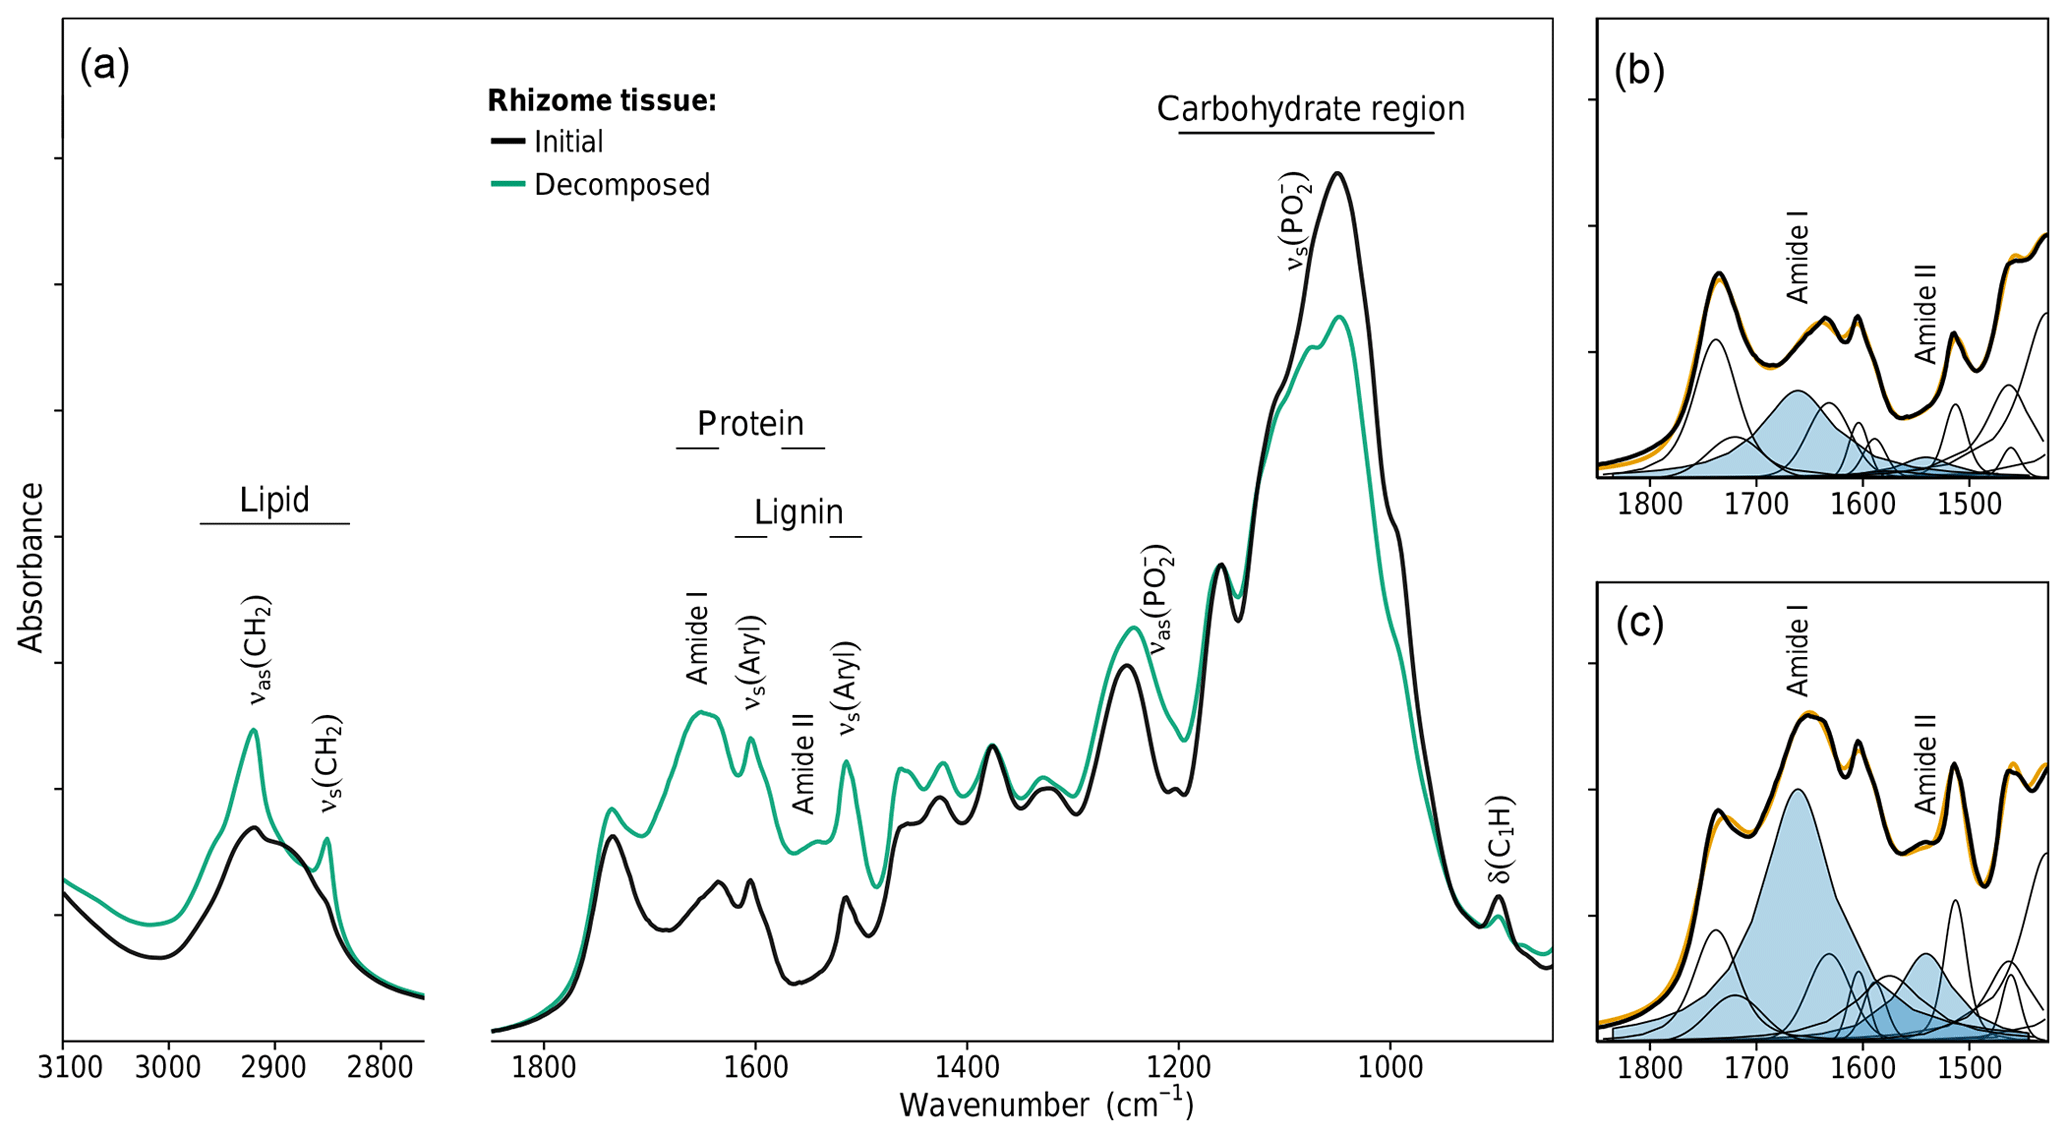
Figure 3FTIR spectroscopic analysis of changes in rhizome tissue chemical composition after decomposition in the medium-N soil. (a) FTIR absorption spectra. (b, c) Peak fitting of the FTIR spectra of the initial and decomposed rhizomes. Plotted bands in blue denote the amide I and amide II bands of proteins.
For two other classes of biopolymers, this is different. Lipids and proteins are abundant in both plant tissue and microbial biomass. Lipids give rise to two sharp bands in the spectral region 3000–2800 cm−1 (the symmetric and antisymmetric CH2 stretches). While lipids are a prominent component of plant tissue (waxes), their bands were nearly absent in undecomposed rhizome spectra (Fig. 3a). The substantial increase in these bands due to decomposition is unlikely to be caused by selective preservation of plant lipids but implies the accumulation of microbial biomass which has a lipid content of 10 %–15 % dry weight (Naumann, 2006). This conclusion is in line with the prevailing perception in soil science that the accumulation of aliphatics in soil organic matter is not caused by selective preservation of plant lipids but is due to microbial cell constituents making up a large to dominant fraction of aliphatic soil organic matter (Marín-Spiotta et al., 2014).
Similarly, proteins are present in plant tissue but also account for 40 %–60 % dry weight in microbial biomass (Naumann, 2006). The amide I band at 1661 cm−1 and the amide II band at 1541 cm−1 are the two major FTIR signals of proteins. These bands are present in the spectra of undecomposed rhizomes, but their strong increase due to decomposition indicates a substantial protein enrichment within the litter, which is another indicator of the accumulation of microbial biomass and an expected pattern as bulk N data revealed net N immobilization to have occurred in rhizome litter decomposed in the medium-N substrate.
The amide I and amide II bands of proteins lie in a spectral region of high band overlap and are rather broad compared to adjacent signals. To more closely analyze protein band changes, we performed a peak fitting routine (Fig. 3b, c). The fitted amide I and amide II band intensities were highly correlated with each other over all initial and decomposed litters (R2=0.95, p<0.001, Fig. 4a). This corroborates the peak fitting since those two bands arise from the same molecular subunit and should change synchronously. More importantly, we found a highly linear correlation between the amidic bands and the bulk litter N content for all initial and decomposed samples (R2=0.96, p<0.001, Fig. 4b). This correlation suggests that variations in initial N content of undecomposed litters, as well as N changes due to decomposition, parallel and probably are governed by changes in litter protein content. This result resembles a 4-year subaqueous litter decomposition study in which litter protein content, quantified as total hydrolyzable amino acids (THAA), made up 52 % of the bulk litter N content over the complete course of decomposition, despite high mass losses and high changes in litter N content (Tremblay and Benner, 2006).
Infrared spectroscopy consequently confirms that changes in bulk litter N content parallel changes in protein content, which are a result of enzymatic protein depolymerization and microbial protein resynthesis, a finding that rationalizes the discussion of bulk litter N changes directly in terms of litter protein dynamics. It however does not directly provide new insights into gross N transformations during litter decomposition. Similar to protein quantification as THAA, amide bands in FTIR spectra are not capable of distinguishing plant and microbial proteins within the litter but only detect bulk changes (Tremblay and Benner, 2006).
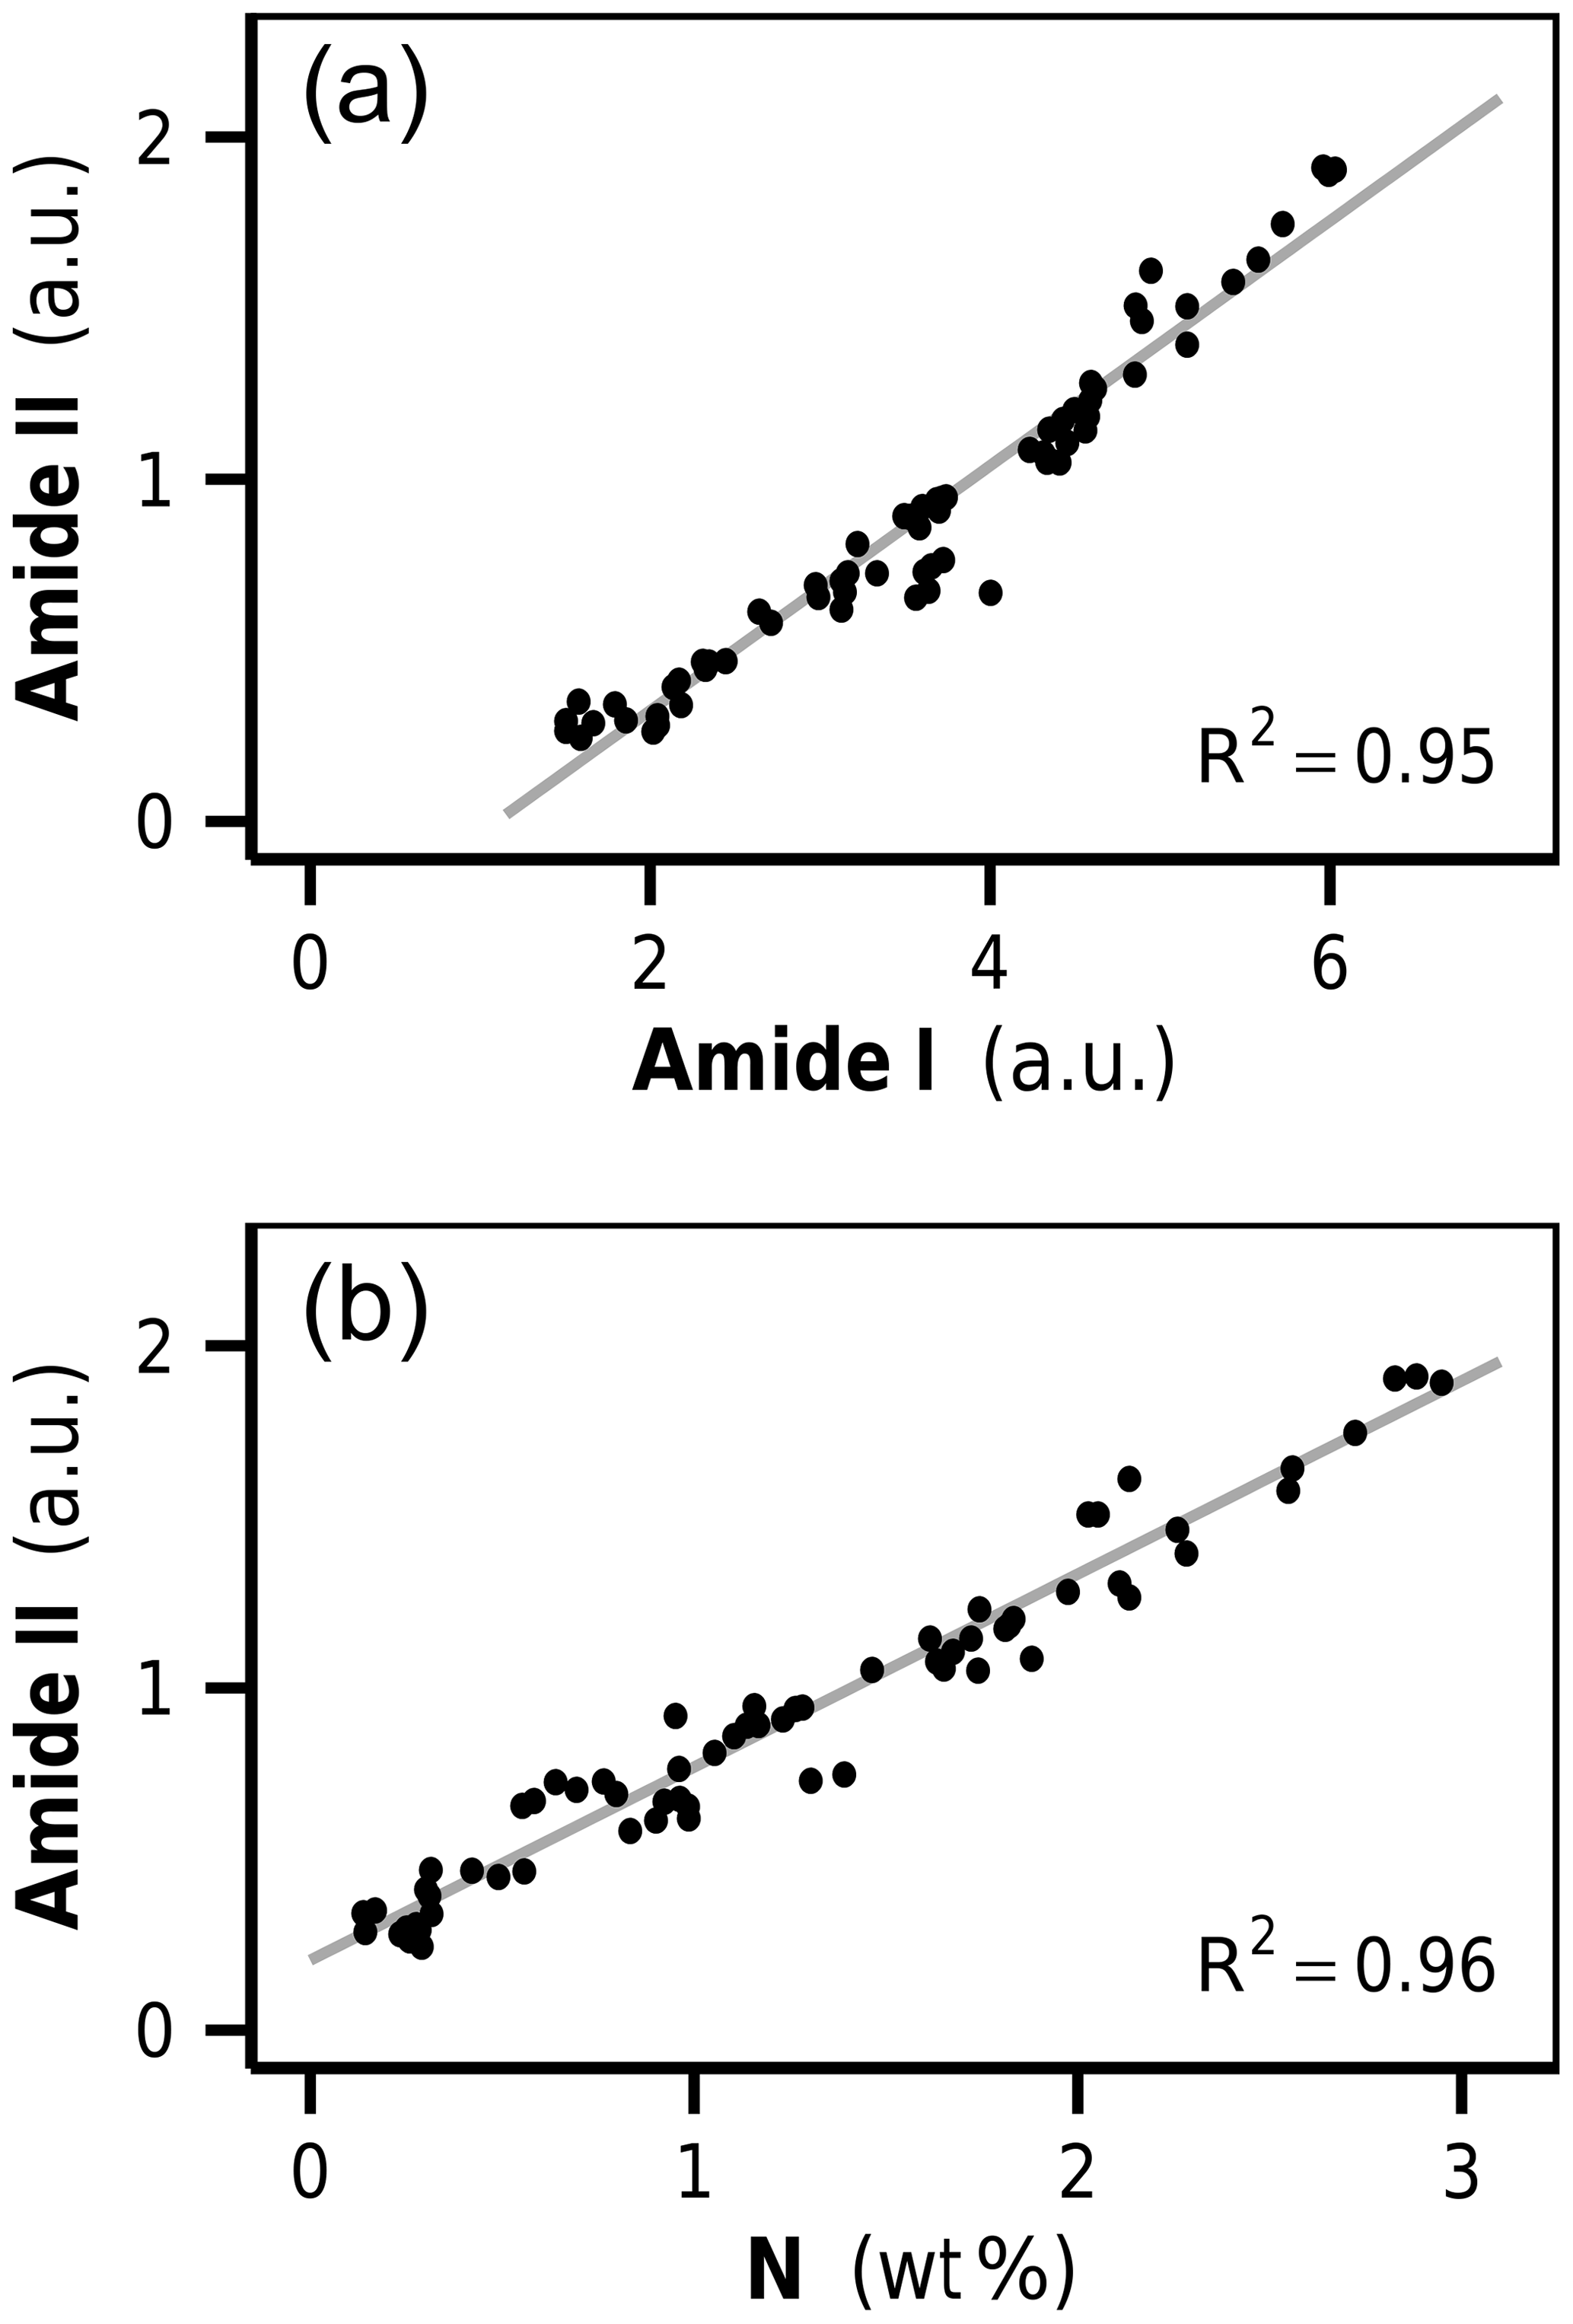
Figure 4(a) Correlation between amide I and amide II over all undecomposed and decomposed litters, and (b) the correlation between bulk litter N content and amide II. a.u.: arbitrary units.
3.3 Quantification of microbial N in litter from FTIR
Here we wish to propose a novel approach to distinguish plant N and microbial N in decomposed litter. Using the concept of microbial homeostasis, i.e., the constant biopolymeric composition of microbial cells, the amount of microbial N in litter should increase proportionally to all other microbial cell constituents (Mooshammer et al., 2014b). The amount of microbial N in a sample can thus indirectly be estimated from any other microbial biomass constituent that is absent in plant tissue. Compounds like muramic acid or the D enantiomers of amino acids have previously been used for that purpose as these are absent in plant tissue but found in bacterial cells (Tremblay and Benner, 2006). Other markers to quantify living microbial biomass are phospholipid fatty acids (PLFA) or the amount of DNA in a sample. DNA accounts for 2 %–4 % dry weight in microbial cells (Naumann, 2006) but is only minorly present in senescent plant tissue. Either directly extracted from a sample or measured from 18O incorporation after adding isotopically labeled water, DNA has been used as a predictor of microbial C in previous studies (Marstorp et al., 2000; Spohn et al., 2016).
DNA can be analyzed using FTIR, as it gives rise to two prominent signals which are the antisymmetric and symmetric phosphodiester band of the DNA backbone, νas() at 1220 cm−1 and νs() at 1090 cm−1 (Whelan et al., 2014). FTIR bands of DNA have not previously been reported in the spectra of decomposed litter because the amount of DNA is very small in such samples, and more intense absorption bands of other biomolecules overlap, dominantly carbohydrate signals (see Fig. 3a). Yet, DNA bands are detectable in the spectra of isolated microbial cells and have extensively been studied (Naumann, 2006). Notably the asymmetric phosphodiester band at 1220 cm−1 has been shown to be a semiquantitative marker of cellular DNA content (Zucchiatti et al., 2016).
In litter FTIR spectra, the two phosphodiester bands of DNA could be resolved through FTIR difference spectroscopy. FTIR difference spectroscopy is a method to overcome the problem that small changes in the molecular structure of a complex tissue are difficult to study as the corresponding spectral changes are very small compared to the signals of the unchanged residual organic matter (Moss et al., 2000). Yet, a subtraction of two FTIR spectra (unmodified and modified tissue) leads to a FTIR difference spectrum that selectively shows spectral changes.
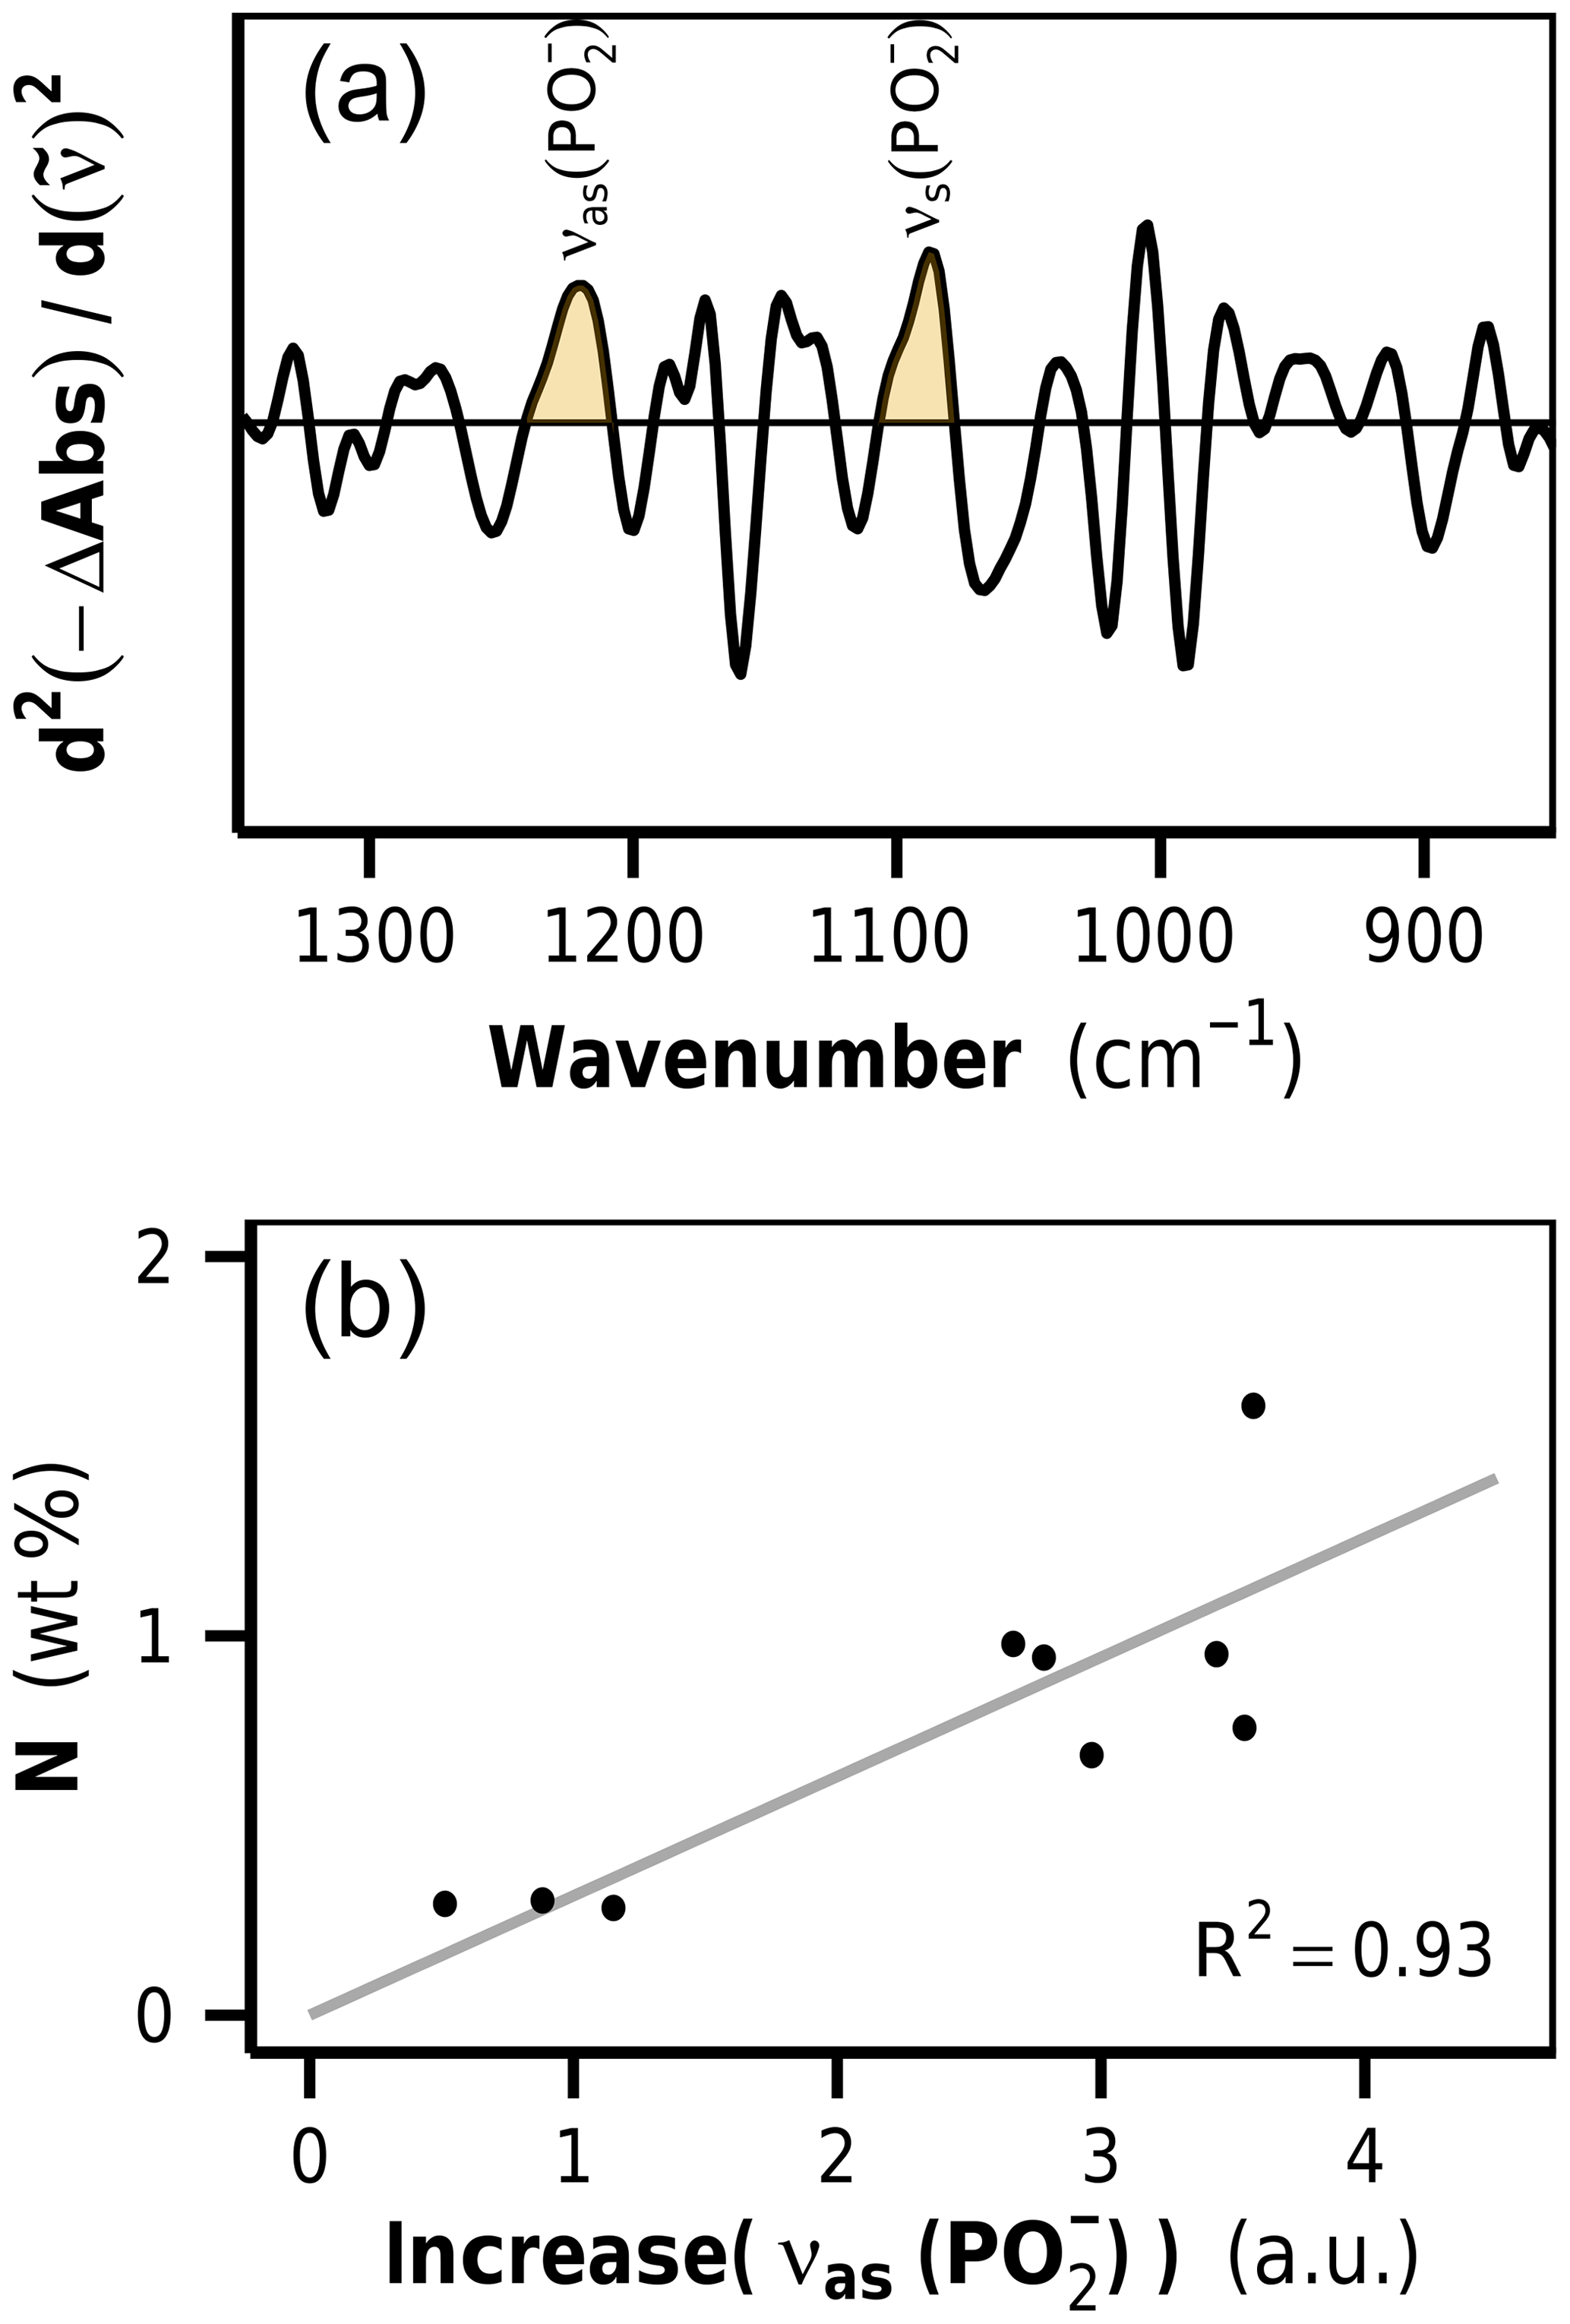
Figure 5(a) Second-derivative difference spectra show positive bands at 1220 and 1090 cm−1, identified as phosphodiester stretching vibrations of DNA. The band height of the asymmetric phosphodiester band at 1220 cm−1 is used as a marker for increases in microbial biomass content in litter. (b) Correlation between νas() increase and N content in decomposed rhizome litters. a.u.: arbitrary units.
The litter FTIR difference spectra (decomposed minus undecomposed litter) show negative bands for biomolecules that have preferentially been lost and positive bands for biomolecules that relatively accumulated or newly emerged (Fig. S1 in the Supplement). In particular, a positive band at 1220 cm−1 was detected, which we identified as the antisymmetric phosphodiester band of DNA. The second DNA band at 1090 cm−1 appeared as a shoulder. In order to remove baseline effects and to increase the resolution of the DNA bands, we formed the second derivatives of the FTIR difference spectra (Susi and Byler, 1983), wherein the height of the band at 1220 cm−1 was used as a semiquantitative marker for the content of newly formed DNA in the samples (Figs. 5a and S1).
Ultimately, the determined 1220 cm−1 band height, as a measure for microbial DNA, needed to be calibrated against the corresponding amount of newly formed microbial N. Such a calibration requires samples in which DNA and proteins are exclusively allocated to microorganisms. When microbial biomass markers like PLFA or muramic acid are used to quantify microbial biomass in litter, the calibration can be determined by analyzing cultured microbial cells (Rejmánková and Houdková, 2006; Tremblay and Benner, 2006). FTIR spectra of isolated microbial cells were unavailable, and, furthermore, it is likely that such an approach would lead to unsatisfying results due to the strong plant matrix in litter, which most likely affects the DNA band height in a spectroscopic method like FTIR and is the reason why an in situ calibration was needed. In this study we used the decomposed rhizome litter spectra as calibration standards, assuming that these contained only neglectable amounts of remaining plant N. In fact, the linear regression model of nitrogen content on DNA increase for these samples had an intercept very close to zero, indicating the usefulness of these samples as calibration standards (Fig. 5b). The intercept of the regression line close to zero was furthermore an important aspect during the critical assessment of the extracted DNA signals because a linear relationship between DNA and N in these samples is in agreement with the stoichiometric decomposition theory and microbial homeostasis.
The assumption that no plant N remains in the decomposed rhizomes possibly leads to an overestimation of microbial N in the later-described results as some plant-bound N might remain in the decomposed rhizomes. In previous studies, it was regularly assumed that the relative plant N content within litter remains constant during decomposition. Here, bulk N content in one rhizome litter increased from 0.15 % to 0.81 %, so we equally could have assumed a microbial N content of 0.66 % and 0.15 % N to be plant-bound. Our method would in this case overestimate microbial N in leaf litter by about 18 %. However, we tested the effect of a correspondingly lower slope of the calibration curve during data evaluation, and all here-presented trends remained unaffected. Furthermore, rhizome decomposition in the N-poor soil resulted in a decreasing litter N from initially 1.37 % to 0.30 %, which shows that a preferential loss of plant N from the litter is a possible process. Therefore, assuming that all N in decomposed rhizomes was microbial N, we calculated microbial N in decomposed leaf litter as N.
Table 2Carbon (C) and nitrogen (N) data of leaf litter, the microbial N content within the litter samples, microbial carbon use efficiencies (CUEs), net nitrogen use efficiencies (nNUEs), and parameters of the plant biomass fraction within the litter. The litter encompasses the remaining plant biomass and the newly formed microbial biomass.
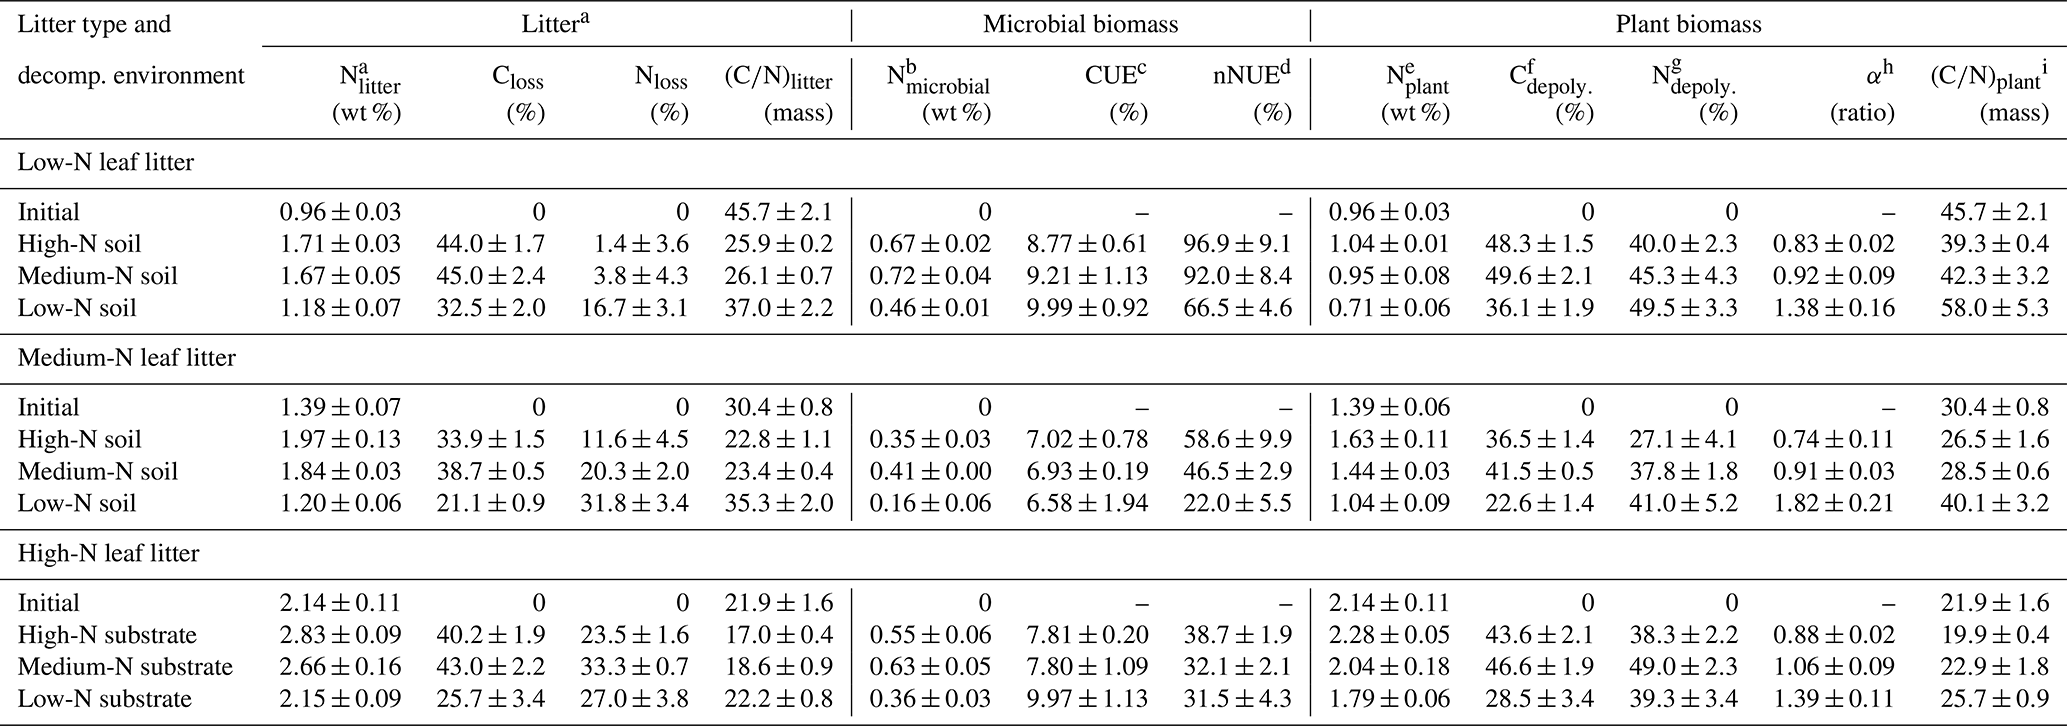
a Decomposed litter contains plant and microbial N.
b Nmicrobial: N content in decomposed litter belonging to microorganisms (in wt % litter dry mass).
c CUE: carbon use efficiency.
d nNUE: net nitrogen use efficiency.
e Nplant: N content in decomposed litter belonging to plant OM (in wt % litter dry mass).
f Cdepoly.: fraction of initially present plant C which has been depolymerized.
g Ndepoly.: fraction of initially present plant N which has been depolymerized.
h (α): coefficient of preferential protein decomposition (Ndepoly∕Cdepoly).
i (C∕N)plant: carbon-to-nitrogen ratio of the plant OM fraction within the litter.
3.4 Microbial N in decomposed litter
Applying the calibration on leaf litter, the determined microbial N in decomposed leaves ranged from 0.16 % to 0.72 % litter dry mass or 14 % to 42 % of the total litter N (Table 2). The disentangling of plant and microbial N, presented graphically in Fig. 6, shows that the relative increase in N content due to decomposition is indeed dominantly caused by an accumulation of microbial N within the litter tissue. The relative microbial N contents between samples are, however, not directly representative for the total amount of microbial N, because each litter sample has a distinct remaining mass. Microbial N content was lowest after decomposition in the low-N soil for each litter type (rightmost bar in Fig. 6a, b and c). Yet, litter C losses were also lowest for these samples, so a low percentual microbial N content could represent a comparably high total N amount as the overall remaining litter mass is very high. On the other hand, stoichiometric considerations predict lower amounts of microbial biomass and thus microbial N for litters with lower C loss as the total decomposition process is less advanced.
In order to place the microbial N content of different samples into a relationship with one another and to take variations in C loss into account, we assumed microbial homeostasis and a microbial C∕N ratio of 5 (Mouginot et al., 2014). The thereby determinable total amount of newly formed microbial C was set in relation to the litter C loss, which leads to an estimate of the CUE (Manzoni, 2017). The CUE was determined as
The determined CUE values ranged from 6.6 % to 10.0 % and hence are within the expected range of values for anaerobic decomposition (Reddy and DeLaune, 2008) (Table 2). The CUEs were slightly affected by the leaf litter type. The medium-N leaf litter which in each soil showed the lowest C loss also showed lowest CUE values. Consequently, the C loss as well as the CUE indicate that this leaf litter type is not very decomposable compared to other leaves (Manzoni et al., 2012; Sinsabaugh et al., 2013; Takriti et al., 2018).
Besides this substrate quality trend, no significant effect of C loss or decomposition site on CUE was observed (both p>0.05). Each litter sample was decomposed at a rather constant CUE, independently of the biogeochemical variations of the soil in which decomposition took place. This finding is in line with the results of other studies like Spohn et al. (2016) in which incorporation of 18O from labeled water into microbial DNA was compared to CO2 formation and in which it was analogously found that the CUE can remain constant despite variations in substrate C∕N ratio or decomposition rate. In our study, in which a higher accumulation of total N in decomposing litter was observed in soils with a higher external nutrient availability, the constant CUEs indicate that these variations in N dynamics are not due to variations in microbial N accumulation.
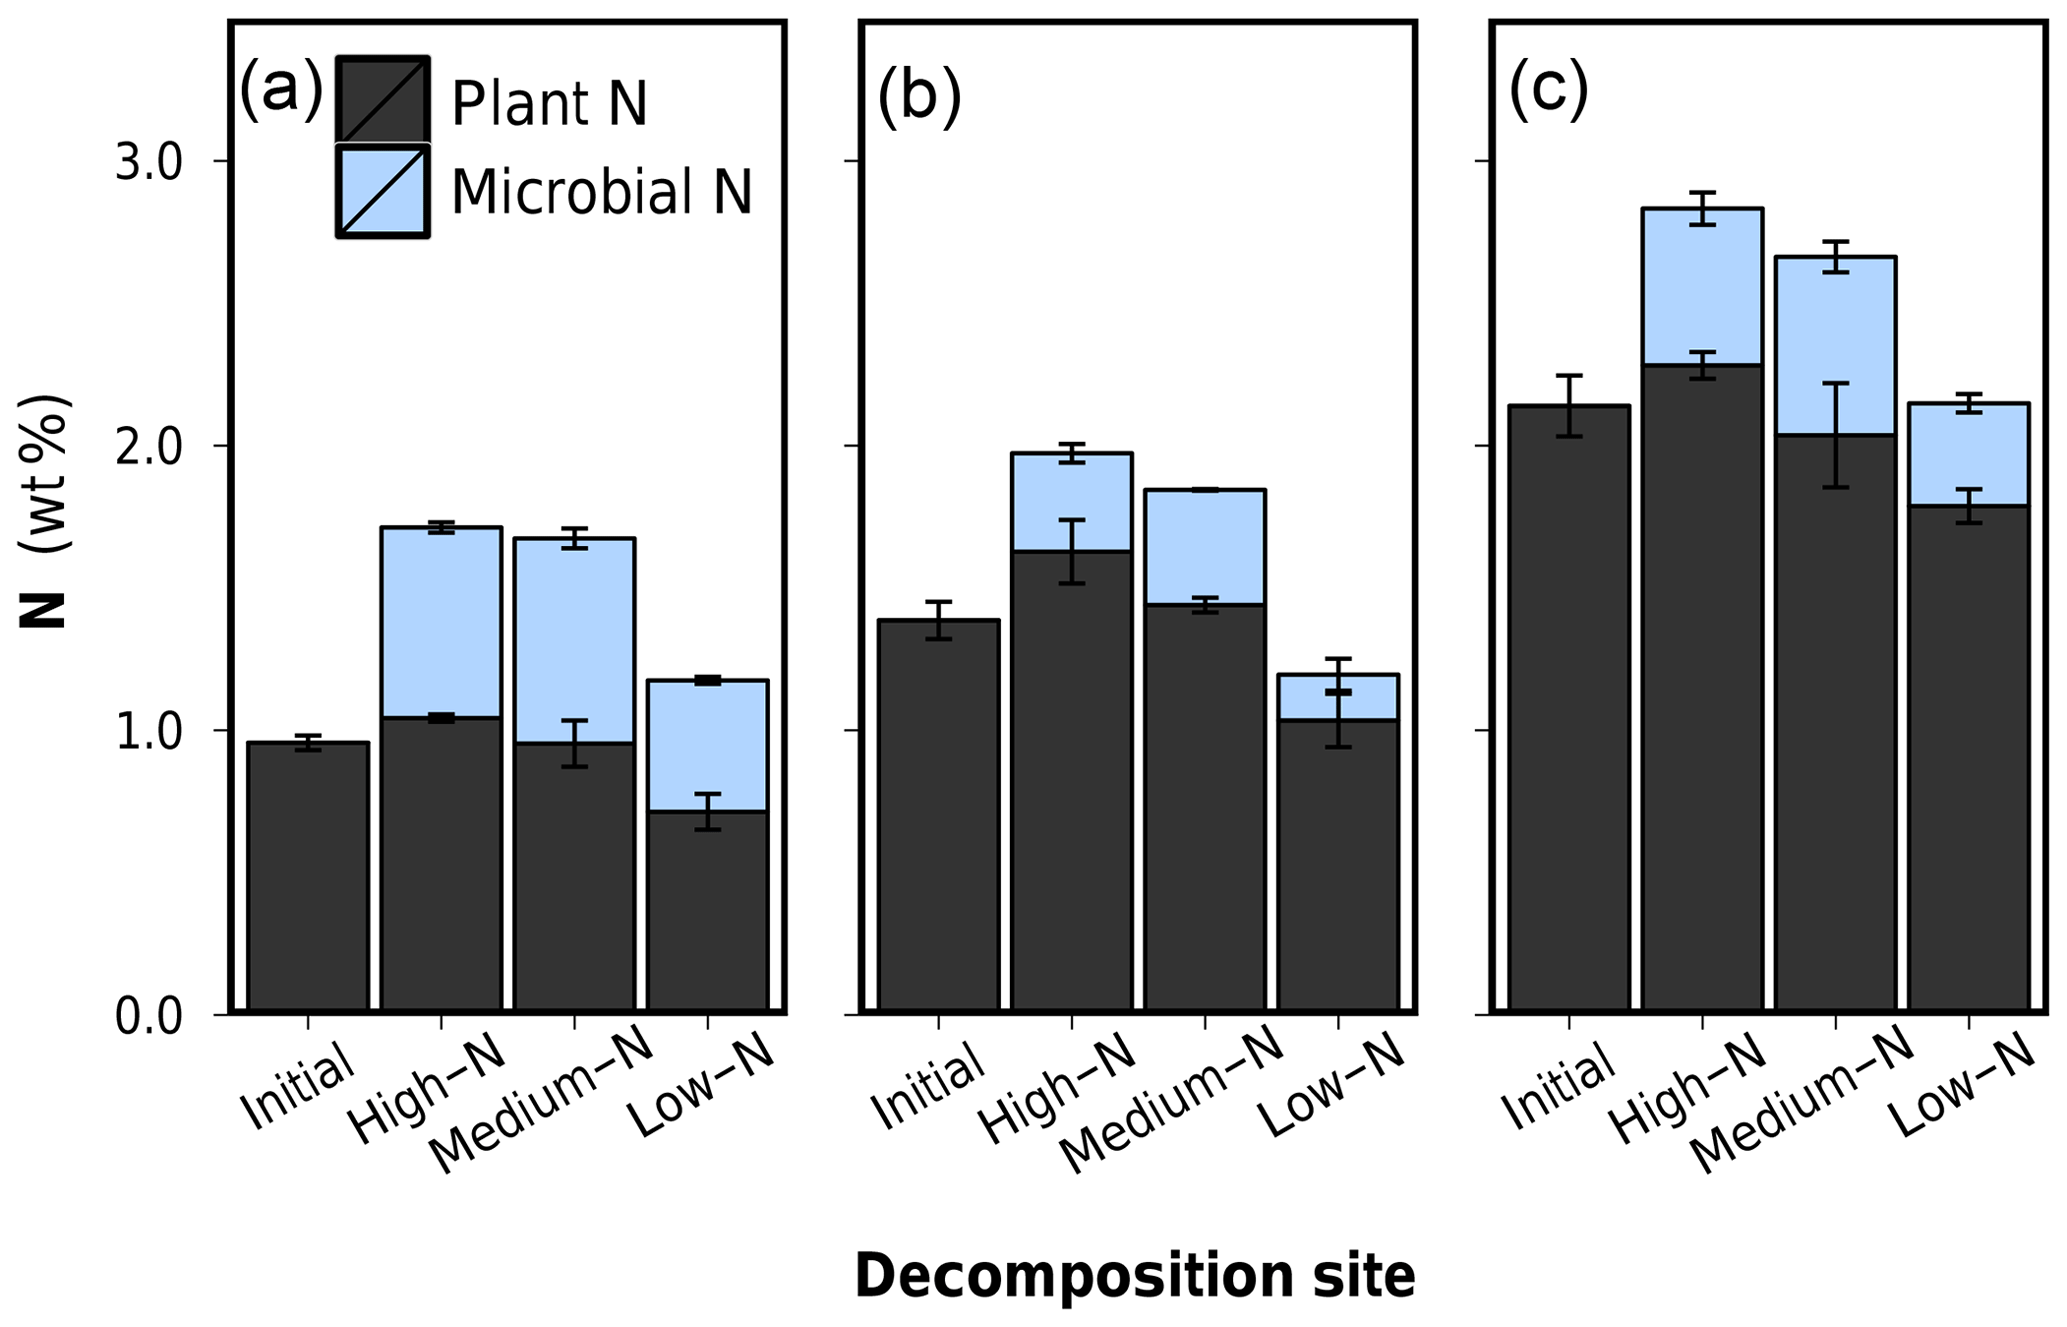
Figure 6Microbial N content and plant N content in leaf litter after 75 d of anaerobic decomposition in three substrates of varying N content (decomposition site). (a) Low-N leaf litter, (b) medium-N leaf litter, and (c) high-N leaf litter. Error bars represent standard deviations of three replicate litterbags.
Microbial N contents furthermore allow the calculation of the net nitrogen use efficiency (nNUE). Analogously to the CUE, the nNUE compares the amount of newly formed microbial N to the amount of depolymerized N.
Even though it is predicted by theory that the NUE will dominantly depend on the initial litter N content, empirical evidence for that assumption was only very recently reported from isotope pool dilution experiments with labeled amino acids (Mooshammer et al., 2012, 2014a; Wanek et al., 2010). Pool dilution experiments allow the analysis of gross N fluxes like amino acid formation (i.e., gross protein depolymerization) or microbial amino acid consumption and confirm the interplay between litter N content, the proportion of N used for growth (NUE), and N mineralization. In this study, we use the parameter nNUE as our litter-centered analytical approach does not allow one to distinguish whether the source of the microbial N is depolymerized plant protein or dissolved inorganic or organic N from the environment. nNUE values ranged from 97 % (as no net N loss occurred in some litters) to 22 % (Table 2). In each soil, the nNUE decreased with increasing initial litter N content. Litters with initial N content of 0.96 %, 1.39 %, and 2.14 %, for example, revealed nNUEs of 92 %, 47 %, and 32 % when decomposed in the medium-N substrate, respectively. As a second trend, however, a decomposition site effect on nNUE is evident as for each leaf litter the nNUE decreased with decreasing external N availability. The medium-N leaf litter, for example, showed an nNUE of 59 %, 47 %, and 22 % for decomposition in the high-, medium-, and low-N soil. In part, a decreasing immobilization of N from the porewater might contribute to this pattern. However, the site-dependent nature of the nNUE goes along with constant CUEs, which suggests that microbial N accumulated according to the theoretical predictions (Manzoni et al., 2008). The single explanation for a lower nNUE in a more-nutrient-poor environment, which goes along with normal microbial N accumulation rates and a lower N accumulation in the overall litter tissue, is a site-specific high rate of plant protein depolymerization.
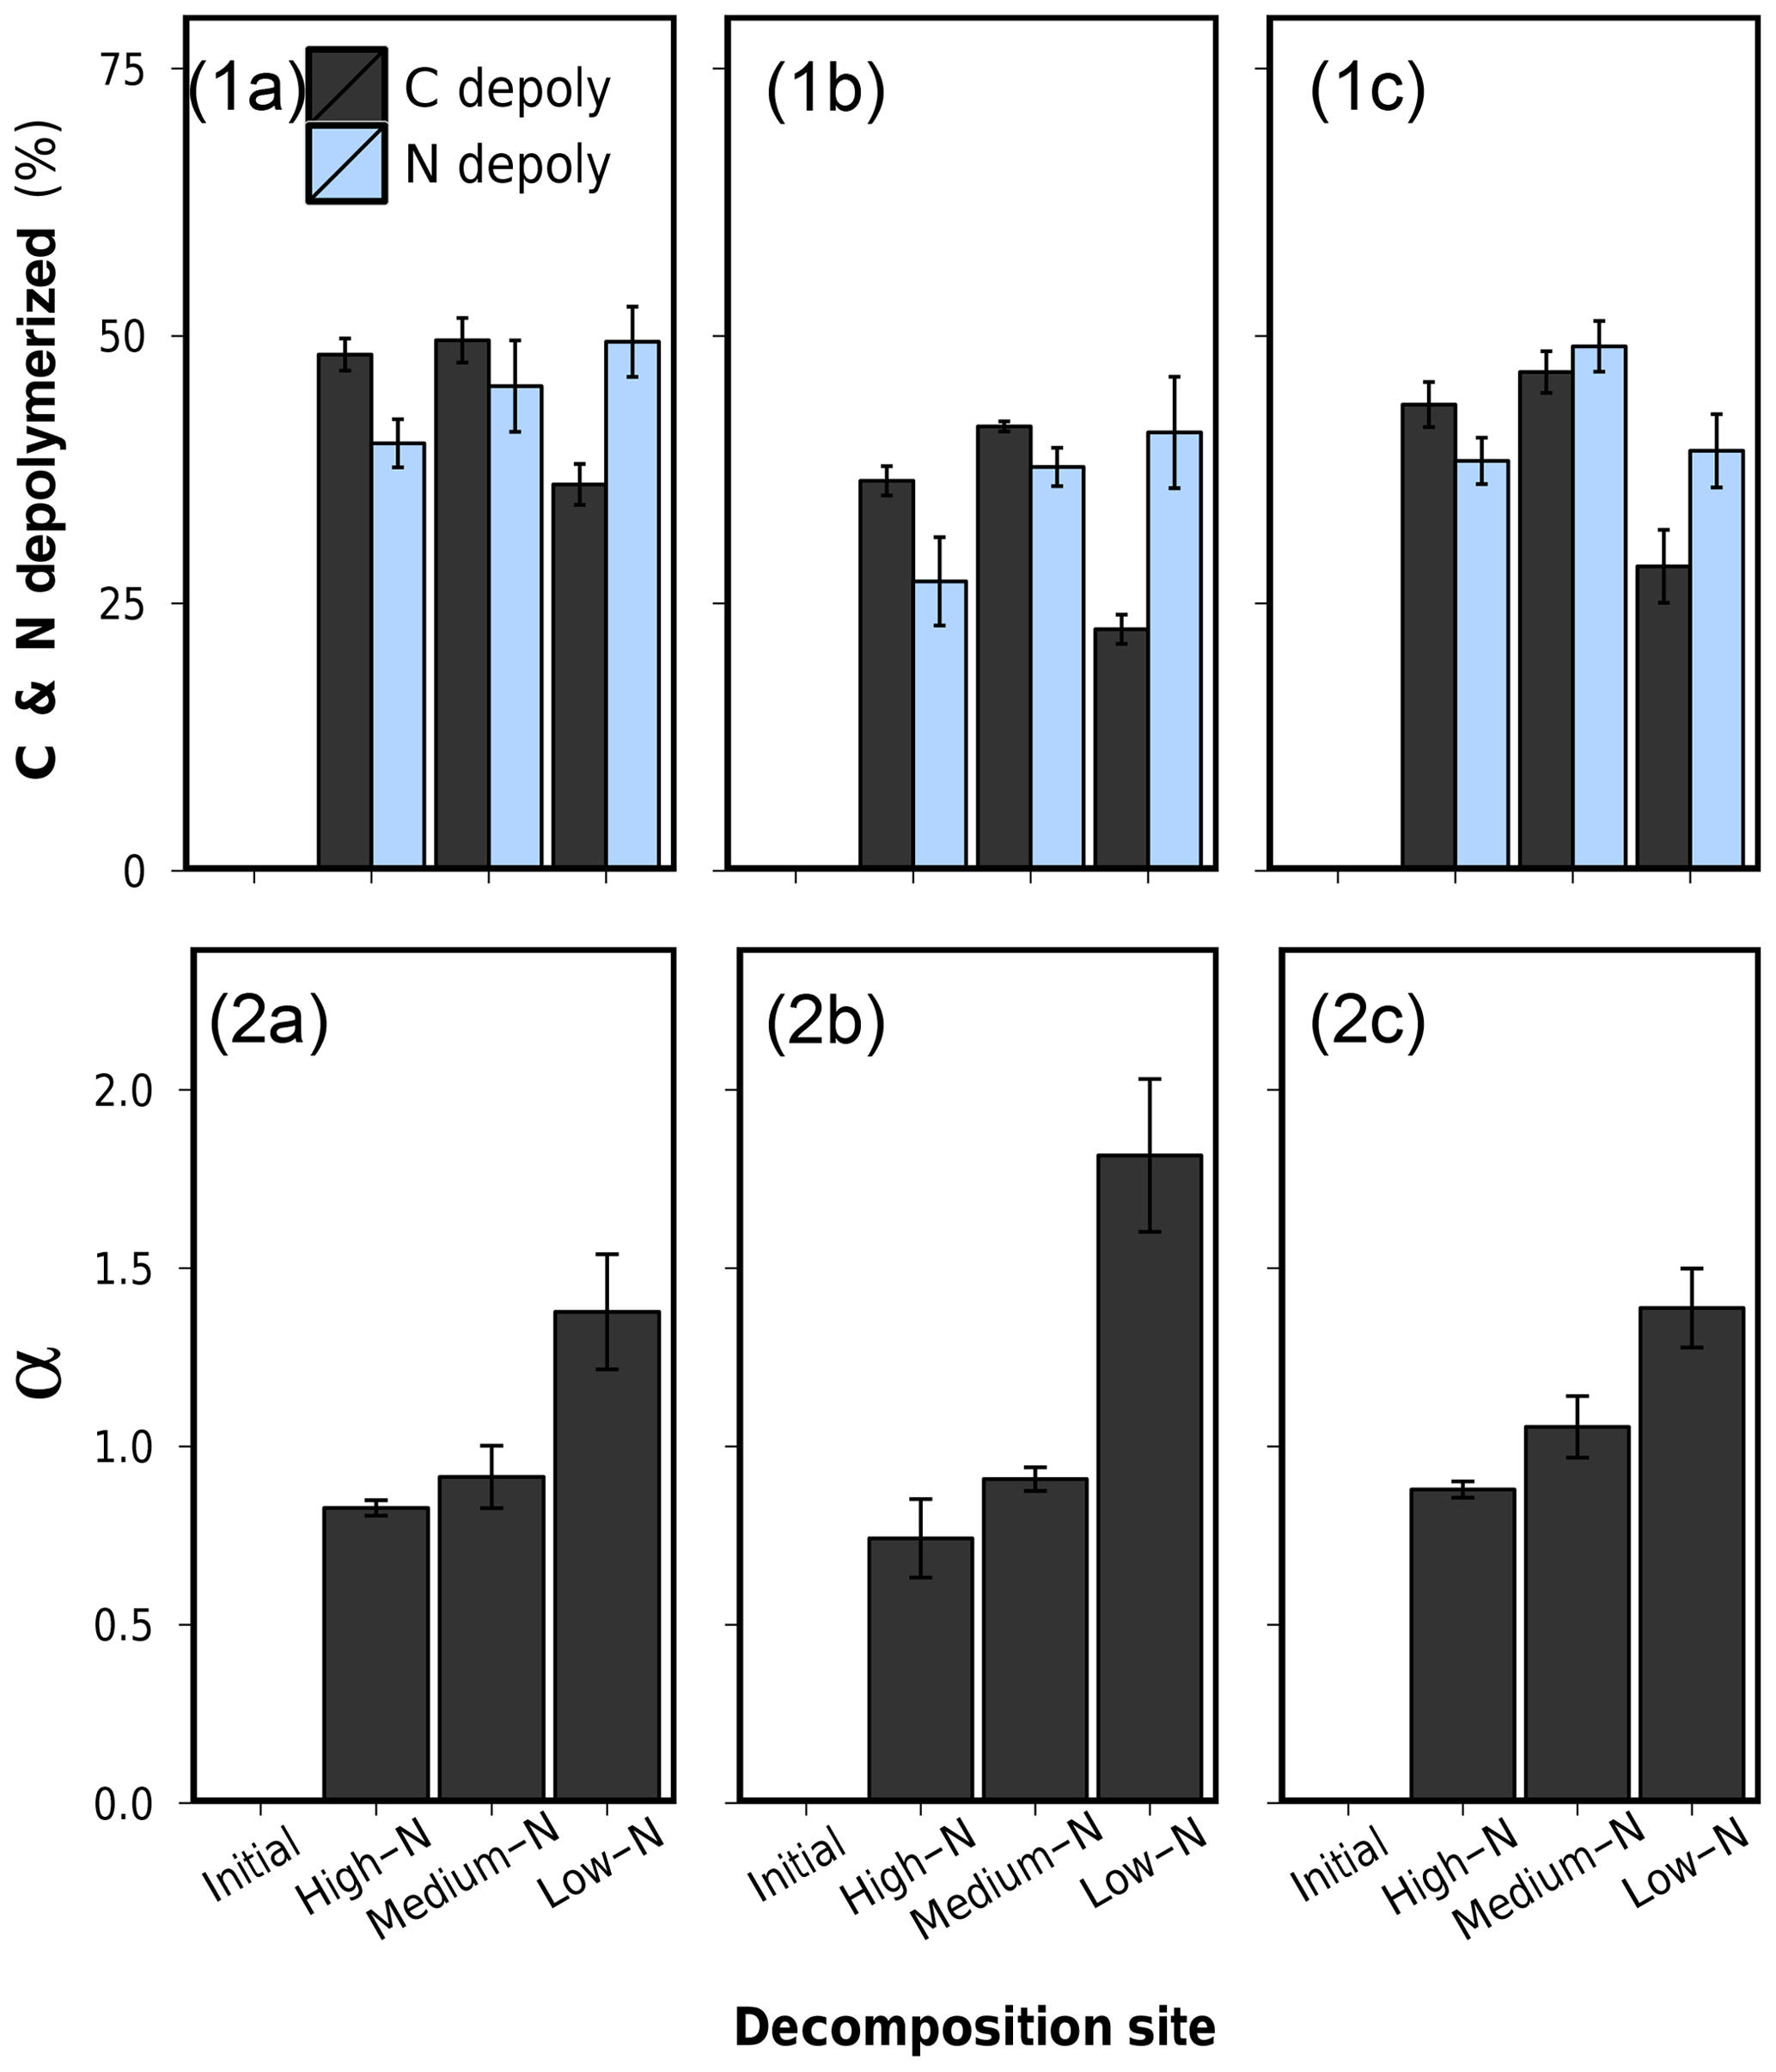
Figure 7(1) Depolymerized plant C and depolymerized plant N after 75 d of anaerobic litter decomposition, and (2) the coefficient of preferential protein depolymerization α (). (a) Low-N leaf litter, (b) medium-N leaf litter, and (c) high-N leaf litter. Error bars represent standard deviations of three replicate litterbags.
3.5 Depolymerized C and N and preferential protein depolymerization
We mentioned in the introduction that the critical difference between C cycling and N cycling in decomposing litter lies in the fact that the C loss is an acceptable measure for C-compound depolymerization which does not apply to N loss for N depolymerization. In our study, estimated amounts of microbial C and microbial N allow a comparison of loss and depolymerization. The low-N leaf litter, decomposed in the high-N soil, for example, lost 44 % C and 1.4 % N during decomposition (Table 1). The bulk N content of this litter increased from initially 0.96 % to 1.71 %. The decomposed litter had a bulk C content of 44.4 %, of which 3.4 % is now identified as microbial C. By summing up total amounts of microbial C and lost C, it follows that 48 % of the initially present litter C has already been depolymerized at this stage of decomposition, a value slightly higher than the C loss of 44 % (Table 2). Due to the low CUE of 8.77 %, there is only a minor difference between depolymerized C and C loss.
The bulk litter N content increased from 0.96 % to 1.71 %. This corresponds to almost no N being lost from the litter (1.4 %). Yet, microbial N in this sample was determined as 0.67 %, which implies that the plant N content in the tissue accounts for 1.04 %, a value only slightly higher than that in the undecomposed litter. Using a plant N of 1.04 %, it follows that 40 % of the initially present N has been depolymerized (Table 2). At an nNUE of 96.9 %, nearly all depolymerized N was used for microbial growth (on a net basis) and thus remained within the litter.
Percentual amounts of depolymerized C and N of all leaf litters are presented in Table 2 and graphically in Fig. 7.1a–c. The patterns of depolymerized C are similar to the C loss patterns. N-compound depolymerization, however, proceeded at a different rate than C-compound depolymerization. In particular, the percentual amount of depolymerized N after 75 d of decomposition increased along the decomposition site nutrient status from high-N substrate to low-N substrate for each litter type.
In order to characterize the variation between C depolymerization and N depolymerization, we use the coefficient of preferential protein depolymerization (α). This parameter is the ratio depolymerized N∕depolymerized C and is adopted from recent stoichiometric models which introduce this term as the coefficient of preferential N uptake (Manzoni et al., 2010; Manzoni, 2017). Our study for the first time provides empirical data for α. α ranged from 0.74 to 1.82 did not depend on the initial litter N content (R2=0.004, p>0.05) but appeared to be a decomposition site property, which correlated negatively with the N content of the soil in which the litter decomposed (R2=0.76, p<0.001) (Fig. 7.2a–c and Table 2). Preferential protein depolymerization as a decomposition site property is here shown as one aspect on how the environment can affect N dynamics in decomposing litter: microbial decomposers apparently adjust their protein decomposition activity in response to the environmental N availability. Even though not reported in long-term litter decomposition studies, such adaption mechanisms are generally known. Microbes are capable of varying their enzyme production to specifically target resources in shortest supply (Liang et al., 2017; Rejmánková and Sirová, 2007; Schimel and Weintraub, 2003; Waring, 2013). Our data demonstrate that as a consequence of the intensification of microbial protein depolymerization activity in the N-poor environments (Sphagnum peat), the remaining still-unprocessed plant organic matter in litter becomes gradually N depleted, which leads to the observed site-dependent variations in the bulk N dynamics of the overall litter (see C∕Nplant-data in Table 2). The possibility of variations in protein depolymerization in relation to environmental N availability has so far received very little attention as a possible explanation for site-dependent variations in litter N dynamics, even though higher N accumulation in litter as a function of increasing external N availability is regularly observed in field studies (Ågren et al., 2013; Hobbie and Gough, 2004; Manzoni et al., 2008; Moore et al., 2006; Rejmánková and Houdková, 2006).
In the high-N soil we found α values lower than 1, which indicates that plant proteins are more slowly depolymerized than plant C compounds. It is indeed known that high concentrations of inhibit protein depolymerization activity (Geisseler et al., 2010). The reduced plant protein depolymerization activity at 23.4 mg L−1 -N in the porewater of the high-N soil is a likely mechanism causing the observed higher N accumulation in decomposing litter.

Figure 8P. australis rhizomes after 75 d of anaerobic decomposition in the three peat substrates. (a) High-N substrate (detritus mud), (b) medium-N substrate (sedge–brown-moss peat), and (c) low-N substrate (Sphagnum peat).
Litter N dynamics in the low-N Sphagnum peat are distinct. Compared to decomposition in other soils, each litter showed high values of depolymerized protein, low values of depolymerized C compounds, and thus high α values (Fig. 7). High α values between 1.38 and 1.82 in an environment which provides very little external N are rational and not exceptionally high in relation to α values of 1.3 assumed in some stoichiometric models (Manzoni, 2017). Yet, the increased protein depolymerization activity is accompanied by very low nNUEs (Table 2). Only a minor fraction of the depolymerized N is actually used for microbial growth. This interaction partly leads to net N losses from litter that exceed C losses and result in an overall increasing litter C∕N ratio, which is an uncommon finding. Why should microbes in Sphagnum peat preferentially depolymerize N from vascular plant tissue only to excrete it to the environment? A possible explanation for this pattern is not the low external nutrient availability but distinct porewater properties of Sphagnum peatlands. It is well known that litter decomposition in Sphagnum-dominated peatlands is low, which is dominantly contributed to the nutrient-poor, anoxic and acidic conditions. Sphagnum mosses, however, additionally release sphagnan into the porewater, which is a pectic-like cell wall polysaccharide of the moss (Hájek et al., 2011). Sphagnan has been shown to be capable of interacting with free amino groups. An observed inhibiting effect on litter decomposition by sphagnan is accounted for an inactivation of plant-tissue-depolymerizing exoenzymes, which are composed of proteins (Hájek et al., 2011). In a mesocosms decomposition experiment, Hájek et al. (2011) found a sharp decrease in dissolved inorganic N upon sphagnan addition as well as an accumulation of DON which they proposed to be exoenzymes immobilized by sphagnan, thus inaccessible for microorganisms and resistant to decay. This stabilization mechanism of DON might be an explanation for why DON dominates the porewater in Sphagnum peatlands, often forming 60 %–90 % of the total dissolved N (Yesmin et al., 1995).
Building on these findings, our study suggest a different mechanism of inhibition by sphagnan, which is an interaction not with the decomposing exoenzymes but with the depolymerized amino acids, which once complexed to sphagnan cannot further be used by microbial decomposers. This would cause a competition-type environment for microbial decomposers with respect to N acquisition because part of the depolymerized amino acids become inaccessible. An excess protein depolymerization rate might be an adaption to overcome N limitation. The reported accumulation of DON by Hájek et al. (2011), apparently stable to further decomposition, would in this case originate from depolymerized plant amino acids complexed to sphagnan and not from complexed exoenzymes as proposed by the authors. Preferential protein depolymerization as an adaptive mechanism to amino acid complexation by sphagnan would furthermore explain the results of other decomposition studies in Sphagnum peat, which similarly found unexpectedly high total N losses from vascular litter during decomposition, which were not discussed with respect to sphagnan activity or preferential protein depolymerization (Scheffer et al., 2001; Verhoeven et al., 1990).
It is important to notice that preferential protein depolymerization leads to a gradual N depletion of the remaining undecomposed litter, denoted by increasing plant tissue C∕N ratios in Table 2. As N is an essential element for microbial decomposers, this N depletion can be regarded as a gradual decrease in litter decomposability over the course of decomposition. Even decomposition of N-rich litter will become N limited and significantly slowed down long before all plant C has been depolymerized. This process might be an explanation for the observed low decomposition of the rhizomes in this substrate. While initially rather N-rich (1.37 % N), this litter lost 89 % of its N during decomposition, while C losses only accounted for 33 %. In line with the low C loss, this sample was physically rather intact compared to rhizomes decomposed in the two other substrates (Fig. 8). As these decomposed rhizomes reached a final C∕N ratio of 152 at the end of the experiment, it can be assumed that, even at longer decomposition times, further decomposition might be very unfavorable due to the site-affected N depletion and a resulting N limitation. This site-induced reduction of litter decomposability might be an important mechanisms of vascular plant litter preservation and C storage in Sphagnum peatlands.
In wetland ecosystems, the disentangling of gross N transformations is central for the assessment of C cycling, N cycling, and biogeochemical responses to increased external nutrient inputs, especially of N (Van Groenigen et al., 2015). Here, we have presented a new methodical approach which enables the disentangling of plant and microbial N in decomposed litter by using DNA signals in FTIR spectra as a marker for microbial N. This approach allows us to quantify how much microbial N has formed and how much plant N is remaining in litter at a certain stage of decomposition. We have demonstrated that decomposition-site-dependent variations in litter N accumulation were not caused by variations in the amount of existing microbial N in litter at a certain stage of decomposition but instead by variations in the remaining amount of still-unprocessed plant N. This indicates a decrease in gross protein depolymerization when litter decomposes in a nutrient-rich environment and suggests that microorganisms preferentially use dissolved organic and/or inorganic N from porewater instead of organic N from litter when those two pools compete as consumable N sources. The influence of the decomposition site and its nutrient status on gross protein depolymerization in decomposing vascular litter has not been detectable in previous studies. Instead, net N dynamics in decomposing litter have often been perceived as being predetermined solely by the initial litter C∕N ratio and the rate of microbial N accumulation.
In this study, litter decomposition has been investigated in anoxic and waterlogged wetland soils. While initial litter C∕N ratios are usually successful predictors of N mineralization patterns in aerobic environments, e.g., mineral soils, we found bulk litter N dynamics that do not fit into the established concept. The strength of the site dependence of C∕N patterns, which facilitated the identification of the nature of protein depolymerization, is probably due to the waterlogged conditions under which litter decomposition takes place. Nutrients can more easily be exchanged between litter and porewater compared to less humid mineral soils. Additionally, microbial nutrient demand is lower in anoxic environments, which is why we were able to test a large gradient in initial litter N content without facing N limitation. Yet, the ability of microbial decomposers to preferentially release N from litter tissue is probably not limited to anoxic systems. In particular for the aerobic decomposition of low-N litter, which in some cases has been shown to proceed without net N immobilization, preferential protein depolymerization is an alternative mechanism to the concurrently assumed lowered microbial CUE through overflow respiration. Microbial N in litter, determined through the newly reported FTIR method here, might be an easily available parameter to investigate trends in preferential protein depolymerization and CUE in future aerobic litterbag studies.
Small method modifications should be considered for the applicability of the method in aerobic decomposition studies. These modifications include an optimization of the calibration curve, either through the addition of very low N litters to a decomposition study as calibration samples or through the artificial mixing of undecomposed litter with microbial biomass. Furthermore, the contribution of fungi must be considered, which we assumed to be negligible in anoxic soils. Differences in the amount of DNA per biomass units and in the C∕N ratio should be considered for the decomposer biomass in aerobic systems. Finally, the applicability of the same calibration curve for decomposed litters of different plant species still has to be investigated.
Data of the decomposition experiment including raw data of FTIR absorbance and second-derivative spectra as well as unused data of CuO lignin phenols in soil substrates and litter can be downloaded at https://doi.pangaea.de/10.1594/PANGAEA.902181 (Reuter et al., 2019).
The supplement related to this article is available online at: https://doi.org/10.5194/bg-17-499-2020-supplement.
All authors participated in conceptual discussions, drafting, and revising the manuscript. HR and DZ developed the research strategy and performed field sampling. HR performed laboratory work and wrote the manuscript. HR and JG performed data analyses.
The authors declare that they have no conflict of interest.
We thank Jörg Gelbrecht for advice on sampling sites and experimental design and Michael Zauft for sampling permission in the protected area Töpchin Süd (EU Life+ project “Kalkmoore Brandenburgs”). We thank the technicians from the Department of Chemical Analytics and Biogeochemistry (IGB) for their support in chemical analyses. We furthermore appreciate comments by Robert Taube, Jos Verhoeven, and Paul Bodelier on a previous version of the manuscript. Tim Moore, one anonymous reviewer, and Steven Bouillon as associate editor are thanked for comments and suggestions, which have helped to improve this paper.
This research has been supported by the Deutsche Forschungsgemeinschaft (grant no. ZA 742/2-1).
The publication of this article was funded by the
Open Access Fund of the Leibniz Association.
This paper was edited by Steven Bouillon and reviewed by Tim Moore and one anonymous referee.
Aerts, R.: Climate, leaf litter chemistry and leaf litter decomposition in terrestrial ecosystems: a triangular relationship, Oikos, 79, 439–449, 1997. a
Ågren, G., Hyvönen, R., Berglund, S., and Hobbie, S.: Estimating the critical N: C from litter decomposition data and its relation to soil organic matter stoichiometry, Soil Biol. Biochem., 67, 312–318, 2013. a
Ågren, G. I., Bosatta, E., and Magill, A. H.: Combining theory and experiment to understand effects of inorganic nitrogen on litter decomposition, Oecologia, 128, 94–98, 2001. a
Andresen, L. C., Bode, S., Tietema, A., Boeckx, P., and Rütting, T.: Amino acid and N mineralization dynamics in heathland soil after long-term warming and repetitive drought, SOIL, 1, 341–349, https://doi.org/10.5194/soil-1-341-2015, 2015. a
Berg, B. and McClaugherty, C.: Plant litter, Springer, Berlin, Heidelberg, https://doi.org/10.1007/978-3-662-05349-2, 2003. a
Coûteaux, M.-M., Bottner, P., and Berg, B.: Litter decomposition, climate and litter quality, Trends Ecol. Evol., 10, 63–66, 1995. a
Geisseler, D., Horwath, W. R., Joergensen, R. G., and Ludwig, B.: Pathways of nitrogen utilization by soil microorganisms – A review, Soil Biol. Biochem., 42, 2058–2067, 2010. a, b
Gulis, V. and Suberkropp, K.: Leaf litter decomposition and microbial activity in nutrient-enriched and unaltered reaches of a headwater stream, Freshwater Biol., 48, 123–134, 2003. a, b
Güsewell, S. and Koerselman, W.: Variation in nitrogen and phosphorus concentrations of wetland plants, Perspect. Plant Ecol., 5, 37–61, 2002. a
Hájek, T., Ballance, S., Limpens, J., Zijlstra, M., and Verhoeven, J. T.: Cell-wall polysaccharides play an important role in decay resistance of Sphagnum and actively depressed decomposition in vitro, Biogeochemistry, 103, 45–57, 2011. a, b, c, d
Hobbie, S. E. and Gough, L.: Litter decomposition in moist acidic and non-acidic tundra with different glacial histories, Oecologia, 140, 113–124, 2004. a, b
Kaiser, K. and Benner, R.: Characterization of lignin by gas chromatography and mass spectrometry using a simplified CuO oxidation method, Anal. Chem., 84, 459–464, 2011. a
Keuskamp, J. A., Hefting, M. M., Dingemans, B. J., Verhoeven, J. T., and Feller, I. C.: Effects of nutrient enrichment on mangrove leaf litter decomposition, Sci. Total Environ., 508, 402–410, 2015. a
Kögel-Knabner, I.: The macromolecular organic composition of plant and microbial residues as inputs to soil organic matter, Soil Biol. Biochem., 34, 139–162, 2002. a
Liang, C., Schimel, J. P., and Jastrow, J. D.: The importance of anabolism in microbial control over soil carbon storage, Nature Microbiol., 2, 17105, https://doi.org/10.1038/nmicrobiol.2017.105, 2017. a
Manzoni, S.: Flexible Carbon-Use Efficiency across Litter Types and during Decomposition Partly Compensates Nutrient Imbalances – Results from Analytical Stoichiometric Models, Front. Microbiol., 8, 661, https://doi.org/10.3389/fmicb.2017.00661, 2017. a, b, c
Manzoni, S. and Porporato, A.: Soil carbon and nitrogen mineralization: theory and models across scales, Soil Biol. Biochem., 41, 1355–1379, 2009. a
Manzoni, S., Jackson, R. B., Trofymow, J. A., and Porporato, A.: The Global Stoichiometry of Litter Nitrogen Mineralization, Science, 321, 684–686, 2008. a, b
Manzoni, S., Trofymow, J. A., Jackson, R. B., and Porporato, A.: Stoichiometric controls on carbon, nitrogen, and phosphorus dynamics in decomposing litter, Ecol. Monogr., 80, 89–106, 2010. a
Manzoni, S., Taylor, P., Richter, A., Porporato, A., and Ågren, G. I.: Environmental and stoichiometric controls on microbial carbon-use efficiency in soils, New Phytol., 196, 79–91, 2012. a, b
Marín-Spiotta, E., Gruley, K., Crawford, J., Atkinson, E., Miesel, J., Greene, S., Cardona-Correa, C., and Spencer, R.: Paradigm shifts in soil organic matter research affect interpretations of aquatic carbon cycling: transcending disciplinary and ecosystem boundaries, Biogeochemistry, 117, 279–297, 2014. a
Marstorp, H., Guan, X., and Gong, P.: Relationship between dsDNA, chloroform labile C and ergosterol in soils of different organic matter contents and pH, Soil Biol. Biochem., 32, 879–882, 2000. a
McJannet, C., Keddy, P., and Pick, F.: Nitrogen and phosphorus tissue concentrations in 41 wetland plants: a comparison across habitats and functional groups, Funct. Ecol., 9, 231–238, 1995. a
Miltner, A. and Zech, W.: Microbial degradation and resynthesis of proteins during incubation of beech leaf litter in the presence of mineral phases, Biol. Fert. Soils, 30, 48–51, 1999. a
Moore, T. R., Trofymow, J. A., Prescott, C. E., Fyles, J., and Titus, B. D.: Patterns of Carbon, Nitrogen and Phosphorus Dynamics in Decomposing Foliar Litter in Canadian Forests, Ecosystems, 9, 46–62, 2006. a, b
Mooshammer, M., Wanek, W., Schnecker, J., Wild, B., Leitner, S., Hofhansl, F., Blöchl, A., Hämmerle, I., Frank, A. H., Fuchslueger, L., Keiblinger, K. M., Zechmeister-Boltenstern, S., and Richter, A.: Stoichiometric controls of nitrogen and phosphorus cycling in decomposing beech leaf litter, Ecology, 93, 770–782, https://doi.org/10.1890/11-0721.1, 2012. a
Mooshammer, M., Wanek, W., Hämmerle, I., Fuchslueger, L., Hofhansl, F., Knoltsch, A., Schnecker, J., Takriti, M., Watzka, M., Wild, B., Keiblinger, K. M., Zechmeister-Boltenstern, S., and Richter, A.: Adjustment of microbial nitrogen use efficiency to carbon:nitrogen imbalances regulates soil nitrogen cycling, Nat. Commun., 5, 3694, https://doi.org/10.1038/ncomms4694, 2014a. a, b, c
Mooshammer, M., Wanek, W., Zechmeister-Boltenstern, S., and Richter, A.: Stoichiometric imbalances between terrestrial decomposer communities and their resources: mechanisms and implications of microbial adaptations to their resources, Front. Microbiol., 5, 22, https://doi.org/10.3389/fmicb.2014.00022, 2014b. a
Moss, D. A., Fuechsle, K., Masuch, R., and Wolf, A.: Biomedical applications of FTIR difference spectroscopy, Proc. SPIE 3918, Biomedical Spectroscopy: Vibrational Spectroscopy and Other Novel Techniques, https://doi.org/10.1117/12.384962, 2000. a
Mouginot, C., Kawamura, R., Matulich, K. L., Berlemont, R., Allison, S. D., Amend, A. S., and Martiny, A. C.: Elemental stoichiometry of Fungi and Bacteria strains from grassland leaf litter, Soil Biol. Biochem., 76, 278–285, 2014. a
Naumann, D.: Infrared Spectroscopy in Microbiology, in: Encyclopedia of Analytical Chemistry, American Cancer Society, edited by: Meyers, R. A., John Wiley & Sons Ltd, Chichester, 102–131, https://doi.org/10.1002/9780470027318.a0117, 2006. a, b, c, d, e, f
Pandey, K. and Pitman, A.: FTIR studies of the changes in wood chemistry following decay by brown-rot and white-rot fungi, Int. Biodeter. Biodegr., 52, 151–160, 2003. a
Prescott, C.: Decomposition and mineralization of nutrients from litter and humus, in: Nutrient Acquisition by Plants, pp. 15–41, Springer-Verlag, Berlin Heidelberg, 2005. a
Reddy, K. R. and DeLaune, R. D.: Biogeochemistry of wetlands: science and applications, CRC Press, Taylor & Francis Group, 6000 Broken Sound Parkway NW, Suite 300, Boca Raton, FL 33487-2742, 2008. a, b, c
Rejmánková, E. and Houdková, K.: Wetland plant decomposition under different nutrient conditions: what is more important, litter quality or site quality?, Biogeochemistry, 80, 245–262, 2006. a, b, c, d, e
Rejmánková, E. and Sirová, D.: Wetland macrophyte decomposition under different nutrient conditions: relationships between decomposition rate, enzyme activities and microbial biomass, Soil Biol. Biochem., 39, 526–538, 2007. a
Reuter, H., Gensel, J., Elvert, M., and Zak, D.: Direct analysis of lignin phenols in freshwater dissolved organic matter, Anal. Chem., 89, 13449–13457, 2017. a
Reuter, H., Gensel, J., Elvert, M., and Zak, D.: Interactive comment on “Preferential protein depolymerization as a preservation mechanism for vascular litter decomposing in Sphagnum peat”, Biogeosciences Discuss., https://doi.org/10.5194/bg-2019-176-AC1, 2019. a
Reuter, H., Gensel, J., Elvert, M., and Zak, D.: FTIR, CuO lignin, and bulk decomposition data of a 75-day anoxic Phragmites australis litter decomposition experiment in soil substrates from three northeast German wetlands, PANGAEA, https://doi.pangaea.de/10.1594/PANGAEA.902181 (dataset in review), 2019. a, b
Scheffer, R. A., Logtestijn, R. S. P. V., and Verhoeven, J. T. A.: Decomposition of Carex and Sphagnum litter in two mesotrophic fens differing in dominant plant species, Oikos, 92, 44–54, 2001. a, b
Schimel, J. P. and Bennett, J.: Nitrogen Mineralization: Challenges of a Changing Paradigm, Ecology, 85, 591–602, 2004. a, b, c, d, e
Schimel, J. P. and Weintraub, M. N.: The implications of exoenzyme activity on microbial carbon and nitrogen limitation in soil: a theoretical model, Soil Biol. Biochem., 35, 549–563, 2003. a
Schulten, H.-R. and Schnitzer, M.: The chemistry of soil organic nitrogen: a review, Biol. Fert. Soils, 26, 1–15, 1997. a
Sinsabaugh, R. L., Manzoni, S., Moorhead, D. L., and Richter, A.: Carbon use efficiency of microbial communities: stoichiometry, methodology and modelling, Ecol. Lett., 16, 930–939, 2013. a, b
Spohn, M., Klaus, K., Wanek, W., and Richter, A.: Microbial carbon use efficiency and biomass turnover times depending on soil depth–Implications for carbon cycling, Soil Biol. Biochem., 96, 74–81, 2016. a, b
Susi, H. and Byler, D. M.: Protein structure by Fourier transform infrared spectroscopy: second derivative spectra, Biochem. Bioph. Res. Co., 115, 391–397, 1983. a
Takriti, M., Wild, B., Schnecker, J., Mooshammer, M., Knoltsch, A., Lashchinskiy, N., Alves, R. J. E., Gentsch, N., Gittel, A., Mikutta, R., Wanek, W., and Richter, A.: Soil organic matter quality exerts a stronger control than stoichiometry on microbial substrate use efficiency along a latitudinal transect, Soil Biol. Biochem., 121, 212–220, 2018. a
Tremblay, L. and Benner, R.: Microbial contributions to N-immobilization and organic matter preservation in decaying plant detritus, Geochim. Cosmochim. Ac., 70, 133–146, 2006. a, b, c, d, e, f
van Groenigen, J. W., Huygens, D., Boeckx, P., Kuyper, Th. W., Lubbers, I. M., Rütting, T., and Groffman, P. M.: The soil N cycle: new insights and key challenges, SOIL, 1, 235–256, https://doi.org/10.5194/soil-1-235-2015, 2015. a
Verhoeven, J. T., Maltby, E., and Schmitz, M.: Nitrogen and phosphorus mineralization in fens and bogs, J. Ecol., 78, 713–726, 1990. a, b
Wanek, W., Mooshammer, M., Blöchl, A., Hanreich, A., and Richter, A.: Determination of gross rates of amino acid production and immobilization in decomposing leaf litter by a novel 15N isotope pool dilution technique, Soil Biol. Biochem., 42, 1293–1302, 2010. a
Waring, B. G.: Exploring relationships between enzyme activities and leaf litter decomposition in a wet tropical forest, Soil Biol. Biochem., 64, 89–95, 2013. a
Whelan, D. R., Hiscox, T. J., Rood, J. I., Bambery, K. R., McNaughton, D., and Wood, B. R.: Detection of an en masse and reversible B- to A-DNA conformational transition in prokaryotes in response to desiccation, J. R. Soc. Interface, 11, 20140454, https://doi.org/10.1098/rsif.2014.0454, 2014. a, b
Wild, B., Schnecker, J., Knoltsch, A., Takriti, M., Mooshammer, M., Gentsch, N., Mikutta, R., Alves, R. J. E., Gittel, A., Lashchinskiy, N., and Richter, A.: Microbial nitrogen dynamics in organic and mineral soil horizons along a latitudinal transect in western Siberia, Global Biogeochem. Cycles, 29, 567–582, 2015 a
Yesmin, L., Gammack, S. M., Sanger, L. J., and Cresser, M. S.: Impact of atmospheric N deposition on inorganic- and organic-N outputs in water draining from peat, Sci. Total Environ., 166, 201–209, 1995. a
Zak, D., Reuter, H., Augustin, J., Shatwell, T., Barth, M., Gelbrecht, J., and McInnes, R. J.: Changes of the CO2 and CH4 production potential of rewetted fens in the perspective of temporal vegetation shifts, Biogeosciences, 12, 2455–2468, https://doi.org/10.5194/bg-12-2455-2015, 2015. a
Zhang, T., Luo, Y., Chen, H. Y. H., and Ruan, H.: Responses of litter decomposition and nutrient release to N addition: A meta-analysis of terrestrial ecosystems, Appl. Soil Ecol., 128, 35–42, 2018. a
Zucchiatti, P., Mitri, E., Kenig, S., Billè, F., Kourousias, G., Bedolla, D. E., and Vaccari, L.: Contribution of Ribonucleic Acid (RNA) to the Fourier Transform Infrared (FTIR) Spectrum of Eukaryotic Cells, Anal. Chem., 88, 12090–12098, 2016. a