the Creative Commons Attribution 4.0 License.
the Creative Commons Attribution 4.0 License.
 | 08 Jul 2020
N2O changes from the Last Glacial Maximum to the preindustrial – Part 2: terrestrial N2O emissions and carbon–nitrogen cycle interactions
Renato Spahni
Benjamin D. Stocker
Sebastian Lienert
Jurek Müller
Hubertus Fischer
Jochen Schmitt
I. Colin Prentice
Bette Otto-Bliesner
Zhengyu Liu
Carbon–nitrogen (C–N) interactions regulate N availability for plant growth and for emissions of nitrous oxide (N2O) and the uptake of carbon dioxide. Future projections of these terrestrial greenhouse gas fluxes are strikingly divergent, leading to major uncertainties in projected global warming. Here we analyse the large increase in terrestrial N2O emissions over the past 21 000 years as reconstructed from ice-core isotopic data and presented in part 1 of this study. Remarkably, the increase occurred in two steps, each realized over decades and within a maximum of 2 centuries, at the onsets of the major deglacial Northern Hemisphere warming events. The data suggest a highly dynamic and responsive global N cycle. The increase may be explained by an increase in the flux of reactive N entering and leaving ecosystems or by an increase in N2O yield per unit N converted. We applied the LPX-Bern dynamic global vegetation model in deglacial simulations forced with Earth system model climate data to investigate N2O emission patterns, mechanisms, and C–N coupling. The N2O emission changes are mainly attributed to changes in temperature and precipitation and the loss of land due to sea-level rise. LPX-Bern simulates a deglacial increase in N2O emissions but underestimates the reconstructed increase by 47 %. Assuming time-independent N sources in the model to mimic progressive N limitation of plant growth results in a decrease in N2O emissions in contrast to the reconstruction. Our results appear consistent with suggestions of (a) biological controls on ecosystem N acquisition and (b) flexibility in the coupling of the C and N cycles during periods of rapid environmental change. A dominant uncertainty in the explanation of the reconstructed N2O emissions is the poorly known N2O yield per N lost through gaseous pathways and its sensitivity to soil conditions. The deglacial N2O record provides a constraint for future studies.
Please read the editorial note first before continuing.
-
Please read the editorial note first before accessing the article.
-
Article
(11828 KB)
- Editorial note
- Companion paper
-
Supplement
(2025 KB)
-
Please read the editorial note first before accessing the article.
- Article
(11828 KB) - Editorial note
- Companion paper
-
Supplement
(2025 KB) - BibTeX
- EndNote


Nitrous oxide (N2O) is a sensitive proxy of biogeochemical and ecosystem processes on land and in the ocean, and its past atmospheric variations are recorded in ice cores. N2O is an important greenhouse gas and contributes to ongoing global warming (Stocker et al., 2013). It is also involved in the destruction of stratospheric ozone (Myhre et al., 2013). N2O is produced primarily by nitrification and denitrification both on land and in the ocean and photochemically decomposed in the stratosphere (Ciais et al., 2013). Atmospheric N2O increased from 270 ppb (MacFarling Meure et al., 2006) to around 330 ppb (https://www.esrl.noaa.gov/gmd/, last access: 30 June 2020) over the industrial period due to human activities, including fertilizer application, fossil fuel use, and biomass burning (Bouwman et al., 2013; Ciais et al., 2013). Atmospheric N2O varied naturally between around 180 and 300 ppb over glacial–interglacial cycles (Sowers et al., 2003; Spahni et al., 2005; Schilt et al., 2010). A quantitative explanation of these variations is lacking, and this knowledge gap renders projections of the feedbacks between N2O and climate change uncertain (Stocker et al., 2013; Battaglia and Joos, 2018; Kracher et al., 2016).
Variations in N2O emission, and thus in tropospheric N2O content, are closely linked to ecosystem processes governing the cycling of nitrogen (N) and carbon (C) on land and in the ocean (Gruber and Galloway, 2008). N availability to support land plant and phytoplankton growth and terrestrial and marine C storage is governed by the balance of N input and loss fluxes. Reactive N is added by biological nitrogen fixation (BNF) and, on land, by deposition and weathering. Reactive N is lost from ecosystems through nitrification followed by denitrification, as well as leakage and mineral adsorption. Terrestrial N2O emissions are a sensitive indicator of the flow of reactive N entering and leaving land ecosystems (Firestone and Davidson, 1989), and reactive N needs to be available for the production of N2O as well as to support carbon uptake and storage by plants and the land biosphere.
The land biosphere sequesters about a quarter of anthropogenic CO2 emissions and is the largest natural N2O source (Ciais et al., 2013). However, key features of the C–N cycle are poorly understood, leading to major uncertainties in global warming projections (Joos et al., 2001; Arora et al., 2013; Friedlingstein et al., 2006, 2013; Plattner et al., 2008; Zickfeld et al., 2013). The question to what extent N availability will limit future land C uptake and N2O emissions is unresolved. In particular, large uncertainties remain as to what extent N sources, net N mineralization, N uptake, and N loss processes will adjust and influence plant growth and N2O emissions under climatic and environmental change (Niu et al., 2016). It is debated how global warming, increasing CO2, and increased N deposition affect the current land carbon sink (Körner, 2015; Fatichi et al., 2014; Terrer et al., 2016) and how the land carbon sink and greenhouse gas emissions will evolve. Apparently conflicting observations (Davidson et al., 2007; Luo et al., 2004; Reich et al., 2014; Vitousek et al., 2013; Xu-Ri and Prentice, 2008), theories (Zhu et al., 2017; Menge et al., 2017) and model projections (Hungate et al., 2003; Todd-Brown et al., 2013; Wieder et al., 2015b) of the role of N limitation in plant growth and the land C sink (Meyerholt et al., 2016; Zaehle et al., 2014; Walker et al., 2015) represent a major uncertainty in future projections of atmospheric CO2 and climate (Jones et al., 2013; Joos et al., 2013; Todd-Brown et al., 2013). Results from free-air CO2 enrichment (FACE) and open-top chamber experiments show that N limitation – at least in some ecosystems – reduces the response of aboveground biomass growth to elevated CO2 (McMurtrie et al., 2008; Norby et al., 2010; Terrer et al., 2016, 2019) and that soil N and P availabilities are important controls on this magnitude in ectomycorrhizal and arbuscular mycorrhizal systems, respectively. Increased N immobilization in plant litter, biomass and soil (Luo et al., 2004), and multiple nutrient limitation (Körner, 2015; Vitousek et al., 2010; Elser et al., 2007) have been put forward as explanations for reduced growth responses.
Field and laboratory experiments provide important insights, but extrapolation of such results on the short-term response in C and N fluxes to the multi-decadal to century timescales, relevant for global warming projections, is uncertain. Additional hindrances to the improvement of our quantitative understanding of C–N cycle coupling are related to large variations in fluxes and inventories on small spatial and temporal scales (Arias-Navarro et al., 2017; Barton et al., 2015) and the diversity of responses across different organisms and ecosystems. Largely missing are long-term observational constraints on the global coupled C and N cycle during periods of rapid climate change and increasing atmospheric CO2.
High-resolution data on the isotopic composition of N2O from Antarctic ice cores have the potential to provide precise information on past variations in terrestrial and marine N2O emissions and thus on C–N coupling on timescales from decades to many centuries. A recent ice-core study on the stable isotope composition of N2O demonstrated the power of this approach (Schilt et al., 2014). The isotopic data showed that both land and oceanic sources increased during the interval from 16 000 to 10 000 years before present (ka), when ocean circulation and climatic changes strongly affected the global cycling of both CO2 and N2O (Schilt et al., 2014). Schilt et al. concluded that natural N2O emissions will probably increase in response to global warming.
In part 1 of this study (Fischer et al., 2019), this earlier work was extended to reconstruct the evolution in terrestrial versus oceanic emissions of N2O from the Last Glacial Maximum (LGM; 21 ka) to the late preindustrial Holocene using novel, high-precision N2O stable isotope data. The age scales of the records were aligned with the absolutely counted GICC05 age scale (Rasmussen et al., 2006) using high-resolution methane measurements leading to particularly small age-scale uncertainties around past rapid warming events, namely, at the onset of the Bølling–Allerød Northern Hemisphere warm period and of the Holocene interglacial. The ice-core data of N2O concentration and δ15N(N2O) were used in a model deconvolution to determine changes in global marine and terrestrial N2O emissions. The results indicate that N2O emissions from land and ocean increased over the deglaciation largely in parallel by 1.8±0.3 and 0.7±0.3 Tg N yr−1, respectively, relative to the Last Glacial Maximum level. However, during the abrupt Northern Hemisphere warming events, terrestrial emissions changed more rapidly than marine emissions. The ice-core data reveal large step-like changes in terrestrial emissions by up to 1 Tg N yr−1 at the onset of the warming events, realized over decades and, given the proxy data resolution, last 200 years at maximum. The multi-decadal timescales of these events are also relevant for 21st century climate projections and much longer than accessible in typical laboratory or field experiments. Further, the abrupt N2O emission changes indicate a very high sensitivity of the terrestrial C–N cycle to environmental change. But a detailed process-based investigation of terrestrial N2O emission changes over the deglaciation, rapid past warming events, and the Holocene warm period, and their links to the flow of N and C in land ecosystems, has not been attempted before.
The aim of part 2 of this study is to improve our understanding of the cycles of N2O, C, and N. The unique, new terrestrial N2O emission record of the past 21 000 years is used to explore mechanisms of the functioning of the C–N cycle on land and to quantify terrestrial drivers for atmospheric N2O concentration changes. Controls on variations in terrestrial emissions are elucidated in the framework of a dynamic global vegetation model. Part 1 of this study (Fischer et al., 2019) presents the ice-core N2O concentration and isotope data and the reconstruction of global terrestrial and marine N2O emissions for the past 21 000 years and provides a discussion of the reconstructed marine emissions in the context of past climate and oceanographic changes. A model-based interpretation of the reconstructed marine N2O emission changes during past abrupt climate events is given by Joos et al. (2019). Here in part 2, we focus on the interpretation of the terrestrial N2O emission record and discuss terrestrial N2O emissions and C–N responses in transient deglacial simulations with a dynamical vegetation/terrestrial biogeochemistry model.
2.1 N2O budget and production mechanisms
Prather et al. (2015) estimated that the preindustrial atmospheric lifetime of N2O was 123 years. Together with the atmospheric N2O concentration from ice cores, this figure constrains the total net preindustrial N2O source to 10.5±1 Tg N yr−1. Marine N2O emissions were recently estimated by an observation-constrained approach, using water-column and surface N2O observations as targets, to be 4.6 (±1 standard deviation range: 3.1 to 6.1) Tg N yr−1. This calculation implies a natural terrestrial N2O source of 5.9 (4.1 to 7.7) Tg N yr−1 (Battaglia and Joos, 2018), in line with IPCC AR5 estimates of 6.6 (3.3 to 9.0) Tg N yr−1.
N2O is produced through a variety of pathways both in the ocean and on land and N2O production is closely linked to the flows of C and N (Wrage et al., 2001; Chapuis-Lardy et al., 2006; Kato et al., 2013; Battaglia and Joos, 2018; Trimmer et al., 2016; Babbin et al., 2015; Gilly et al., 2013; Bange, 2008; Butterbach-Bahl et al., 2013; Firestone and Davidson, 1989). The dominant pathways of net N2O production are thought to be respiratory denitrification (), under low oxygen conditions, and autotrophic nitrification (), mediated by archaea, bacteria, and fungi. In addition, heterotrophic nitrification, which is the oxidation of organic N to nitrite () and subsequent reduction to N2O by incomplete denitrification, was found to be the dominant path in a grassland ecosystem after fertilizer application (Moser et al., 2018). N2O is produced as a byproduct of nitrification and as an intermediate product during denitrification. N2O is also produced from nitrite through nitrification, often termed nitrifier denitrification, through anaerobic ammonium oxidation, chemautotrophic denitrification, abiotic processes, or photoautotrophic organisms in cryptogamic covers (Lenhart et al., 2015; Butterbach-Bahl et al., 2013).
Terrestrial N2O production and emissions depend sensitively on environmental factors, including precipitation, soil temperature, soil moisture, soil texture, soil oxygen concentration or pH, topography, as well as substrate and nutrient availability and nutrient addition by deposition or fertilizer application (Zhuang et al., 2012; Stehfest and Bouwman, 2006; Wang et al., 2017). Field data- and model-based emission estimates show the highest emissions of N2O in moist tropical areas and lower emissions at high latitudes (Stehfest and Bouwman, 2006; Zhuang et al., 2012; Werner et al., 2007; Potter et al., 1996; Xu et al., 2017; Xu-Ri et al., 2012; Wells et al., 2018). Moist soils typically show relatively high N2O emission (Butterbach-Bahl et al., 2013; Zhuang et al., 2012), but the environmental dependencies of N2O emission are often complex (Diem et al., 2017; Müller et al., 2015; Schmid et al., 2001a; Matson et al., 2017) and dependent on the production pathway (Kool et al., 2011). Higher N2O fluxes at high soil water contents have been reported from laboratory and field studies and linked to increasing denitrification activity in response to reduced oxygen diffusion into the soil (Arias-Navarro et al., 2017). The sensitivity of denitrification to temperature is found to be higher than for CO2 emissions from soil organic matter decomposition, and a positive feedback of soil warming on N2O emissions is expected (Butterbach-Bahl et al., 2013). Warming treatment increased measured N2O emissions in boreal peatlands (Cui et al., 2018). However, responses to warming treatment are found to be highly variable across a range of conditions and ecosystems, and it remains unclear whether warming will increase or reduce regional to global N2O emissions (Dijkstra et al., 2012). Positive or neutral responses in N2O emissions have been found in field experiments under elevated CO2 in temperate and boreal forests and grasslands (van Groenigen et al., 2011; Dijkstra et al., 2012; Regan et al., 2011; Moser et al., 2018; Zhong et al., 2018). Nitrogen addition by mineral and organic fertilizer causes enhanced N2O emissions. Emission factors are reported to depend sensitively on soil pH and are typically estimated to be around 0.5 % to 2 % of added N (Charles et al., 2017; Wang et al., 2017), but may vary by more than an order of magnitude.
The amount of N2O produced per unit of N converted varies with environmental conditions and production pathway. For nitrification and denitrification this yield (or emission) factor depends on substrate availability linked to soil organic matter decomposition and C:N stoichiometry, on oxygen level influenced by soil moisture status and respiration, and on acidity and temperature (Diem et al., 2017; Davidson et al., 2000; Firestone and Davidson, 1989; Smith, 1997; Phillips et al., 2015; Saggar et al., 2013). In addition, different N2O production pathways and N loss processes and their relative importance may evolve through time and influence the N2O yield on local to global scales.
2.2 C–N–N2O coupling
The main flow paths of reactive N and its link to N2O production and C flows on land (Gruber and Galloway, 2008; Butterbach-Bahl et al., 2013; Vitousek et al., 2013; Zaehle, 2013; Firestone and Davidson, 1989) are schematically sketched in Fig. 1. These ecosystem flows can be assigned to an internal and an external N cycle. Within an ecosystem (green arrows in Fig. 1), N is primarily taken up in the form of and by plant roots to support growth, while a large fraction of reactive N is taken up by soil microbes and fungi and is thus immobilized. Organic N is converted back to inorganic N during the mineralization of litter and soil organic matter. Gross N mineralization is thereby modified by the decomposers' carbon-use efficiency (Manzoni et al., 2008). Net N mineralization (as in Fig. 1) thus reflects the modified gross N mineralization minus N immobilization. The pool is replenished by nitrification, the conversion of to . We note the acid–base equilibrium between and NH3 in soil water; for simplicity, we generally refer to only.
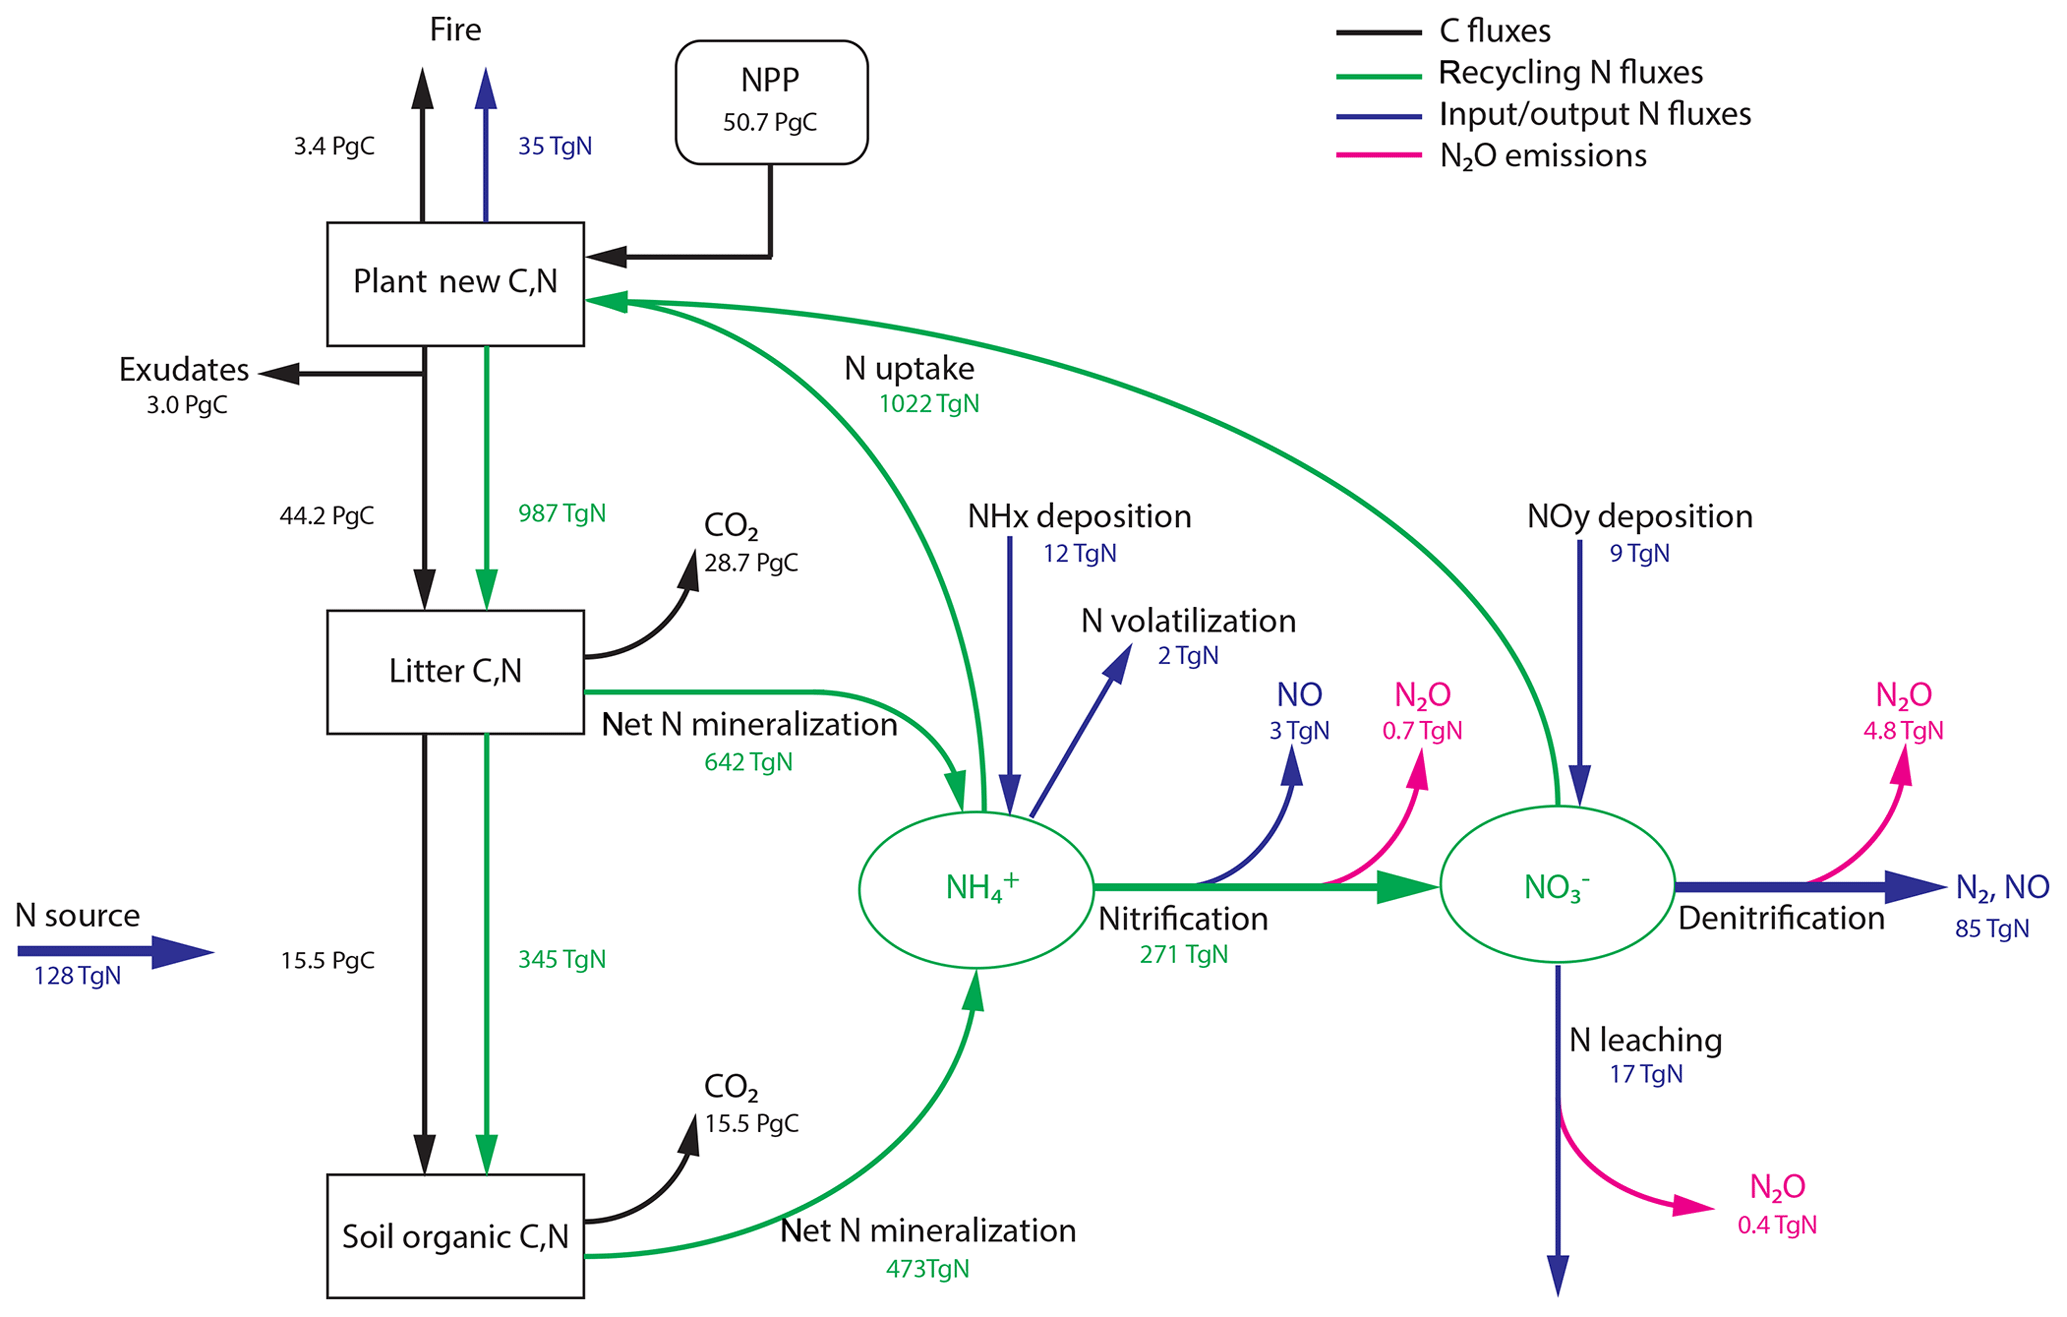
Figure 1Terrestrial C and N cycles. Simple schematic of global annual C fluxes (black), recycling (green) and input/output (blue) N fluxes, and N2O emissions (magenta) from nitrification and denitrification processes. Fluxes are illustrated with a quantitative budget from the LPX-Bern(v1.4N) model for preindustrial conditions (1450 AD). Plant net primary productivity (NPP) sets the N demand that is satisfied by N uptake from ammonium () and nitrate (). N enters the ecosystem mainly through biological N fixation (BNF) by plant symbiotic and free-living microorganisms in the soil.
Turning to the external cycle, reactive N enters land ecosystems (blue arrows in Fig. 1) through the conversion of dinitrogen (N2) to organic N and eventually to by BNF (Cleveland et al., 1999; Vitousek et al., 2013; Zaehle, 2013; Sullivan et al., 2014; Xu-Ri and Prentice, 2017), through rock weathering (Houlton et al., 2018), and the deposition (Lamarque et al., 2011; Vet et al., 2014; Dentener et al., 2006) of NHx and NOy (including sources by lightning). Reactive N is lost from land ecosystems through gaseous losses (including N2O), leaching of and dissolved organic matter by runoff, and emissions of N compounds by fire (Bouwman et al., 2013; Ciais et al., 2013; Hedin et al., 1995, 2003). On a larger scale, N lost by fires will be deposited again, and a large part of this N flux is therefore fed again to land ecosystems. In this sense, the fraction of the fire flux not lost to the ocean may be viewed as belonging to the internal global land N cycle. N leached as dissolved organic N is typically remineralized downstream and may undergo nitrification and denitrification or be taken up by aquatic organisms. N may also be absorbed by minerals and become unavailable for plants and microbiological assemblages. Following mass balance, losses of reactive N from ecosystems and changes in N stocks have to be compensated by N inputs, mainly by BNF.
The external and internal N cycles are coupled. Reactive N in mineral forms serves as a substrate for the N loss fluxes (external cycle) as well as a reservoir for plant N uptake (internal cycle). Following mass balance, mineral N concentrations change until the balance of N input by BNF and other sources matches N loss and net ecosystem N uptake (reactive N uptake minus net N mineralization). For example, in a growing ecosystem an increasing amount of N is taken up by plants and converted from inorganic to organic forms. This net ecosystem N uptake tends to deplete reactive N in mineral forms. Correspondingly, N loss fluxes (including N2O) would decrease and N limitation of plant growth would increase if N sources, such as BNF, do not adjust to the increasing ecosystem N demand. Whether N limitation increases or not in a growing ecosystem therefore depends critically on the flexibility of N input, hence BNF.
Empirical evidence from N-addition experiments, synthesized by Lu et al. (2011) and Niu et al. (2016), shows that the uptake of N by plants, net primary productivity, and biomass as well as NHx and pools in soils, nitrification, nitrate leaching, denitrification, and N2O emissions all increase simultaneously with N input. This finding points to a tight coupling between the availability of reactive N for plant growth, nitrification, and denitrification fluxes and N2O. N2O production on land is predominantly associated with denitrification and to a smaller extent with nitrification. Large gaseous losses and N2O emissions are thus indicative of a large N throughput (input and loss), where ecosystem functioning may have adjusted by exploiting energetically costly but evolutionarily advantageous BNF to compensate for the losses (Batterman et al., 2013; Pons et al., 2007; Vitousek and Hobbie, 2000) or where losses are compensated by N input from weathering or deposition.
In summary of Sect. 2.1 and 2.2, changes in terrestrial N2O emissions may be linked (i) to changes in the magnitude of reactive N entering and leaving ecosystems and (ii) to changes in the N2O yield per unit reactive N converted in land ecosystems.
3.1 The LPX-Bern(v1.4N) dynamic global vegetation model
The dynamic global vegetation and land surface process model LPX-Bern (“Land surface Processes and eXchanges” model as implemented at the University of Bern, version 1.4N) (Lienert and Joos, 2018b) is applied here in transient mode over the last 21 000 years (Ruosch et al., 2016). The LPX-Bern model describes dynamical vegetation and terrestrial biogeochemical processes, integrates representations of non-peatland (Gerten et al., 2004; Joos et al., 2004; Sitch et al., 2003) and peatland (Spahni et al., 2013; Wania et al., 2009) ecosystems and their C and N dynamics (Stocker et al., 2013; Xu-Ri and Prentice, 2008; Xu-Ri et al., 2012), and describes the dynamic evolution of wetland and peatland extent (Stocker et al., 2014). The model calculates the release and uptake of the trace gases CO2, N2O (Stocker et al., 2013; Xu-Ri and Prentice, 2008; Xu-Ri et al., 2012), and CH4 (Spahni et al., 2011; Wania et al., 2010; Zürcher et al., 2013).
Vegetation is represented by plant functional types (PFTs) that are in competition for resources (water, light, N) on each grid cell. Here a version with 15 PFTs is used. Eight generic tree PFTs and PFTs for C3- and C4-type grasses grow on natural land (excluding peat) and former peat. Two PFTs representing peat mosses and flood-tolerant C3 graminoids as well as three flood-tolerant tropical PFTs grow on peat and wetlands. The model accounts for the dynamic coupling of C and water cycles through photosynthesis and evapotranspiration, which also defines plant water use efficiency (Saurer et al., 2014; Keller et al., 2017). Seven C and N pools per PFT represent leaves, sapwood, heartwood, fine roots, aboveground leaf litter, aboveground woody litter, and belowground litter. Separate soil organic C and N pools receive input from litter of all PFTs. LPX-Bern uses a vertically resolved soil hydrology, heat diffusion, and an interactive thawing–freezing scheme (Wania et al., 2009).
The LPX-Bern vegetation and soil components interact with a dynamic N-cycle module (Xu-Ri and Prentice, 2008; Xu-Ri et al., 2012), accounting for the uptake of mineral N by N immobilization in soils (Bengtsson et al., 2003; Li et al., 2017; Gütlein et al., 2017) as in Xu-Ri and Prentice (2017). The module describes the relevant N and N2O fluxes and pools for plants and soils as schematically depicted in Fig. 1 and summarized below.
In LPX-Bern, the source of reactive N is implied by maintaining prescribed soil N:C ratios associated with each of the plant functional types, reflecting their different litter chemistries and decomposer assemblages. Due to lower N:C ratios of litter than soil pools, the transfer of mass from litter to soil pools during litter decomposition therefore implies a given amount of N required to satisfy the soil N:C ratio. The required N is partly satisfied by a flux representing immobilization of mineral N. The remainder determines the total input of reactive N into the ecosystem, implicitly subsuming symbiotic and asymbiotic BNF, and any other potential N sources that may support plant growth, in addition to prescribed N deposition. The amount of N input required to close the N balance of soils and to maintain the soil pools at their high N:C ratios depends on the flux representing N immobilization. Constant fractions (frac_soil_immob, frac_litter_immob) of the N flux released by soil or litter remineralization are immediately returned to its pool of origin. Hence, the choice of these parameters simultaneously co-determines reactive N input rates and net N mineralization.
We assumed the parameters frac_soil_immob and frac_litter_immob to be invariant over time and space and calibrated their values (Table A1) to match a total preindustrial reactive N source of 128 Tg N yr−1. This value implicitly includes contributions from symbiotic and asymbiotic BNF as well as other inputs of reactive N not included in the prescribed N deposition. Estimates of the global BNF for non-agricultural ecosystems are uncertain. They range from 40 to 470 Tg N yr−1. Cleveland et al. (1999) used 100 plot-scale estimates of BNF to estimate global BNF on natural ecosystems to 195 Tg N yr−1 (range: 100 to 290 Tg N yr−1). Vitousek et al. (2013) suggest a plausible range for preindustrial BNF of 40 to 100 Tg N yr−1 by computing BNF as the difference from all other global sources and sink fluxes of N. Cleveland et al. (2013) estimate symbiotic BNF to 105 Tg N yr−1, based on cost–benefit modelling for N fixation. The same authors estimate asymbiotic N fixation to 22 Tg N yr−1 by upscaling measurements reported in Cleveland et al. (1999). In contrast, Elbert et al. (2012) estimate asymbiotic N fixation by cryptogamic covers alone to 49 Tg N yr−1 (27–99 Tg N yr−1) by integrating experimental data from 200 studies. In addition, rock weathering is estimated to add 15 (10 to 20) Tg N yr−1 to land ecosystems (Houlton et al., 2018). Xu-Ri and Prentice (2017) estimate global N sources to 340 (230–470) Tg N yr−1 for the parameter settings they adopted within the LPJ-DyN model; this estimate includes contributions from rock weathering and other inputs that are not explicitly prescribed or simulated by LPJ-DyN. Meyerholt et al. (2016) implemented six different BNF formulations in their model to predict modern BNF ranging from 108 to 148 Tg N yr−1.
Plant net primary productivity (NPP) and a prescribed constant N:C ratio of new production in different tissues sets the N demand that is satisfied by N uptake from and pools which in turn depend on net N mineralization fluxes from litter and soil pools and loss fluxes of reactive N (e.g. denitrification, leaching, volatilization) (Fig. 1). In case that available inorganic N (sum of and ) is insufficient to meet the demand, NPP is down-regulated, thereby inducing an effect of N limitation. The implied N source tends to re-establish a balance between the input and the loss of reactive N.
Nitrification is assumed to be proportional to the soil pool with a temperature-dependent rate coefficient. Denitrification is modelled as a two-step process whereby is converted to nitrite () and is further converted to N2, following Michaelis–Menten kinetics with dependence on the substrates and as well as on labile C availability. Reaction rates are temperature dependent. leaching depends on soil , available water holding capacity, and daily runoff. Reactive N is also lost from a grid cell by fire, assuming complete loss of N from burned vegetation, and NH3 volatilization.
N2O emissions are computed by assuming that fractions of the N fluxes associated with denitrification, nitrification, and N leaching are released as N2O. The calibration of the denitrification and nitrification yield factors is done to satisfy the constraints from the global atmospheric N2O budget, which suggests global terrestrial emissions to be 5.9 Tg N yr−1 at preindustrial (Battaglia and Joos, 2018). Since global terrestrial N2O emissions depend also on the N loss rates (denitrification and nitrification), we first calibrated the parameters frac_soil_immob and frac_litter_immob, which co-determine these rates, and then calibrated the yield parameters, given the N loss rates. For denitrification, the globally dominant N2O source path, this fraction is the product of a constant (RN2ODN) and a temperature-dependent factor f(T). f is unity at 22 ∘C and its value roughly doubles for a temperature increase of 10 ∘C. The amount of N2O released per unit N denitrified is therefore higher in warm regions than in cold regions. The constant RN2ODN is set to 5.418 % of the denitrification rate. The corresponding yield fraction for N2O emissions from nitrification is nominally set to 0.231 % at 22 ∘C and the same temperature dependence (Smith, 1997) as for denitrification is assumed. The N2O yield for the leaching N flux is assumed constant and, for simplicity, set to the nominal value of nitrification (0.231 %).
The two-step calibration described above resulted in yield factors that are higher than the range of published estimates. The global mean yield for denitrification, expressed as N2O per N2 produced, is 5.6 % and thus higher than the range of estimates (0.2 %–4.7 %) summarized by Xu-Ri and Prentice (2008). Similarly, the global yield for nitrification (0.26 %) is higher than observation-based estimates (0.01 %–0.2 %). The mismatches in these estimates for yield may suggest that current best estimates for the N source, N2O yield, and preindustrial N2O emissions are not fully consistent. We carried out a sensitivity simulation to explore uncertainties: the immobilization fraction is set to 0 % for litter and to 26.39 % for soil mineralization, leading to a preindustrial N source of 523 Tg N yr−1. This is about a factor of 4 higher than in the standard setup. Correspondingly, yield factors are about a factor of 4 lower in this sensitivity run than in the standard simulation.
The sensitivity of simulated N2O emission changes over the deglacial period to these parameter choices is relatively small, while the absolute magnitude of the N source has some implications for N stress and thus NPP. The increase in NPP over the deglaciation is larger in simulations with a high compared to a low N source (10.1 versus 5.9 GtC yr−1 in the standard). Importantly, the difference in relative changes in modelled global N sources is small (16 % versus 10 % in the standard), and the deglacial increase in N2O emissions is only 0.2 Tg N yr−1 higher in the sensitivity run than in the standard run (see Sects. 3.2 and 5), despite the large difference in the implied N source. Thus, related model-based conclusions for N2O emissions are not sensitive to the parameter settings for the yield and the flux representing immobilization.
3.2 Setup for transient glacial–interglacial simulations
A previously described LPX-Bern model setup for glacial–interglacial simulations is applied (Spahni et al., 2013; Ruosch et al., 2016) and input data are shown in Fig. 2. The evolution of monthly temperature, precipitation, cloud cover, and number of wet days, annual atmospheric CO2 (Joos and Spahni, 2008), orbital insolation changes (Berger, 1978) modulating plant available light, and topography changes through ice-sheet and sea-level changes imposed by ICE-5G (Peltier, 2004) are prescribed. The monthly climate data are obtained by combining monthly values from the observation-based, modern climatology compiled by the Climate Research Unit (CRU) (Mitchell and Jones, 2005) with monthly anomalies for the past 21 000 years from a transient climate simulation over this period (TraCE-21ka) (Liu et al., 2009; Otto-Bliesner et al., 2014) with the Community Climate System Model, version 3 (CCSM3) maintained by the National Centre for Atmospheric Research (NCAR). Here the LPX-Bern model was run with a spatial resolution of 3.75∘ longitude × 2.5∘ latitude and a daily time step was applied in the photosynthesis, water, and N-cycle modules. Simulations started from an equilibrated spin-up at 21 ka. Annual N deposition from the atmosphere, distributed across days according to precipitation within a year, is prescribed at preindustrial values (Lamarque et al., 2011).
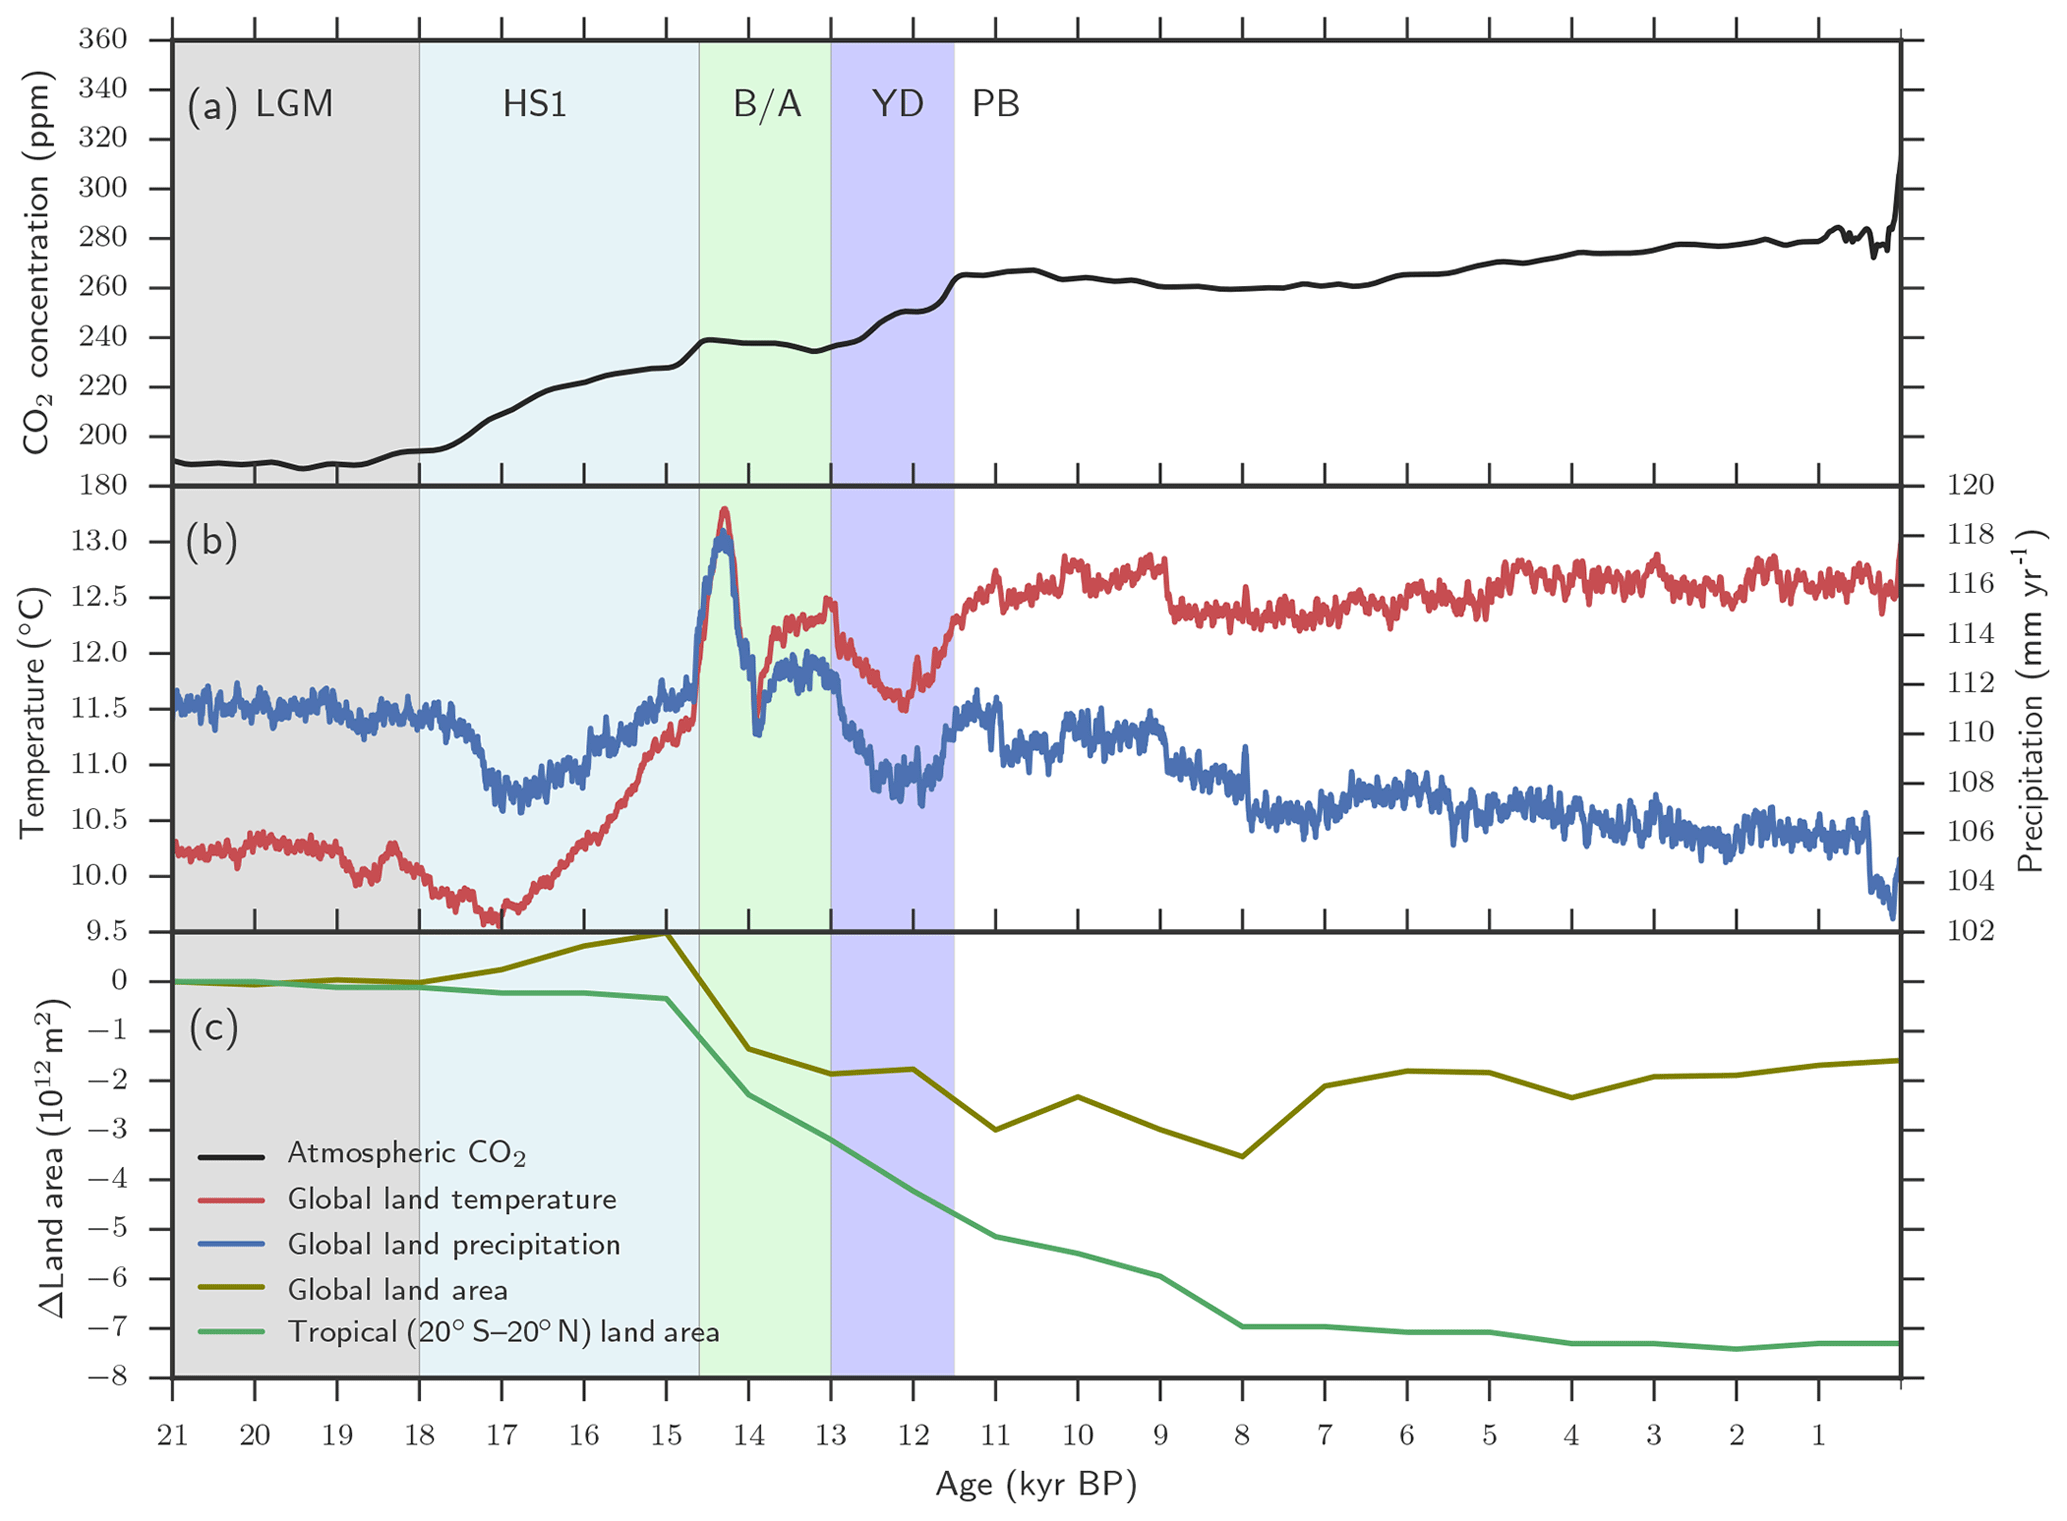
Figure 2Aggregated LPX-Bern(v1.4N) input data. (a) Evolution of atmospheric CO2, (b) of temperature and precipitation, and (c) of changes in tropical and global land as available for plant growth relative to 21 ka (bottom). Temperature and precipitation represent mean values over global land areas that were not flooded and not ice-covered at 21 ka PB and at 0.5 ka.
The same model parameter values as determined by Lienert and Joos (2018b) are used, except for the immobilization fractions and N2O yield factors (Table A1). Regarding the N module, the parameters are the same as in previous studies (Stocker et al., 2013; Schilt et al., 2014) addressing N2O emissions over the past and under future global warming. An exception is an adjustment in the upper limit of the fraction of nitrified per day from 0.1 to 0.09096 d−1 at 20 ∘C and in the yield factors for denitrification, nitrification, and leaching in response to new observation-constrained estimates of marine N2O emissions and to a slightly revised estimate of the atmospheric N2O lifetime from 120 to 123 years (Prather et al., 2015) as well as the simple representation of N uptake by N immobilization as discussed above.
Changes in N2O emissions and other model outcomes are attributed to individual driving factors (temperature, precipitation, CO2, orbital insolation, and land mask). One driver is kept at its preindustrial state in factorial simulations. BNF was kept at LGM values in an additional factorial run for each land use class and grid cell. In a further simulation, the yield factors for denitrification and nitrification were set to be constant in space and time for each land use class. The difference in results between the standard model setup (baseline) and a factorial run is attributed to the relevant driver. An interaction or synergy term, called “other drivers”, is quantified by the difference between the change in N2O emissions (ΔeN2O) simulated in the baseline run and the sum of the emission changes attributed to individual drivers: . The dominant driver is identified as having the largest contribution to ΔeN2O in the baseline run with the same sign of change. Grid cells that submerge under seawater or emerge from waning ice sheets during the period considered and grid cells with insignificant changes ( mg N m−2 yr−1) are excluded from the spatially resolved attribution.
The response timescales of LPX are investigated in a further “step-change” sensitivity simulation. Starting from the equilibrated spin-up at 21 ka, climatic conditions and atmospheric CO2 are abruptly changed to conditions for 2.5 ka. The run is continued for another 1500 years with climate and CO2 forcing for the period from 2.5 to 1 ka. The land mask is kept constant at the maximum extent possible for both LGM and late Holocene conditions. A corresponding reference simulation without step change was performed. The simulations, together with the above factorial runs, permit us to address how quickly N2O emissions in the LPX model are able to respond to a sudden warming event, similar to the onset of Bølling–Allerød (B/A) and the end of the Younger Dryas (YD).
We start the presentation of results by summarizing the main feature of the terrestrial N2O emission record (Fig. 3, green line) presented in part 1 of this study (Fischer et al., 2019). In part 1, the global N2O emissions from land and from the ocean are jointly reconstructed by deconvolving novel ice-core data of N2O and of its isotopic signature, δ15N(N2O), using an established method and relying on differences in the isotopic signature of land versus marine N2O emissions. Terrestrial emissions increased between LGM (21 ka) and PI (1500 CE) by about 1.8 Tg N yr−1. Terrestrial emissions remained approximately invariant during the Heinrich Stadial I Northern Hemisphere (NH) cold phase (HS1; 17.4 to 14.6 ka, Rasmussen et al., 2014) until the start of the B/A NH warm period (14.6 to 12.8 ka). Then, land emissions increased at the start of the B/A, declined again during the YD NH cold period (12.8 to 11.7 ka), and peaked at the start of the preboreal period (PB), followed by a modest increase during the Holocene.
Remarkably, the overall deglacial increase in terrestrial N2O emissions was mainly realized in two large steps at the onset of the B/A and at the end of the YD, two major Northern Hemisphere warming events. The detailed analysis of the ice-core N2O concentration and isotope data (see Fischer et al., 2019) reveals that global terrestrial N2O emissions started to rise at the beginning of the warming events. The enclosure process of atmospheric air into firn and ice acts like a low-pass filter, smoothing any fast variations in atmospheric N2O, in its isotopic signature, and, correspondingly, in inferred emissions. Fischer et al. conclude that global terrestrial N2O emissions reacted within a maximum of 200 years to the large-scale climate reorganizations associated with the two major deglacial Northern Hemisphere warming events.
Overall, the ice-core data show that land ecosystem N2O emissions responded sensitively to climatic and environmental changes over the deglaciation. The rapid increase in terrestrial N2O emissions at the onset of the B/A and at the end of the YD and the overall increase in emissions over the past 21 000 years either point (i) to an increase in N2O yield per unit N converted for emissions to the atmosphere, averaged globally and across all N2O production pathways, or/and (ii) to an increase in the global flux of converted N. Reactive N was available in sufficient amounts to support an increase in global terrestrial N2O emissions during periods where environmental conditions became, on a global scale, more favourable for plant growth and C sequestration (Ciais et al., 2012; Bird et al., 1994; Joos et al., 2004; Jeltsch-Thömmes et al., 2019).
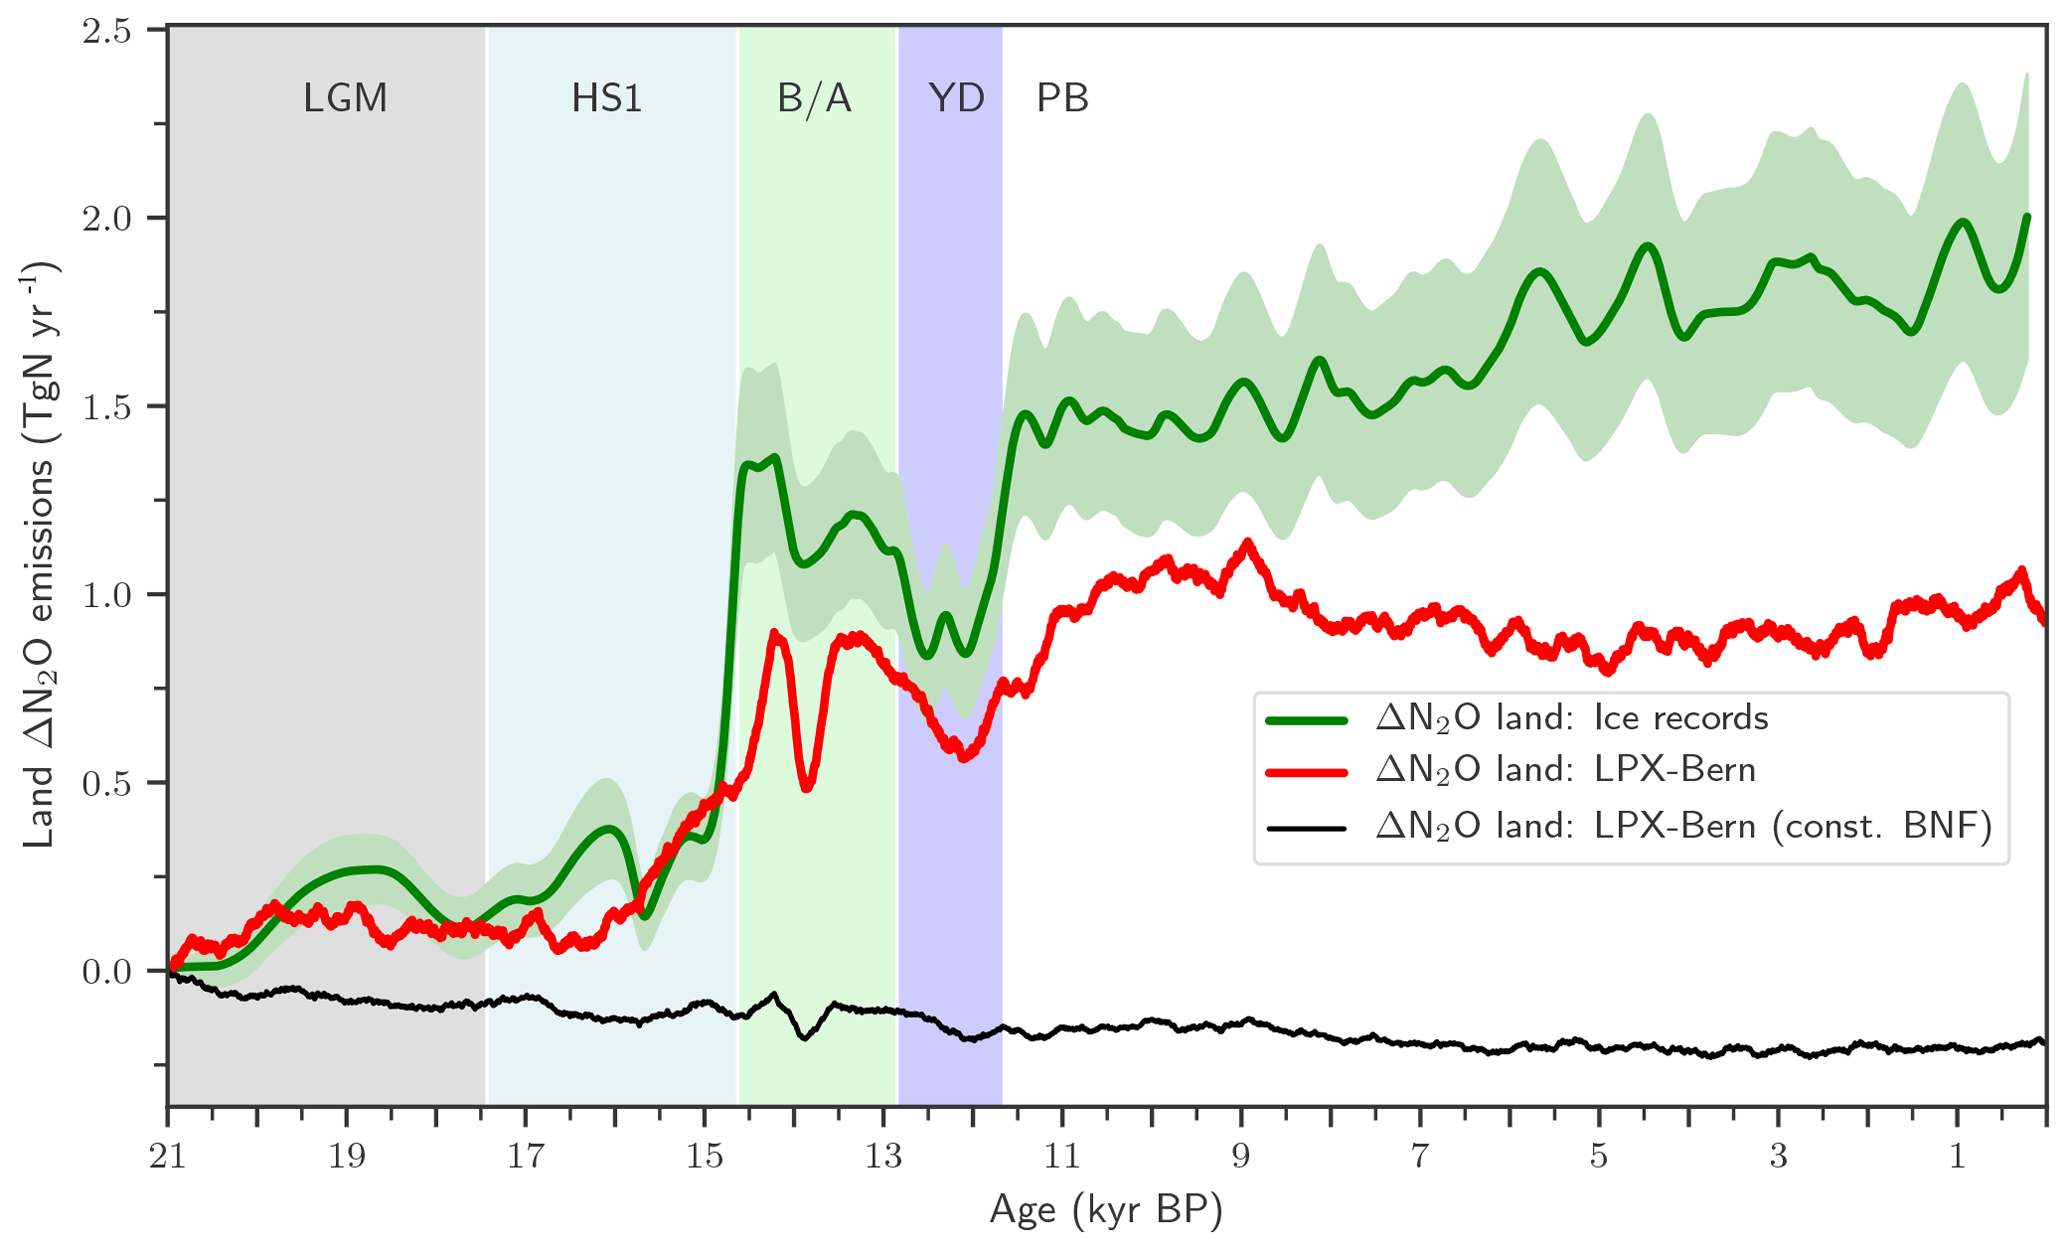
Figure 3Changes in global terrestrial emissions of N2O. Reconstructed changes in global land N2O emissions are shown by the solid green line together with an uncertainty estimate (±1 standard deviation; shaded area). Reconstructed changes are calculated with an atmospheric two-box model (Schilt et al., 2014) from ice records of N2O concentration and δ15N(N2O). Reconstructed changes are compared to LPX-Bern(v1.4N) for the baseline simulation (red line) and a simulation with biological nitrogen fixation kept constant at Last Glacial Maximum values (thin black line).
5.1 Simulated changes in global terrestrial N2O emissions and spatial patterns of change
We next explore governing mechanisms of the deglacial terrestrial N2O emissions and potential implications for the C–N cycles in the spatially resolved LPX-Bern model. LPX-Bern v1.4N simulates a general increase in global land N2O emissions over the deglacial period (Fig. 3). The modelled deglacial increase in N2O emissions is only 0.96 Tg N yr−1 and about 47 % smaller than the reconstructed increase of 1.8±0.3 Tg N yr−1 (±1 standard deviation; Fig. 3). Modelled changes are typically less abrupt than reconstructed variations. The model shows emission variations during the B/A and YD periods with peaks in emissions at the onset of the B/A (14.6 ka) and the preboreal (11.7 ka) and an emission peak around 13.5 ka and corresponding minima at 14 ka and during the YD (12.8 to 11.7 ka). Reconstruction and models show moderate and small changes in global terrestrial N2O emissions over the last 11 000 years, the Holocene period. Simulated terrestrial N2O emissions decreased by 0.06 Tg N yr−1 between 10 and 0.5 ka, whereas reconstructed emissions increased by 0.41 Tg N yr−1 over the Holocene, leading to a discrepancy between simulated and reconstructed anomalies. The reconstruction suggests relatively constant emissions from the land biosphere during HS1 and a rapid rise in emissions at the start of the B/A, whereas the model simulates steadily increasing emissions over the second half of the HS1 interval, reflecting the gradual climate warming in the TraCE-21ka climate input data during HS1 (see discussion below). The model also shows a much slower and a smaller emission increase at the YD–PB transition than reconstructed.
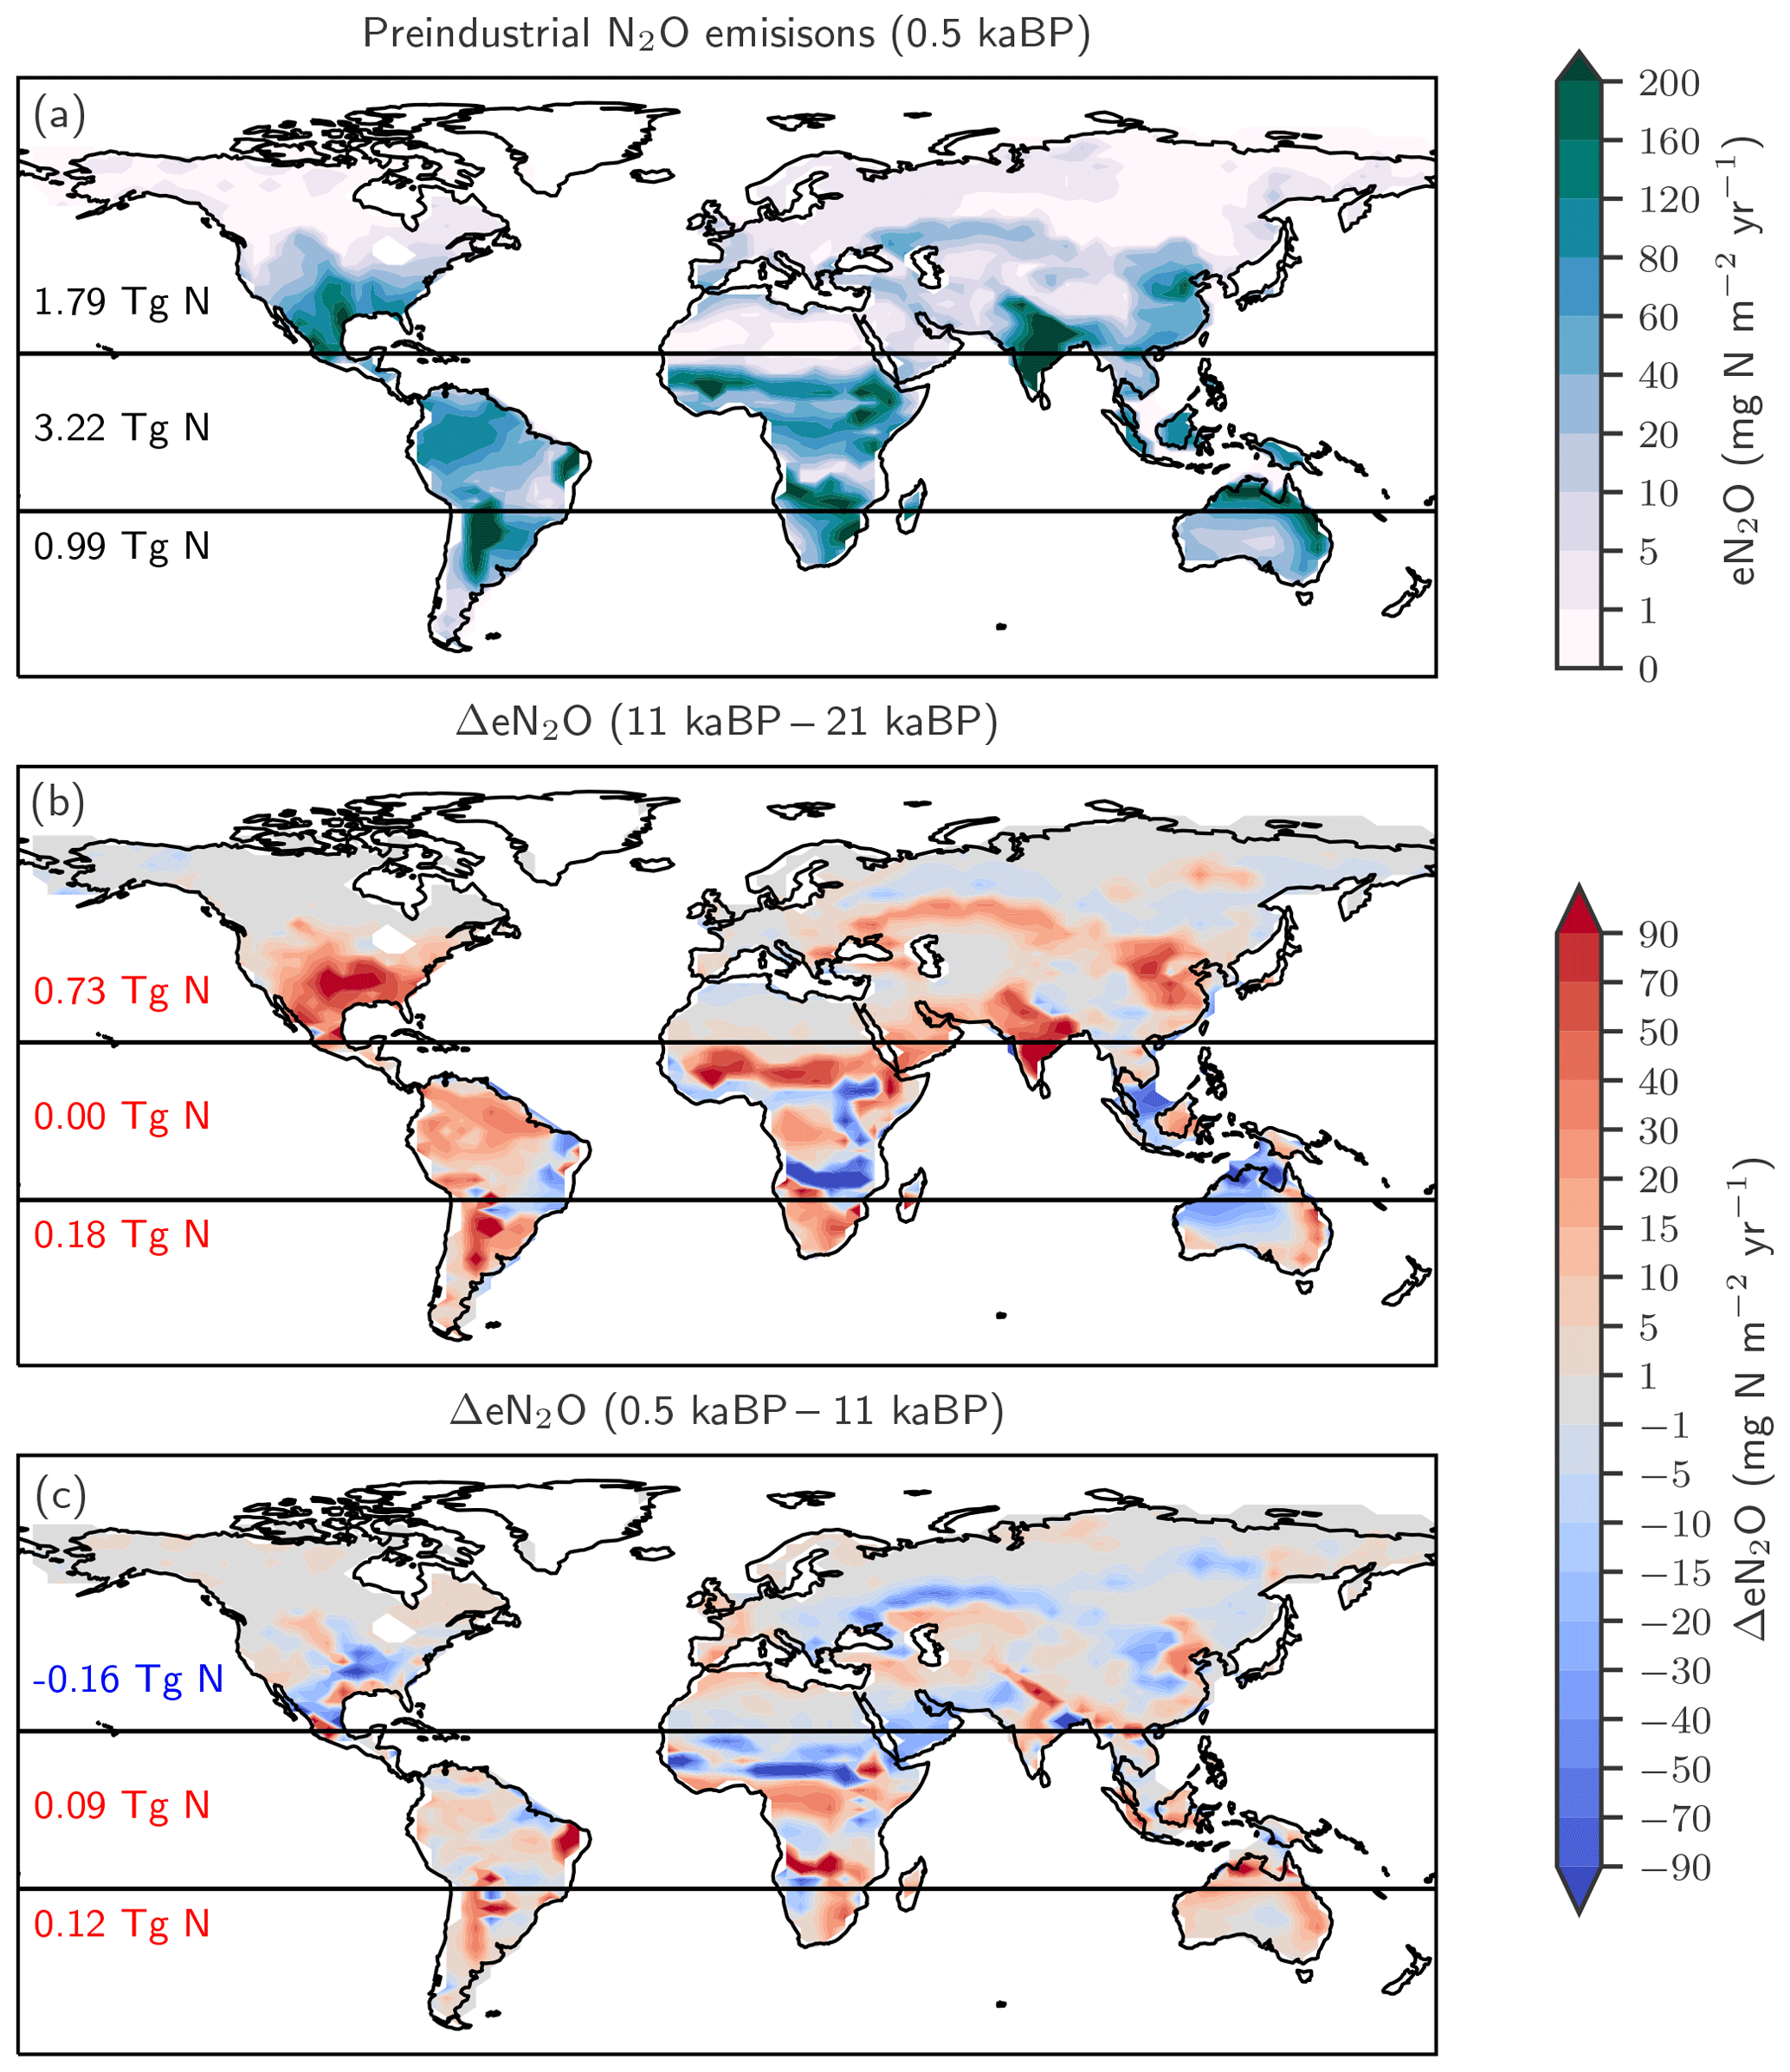
Figure 4Preindustrial patterns (a) and changes in terrestrial N2O emissions for the last glacial termination (b; 11 ka minus 21 ka) and the Holocene (c; 0.5 ka minus 11 ka) as simulated with LPX-Bern(v1.4N). Numbers indicate integrated values for three latitudinal bands (90–20∘ S; 20∘ S–20∘ N; 20–90∘ N).
The changes in global terrestrial N2O emissions are the result of spatially differentiated responses. LPX-Bern simulates high natural emissions of N2O in the tropics and low emissions at high latitudes (Fig. 4a). The spatial pattern and the magnitude of emissions are consistent with data-based estimates of natural N2O emissions from soils (Zhuang et al., 2012; Stehfest and Bouwman, 2006; Potter et al., 1996). At 1450 AD, emissions in the tropics can be as high as 250 mg N m−2 yr−1 and the integrated flux between 20∘ S and 20∘ N amounts to 54 % of the global emissions, while emissions per unit area are low at high latitudes and northern and southern extra-tropics contribute only a share of 29 % and 17 % to the global terrestrial emissions. In contrast, emissions increased strongly in the northern extra-tropics over the glacial termination (Fig. 4b), while the integrated change in emissions is negligible in the tropical belt. Large increases per unit area are simulated over the termination at mid and low latitudes on the North and South American continents, in the southern boreal zone in Eurasia, and in parts of eastern Asia, India, Indonesia, and Africa. N2O emissions decreased in a few regions, namely in Africa around 15∘ S and in northern Australia (Fig. 4b). Loss of tropical land due to rising sea level and the addition of land emerging from waning ice sheets (Peltier, 2004) are important drivers of modelled terrestrial N2O emissions between 15 and 8 ka. The net loss of terrestrial N2O emissions by land area changes was dominated by the submergence of the high-productivity Sunda and Sahul Shelf regions. This loss offsets about one-third of the G-IG increase in global terrestrial N2O emissions. Changes in the land extent caused by changes in sea level represent an important factor for past global terrestrial N2O emissions.
The patterns of change in terrestrial N2O emissions (Fig. 4c), as well as spatial and seasonal patterns in precipitation and temperature, are complex for the Holocene period. Despite small changes in global terrestrial N2O emissions during the Holocene, LPX-Bern simulated large regional shifts in source strength, linked to changes in temperature and precipitation. This includes for example a decrease in N2O emissions from 11 to 0.5 ka in boreal Asia, in the sub-Sahara region in Africa, and in parts of the conterminous United States of America (USA) and an increase in emissions in tropical Africa, parts of Australia and Latin America, as well as in western Europe.
5.2 Biological nitrogen fixation and carbon–nitrogen coupling
In this section, we address C–N coupling in LPX-Bern and analyse the spatial patterns for the source of reactive N, soil mineral N, net primary productivity (NPP), and C stocks (Fig. 5) and their changes over the deglaciation (Fig. 6). We quantify two decisive factors for N2O emission change in the model: (i) changes in the source of reactive N, fueling nitrification and denitrification, and (ii) changes in the N2O yield per unit N converted.
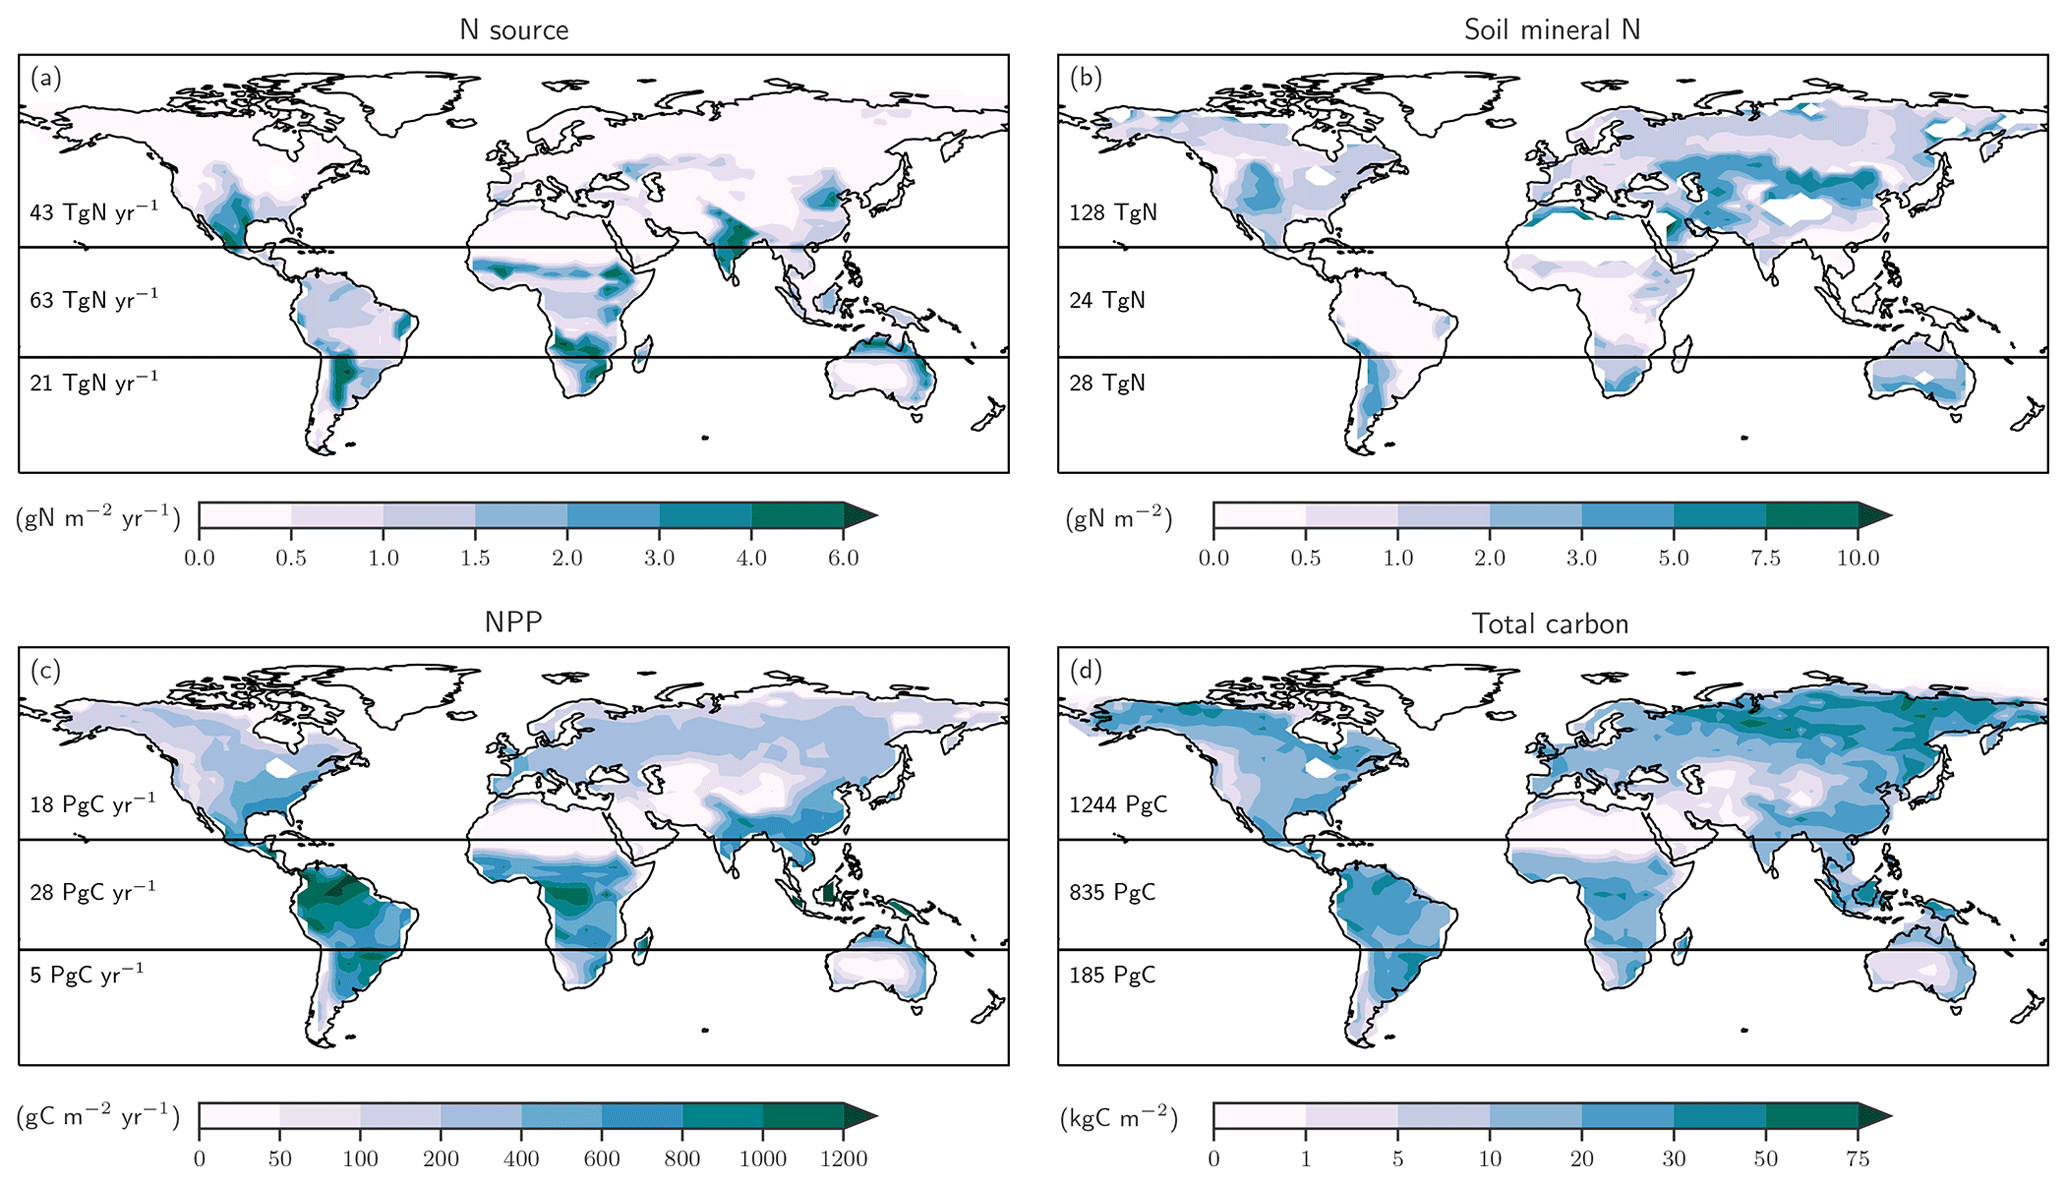
Figure 5Preindustrial patterns of the input flux of new nitrogen (N) into ecosystems (a), the bioavailable concentration of N in the form of ammonium and nitrate in soils (b), net primary productivity (c), and total carbon in the land biosphere (d) as simulated by LPX-Bern(v1.4N). The N source in (a) does not include the prescribed N deposition. Deserts with high mineral nitrogen concentrations are masked for clarity in (b). Numbers indicate integrated values for three latitudinal bands (90–20∘ S; 20∘ S–20∘ N; 20–90∘ N).
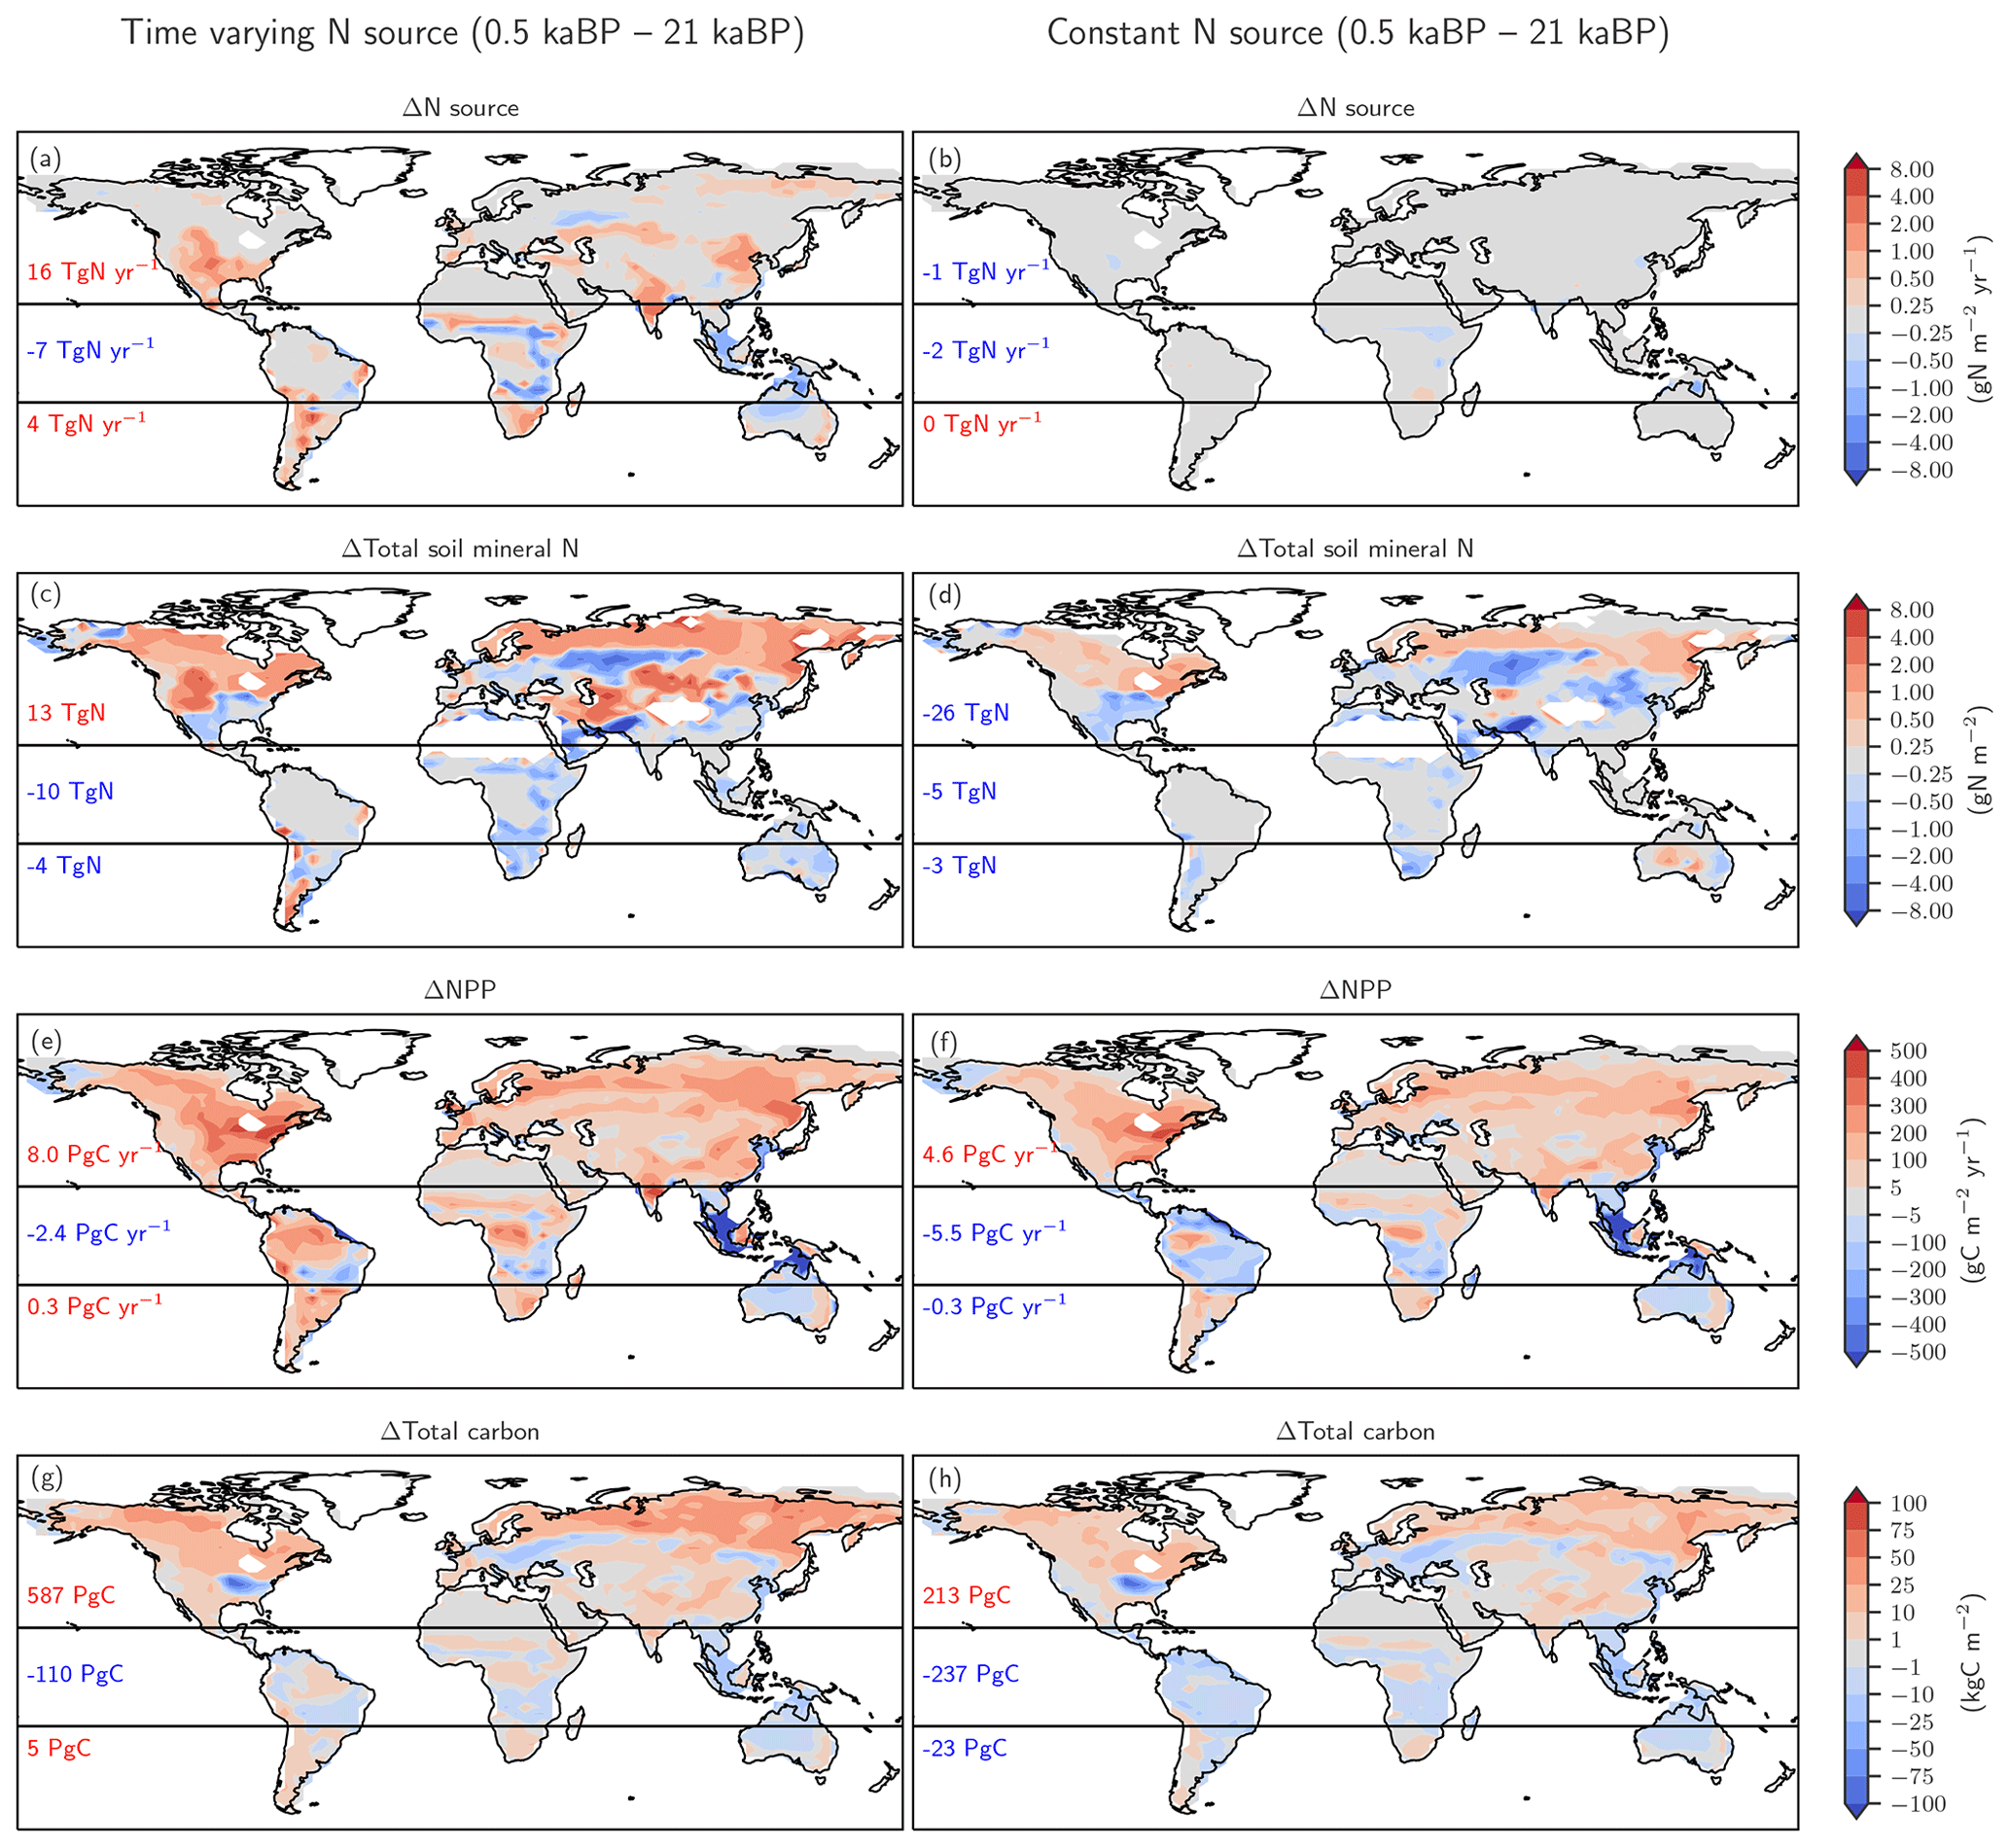
Figure 6Biological nitrogen fixation allowed to adjust to demand (left) versus time-invariant N source (right). The figure shows simulated deglacial changes (0.5 ka minus 21 ka) for the standard setup of LPX-Bern(v1.4N) (left column) and a setup where the nitrogen source flux is kept constant at values simulated for the Last Glacial Maximum (right column) for the same variables shown in Fig. 5. Note that a decreasing N source is shown in panel (b) for land areas lost due to deglacial sea-level rise and in some tropical cells where mineral soils with a relatively high N source are replaced by peat with a relatively low N source.
We first address C and N fluxes for the preindustrial mean state (Fig. 5), before turning to deglacial change. The N source (Fig. 5a) is typically smaller than 0.5 g N m−2 yr−1 at northern mid and high latitudes and around 1 g N m−2 yr−1 in tropical rainforest and in central America, comparable to observational estimates (Sullivan et al., 2014; Wurzburger and Hedin, 2016a, b). An N source in the range of 2 to 6 g N m−2 yr−1 is simulated in many semi-arid regions, including southern Africa, the sub-Sahara region, India, northern Australia, and the southern parts of North America. Soil mineral N (Fig. 5b) is typically below 0.5 g N m−2 in tropical forests and around 1 g N m−2 in temperate and boreal forests and tundra regions, while higher values of up to and more than 10 g N m−2 are simulated in extra-tropical semi-arid and arid regions. Annually integrated NPP (Fig. 5c) is largest in the tropics, while large carbon stocks (Fig. 5d) are simulated in tropical forests and in the northern boreal zone. We note that the patterns of these C and N fluxes and stocks are all different, pointing to spatially distinct relationships between these four variables.
The N2O yield factors, i.e. the N2O produced per unit N converted by denitrification and nitrification, are assumed to vary with temperature and thus in space and time in LPX-Bern v1.4N. In a sensitivity run, these yield factors are set constant with all other settings as in the standard. The deglacial warming leads to a higher N2O yield in the standard compared to this sensitivity run, and 0.44 Tg N yr−1 of the deglacial increase in land N2O emissions are attributed to this change in yield (Fig. 7, black line). In other words, changes in the yield factors further amplify the increase in N2O emissions as driven by the increase in the flow of reactive N in LPX-Bern.
Turning to changes in the sources of reactive N, the simulated N source increased by 12 % from 113 Tg N yr−1 at the LGM to 128 Tg N yr−1 at 0.5 ka in the standard setup. BNF, computed to match prescribed N:C ratios in soils (see methods), is implicitly assumed to adjust on the timescales of vegetation and soil carbon turnover to an increase in N demand by raising NPP and partly alleviating N limitation of plant growth in LPX-Bern. It is implicitly assumed that limitation by other nutrients does not affect the cycling of N and C through ecosystems on multi-decadal to century timescales and that nutrient input into ecosystems by deposition and weathering (plus BNF for N) is large enough to support plant growth. These assumptions are controversial (Hungate et al., 2003; Luo et al., 2004; Körner, 2015; Wieder et al., 2015b; Vitousek et al., 2010; Fatichi et al., 2014). Our novel ice-core isotope reconstruction of terrestrial N2O emissions allows us to critically evaluate this assumption in a quantitative way on the multi-decadal to centennial timescales as relevant for the anthropogenic perturbation. To this end, we implement an N-cycle representation leading to strong long-term nutrient limitation in the model. This is achieved by fixing the rate of the variable N source to its glacial value in each grid cell and land use class and by keeping these rates of N source constant in a sensitivity simulation over the past 21 000 years. This more strongly N-limited simulation yields not an increase, as reconstructed, but a decrease in global terrestrial N2O emissions (Fig. 3, black line). The decrease in global land N2O emissions is related to the loss of land in response to sea-level rise (−0.11 Tg N yr−1) and a small decrease in N2O emissions on remaining land (−0.088 Tg N yr−1) in this sensitivity simulation.
The comparison of changes in C and N fluxes and stocks between the simulations with variable and constant N sources also provides further insight into the N and C coupling (Fig. 6). The setup with a constant N source leads to smaller changes in the N cycle, a small deglacial decrease (−1.2 Pg C yr−1) instead of an increase (5.9 Pg C yr−1) in global NPP, and a decrease in terrestrial C stocks of 47 Pg C compared to an increase of 482 Pg C simulated in the standard setup.
The N source increases in many land regions in the standard setup but remains by design almost constant on non-flooded land in the simulation, with a constant N source per land use class (Fig. 6a, b). In the standard, the N source decreased over the deglaciation by 7 Tg N yr−1 in the tropics, due to land loss and a decrease in parts of Africa, while the N source increased by 16 and 4 Tg N yr−1 in the northern and southern extra-tropics, respectively. Corresponding changes are simulated for nitrification and denitrification in the standard setup, whereas changes in nitrification and denitrification remain small on non-flooded land in the N-limited run.
In response to the increased N input, the availability of reactive N remained roughly constant or increased in most land areas in the standard run, despite increased storage of N in plant and soil organic matter and accelerated nitrification and denitrification (Fig. 6c). A decrease in mineral N is simulated in the standard in regions where C stocks also decreased or changed little, including parts of mid-latitude Eurasia, Africa, Australia, and the southern US. In contrast, soil reactive N concentrations decreased in many extra-tropical regions in the simulation with a constant N source (Fig. 6d). Globally integrated, soil mineral N decreased by 19 % over the deglaciation in the run with a constant N source, compared to a negligible change in the standard setup.
These differences in BNF (including abiotic input) and the N cycle between the run with a constant N source and the standard case have profound impacts, not only for the emission of N2O, but also for NPP (Fig. 6e, f) and C sequestration (Fig. 6g, h). Global NPP increased over the deglaciation by 13 % in the standard case, compared to a decrease by 3 % in the run with a constant N source. LPX-Bern predicts that most of the NPP increase is realized in the northern extra-tropics. The NPP increase in the extra-tropics is almost twice as large in the standard as in the sensitivity run. As a result of the generally higher NPP, the deglacial change in C storage is in the standard, about 402 Pg C larger in the extra-tropics and about 127 Pg C larger in the tropics than in the run with a constant N source.
In summary, the simulation with a constant N source completely fails to reproduce the reconstructed N2O emissions from the land biosphere. The increases in N2O yield, as well as in soil and litter C and N turnover rates, under deglacial warming are not sufficient to overcome the effect of N limitation on N2O emissions in this sensitivity simulation. We note, however, that changes in yield due to processes not incorporated into LPX-Bern could potentially explain the reconstructed increase in N2O emissions. If the model is allowed to satisfy the demand of N, and thereby implicitly of other elements to support the growth of N fixers, nitrifiers and denitrifiers, and plants, simulated terrestrial N2O emissions increase substantially.
5.3 Attribution of simulated terrestrial N2O emissions to climatic and environmental drivers
The complex spatio-temporal changes in land N2O emissions are attributed to climatic and environmental drivers (Figs. 7 to 10). This attribution helps us to better understand the simulated changes and data–model mismatches. Globally, deglacial warming is the most important factor in the model, contributing 1.4 Tg N yr−1 to the overall emission increase, followed by changes in precipitation (0.7 Tg N yr−1, Fig. 7). Changes due to increasing atmospheric CO2 and orbitally driven changes in photosynthetically active radiation slightly offset the emission increase. Non-linear interactions among the different drivers contribute negatively to the global increase. The change in land extent due to ice-sheet melting and sea-level rise leads to a reduction in terrestrial N2O emissions (−0.5 Tg N yr−1). As described in the previous section, a substantial part of the increase attributed to temperature is due to a temperature-driven change in the yield factor of nitrification and denitrification (Fig. 7, red and black lines).
Figure 7Attribution of simulated global terrestrial N2O emission changes to individual drivers. Results are from LPX-Bern(v1.4N) for the standard and factorial simulations, where an individual driver (temperature (red), precipitation (blue), atmospheric CO2 (green), orbital parameters affecting photosynthetic active radiation (light blue), land mask accounting for sea-level changes) is kept at the preindustrial level. The violet curve (other non-linear effect) is the difference between simulated emissions in the standard setup and the sum of all these attributed emissions; it reflects the effect of non-linear interactions between different drivers. In addition, the black curve indicates the change in N2O emissions attributed to variations in the N2O yield factor for nitrification and denitrification.
Turning to HS1 and the transition to the B/A, the majority of the simulated emission increase is in response to changes in physical climate, i.e. changes in temperature and precipitation (Fig. 7). In other words, the simulated rise in land N2O emissions, which occurred earlier in the simulation than the ice-core reconstruction, is not driven by CO2 fertilization and an associated change in N ecosystem flows, but by the prescribed climate change from TraCE-21ka. It is not clear whether the model's failure to represent the reconstructed emission changes during the HS1 period and at the onset of the B/A in the standard simulation is due to deficiency in the response of LPX-Bern to early deglacial climate change, to deficiencies in the climate input data, or a combination of the two.
Individual drivers exert regionally distinct influences, and these may vary between different periods. Here, we attribute the spatial changes to changes in temperature, precipitation, CO2, and their non-linear interactions for the glacial termination and the Holocene using factorial simulations (Fig. 8) and by examining the temperature and precipitation changes in the TraCE-21ka input data (Fig. 9). Generally, attributed changes in emissions find their counterpart in underlying changes in individual drivers, but sometimes non-linear interactions and non-additivity of individual responses hamper the attribution to individual drivers.

Figure 8Attribution of simulated global terrestrial N2O emission changes to individual drivers for the last glacial termination (11 ka minus 21 ka; left) and the Holocene (0.5 ka minus 11 ka; right). Changes are attributed to changes in temperature (a, b), precipitation (c, d), atmospheric CO2 (e, f), and non-linear interactions among the drivers plus the small effect due to changes in incident solar radiation (g, h).
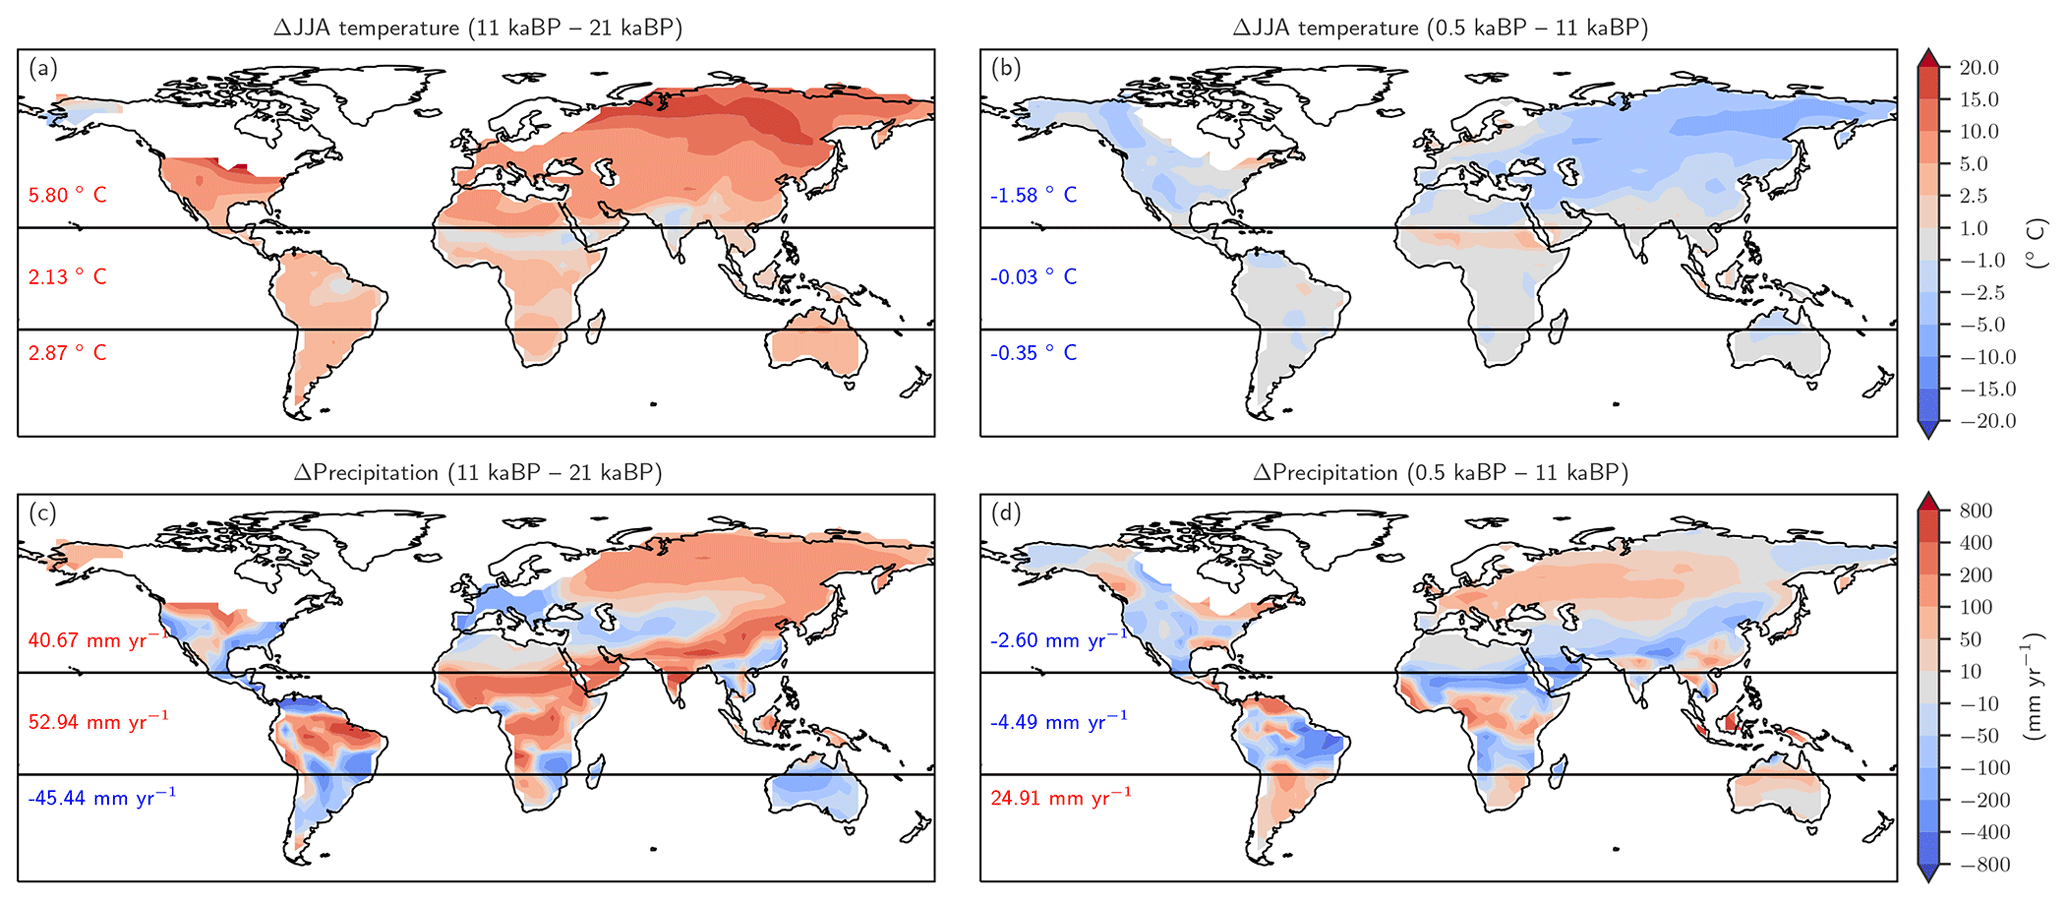
Figure 9Changes in Northern Hemisphere summer temperature (June, July, August, panels a and b) and annual precipitation (c, d) as simulated by CCSM3 and prescribed to LPX-Bern(v1.4N) for the glacial termination (a, c) and the Holocene (b, d).
Changes in temperature over the termination caused emissions to rise substantially in Eurasia, in the conterminous USA as well as in Argentina and southern Brazil and in eastern Australia (Fig. 8a). On the other hand, regional cooling in parts of the Amazon region and in parts of Africa and India caused emissions to fall in this period. The pattern of change in N2O emissions attributed to changes in temperature (Fig. 8b) is very different for the Holocene compared to the termination. The summer (June, July, August) cooling also found in climate data (Wanner et al., 2008) and simulated over the Holocene period in boreal Eurasia and the western part of North America results in a decrease in N2O emissions over large parts of Eurasia and North America. The slight summer warming in eastern Canada and Scandinavia in the model has little impact on simulated emissions. An increase in terrestrial emissions is simulated in tropical Africa and Latin America, including the Amazon region, in response to changing temperatures.
The attribution of emissions to changes in precipitation (Fig. 8c, d) reveals some well-expressed dipole patterns, partly indicative of spatial shifts in precipitation regions (Fig. 9c). Attributed emission changes reflect corresponding changes in precipitation with generally increasing emissions under increasing precipitation. Increasing CO2 exerts a generally positive influence on simulated emissions in tropical regions, except in semi-arid regions including eastern Africa and Brazil, which dominate the globally integrated signal (Fig. 8e, f). Non-linear interactions between the three drivers can be significant regionally and either enhance or reduce simulated emission changes (Fig. 8g, h). The temperature-attributed decrease in emissions over the termination at around 15 to 20∘ S in Africa (Fig. 8a) is not linked to a corresponding change in seasonal or annual temperatures. This particular attribution as well as the attribution of negative emission changes to increasing CO2 in this region (Fig. 8e, f) most likely reflect non-linear interactions between precipitation, temperature, and CO2.
Figure 10 further illustrates which driver exerts the largest influence on simulated regional emission changes in a given grid cell. Over the termination, changing temperature is the dominant influence on the simulated emission changes in mid- and high-latitude Eurasia and North America, while changes in precipitation dominate emission changes south of the Sahara and in India and large parts of Australia, where temperatures were already rather high. Over the Holocene, temperature is the dominant driver in northern Eurasia, while changes in precipitation dominate the emission response in Africa. Changes in CO2 generally play a secondary role.
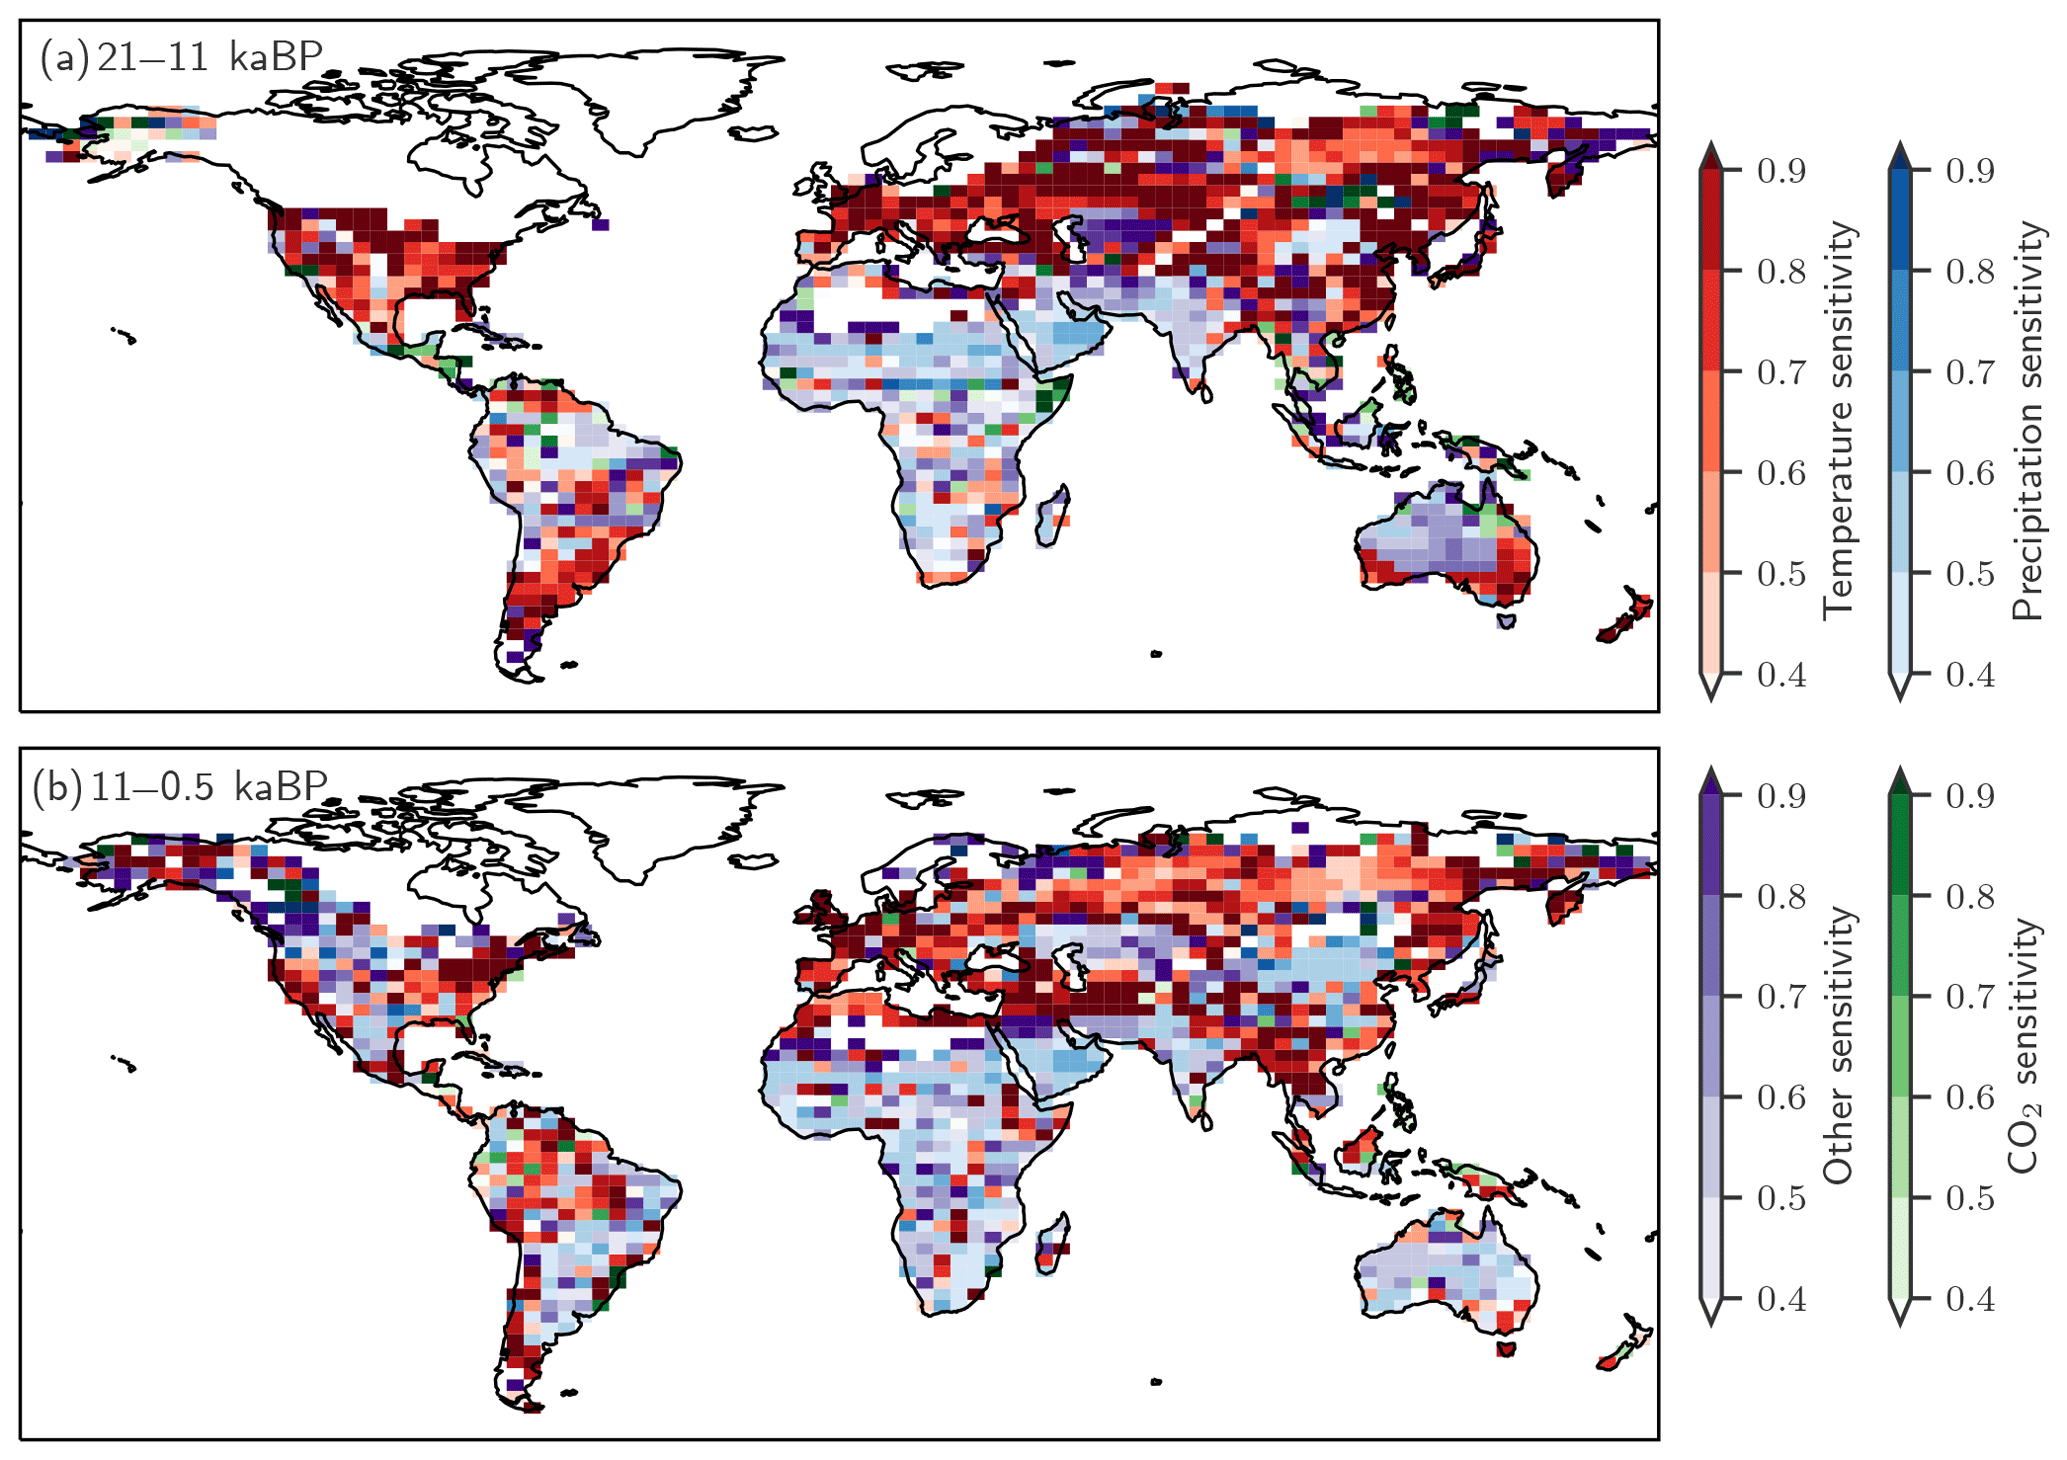
Figure 10The dominant drivers for changes in terrestrial N2O emissions over (a) the glacial termination and (b) the Holocene are temperature (red), precipitation (blue), CO2 (green), and other non-linear effects in LPX-Bern(v1.4N) on these driver combinations (violet). The colour shading indicates the fraction of the total emission change attributed to the dominant driver typically explaining between 40 % and 90 %. Areas with minimal changes are masked.
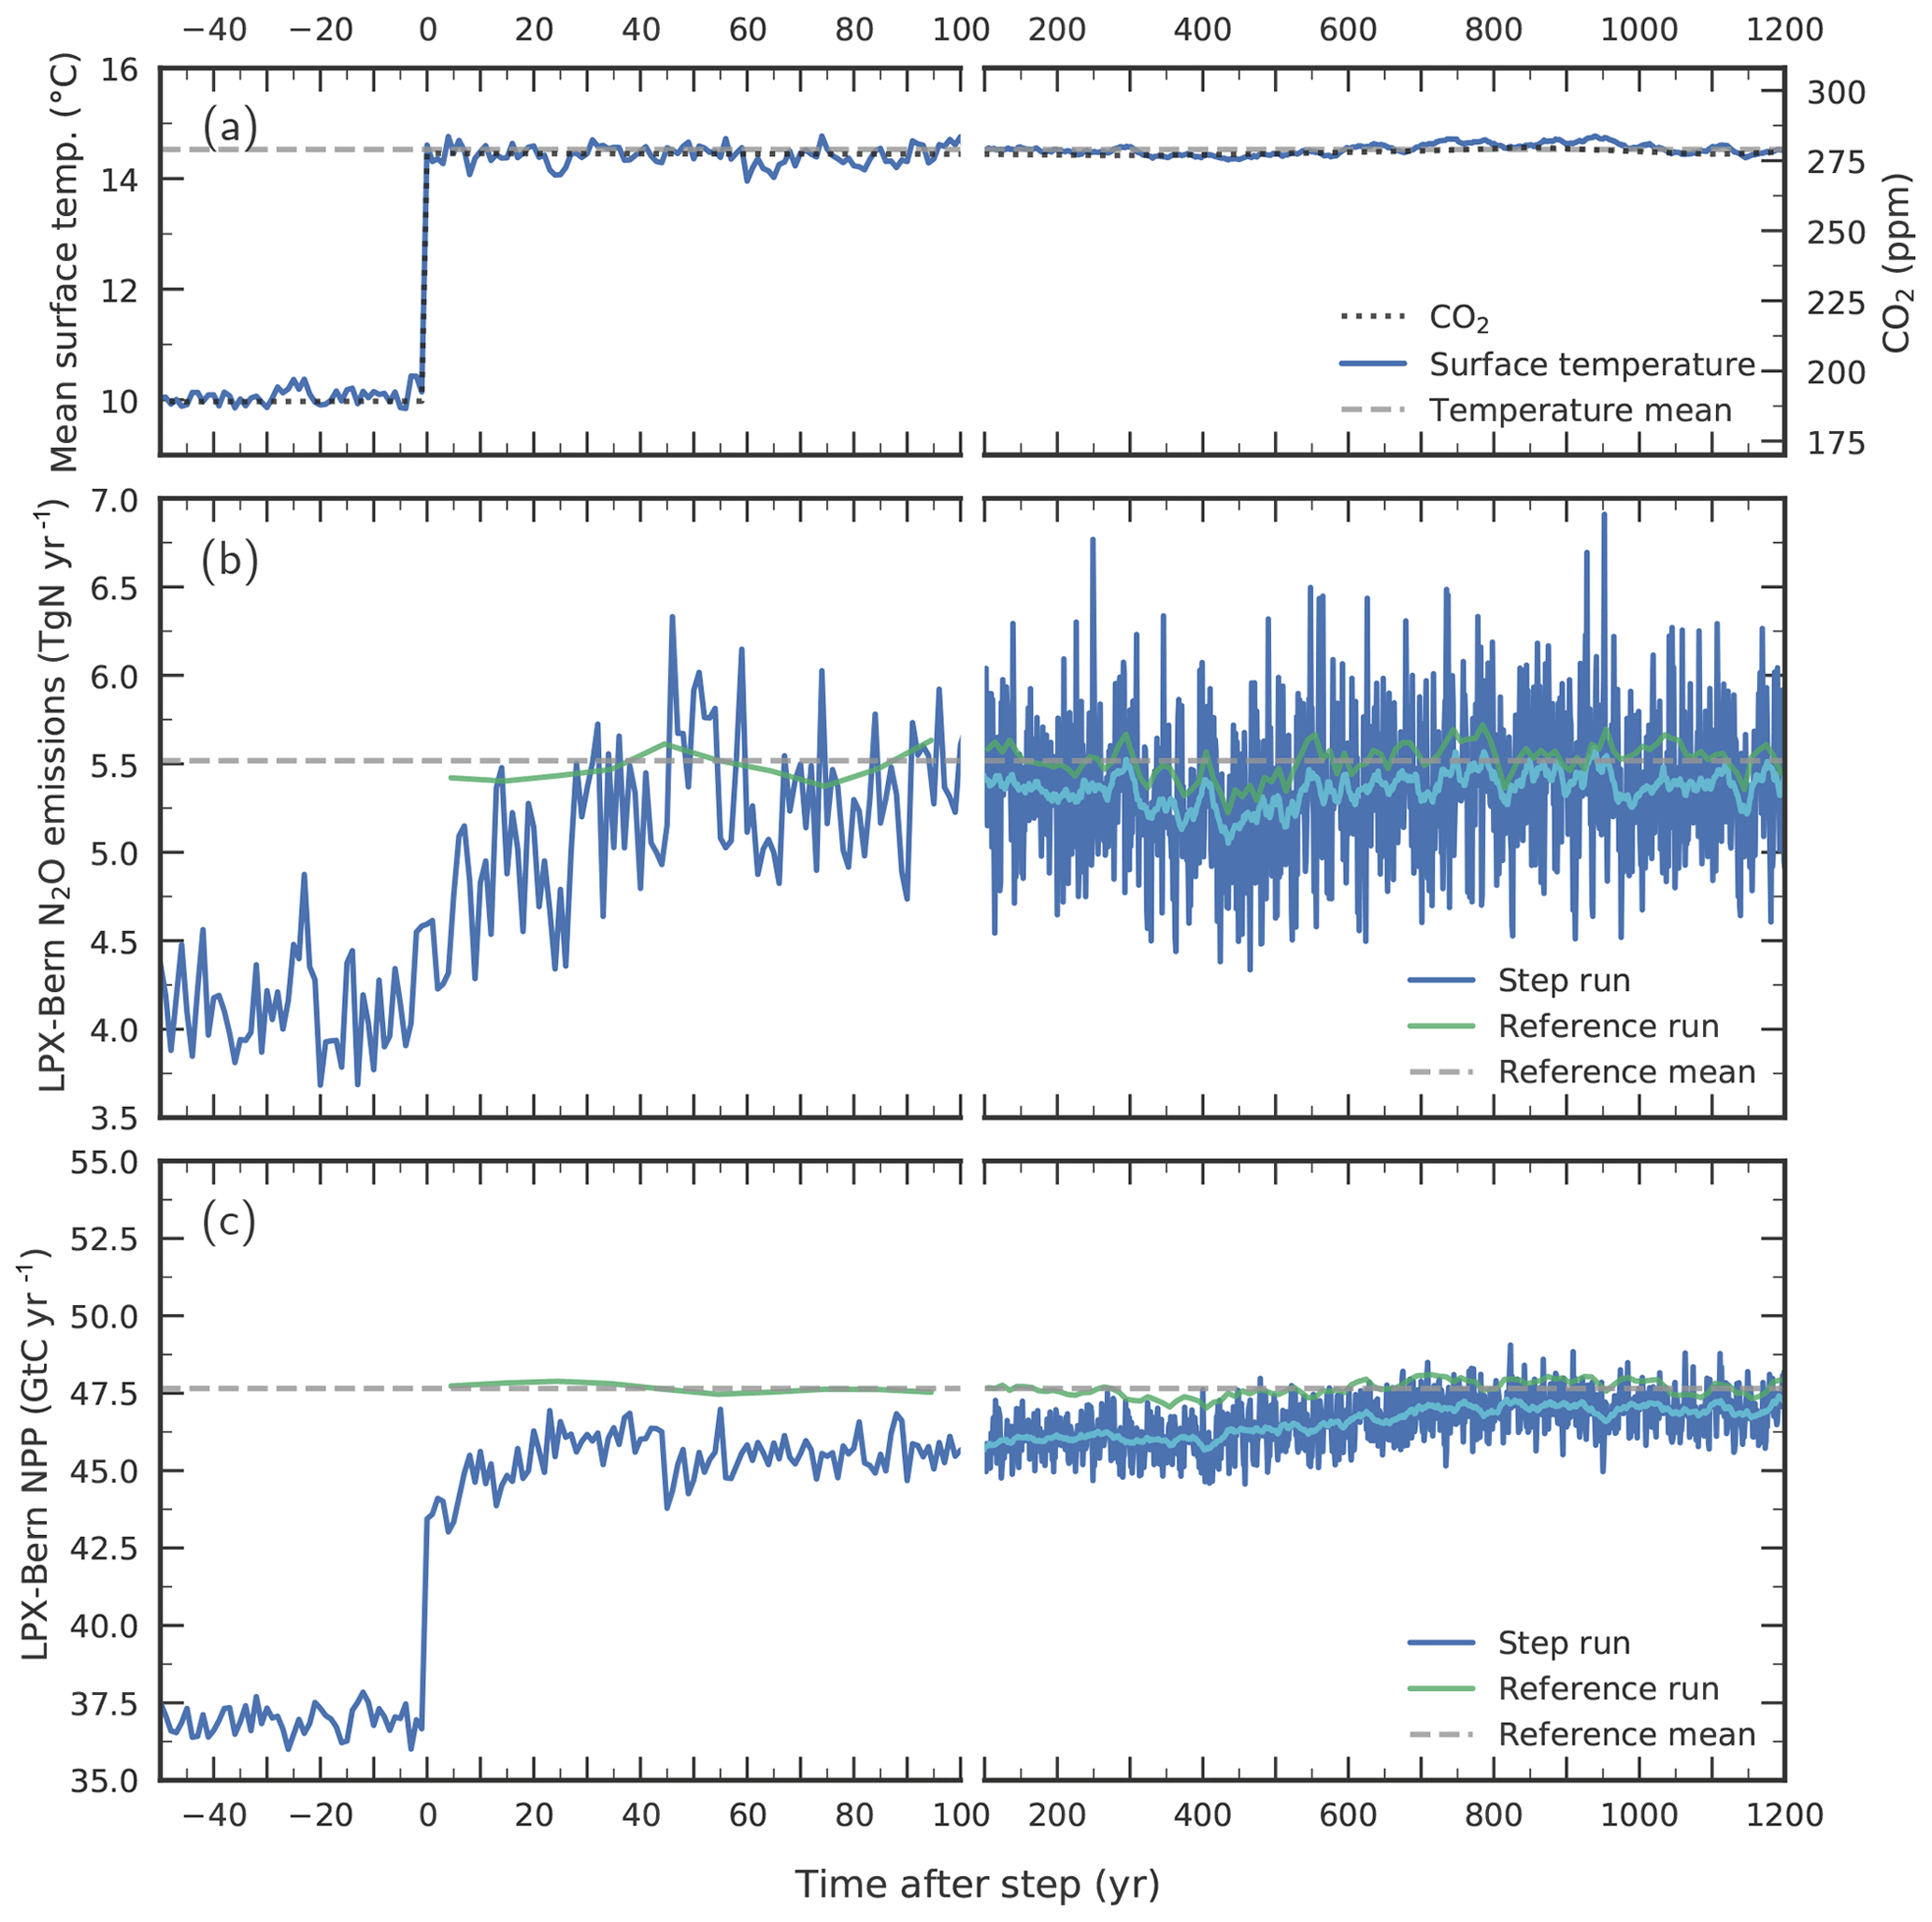
Figure 11Response to a step-like change in (a) environmental conditions for globally averaged terrestrial (b) N2O emissions and (c) NPP. Atmospheric CO2 (dotted line in a) and climate are prescribed to suddenly change from Last Glacial Maximum conditions to late Holocene conditions in a sensitivity simulation with LPX-Bern(v1.4N) (“step run”, blue lines). Annual values for the step run are shown in dark blue and smoothed (31-year average) values in light blue for the step run and in dark green for a corresponding reference run. The dashed horizontal lines represent averages from the reference run over the model period 0 to 1200 years. Surface air temperature in (a) represents the average over the model's land area. Note the change in the time-axis scaling at year 100.
5.4 The timescales of response to a step change in climate and CO2
Next, we investigate potential causes of the relatively slow N2O increase during past abrupt NH warming events in the standard simulation compared to the ice-core reconstruction. To this end, we assess on which timescales N2O emissions adjust in LPX-Bern after a sudden change in environmental conditions. The question is whether LPX-Bern can simulate an equally fast response in N2O emissions as reconstructed from the ice-core data for the abrupt warming events at the onset of the B/A and the end of the YD or whether the intrinsic response timescales of the model are too long to match reconstructed emissions. We construct an extreme case for rapid warming events by switching climate (and CO2) instantaneously, step-like from LGM to late Holocene conditions in LPX-Bern (Fig. 11a).
LPX-Bern shows a fast response, followed by a relatively small century-scale adjustment (Fig. 11). About 80 % of the final response in global N2O emissions to the step change is realized within 40 years and about 90 % within a century, while it takes about 700 years to reach a near equilibrium (Fig. 11b). Taking the atmospheric lifetime of N2O of more than 100 years into account, such a fast multi-decadal increase in N2O emissions, would cause a century-scale increase in atmospheric N2O concentrations, similar to what is seen in the ice-core record. The adjustments in global nitrification and denitrification fluxes evolve similarly to those for N2O emissions, with the main increase in these fluxes again realized within about 40 years (not shown). The global N source peaks 20 years after the step (not shown). Then, it decreases again to reach a new steady-state value, which is about 20 % higher than before the step. In contrast, the model's global N–leaching flux decreases within about a decade (by about 20 % relative to LGM) after the step, followed by a slight increasing trend over the next 1500 years. This transient evolution in modelled N leakage is indicative of a corresponding evolution of soil availability. Modelled global NPP (Fig. 11c) increases immediately after the step, and about three-quarters of the NPP change are realized in the first year after the step. Then it takes again about 700 years to reach the new equilibrium. The fast initial response is explained as follows. NPP responds immediately to the change in environmental conditions. The associated enhanced plant N uptake depletes soil , leading to the decrease in N leakage, while warming accelerates soil decomposition and the release of . The newly assimilated C and N are allocated to leaves, sapwood and hardwood, and roots, before being released to litter and labile soil organic matter overturning on timescales from years to decades. These annual-to-decadal vegetation and litter turnover timescales govern the initial response time of N source, nitrification, denitrification, and N2O emissions. The century-scale response is linked to the equilibration timescales of C and N in the slowly overturning soil pools as well as to the poleward expansion of vegetation. Finally, there is a small remaining offset between the reference run and the near equilibrium of the step simulation which is linked to remaining peat in the step simulation formed under LGM conditions but is absent in the reference simulation.
In conclusion, this sensitivity experiment demonstrates that N2O emissions in the LPX-Bern model are indeed able to adjust within decades to less than a century to abrupt warming events, if prescribed forcing is changing quickly enough. We conclude that the exact timing of simulated N2O emissions at the onset of the B/A and the end of the YD depends sensitively on the climate forcing data prescribed in the LPX-Bern model.
6.1 Reconstructed terrestrial N2O emissions and implications for the C–N cycle
Terrestrial N2O emissions show a 40 % increase from the Last Glacial Maximum to the late preindustrial period (Fischer et al., 2019). Most of the deglacial increase was realized in two large steps, linked to rapid, decadal-scale, and widespread Northern Hemisphere warming and to shifts in the Intertropical Convergence Zone (ITCZ) and precipitation patterns. Each step was realized within a maximum of 200 years and thus on a timescale similar to that of the ongoing anthropogenic climate perturbation.
It has remained somewhat unclear whether warming will increase or reduce regional- to global-scale N2O emissions, as responses to warming treatment are found to be highly variable across a range of conditions and ecosystems (Dijkstra et al., 2012). The ice-core record shows that past warming events, such as those at the onset of the B/A and the end of the YD, strongly promoted N2O emissions globally. This suggests, as noted earlier (Schilt et al., 2014) and as projected (Stocker et al., 2013), that terrestrial N2O emissions from natural land will likely increase further as climate warms, implying the existence of a positive climate feedback linked to the terrestrial N cycle (Xu-Ri et al., 2012).
The increasing terrestrial N2O emissions imply either an increase in N2O yield per unit N converted, averaged globally and across all N2O production pathways, an increase in the global flux of converted N, or a combination of these factors. Regarding yield, uncertainties in the interpretation of the terrestrial N2O emission record are linked to uncertainties in the ratio between N2O produced to N converted. This yield factor is known to vary with environmental conditions and across N2O production pathways, though quantitative experimental evidence is often not unequivocal (Diem et al., 2017; Davidson et al., 2000; Firestone and Davidson, 1989; Saggar et al., 2013; Butterbach-Bahl et al., 2002). For nitrification, the ratio of N2O/ produced increases with increasing acidity and decreasing oxygen (Firestone and Davidson, 1989) and increasing temperature (Smith, 1997). For denitrification, the production ratio of N2O∕N2 yield increases with increasing availability, increasing oxygen concentration, decreasing decomposable carbon, and decreasing pH. Changes in precipitation may have altered the N2O yield over the deglaciation. Higher soil water content and associated anoxic conditions generally favour the conversion of N2O to N2 and result in a low yield of N2O (Weier et al., 1993), though dependencies of yield on water-filled pore space are sometimes complex (Diem et al., 2017) and soil texture and drainage affect water-filled pore space and yield (Bouwman et al., 2002). Yield is low under low availability (Diem et al., 2017) and generally found to increase when becomes more available (Weier et al., 1993). This relation, when considered in isolation, implies increasing N2O emissions to be indicative of increasing availability. The ratio of N2O to N2 emitted has been thought to decrease with increasing temperature (Firestone and Davidson, 1989). However, the observational challenges to determine N2O and N2 emissions are substantial, and available results are equivocal. Butterbach-Bahl et al. (2002), analysing results for a series of soil cores at spruce and beech sites in Germany, find it difficult to derive a general trend in the effect of temperature on the ratio of N2O and N2 produced via denitrification. Phillips et al. (2015) show for New Zealand pasture soil samples that denitrified N shifts towards N2O with increasing temperature under anaerobic conditions. The warming over the glacial termination is also expected to accelerate organic matter turnover and thus availability of decomposable C, which would tend to lower this ratio (Firestone and Davidson, 1989). Further, experimental studies on grasslands yield both higher and lower ratios of N2 to N2O under elevated CO2 compared to ambient CO2 (Zhong et al., 2018; Baggs et al., 2003). In addition, different N2O production pathways and their relative importance may evolve through time, and changes in soil organic matter decomposition pathways and in the stoichiometry of plant-derived material may affect yield. Given this complexity, we are not in a position to evaluate whether the N2O yield factor for the combined N conversion processes increased or decreased over the deglaciation on the global scale. Changes in globally averaged yield may possibly explain the reconstructed terrestrial N2O emission increase.
Regarding the flow of reactive N, the reactive N lost from ecosystems must be replaced if ecosystem N pools are not to be depleted. This mass balance consideration suggests that the total input flux of N changed hand in hand with related loss fluxes over the deglacial period and sufficiently to support changes in ecosystem N storage. An alternative to a balanced N input, N storage change, and output flux would be that N losses are fueled by existing reservoirs of reactive N. Large nitrate deposits (“caliche”) are currently found in the hyperarid Atacama desert (Ericksen, 1981; Tapia et al., 2018). But such large deposits are very unusual and require several hundred thousand years to accumulate (Michalski et al., 2004). Microorganisms require readily decomposable carbon substrate for the denitrification of nitrate; otherwise, nitrate may accumulate in the absence of substrate availability (Weier et al., 1993). Carbon substrate availability for denitrifiers might have increased at the onset of the B/A and at the end of the YD when climate warmed, precipitation patterns shifted, and organic matter remineralization accelerated in many regions. This in turn could have led to the conversion of nitrate that had potentially accumulated previously. This would lead to a depletion of this nitrate pool and, in turn, one would expect a decrease in N2O emissions. Such a scenario appears in conflict with the reconstruction, given that reconstructed N2O emissions remained high during the early B/A and even slightly increased throughout the Holocene.
Terrestrial N2O emissions result primarily from nitrification and denitrification (Firestone and Davidson, 1989). A requirement for these processes to take place is the availability of ammonium and nitrate, as consumed by nitrifiers, denitrifiers, and plants alike. Variations in reactive N availability among diverse land classes are found to correspond to variations in N2O emissions (Davidson et al., 2000). In addition, cryptogamic covers fix large amounts of N and contribute substantially to global N2O emissions (Elbert et al., 2012). The ice-core data show that reactive N must have been available in sufficient quantities to support increasing terrestrial N2O production over the deglacial period. Sources of reactive N on land, e.g. from BNF and weathering, may possibly have increased under warming climate and increasing CO2 over the deglacial period and contributed to meet the N demand of plants, nitrifiers, denitrifiers, and cryptogamic covers under more favourable growth conditions. At the same time, the ice-core reconstructions do not suggest that reactive N for the production of N2O remained scarce and that marine emissions dominated past atmospheric N2O variations. The magnitude of possible adjustments in the N source is unclear. Wang and Houlton (2009) modelled an increase in N fixation under increasing CO2 and temperature. However, their modelled increase in BNF was too small to meet projected N demand in global warming scenarios; the authors therefore proposed to downscale future C uptake in the warming projections of C4MIP models. However, this conclusion is based on an assumed optimum temperature for BNF of around 25 ∘C, an assumption that has been challenged by Liao et al. (2017), who found the abundance of N-fixing trees to increase monotonically with temperature by analysing more than 125 000 forest plots in the USA and Mexico. More work is needed to improve projections of BNF under past and future environmental change, considering also the cost of BNF (Shi et al., 2018) and relying on data-based and model approaches (Fisher et al., 2012). Similarly, it remains unclear how other smaller sources of reactive N changed over the deglacial period and influenced N2O emissions.
The ice-core data and emission estimates represent global values with century-scale resolution. They do not permit us to discriminate regional variations or interannual to decadal changes. In particular, N limitation is considered to be common in high-latitude regions. But this does not exclude a decadal- to century-scale increase in N sources under changing environmental conditions. Sufficient N and other nutrients were available to support the northward expansion of boreal forest during the deglaciation. Indeed, it has been hypothesized that an increase in BNF may become cost-effective under more severe N limitation at mid and high latitudes (Menge et al., 2017). Field data support a role of BNF in supporting forest growth, in particular for early successional forests. Experimental evidence comes from chronosequence studies in the Amazon region and in Panama (Batterman et al., 2013; Gehring et al., 2005), from forest clay and sand box studies in Brazil and in the USA (Davidson et al., 2018; Bormann et al., 2002), as well as from forest inventory data covering tropical-to-temperate climatic conditions (Liao et al., 2017). Regional changes may have contributed to the deglacial N2O emission increase.
6.2 Simulating deglacial terrestrial N2O emission changes with LPX-Bern
We applied the LPX-Bern dynamic global vegetation model to investigate regional N2O emissions patterns, governing mechanisms, and C–N coupling in simulations over the past 21 000 years. The model represents the cycling of N and C in soils and plants in a simplified way. C and N are stored in PFT-specific plant and litter pools and a fast and a slow overturning soil pool in each grid cell. This chain of pools represents a spectrum of overturning timescales on each grid cell. LPX-Bern, being a spatially explicit model, reacts differently in different regions to changes in climatic and environmental drivers (Figs. 4, 8). However, microbial and fungal biomasses are – unlike in microbial-explicit models (Schimel and Weintraub, 2003; Zhu et al., 2017; Allison and Gessner, 2012) – not explicitly modelled, and organic matter decomposition does not depend on microbial mass and physiology. Instead, a mass balance approach is applied with C:N stoichiometry prescribed at observation-based PFT-dependent values for litter and soils. A constant fraction of remineralized N is returned immediately to its source soil pool and the N budget is closed by the implied N source flux (Fig. 1). There is also no distinction between different classes of organic matter according to their accessibility to microbial action (Averill and Waring, 2018). Potential N2O release by lichens and bryophytes is also not modelled (Porada et al., 2017). Only net N2O production during denitrification is considered, while gross production and consumption of N2O during denitrification (Schmid et al., 2001b) are not explicitly modelled. In future work, N2O may be treated as an intermediate product of denitrification to explicitly simulate N2O consumption as well as the related ratio of N2O to N2 emissions, i.e. the yield factor. In LPX-Bern v1.4N, the yield factor varies as a function of temperature for nitrification and denitrification, whereas dependencies of the yield on availability, oxygen status, decomposable carbon, or pH are not considered (see the discussion in the previous section).
Uncertainties in modelled N2O emissions are also associated with uncertainties in the representation of N sources and N loss processes. The N source and its changes in LPX are implied by maintaining the soil C:N ratio at observed PFT-dependent values. This N source thereby accounts for any other source, except explicitly prescribed N deposition (Fig. 1). Carbon costs of N acquisition are not directly considered. However, a fraction of 6 % of NPP is directly transferred to a pool with a short overturning time to represent root exudates. The largest contribution by far to the implied N source is thought to come from BNF.
Different approaches to represent BNF are used in different models, and their effects on modelled BNF, NPP, carbon stocks, and N2O emissions are compared in recent studies for modern conditions and future projections (Meyerholt et al., 2016; Wieder et al., 2015a). The simplest approach is a prescribed static map of BNF (Zaehle and Friend, 2010). Most frequently, empirical models are used, describing BNF as a linear function of evapotranspiration (Cleveland et al., 1999) or as an exponential function of NPP (Thornton et al., 2007). More process-oriented models heuristically account for the dependency of symbiotic BNF on N demand by vegetation, soil N status, and light limitations in extra-tropical regions (Gerber et al., 2010) or on the optimization of plant C investment in resource acquisition (Fisher et al., 2010). Meyerholt et al. (2016) describe asymbiotic BNF as a function of temperature, shading, and soil moisture.
The implementation of such different parameterizations in LPX-Bern would likely lead to different estimates for deglacial changes in BNF and N2O emissions. We may expect that prescribing a constant modern BNF field would lead to approximately constant fluxes for nitrification, denitrification, and leaching. In turn, deglacial changes in N2O emissions would only be due to changes in yield factors and be smaller than modelled in our standard simulation and smaller than reconstructed. A similar result is expected for BNF depending on evapotranspiration, because globally averaged evapotranspiration changes little over the deglaciation in our standard simulation (Table A1) and global BNF would remain at its modern value. In contrast, some parameterizations would likely yield similar or larger responses than simulated here. A strong increase in BNF is found in global warming simulations for the N demand (Meyerholt et al., 2016) and the NPP-based (Wieder et al., 2015a) BNF parameterizations. In this latter parameterization, BNF responds immediately to NPP and grows exponentially with NPP, whereas the deglacial increase in BNF of 11 % is smaller than in NPP (13 %) in our standard run (Table A1). Overall, one might expect a similar or even larger increase in BNF and N2O emissions over the deglaciation when replacing our implicit N source approach with a demand, NPP, or cost-driven BNF parameterization. However, a corresponding quantitative analysis is beyond the scope of this study and is left to future efforts.
The N loss in LPX is predominantly driven by local gaseous loss from denitrification, with a much smaller role for fire, leaching, minor contributions from volatilization of NH3, and gas release during nitrification (Fig. 1). Denitrification and nitrification are thought to occur at anaerobic and aerobic microsites in the soil, which are challenging to represent. In LPX-Bern the fraction of available for aerobic nitrification and of available for anaerobic denitrification within a grid cell is assumed to scale linearly with water-filled pore space in the top 50 cm (Xu-Ri and Prentice, 2008). Meyerholt and Zaehle (2018) investigated different algorithms for N loss processes and find variable responses in N loss and in the partitioning of N losses between gaseous and leaching losses under elevated CO2.
LPX-Bern was applied in an earlier study to simulate climate–N2O feedbacks under global warming (Stocker et al., 2013), and results for global emissions for the period from 16 to 10 ka are presented in Schilt et al. (2014). Recently, model parameters were updated using a set of modern observational constraints in a Bayesian approach (version v1.4) (Lienert and Joos, 2018a) and here further modified towards a lower N source (version v1.4N) by adjusting the fraction of N remineralized that is returned to the soil pool. Except for the matching of preindustrial N2O emission estimates, the model has not been tuned in any way towards matching the ice-core reconstruction. These updated versions also account for the uptake of mineral N by N immobilization in soils. Results in terms of deglacial N2O emission changes are similar between these different versions. Changes in parameter values and selected globally averaged model results for version v1.4 versus v1.4N are documented in Appendix Table A1. Appendix Figs. A1 and A2 show the spatial patterns for the implied N source, soil mineral N, NPP, total carbon, and their changes over the deglaciation. The most striking difference is that the implied N source is a factor of 4 higher in v1.4 compared to v1.4N. Nevertheless, results for deglacial N2O emission changes remain similar between versions v1.4 (change 1.13 Tg N yr−1) and v1.4N (0.96 Tg N yr−1). The reason is that the relative, percentage changes in the N source flux and in N loss fluxes are similar between the two versions; however, the N2O yield factors are calibrated in both versions to the same preindustrial N2O emissions of 5.9 Tg N yr−1. The lower N source leads, however, to smaller mineral N concentration. In turn, N limitation of NPP is larger and, hence, NPP and carbon storage are smaller, both in steady state and for deglacial change, in v1.4N than in v1.4.
LPX-Bern forced by TraCE-21ka output simulates a deglacial increase in N2O emission but underestimates the reconstructed increase by about 50 %. This may be related to the model's C cycle and/or to the model formulation for denitrification and other shortcomings discussed above. LPX-Bern is known for a relatively low sensitivity to increasing CO2 and simulates a modest increase in NPP and the terrestrial carbon sink over the industrial period (Lienert and Joos, 2018a). A larger deglacial increase in NPP would tend to increase the implied N source in the model and potentially increase nitrification, denitrification, and N2O emissions. Further, denitrification processes are assumed to respond to the relevant substrate concentration following Michaelis–Menten kinetics (Xu-Ri and Prentice, 2008). This limits N conversion rates and N2O production at high substrate concentrations, whereas a recent synthesis of N fertilization experiments (Niu et al., 2016) points towards an exponential relationship between N load and N2O emissions. Regarding the timescales of response, results of a sensitivity simulation demonstrate that LPX-Bern is able to represent abrupt, multi-decadal-scale change in global terrestrial N2O emissions as reconstructed for past rapid warming events. Further, factorial simulations demonstrate a complex interplay of different driving factors for deglacial N2O emissions with considerable synergistic or antagonistic interactions related to changes in temperature, precipitation, and CO2. Remarkably, about a third of the simulated global increase in terrestrial N2O emissions over the past 21 000 years was counteracted by land loss due to flooding of previously exposed shelf regions.
LPX-Bern simulates a slight decrease in N2O emissions over the Holocene period, whereas the reconstruction shows an increase by about 0.4 Tg N yr−1 over this period. The exact reason for this discrepancy between modelled and reconstructed change is unclear. The model results suggest that the global N2O emission change results from the difference of, in some regions, large positive minus, in other regions, large negative emission changes (Fig. 4c) and that these regional emission changes depend sensitively on regional changes in precipitation and temperature (Fig. 8). Thus, it may remain somewhat challenging to simulate the balance between positive and negative emission changes correctly, given uncertainties in land models and the climatic drivers as well as in the deconvolution of the ice-core concentration and isotope data.
We applied LPX-Bern to analyse the consequences of alternative C–N cycle hypotheses. In the model's standard setup, the N cycle responds dynamically to changes in environmental conditions; the N source increases under increasing ecosystem N demand. This additional N source contributed to meet the rising N demand of plants simulated under more favourable growth conditions and resulted in a higher flow of N through land ecosystems and increased N2O production from terrestrial ecosystems as well as increased carbon storage on land. The increase in N2O emissions, linked to this increase in N source, is further amplified by an increase in the yield of N2O per N converted by nitrification and denitrification.
In an alternative deglacial simulation, the sources of reactive N were prescribed at the level simulated for the Last Glacial Maximum. In this case, the model yields a decrease in N2O emissions, in clear conflict with the ice-core data. The increase in N2O emissions attributable to the increase in the model's N2O yield factors for denitrification and nitrification under deglacial warming as well as the positive response of soil and litter turnover rates to increasing temperatures are not sufficient to offset the decrease in N2O emissions in this run with a constant N source. The simulated terrestrial C inventory decreased over the deglaciation in this simulation, again in conflict with data-based reconstructions (Lindgren et al., 2018; Jeltsch-Thömmes et al., 2019) that suggest a growing land biosphere carbon inventory as also predicted in the standard setup.
Within the current setup of LPX-Bern, acknowledging its limitations, a growing N source appears necessary to simulate increasing N2O emissions over the last deglaciation. It would be interesting to see whether other models incorporating the cycling of N and C (e.g. Zaehle et al., 2014; Averill and Waring, 2018; Thornton et al., 2007; Fisher et al., 2010) and N2O emissions (Zhu et al., 2016; Saikawa et al., 2013; Tian et al., 2015; Xu et al., 2017; Huang and Gerber, 2015; Zaehle and Friend, 2010; Olin et al., 2015; Goll et al., 2017) reveal similar or alternative mechanisms and whether these models are able to represent the reconstructed terrestrial N2O emissions over the past 21 000 years. Future research efforts are needed to test the robustness of our results and to further evaluate the potential role of alternative or complementary explanations. In particular, the significantly smaller amplitudes of our modelled N2O changes compared to the data reconstruction justify further research. The setup of our deglacial simulation could be used to compare and evaluate models, e.g. in the framework of the model intercomparison initiated by the Global Carbon Project (Tian et al., 2018).
Parts 1 (Fischer et al., 2019) and 2 of this study present three novel elements to gain insights into the functioning of the global carbon–nitrogen cycle: first, a record of the N2O isotopic history over the past 21 000 years, complementing the existing records over parts of the termination (Schilt et al., 2014); second, the first reconstructions of marine and terrestrial N2O emissions from the Last Glacial Maximum (LGM) to the preindustrial period as obtained by deconvolving the N2O and isotope ice-core records using a robust, established method; third, the application of a dynamic global vegetation model to simulate deglacial terrestrial N2O emissions and to attribute deglacial N2O emissions changes to different regions and governing processes. Our model results provide insight into the multi-decadal-to-millennial dynamics of the terrestrial C–N cycling by showing that the ice-core terrestrial N2O emission record could potentially be explained with a rapid adjustment of N cycling to the climate- and CO2-driven acceleration of the C cycle, but they do not exclude the possibility that alternative explanations linked to changes in N2O yield could be important.
The records provide the opportunity to evaluate models that simulate biological nitrogen fixation and nitrogen cycling (e.g. Meyerholt et al., 2016; Nevison et al., 2016; Thornton et al., 2007; Xu-Ri and Prentice, 2017; Wieder et al., 2015a) and feedbacks between climate change, land carbon, and terrestrial greenhouse gas emissions (Arneth et al., 2010; Stocker et al., 2013; Tian et al., 2018) for improved projections. Here, we evaluated LPX-Bern in transient simulations over the past 21 000 years. The model simulates an increase in N2O emission over the deglaciation but underestimates the magnitude of the deglacial increase in comparison with the ice-core data. This may add confidence in the sign of the climate–N2O feedback projected with this model for the next centuries (Stocker et al., 2013), while suggesting that the magnitude of the projected feedback may be underestimated. Model results for regional changes and specific processes and forcings await confirmation by other studies.
The ice-core data presented in part 1 reveal a highly dynamic terrestrial nitrogen cycle. Remarkably, substantial changes in global terrestrial N2O emissions were realized within maximum 200 years, and possibly faster, in response to past Northern Hemisphere warming events. Reconstructed N2O emissions changed by up to 1 Tg N yr−1 and within less than 2 centuries at the onset of the NH warming events around 14.6 and 11.7 ka. These timescales are relevant for 21st century climate projections and much longer than accessible in typical laboratory or field experiments. Taken at face value, these results suggest that the nitrogen cycle and N2O emissions will also adjust on the global scale in the coming centuries.
The ice-core data and the N2O emission reconstruction in combination with models provide a new window to integrate across systems and relevant timescales to improve our understanding of the coupled C–N cycle in the Earth system. The results may help to put emerging results from observational field and laboratory studies into the context of decadal- to century-scale environmental and climate change.
A few parameters of the nitrogen module of LPX-Bern are updated for this study compared to the previous version (v1.4) (Lienert and Joos, 2018a). These updated parameter values are set to obtain a preindustrial implied N source of 128 Tg N yr−1 and land biosphere N2O emissions of 5.9 Tg N yr−1. The difference in parameter values and in key model outcomes between version v1.4N, used here, and version (v1.4) are summarized in Table A1. The parameter frac_soil_immob governing the fraction of the C and N flux from gross soil organic matter remineralization which is transferred back to the soil organic matter pool is adjusted to a higher value. This yields a smaller simulated BNF and smaller simulated N loss fluxes in v1.4N compared to v1.4. In turn, the parameters governing the yield in N2O emissions per unit N converted by nitrification (RN2ON), denitrification (RN2ODN), and leaching (RN2ONL) are re-calibrated in order to get preindustrial N2O emissions from the land biosphere of 5.9 Tg N yr−1 as in v1.4 and as suggested by observational estimates. In v1.4, the yield factor from nitrification is assumed constant. In v1.4N the same temperature dependency as for the yield for denitrification is assumed. This is a relatively minor modification as nitrification contributes only 12 % to the modelled preindustrial N2O emissions. We note that corresponding results and figures for version v1.4 are given in the paper published in Biogeosciences Discussion (https://www.biogeosciences-discuss.net/bg-2019-118/, last access: 30 June 2020).
Table A1Differences between LPX-Bern version v1.4N used in this study and the previous version (v1.4). Model results represent global average values. Percentage changes are given in parentheses and are relative to preindustrial.
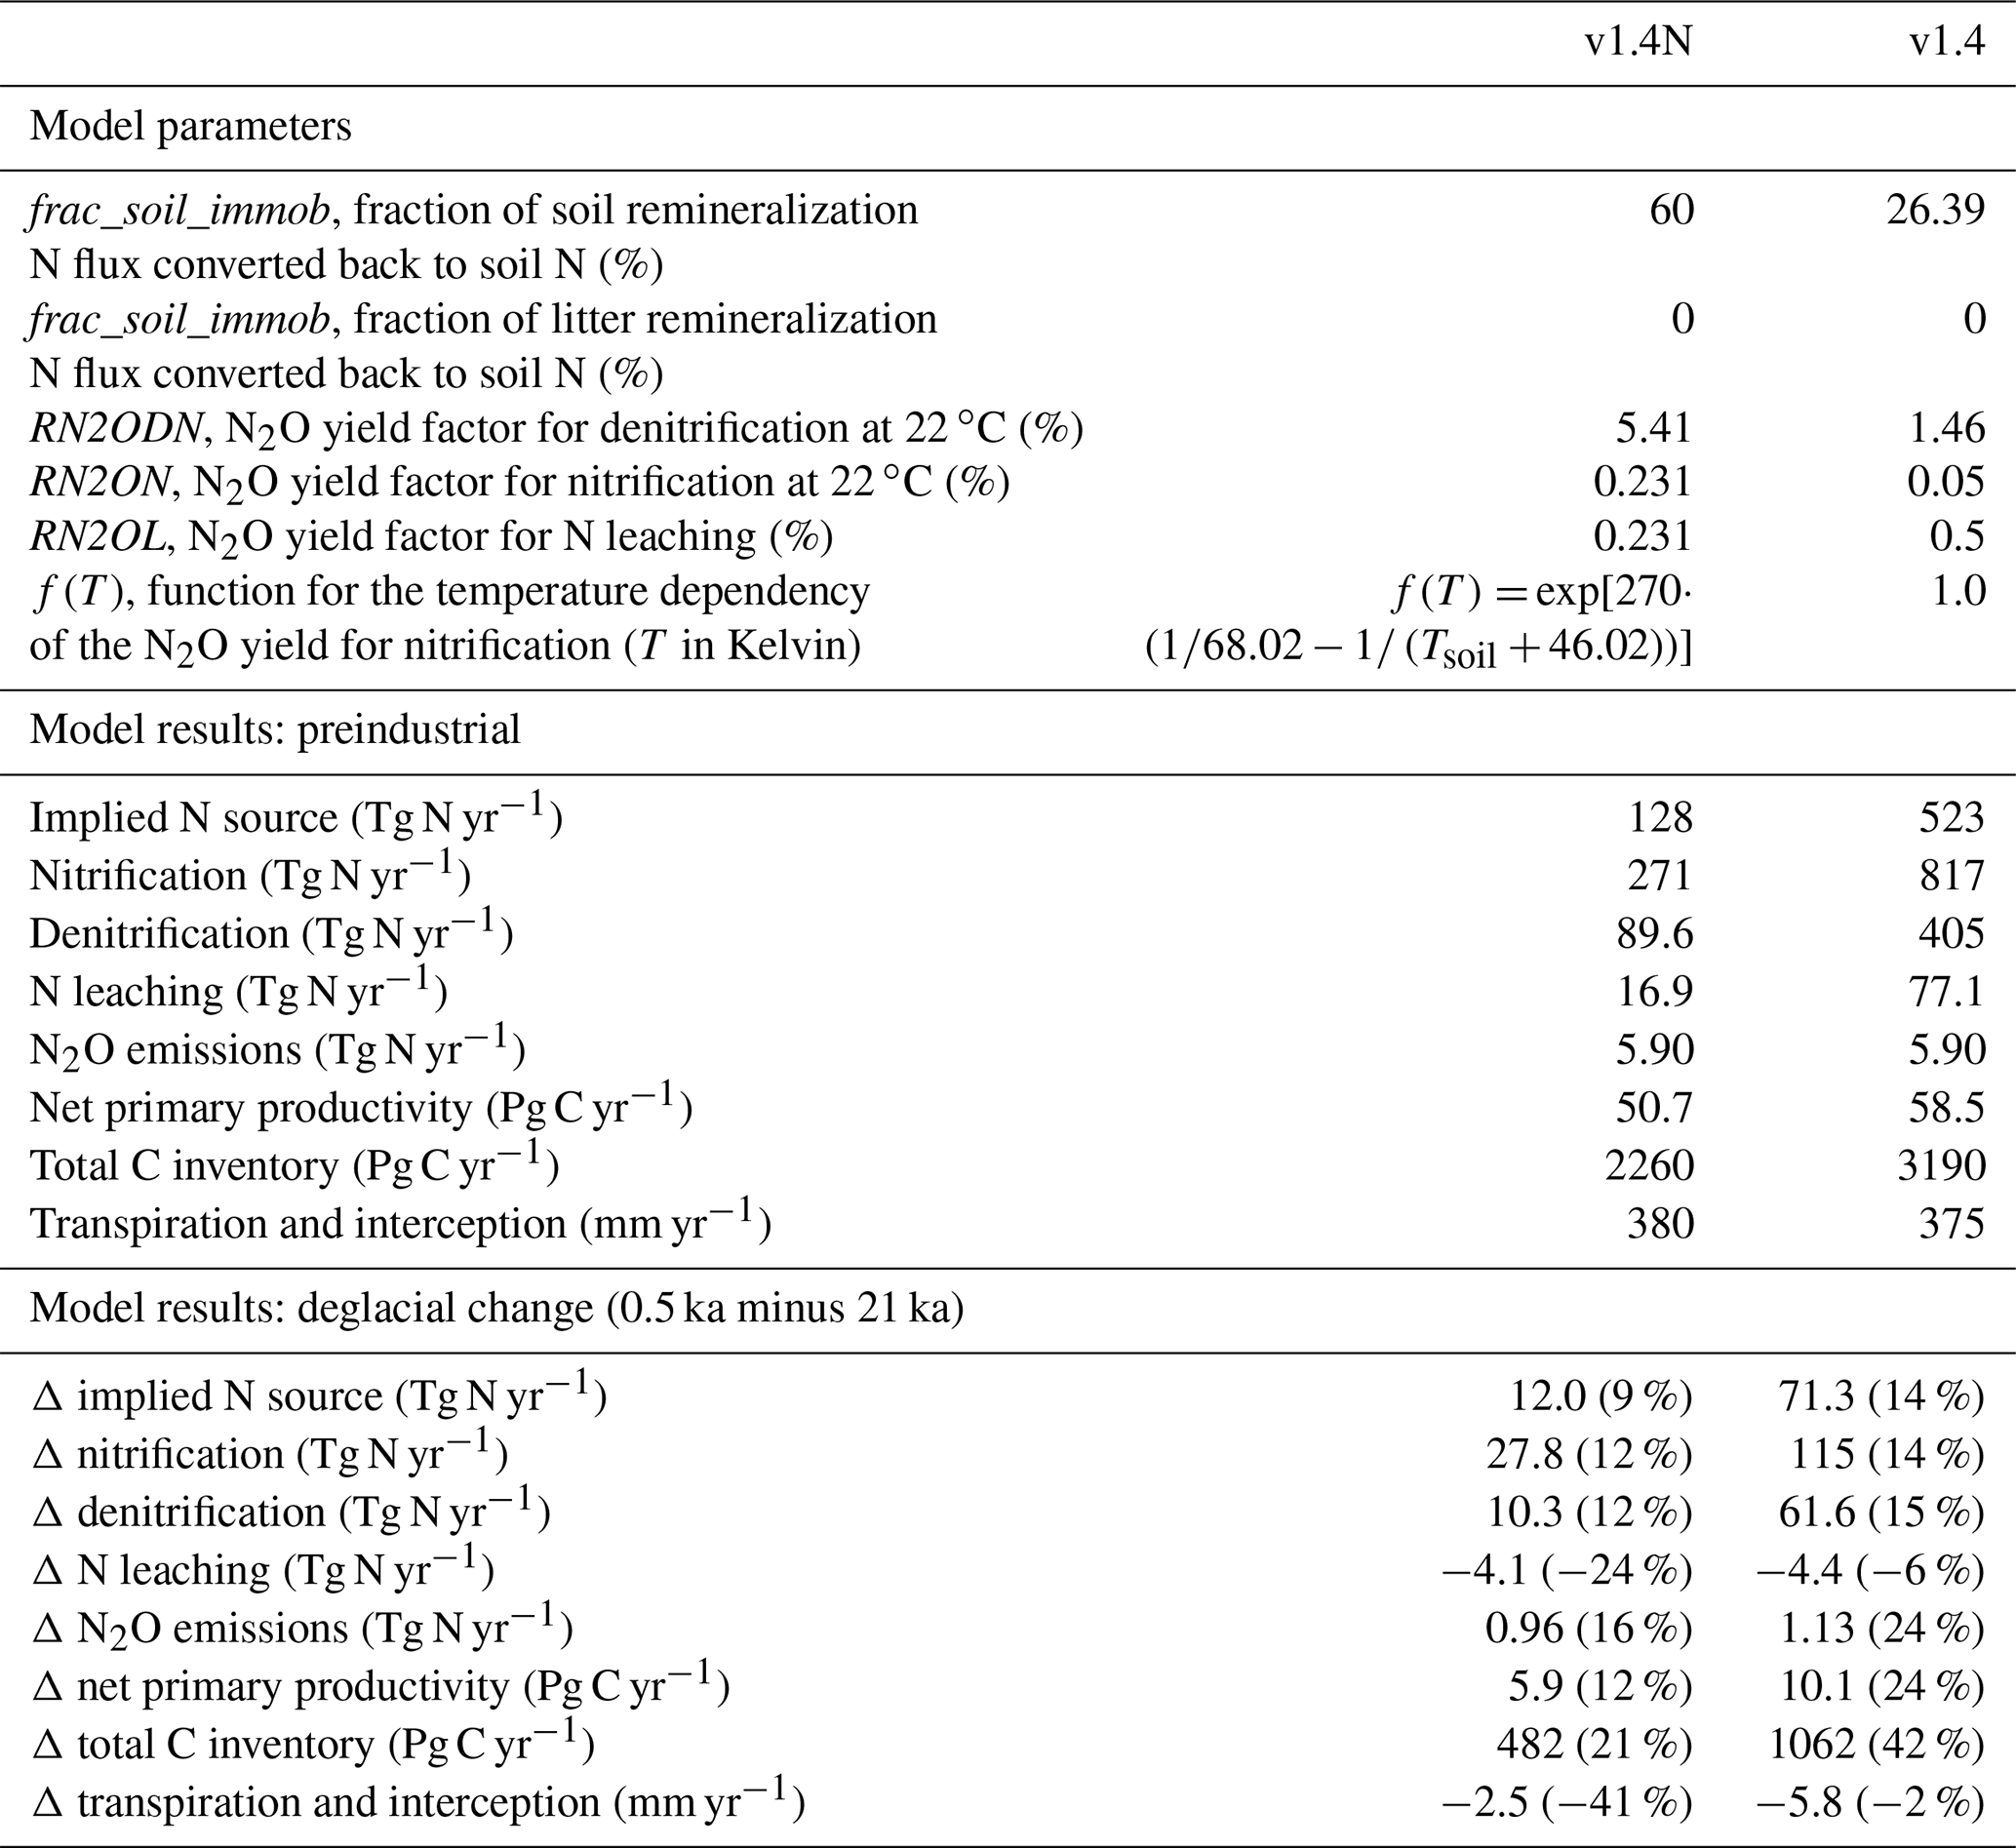

Figure A1Comparison of model version LPX-Bern v1.4N (left) versus version v1.4 (right) for the preindustrial (0.5 ka) patterns in the implied N source (a, b), bioavailable concentrations of ammonium and nitrate in soils (c, d), net primary productivity (e, f), and total carbon (g, h).
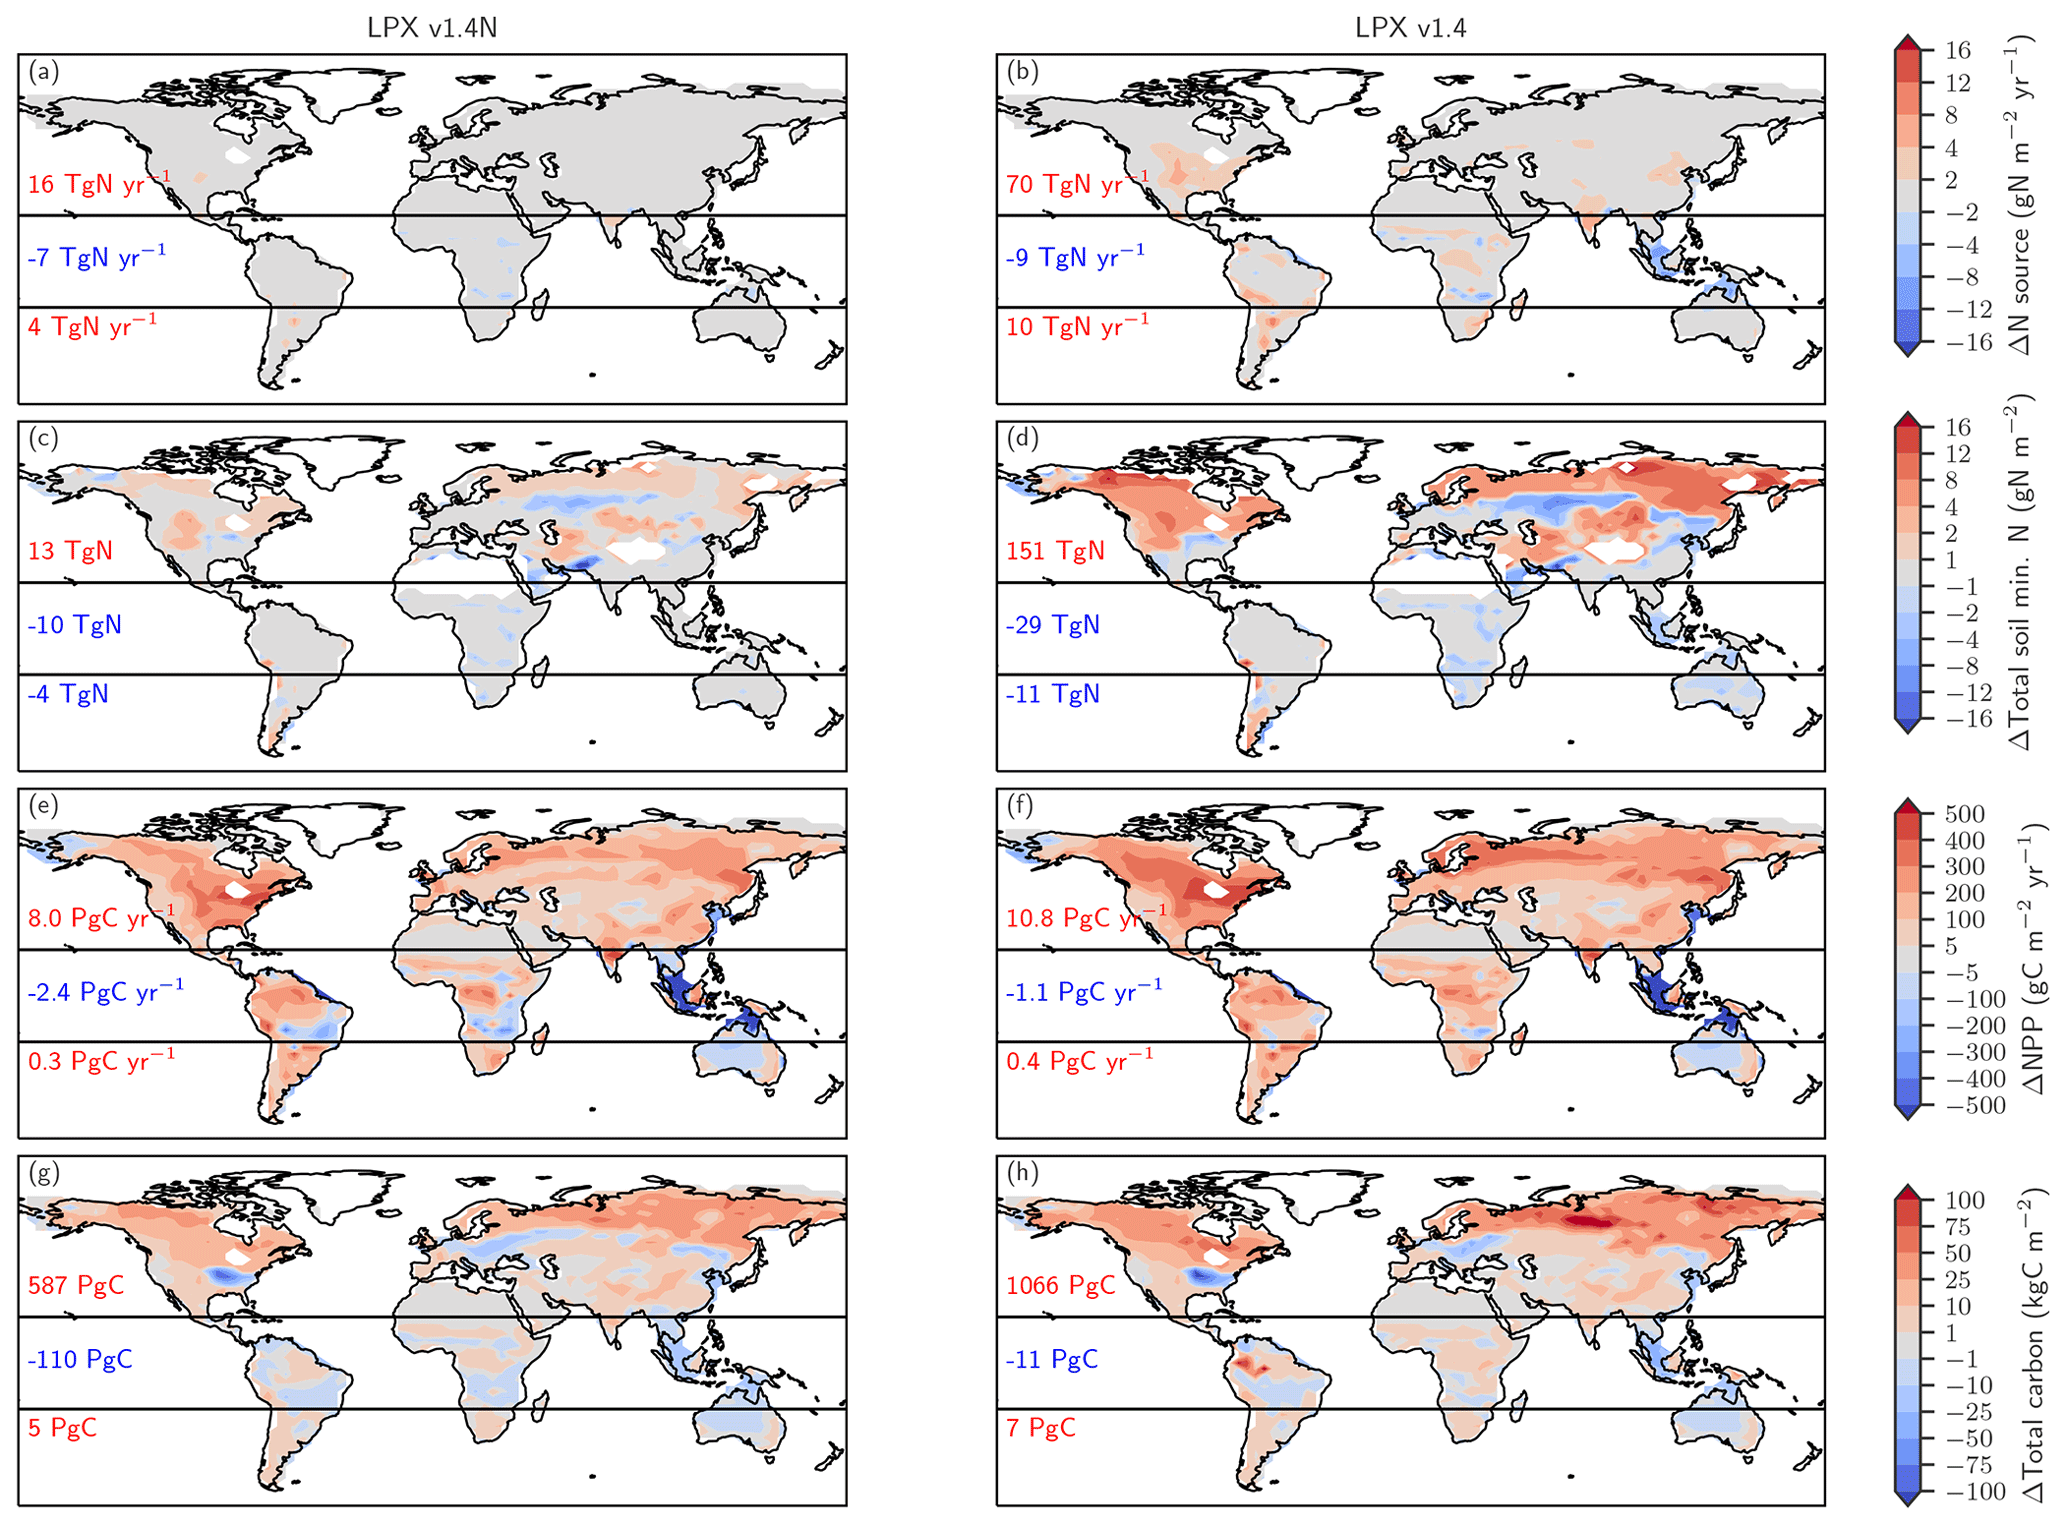
Figure A2Comparison of model version LPX-Bern v1.4N (left) versus version v1.4 (right) for simulated deglacial changes (0.5 ka minus 21 ka) in the implied N source (a, b), bioavailable concentrations of ammonium and nitrate in soils (c, d), net primary productivity (e, f), and total carbon (g, h).
The data presented in Figs. 3 and 7 are included in the Supplement. The ice core N2O and N2O isotope data are available in the NOAA paleoclimate database (https://www.ncdc.noaa.gov/paleo-search/study/28890; last access: 30 June 2020). Other data generated or analysed during this study can be made available upon request to the corresponding author, Fortunat Joos (joos@climate.unibe.ch).
The supplement related to this article is available online at: https://doi.org/10.5194/bg-17-3511-2020-supplement.
FJ, RS, and BDS designed the study. RS, SL, and JM performed the simulations with LPX-Bern. SL, JM, RS, and FJ prepared the figures. HF and JS provided the ice-core data and BOB and ZL climate data. All the authors contributed to the writing and preparation of the manuscript.
The authors declare that they have no conflict of interest.
We thank Giana Battaglia for helpful comments on the manuscript and Thomas F. Stocker for discussion.
Long-term financial support of this research by the Swiss NSF (no. 200020_172476 (Fortunat Joos), no. 200020_172506 (Hubertus Fischer)) is appreciated. Part of the research leading to these results received funding from the European Research Council under the European Union's Seventh Framework Programme (FP/2007–2013)/ERC Advanced Grant Agreement no. 226172 (MATRICs) awarded to Hubertus Fischer. Benjamin D. Stocker was funded by the Swiss National Science Foundation grant no. PCEFP2_181115. I. Colin Prentice received funding from the European Research Council (ERC) under the European Union's Horizon 2020 research and innovation programme (grant agreement no. 787203 REALM). This work is a contribution to the AXA Chair Programme in Biosphere and Climate Impacts and the Grand Challenges in Ecosystems and the Environment initiative at Imperial College London (I. Colin Prentice). The TraCE-21ka project was supported by the US NSF and the US Department of Energy (Bette Otto-Bliesner and Zhengyu Liu). Part of this material is based upon work supported by the National Center for Atmospheric Research, which is a major facility sponsored by the National Science Foundation under Cooperative Agreement no. 1852977 (Bette Otto-Bliesner).
This paper was edited by Martin De Kauwe and reviewed by three anonymous referees.
Allison, S. D. and Gessner, M.: A trait-based approach for modelling microbial litter decomposition, Ecol. Lett., 15, 1058–1070, https://doi.org/10.1111/j.1461-0248.2012.01807.x, 2012.
Arias-Navarro, C., Díaz-Pinés, E., Klatt, S., Brandt, P., Rufino, M. C., Butterbach-Bahl, K., and Verchot, L. V.: Spatial variability of soil N2O and CO2 fluxes in different topographic positions in a tropical montane forest in Kenya, J. Geophys. Res.-Biogeo., 122, 514–527, https://doi.org/10.1002/2016JG003667, 2017.
Arneth, A., Harrison, S. P., Zaehle, S., Tsigaridis, K., Menon, S., Bartlein, P. J., Feichter, J., Korhola, A., Kulmala, M., O'Donnell, D., Schurgers, G., Sorvari, S., and Vesala, T.: Terrestrial biogeochemical feedbacks in the climate system, Nat. Geosci., 3, 525–532, 2010.
Arora, V. K., Boer, G. J., Friedlingstein, P., Eby, M., Jones, C. D., Christian, J. R., Bonan, G., Bopp, L., Brovkin, V., Cadule, P., Hajima, T., Ilyina, T., Lindsay, K., Tjiputra, J. F., and Wu, T.: Carbon–Concentration and Carbon–Climate Feedbacks in CMIP5 Earth System Models, J. Clim., 26, 5289–5314, https://doi.org/10.1175/jcli-d-12-00494.1, 2013.
Averill, C. and Waring, B.: Nitrogen limitation of decomposition and decay: How can it occur?, Glob. Change Biol., 24, 1417–1427, https://doi.org/10.1111/gcb.13980, 2018.
Babbin, A. R., Bianchi, D., Jayakumar, A., and Ward, B. B.: Rapid nitrous oxide cycling in the suboxic ocean, Science, 348, 1127–1129, 2015.
Baggs, E. M., Richter, M., Cadisch, G., and Hartwig, U. A.: Denitrification in grass swards is increased under elevated atmospheric CO2, Soil Biol. Biochem., 35, 729–732, 10.1016/S0038-0717(03)00083-X, 2003.
Bange, H. W.: Chapter 2 – Gaseous Nitrogen Compounds (NO, N2O, N2, NH3) in the Ocean, in: Nitrogen in the Marine Environment (2nd Edn.), edited by: Capone, D. G., Bronk, D. A., Mulholland, M. R., and Carpenter, E. J., Academic Press, San Diego, 51–94, 2008.
Barton, L., Wolf, B., Rowlings, D., Scheer, C., Kiese, R., Grace, P., Stefanova, K., and Butterbach-Bahl, K.: Sampling frequency affects estimates of annual nitrous oxide fluxes, Sci. Rep., 5, 15912, https://doi.org/10.1038/srep15912, 2015.
Battaglia, G. and Joos, F.: Marine N2O Emissions From Nitrification and Denitrification Constrained by Modern Observations and Projected in Multimillennial Global Warming Simulations, Global Biogeochem. Cy., 32, 92–121, https://doi.org/10.1002/2017gb005671, 2018.
Batterman, S. A., Hedin, L. O., van Breugel, M., Ransijn, J., Craven, D. J., and Hall, J. S.: Key role of symbiotic dinitrogen fixation in tropical forest secondary succession, Nature, 502, 224–227, https://doi.org/10.1038/nature12525, 2013.
Bengtsson, G., Bengtson, P., and Mansson, K. F.: Gross nitrogen mineralization-, immobilization-, and nitrification rates as a function of soil C∕N ratio and microbial activity, Soil Biol. Biochem., 35, 143–154, 2003.
Berger, A. L.: Long-Term Variations of Caloric Insolation Resulting from Earths Orbital Elements, Quaternary Res., 9, 139–167, https://doi.org/10.1016/0033-5894(78)90064-9, 1978.
Bird, M. I., Lloyd, J., and Farquhar, G. D.: Terrestrial carbon storage at the LGM, Nature, 371, p. 566, https://doi.org/10.1038/371566a0, 1994.
Bormann, B. T., Keller, C. K., Wang, D., and Bormann, F. H.: Lessons from the Sandbox: Is Unexplained Nitrogen Real?, Ecosystems, 5, 727–733, https://doi.org/10.1007/s10021-002-0189-2, 2002.
Bouwman, A. F., Boumans, L. J. M., and Batjes, N. H.: Emissions of N2O and NO from fertilized fields: Summary of available measurement data, Global Biogeochem. Cy., 16, 6-1–6-13, https://doi.org/10.1029/2001gb001811, 2002.
Bouwman, A. F., Beusen, A. H. W., Griffioen, J., Van Groenigen, J. W., Hefting, M. M., Oenema, O., Van Puijenbroek, P. J. T. M., Seitzinger, S., Slomp, C. P., and Stehfest, E.: Global trends and uncertainties in terrestrial denitrification and N2O emissions, Philos. T. R. Soc. B, 368, 1–11, 2013.
Butterbach-Bahl, K., Willibald, G., and Papen, H.: Soil core method for direct simultaneous determination of N2 and N2O emissions from forest soils, Plant Soil, 240, 105–116, https://doi.org/10.1023/A:1015870518723, 2002.
Butterbach-Bahl, K., Baggs, E. M., Dannenmann, M., Kiese, R., and Zechmeister-Boltenstern, S.: Nitrous oxide emissions from soils: how well do we understand the processes and their controls?, Philos. T. R. Soc. B, 368, 1–13, 2013.
Chapuis-Lardy, L., Wrage, N., Metay, A., Chotte, J. L., and Bernoux, M.: Soils, a sink for N2O? A review, Glob. Change Biol., 13, 1–17, https://doi.org/10.1111/j.1365-2486.2006.01280.x, 2006.
Charles, A., Rochette, P., Whalen, J. K., Angers, D. A., Chantigny, M. H., and Bertrand, N.: Global nitrous oxide emission factors from agricultural soils after addition of organic amendments: A meta-analysis, Agr. Ecosyst. Environ., 236, 88–98, 10.1016/j.agee.2016.11.021, 2017.
Ciais, P., Tagliabue, A., Cuntz, M., Bopp, L., Scholze, M., Hoffmann, G., Lourantou, A., Harrison, S. P., Prentice, I. C., Kelley, D. I., Koven, C., and Piao, S. L.: Large inert carbon pool in the terrestrial biosphere during the Last Glacial Maximum, Nat. Geosci., 5, 74–79, 2012.
Ciais, P., Sabine, C., Bala, G., Bopp, L., Brovkin, V., Canadell, J. A. C., DeFries, R., Galloway, J., Heimann, M., Jones, C., Le Quéré, C., Myneni, R., Piao, S., and Thornton, P.: Carbon and Other Biogeochemical Cycles, in: Climate Change 2013: The Physical Science Basis, Contribution of Working Group I to the Fifth Assessment Report of the Intergovernmental Panel on Climate Change, edited by: Stocker, T. F., Qin, D., Plattner, G.-K., Tignor, M., Allen, S. K., Boschung, J., Nauels, A., Xia, Y., Bex, V., and Midgley, P. M., Cambridge University Press, Cambridge, United Kingdom and New York, NY, USA, 465–570, 2013.
Cleveland, C. C., Townsend, A. R., Schimel, D. S., Fisher, H., Howarth, R. W., Hedin, L. O., Perakis, S. S., Latty, E. F., Von Fischer, J. C., Elseroad, A., and Wasson, M. F.: Global patterns of terrestrial biological nitrogen (N2) fixation in natural ecosystems, Global Biogeochem. Cy., 13, 623–645, https://doi.org/10.1029/1999GB900014, 1999.
Cleveland, C. C., Houlton, B. Z., Smith, W. K., Marklein, A. R., Reed, S. C., Parton, W., Del Grosso, S. J., and Running, S. W.: Patterns of new versus recycled primary production in the terrestrial biosphere, P. Natl. Acad. Sci. USA, 110, 12733–12737, 2013.
Cui, Q., Song, C., Wang, X., Shi, F., Yu, X., and Tan, W.: Effects of warming on N2O fluxes in a boreal peatland of Permafrost region, Northeast China, Sci. Total Environ., 616/617, 427–434, https://doi.org/10.1016/j.scitotenv.2017.10.246, 2018.
Davidson, E. A., Keller, M., Erickson, H. E., Verchot, L. V., and Veldkamp, E.: Testing a Conceptual Model of Soil Emissions of Nitrous and Nitric OxidesUsing two functions based on soil nitrogen availability and soil water content, the hole-in-the-pipe model characterizes a large fraction of the observed variation of nitric oxide and nitrous oxide emissions from soils, BioScience, 50, 667–680, https://doi.org/10.1641/0006-3568(2000)050[0667:tacmos]2.0.co;2, 2000.
Davidson, E. A., de Carvalho, C. J. R., Figueira, A. M., Ishida, F. Y., Ometto, J. P. H. B., Nardoto, G. B., Saba, R. T., Hayashi, S. N., Leal, E. C., Vieira, I. C. G., and Martinelli, L. A.: Recuperation of nitrogen cycling in Amazonian forests following agricultural abandonment, Nature, 447, 995–996, https://doi.org/10.1038/Nature05900, 2007.
Davidson, E. A., Markewitz, D., de O. Figueiredo, R., and de Camargo, P. B.: Nitrogen Fixation Inputs in Pasture and Early Successional Forest in the Brazilian Amazon Region: Evidence From a Claybox Mesocosm Study, J. Geophys. Res.-Biogeo., 123, 712–721, https://doi.org/10.1002/2017jg004103, 2018.
Dentener, F., Drevet, J., Lamarque, J. F., Bey, I., Eickhout, B., Fiore, A. M., Hauglustaine, D., Horowitz, L. W., Krol, M., Kulshrestha, U. C., Lawrence, M., Galy-Lacaux, C., Rast, S., Shindell, D., Stevenson, D., Van Noije, T., Atherton, C., Bell, N., Bergman, D., Butler, T., Cofala, J., Collins, B., Doherty, R., Ellingsen, K., Galloway, J., Gauss, M., Montanaro, V., Müller, J. F., Pitari, G., Rodriguez, J., Sanderson, M., Solmon, F., Strahan, S., Schultz, M., Sudo, K., Szopa, S., and Wild, O.: Nitrogen and sulfur deposition on regional and global scales: A multimodel evaluation, Global Biogeochem. Cy., 20, 1–21, https://doi.org/10.1029/2005gb002672, 2006.
Diem, T., Morley, N. J., Ccahuana Quispe, A. J., Huaraca Quispe, L. P., Baggs, E. M., Meir, P., Richards, M. I. A., Smith, P., and Teh, Y. A.: Complex controls on nitrous oxide flux across a large-elevation gradient in the tropical Peruvian Andes, Biogeosciences, 14, 5077–5097, https://doi.org/10.5194/bg-14-5077-2017, 2017.
Dijkstra, F. A., Prior, S. A., Runion, G. B., Torbert, H. A., Tian, H., Lu, C., and Venterea, R., T.: Effects of elevated carbon dioxide and increased temperature on methane and nitrous oxide fluxes: evidence from field experiments, Front. Ecol. Environ., 10, 520–527, https://doi.org/10.1890/120059, 2012.
Elbert, W., Weber, B., Burrows, S., Steinkamp, J., Büdel, B., Andreae, M. O., and Pöschl, U.: Contribution of cryptogamic covers to the global cycles of carbon and nitrogen, Nat. Geosci., 5, 459–462, https://doi.org/10.1038/ngeo1486, 2012.
Elser, J. J., Bracken, M. E. S., Cleland, E. E., Gruner, D. S., Harpole, W. S., Hillebrand, H., Ngai, J. T., Seabloom, E. W., Shurin, J. B., and Smith, J. E.: Global analysis of nitrogen and phosphorus limitation of primary producers in freshwater, marine and terrestrial ecosystems, Ecol. Lett., 10, 1135–1142, https://doi.org/10.1111/j.1461-0248.2007.01113.x, 2007.
Ericksen, G. E.: Geology and Origin of the Chilean Nitrate Deposits, Washington, DC, 20402, 42 pp., 1981.
Fatichi, S., Leuzinger, S., and Körner, C.: Moving beyond photosynthesis: from carbon source to sink-driven vegetation modeling, New Phytol., 201, 1086–1095, https://doi.org/10.1111/nph.12614, 2014.
Firestone, M. K. and Davidson, E. A.: Microbiological basis of NO and N2O production and consumption, in: Exchange of Trace Gases between Terrestrial Ecosystems and the Atmosphere, edited by: Andreae, M. O. and Schimel, D. S., John Wiley & Sons, New York, 7–21, 1989.
Fischer, H., Schmitt, J., Bock, M., Seth, B., Joos, F., Spahni, R., Lienert, S., Battaglia, G., Stocker, B. D., Schilt, A., and Brook, E. J.: N2O changes from the Last Glacial Maximum to the preindustrial – Part 1: Quantitative reconstruction of terrestrial and marine emissions using N2O stable isotopes in ice cores, Biogeosciences, 16, 3997–4021, https://doi.org/10.5194/bg-16-3997-2019, 2019.
Fisher, J. B., Sitch, S., Malhi, Y., Fisher, R. A., Huntingford, C., and Tan, S. Y.: Carbon cost of plant nitrogen acquisition: A mechanistic, globally applicable model of plant nitrogen uptake, retranslocation, and fixation, Global Biogeochem. Cy., 24, GB1014, https://doi.org/10.1029/2009gb003621, 2010.
Fisher, J. B., Badgley, G., and Blyth, E.: Global nutrient limitation in terrestrial vegetation, Global Biogeochem. Cy., 26, GB3007, https://doi.org/10.1029/2011gb004252, 2012.
Friedlingstein, P., Cox, P., Betts, R., Bopp, L., von Bloh, W., Brovkin, V., Doney, S., Eby, M., Fung, I., Govindasamy, B., John, J., Jones, C., Joos, F., Kato, T., Kawamiya, M., Knorr, W., Lindsay, K., Matthews, H. D., Raddatz, T., Rayner, R., Reick, C., Roeckner, E., Schnitzler, K.-G., Schnur, R., Strassmann, K., Thompson, S., Weaver, A. J., Yoshikawa, C., and Zeng, N.: Climate-carbon cycle feedback analysis, results from the C4MIP model intercomparison, J. Clim., 19, 3337–3353, 2006.
Friedlingstein, P., Meinshausen, M., Arora, V. K., Jones, C. D., Anav, A., Liddicoat, S. K., and Knutti, R.: Uncertainties in CMIP5 Climate Projections due to Carbon Cycle Feedbacks, J. Clim., 27, 511–526, https://doi.org/10.1175/jcli-d-12-00579.1, 2013.
Gehring, C., Vlek, P. L. G., de Souza, L. A. G., and Denich, M.: Biological nitrogen fixation in secondary regrowth and mature rainforest of central Amazonia, Agr. Ecosyst. Environ., 111, 237–252, https://doi.org/10.1016/j.agee.2005.06.009, 2005.
Gerber, S., Hedin, L. O., Oppenheimer, M., Pacala, S. W., and Shevliakova, E.: Nitrogen cycling and feedbacks in a global dynamic land model, Global Biogeochem. Cy., 24, 1–15, https://doi.org/10.1029/2008gb003336, 2010.
Gerten, D., Schaphoff, S., Haberlandt, U., Lucht, W., and Sitch, S.: Terrestrial vegetation and water balance – hydrological evaluation of a dynamic global vegetation model, J. Hydrol., 286, 249–270, 2004.
Gilly, W. F., Beman, J. M., Litvin, S. Y., and Robison, B. H.: Oceanographic and Biological Effects of Shoaling of the Oxygen Minimum Zone, Annu. Rev. Mar. Sci., 5, 393–420, https://doi.org/10.1146/annurev-marine-120710-100849, 2013.
Goll, D. S., Vuichard, N., Maignan, F., Jornet-Puig, A., Sardans, J., Violette, A., Peng, S., Sun, Y., Kvakic, M., Guimberteau, M., Guenet, B., Zaehle, S., Penuelas, J., Janssens, I., and Ciais, P.: A representation of the phosphorus cycle for ORCHIDEE (revision 4520), Geosci. Model Dev., 10, 3745–3770, https://doi.org/10.5194/gmd-10-3745-2017, 2017.
Gruber, N. and Galloway, J. N.: An Earth-system perspective of the global nitrogen cycle, Nature, 451, 293–296, 2008.
Gütlein, A., Zistl-Schlingmann, M., Becker, J. N., Cornejo, N. S., Detsch, F., Dannenmann, M., Appelhans, T., Hertel, D., Kuzyakov, Y., and Kiese, R.: Nitrogen turnover and greenhouse gas emissions in a tropical alpine ecosystem, Mt. Kilimanjaro, Tanzania, Plant Soil, 411, 243–259, https://doi.org/10.1007/s11104-016-3029-4, 2017.
Hedin, L. O., Armesto, J. J., and Johnson, A. H.: Patterns of Nutrient Loss from Unpolluted, Old-Growth Temperate Forests: Evaluation of Biogeochemical Theory, Ecology, 76, 493–509, https://doi.org/10.2307/1941208, 1995.
Hedin, L. O., Vitousek, P. M., and Matson, P. A.: Nutrient losses over four million years of tropical forest development, Ecology, 84, 2231–2255, https://doi.org/10.1890/02-4066, 2003.
Houlton, B. Z., Morford, S. L., and Dahlgren, R. A.: Convergent evidence for widespread rock nitrogen sources in Earth's surface environment, Science, 360, 58–62, 2018.
Huang, Y. and Gerber, S.: Global soil nitrous oxide emissions in a dynamic carbon-nitrogen model, Biogeosciences, 12, 6405–6427, https://doi.org/10.5194/bg-12-6405-2015, 2015.
Hungate, B. A., Dukes, J. S., Shaw, M. R., Luo, Y. Q., and Field, C. B.: Nitrogen and climate change, Science, 302, 1512–1513, https://doi.org/10.1126/science.1091390, 2003.
Jeltsch-Thömmes, A., Battaglia, G., Cartapanis, O., Jaccard, S. L., and Joos, F.: Low terrestrial carbon storage at the Last Glacial Maximum: constraints from multi-proxy data, Clim. Past, 15, 849–879, https://doi.org/10.5194/cp-15-849-2019, 2019.
Jones, C., Robertson, E., Arora, V., Friedlingstein, P., Shevliakova, E., Bopp, L., Brovkin, V., Hajima, T., Kato, E., Kawamiya, M., Liddicoat, S., Lindsay, K., Reick, C. H., Roelandt, C., Segschneider, J., and Tjiputra, J.: Twenty-First-Century Compatible CO2 Emissions and Airborne Fraction Simulated by CMIP5 Earth System Models under Four Representative Concentration Pathways, J. Clim., 26, 4398–4413, https://doi.org/10.1175/jcli-d-12-00554.1, 2013.
Joos, F. and Spahni, R.: Rates of change in natural and anthropogenic radiative forcing over the past 20,000 years, P. Natl. Acad. Sci. USA, 105, 1425–1430, 2008.
Joos, F., Prentice, I. C., Sitch, S., Meyer, R., Hooss, G., Plattner, G. K., Gerber, S., and Hasselmann, K.: Global warming feedbacks on terrestrial carbon uptake under the Intergovernmental Panel on Climate Change (IPCC) emission scenarios, Global Biogeochem. Cy., 15, 891–908, 2001.
Joos, F., Gerber, S., Prentice, I. C., Otto-Bliesner, B. L., and Valdes, P. J.: Transient simulations of Holocene atmospheric carbon dioxide and terrestrial carbon since the Last Glacial Maximum, Global Biogeochem. Cy., 18, 1–18, 2004.
Joos, F., Roth, R., Fuglestvedt, J. S., Peters, G. P., Enting, I. G., von Bloh, W., Brovkin, V., Burke, E. J., Eby, M., Edwards, N. R., Friedrich, T., Frölicher, T. L., Halloran, P. R., Holden, P. B., Jones, C., Kleinen, T., Mackenzie, F. T., Matsumoto, K., Meinshausen, M., Plattner, G.-K., Reisinger, A., Segschneider, J., Shaffer, G., Steinacher, M., Strassmann, K., Tanaka, K., Timmermann, A., and Weaver, A. J.: Carbon dioxide and climate impulse response functions for the computation of greenhouse gas metrics: a multi-model analysis, Atmos. Chem. Phys., 13, 2793–2825, https://doi.org/10.5194/acp-13-2793-2013, 2013.
Joos, F., Battaglia, G., Fischer, H., Jeltsch-Thömmes, A., and Schmitt, J.: Marine N2O emissions during a Younger Dryas-like event: the role of meridional overturning, tropical thermocline ventilation, and biological productivity, Environ. Res. Lett., 14, 075007, https://doi.org/10.1088/1748-9326/ab2353, 2019.
Kato, T., Toyoda, S., Yoshida, N., Tang, Y., and Wada, E.: Isotopomer and isotopologue signatures of N2O produced in alpine ecosystems on the Qinghai–Tibetan Plateau, Rapid Commun. Mass Spectrom., 27, 1517–1526, https://doi.org/10.1002/rcm.6595, 2013.
Keller, K. M., Lienert, S., Bozbiyik, A., Stocker, T. F., Churakova, O. V., Frank, D. C., Klesse, S., Koven, C. D., Leuenberger, M., Riley, W. J., Saurer, M., Siegwolf, R., Weigt, R. B., and Joos, F.: 20th century changes in carbon isotopes and water-use efficiency: tree-ring-based evaluation of the CLM4.5 and LPX-Bern models, Biogeosciences, 14, 2641–2673, https://doi.org/10.5194/bg-14-2641-2017, 2017.
Kool, D. M., Dolfing, J., Wrage, N., and Van Groenigen, J. W.: Nitrifier denitrification as a distinct and significant source of nitrous oxide from soil, Soil Biol. Biochem., 43, 174–178, https://doi.org/10.1016/j.soilbio.2010.09.030, 2011.
Körner, C.: Paradigm shift in plant growth control, Curr. Opin. Plant Biol., 25, 107–114, https://doi.org/10.1016/j.pbi.2015.05.003, 2015.
Kracher, D., Reick, C. H., Manzini, E., Schultz, M. G., and Stein, O.: Climate change reduces warming potential of nitrous oxide by an enhanced Brewer-Dobson circulation, Geophys. Res. Lett., 43, 5851–5859, https://doi.org/10.1002/2016gl068390, 2016.
Lamarque, J.-F., Kyle, G., Meinshausen, M., Riahi, K., Smith, S., van Vuuren, D., Conley, A., and Vitt, F.: Global and regional evolution of short-lived radiatively-active gases and aerosols in the Representative Concentration Pathways, Climatic Change, 109, 191–212, https://doi.org/10.1007/s10584-011-0155-0, 2011.
Lenhart, K., Weber, B., Elbert, W., Steinkamp, J., Clough, T., Crutzen, P., Pöschl, U., and Keppler, F.: Nitrous oxide and methane emissions from cryptogamic covers, Glob. Change Biol., 21, 3889–3900, https://doi.org/10.1111/gcb.12995, 2015.
Li, D., Yang, Y., Chen, H., Xiao, K., Song, T., and Wang, K.: Soil Gross Nitrogen Transformations in Typical Karst and Nonkarst Forests, Southwest China, J. Geophys. Res.-Biogeo., 122, 2831–2840, https://doi.org/10.1002/2017jg003850, 2017.
Liao, W., Menge Duncan, N. L., Lichstein Jeremy, W., and Ángeles-Pérez, G.: Global climate change will increase the abundance of symbiotic nitrogen-fixing trees in much of North America, Glob. Change Biol., 23, 4777–4787, https://doi.org/10.1111/gcb.13716, 2017.
Lienert, S. and Joos, F.: A Bayesian ensemble data assimilation to constrain model parameters and land-use carbon emissions, Biogeosciences, 15, 2909–2930, https://doi.org/10.5194/bg-15-2909-2018, 2018a.
Lienert, S. and Joos, F.: A Bayesian ensemble data assimilation to constrain model parameters and land-use carbon emissions, Biogeosciences, 15, 2909–2930, https://doi.org/10.5194/bg-15-2909-2018, 2018b.
Lindgren, A., Hugelius, G., and Kuhry, P.: Extensive loss of past permafrost carbon but a net accumulation into present-day soils, Nature, 560, 219–222, https://doi.org/10.1038/s41586-018-0371-0, 2018.
Liu, Z., Otto-Bliesner, B. L., He, F., Brady, E. C., Tomas, R., Clark, P. U., Carlson, A. E., Lynch-Stieglitz, J., Curry, W., Brook, E., Erickson, D., Jacob, R., Kutzbach, J., and Cheng, J.: Transient Simulation of Last Deglaciation with a New Mechanism for Bolling-Allerod Warming, Science, 325, 310–314, https://doi.org/10.1126/science.1171041, 2009.
Lu, M., Yang, Y., Luo, Y., Fang, C., Zhou, X., Chen, J., Yang, X., and Li, B.: Responses of ecosystem nitrogen cycle to nitrogen addition: a meta-analysis, New Phytol., 189, 1040–1050, https://doi.org/10.1111/j.1469-8137.2010.03563.x, 2011.
Luo, Y., Su, B., Currie, W. S., Dukes, J. S., Finzi, A., Hartwig, U., Hungate, B., McMurtrie, R. E., Oren, R., Parton, W. J., Pataki, D. E., Shaw, R. M., Zak, D. R., and Field, C. B.: Progressive Nitrogen Limitation of Ecosystem Responses to Rising Atmospheric Carbon Dioxide, BioScience, 54, 731–739, https://doi.org/10.1641/0006-3568(2004)054[0731:pnloer]2.0.co;2, 2004.
MacFarling Meure, C. M., Etheridge, D., Trudinger, C., Steele, P., Langenfelds, R. L., van Ommen, T., Smith, A., and Elkins, J. W.: The Law Dome CO2, CH4 and N2O ice core records extended to 2000 years BP, Geophys. Res. Lett., 33, L14810, https://doi.org/14810.11029/12006GL026152, 2006.
Manzoni, S., Jackson, R. B., Trofymow, J. A., and Porporato, A.: The global stoichiometry of litter nitrogen mineralization, Science, 321, 684–686, https://doi.org/10.1126/science.1159792, 2008.
Matson, A. L., Corre, M. D., Langs, K., and Veldkamp, E.: Soil trace gas fluxes along orthogonal precipitation and soil fertility gradients in tropical lowland forests of Panama, Biogeosciences, 14, 3509–3524, https://doi.org/10.5194/bg-14-3509-2017, 2017.
McMurtrie, R. E., Norby, R. J., Medlyn, B. E., Dewar, R. C., Pepper, D. A., Reich, P. B., and Barton, C. V. M.: Why is plant-growth response to elevated CO2 amplified when water is limiting, but reduced when nitrogen is limiting? A growth-optimisation hypothesis, Funct. Plant Biol., 35, 521–534, https://doi.org/10.1071/FP08128, 2008.
Menge, D. N. L., Batterman, S. A., Hedin, L. O., Liao, W., Pacala, S. W., and Taylor, B. N.: Why are nitrogen-fixing trees rare at higher compared to lower latitudes?, Ecology, 98, 3127–3140, https://doi.org/10.1002/ecy.2034, 2017.
Meyerholt, J. and Zaehle, S.: Controls of terrestrial ecosystem nitrogen loss on simulated productivity responses to elevated CO2, Biogeosciences, 15, 5677–5698, https://doi.org/10.5194/bg-15-5677-2018, 2018.
Meyerholt, J., Zaehle, S., and Smith, M. J.: Variability of projected terrestrial biosphere responses to elevated levels of atmospheric CO2 due to uncertainty in biological nitrogen fixation, Biogeosciences, 13, 1491–1518, https://doi.org/10.5194/bg-13-1491-2016, 2016.
Michalski, G., Böhlke, J. K., and Thiemens, M.: Long term atmospheric deposition as the source of nitrate and other salts in the Atacama Desert, Chile: New evidence from mass-independent oxygen isotopic compositions, Geochim. Cosmochim. Ac., 68, 4023–4038, https://doi.org/10.1016/j.gca.2004.04.009, 2004.
Mitchell, T. D. and Jones, P. D.: An improved method of constructing a database of monthly climate observations and associated high-resolution grids, Int. J. Climatol., 25, 693–712, https://doi.org/10.1002/Joc.1181, 2005.
Moser, G., Gorenflo, A., Brenzinger, K., Keidel, L., Braker, G., Marhan, S., Clough Tim, J., and Müller, C.: Explaining the doubling of N2O emissions under elevated CO2 in the Giessen FACE via in-field 15N tracing, Glob. Change Biol., 0, 1–14, https://doi.org/10.1111/gcb.14136, 2018.
Müller, A. K., Matson, A. L., Corre, M. D., and Veldkamp, E.: Soil N2O fluxes along an elevation gradient of tropical montane forests under experimental nitrogen and phosphorus addition, Front. Earth Sci., 3, 1–12, 2015.
Myhre, G., Shindell, D., Bréon, F.-M., Collins, W., Fuglestvedt, J., Huang, J., Koch, D., Lamarque, J.-F., Lee, D., Mendoza, B., Nakajima, T., Robock, A., Stephens, G. T. T., and Zhang, H.: Anthropogenic and Natural Radiative Forcing, in: Climate Change 2013: The Physical Science Basis, Contribution of Working Group I to the Fifth Assessment Report of the Intergovernmental Panel on Climate Change, edited by: Stocker, T. F., Qin, D., Plattner, G.-K., Tignor, M., Allen, S. K., Boschung, J., Nauels, A., Xia, Y., Bex, V., and Midgley, P. M., Cambridge University Press, Cambridge, United Kingdom and New York, NY, USA, 2013.
Nevison, C., Hess, P., Riddick, S., and Ward, D.: Denitrification, leaching, and river nitrogen export in the Community Earth System Model, J. Adv. Model. Earth Sy., 8, 272–291, https://doi.org/10.1002/2015ms000573, 2016.
Niu, S., Classen Aimée, T., Dukes Jeffrey, S., Kardol, P., Liu, L., Luo, Y., Rustad, L., Sun, J., Tang, J., Templer Pamela, H., Thomas, R. Q., Tian, D., Vicca, S., Wang, Y. P., Xia, J., and Zaehle, S.: Global patterns and substrate-based mechanisms of the terrestrial nitrogen cycle, Ecol. Lett., 19, 697–709, https://doi.org/10.1111/ele.12591, 2016.
Norby, R. J., Warren, J. M., Iversen, C. M., Medlyn, B. E., and McMurtrie, R. E.: CO2 enhancement of forest productivity constrained by limited nitrogen availability, P. Natl. Acad. Sci. USA, 107, 19368–19373, 2010.
Olin, S., Lindeskog, M., Pugh, T. A. M., Schurgers, G., Wårlind, D., Mishurov, M., Zaehle, S., Stocker, B. D., Smith, B., and Arneth, A.: Soil carbon management in large-scale Earth system modelling: implications for crop yields and nitrogen leaching, Earth Syst. Dynam., 6, 745–768, https://doi.org/10.5194/esd-6-745-2015, 2015.
Otto-Bliesner, B. L., Russell, J. M., Clark, P. U., Liu, Z. Y., Overpeck, J. T., Konecky, B., deMenocal, P., Nicholson, S. E., He, F., and Lu, Z. Y.: Coherent changes of southeastern equatorial and northern African rainfall during the last deglaciation, Science, 346, 1223–1227, https://doi.org/10.1126/science.1259531, 2014.
Peltier, W. R.: Global glacial isostasy and the surface of the ice-age earth: The ICE-5G (VM2) model and grace, Annu. Rev. Earth Pl. Sc., 32, 111–149, https://doi.org/10.1146/annurev.earth.32.082503.144359, 2004.
Phillips, R. L., McMillan, A. M. S., Palmada, T., Dando, J., and Giltrap, D.: Temperature effects on N2O and N2 denitrification end-products for a New Zealand pasture soil, New Zeal. J. Agr. Res., 58, 89–95, https://doi.org/10.1080/00288233.2014.969380, 2015.
Plattner, G.-K., Knutti, R., Joos, F., Stocker, T. F., von Bloh, W., Brovkin, V., Cameron, D., Driesschaert, E., Dutkiewicz, S., Eby, M., Edwards, N. R., Fichefet, T., Hargreaves, J. C., Jones, C. D., Loutre, M. F., Matthews, H. D., Mouchet, A., Mueller, S. A., Nawrath, S., Price, A., Sokolov, A., Strassmann, K. M., and Weaver, A. J.: Long-term climate commitments projected with climate – carbon cycle models, J. Clim., 21, 2721–2751, 2008.
Pons, T. L., Perreijn, K., van Kessel, C., and Werger, M. J. A.: Symbiotic nitrogen fixation in a tropical rainforest: N-15 natural abundance measurements supported by experimental isotopic enrichment, New Phytol., 173, 154–167, https://doi.org/10.1111/j.1469-8137.2006.01895.x, 2007.
Porada, P., Pöschl, U., Kleidon, A., Beer, C., and Weber, B.: Estimating global nitrous oxide emissions by lichens and bryophytes with a process-based productivity model, Biogeosciences, 14, 1593–1602, https://doi.org/10.5194/bg-14-1593-2017, 2017.
Potter, C. S., Matson, P. A., Vitousek, P. M., and Davidson, E. A.: Process modeling of controls on nitrogen trace gas emissions from soils worldwide, J. Geophys. Res.-Atmos., 101, 1361–1377, https://doi.org/10.1029/95JD02028, 1996.
Prather, M. J., Hsu, J., DeLuca, N. M., Jackman, C. H., Oman, L. D., Douglass, A. R., Fleming, E. L., Strahan, S. E., Steenrod, S. D., Søvde, O. A., Isaksen, I. S. A., Froidevaux, L., and Funke, B.: Measuring and modeling the lifetime of nitrous oxide including its variability, J. Geophys. Res.-Atmos., 120, 5693–5705, https://doi.org/10.1002/2015jd023267, 2015.
Rasmussen, S. O., Bigler, M., Blockley, S. P., Blunier, T., Buchardt, S. L., Clausen, H. B., Cvijanovic, I., Dahl-Jensen, D., Johnsen, S. J., Fischer, H., Gkinis, V., Guillevic, M., Hoek, W. Z., Lowe, J. J., Pedro, J. B., Popp, T., Seierstad, I. K., Steffensen, J. P., Svensson, A. M., Vallelonga, P., Vinther, B. M., Walker, M. J. C., Wheatley, J. J., and Winstrup, M.: A stratigraphic framework for abrupt climatic changes during the Last Glacial period based on three synchronized Greenland ice-core records: refining and extending the INTIMATE event stratigraphy, Quaternary Sci. Rev., 106, 14–28, https://doi.org/10.1016/j.quascirev.2014.09.007, 2014.
Regan, K., Kammann, C., Hartung, K., Lenhart, K., Müller, C., Philippot, L., Kandeler, E., and Marhan, S.: Can differences in microbial abundances help explain enhanced N2O emissions in a permanent grassland under elevated atmospheric CO2?, Glob. Change Biol., 17, 3176–3186, https://doi.org/10.1111/j.1365-2486.2011.02470.x, 2011.
Reich, P. B., Hobbie, S. E., and Lee, T. D.: Plant growth enhancement by elevated CO2 eliminated by joint water and nitrogen limitation, Nat. Geosci., 7, 920–924, https://doi.org/10.1038/Ngeo2284, 2014.
Ruosch, M., Spahni, R., Joos, F., Henne, P. D., van der Knaap, W. O., and Tinner, W.: Past and future evolution of Abies alba forests in Europe – comparison of a dynamic vegetation model with palaeo data and observations, Glob. Change Biol., 22, 727-740, https://doi.org/10.1111/gcb.13075, 2016.
Saggar, S., Jha, N., Deslippe, J., Bolan, N. S., Luo, J., Giltrap, D. L., Kim, D. G., Zaman, M., and Tillman, R. W.: Denitrification and N2O:N2 production in temperate grasslands: Processes, measurements, modelling and mitigating negative impacts, Sci. Total Environ., 465, 173–195, https://doi.org/10.1016/j.scitotenv.2012.11.050, 2013.
Saikawa, E., Schlosser, C. A., and Prinn, R. G.: Global modeling of soil nitrous oxide emissions from natural processes, Global Biogeochem. Cy., 27, 972–989, https://doi.org/10.1002/gbc.20087, 2013.
Saurer, M., Spahni, R., Frank, D. C., Joos, F., Leuenberger, M., Loader, N. J., McCarroll, D., Gagen, M., Poulter, B., Siegwolf, R. T. W., Andreu-Hayles, L., Boettger, T., Dorado Liñán, I., Fairchild, I. J., Friedrich, M., Gutierrez, E., Haupt, M., Hilasvuori, E., Heinrich, I., Helle, G., Grudd, H., Jalkanen, R., Levanič, T., Linderholm, H. W., Robertson, I., Sonninen, E., Treydte, K., Waterhouse, J. S., Woodley, E. J., Wynn, P. M., and Young, G. H. F.: Spatial variability and temporal trends in water-use efficiency of European forests, Glob. Change Biol., 20, 3700–3712, https://doi.org/10.1111/gcb.12717, 2014.
Schilt, A., Baumgartner, M., Blunier, T., Schwander, J., Spahni, R., Fischer, H., and Stocker, T. F.: Glacial–interglacial and millennial-scale variations in the atmospheric nitrous oxide concentration during the last 800,000 years, Quaternary Sci. Rev., 29, 182–192, https://doi.org/10.1016/j.quascirev.2009.03.011, 2010.
Schilt, A., Brook, E. J., Bauska, T. K., Baggenstos, D., Fischer, H., Joos, F., Petrenko, V. V., Schaefer, H., Schmitt, J., Severinghaus, J. P., Spahni, R., and Stocker, T. F.: Isotopic constraints on marine and terrestrial N2O emissions during the last deglaciation, Nature, 516, 234–237, https://doi.org/10.1038/nature13971, 2014.
Schimel, J. P. and Weintraub, M. N.: The implications of exoenzyme activity on microbial carbon and nitrogen limitation in soil: a theoretical model, Soil Biol. Biochem., 35, 549–563, https://doi.org/10.1016/S0038-0717(03)00015-4, 2003.
Schmid, M., Fuhrer, J., and Neftel, A.: Nitrous Oxide Concentrations in the Soil of a Mown Grassland: Comparison of Model Results with Soil Profile Measurements, Water Air Soil Poll., 1, 437–446, https://doi.org/10.1023/a:1013158028103, 2001a.
Schmid, M., Neftel, A., Riedo, M., and Fuhrer, J.: Process-based modelling of nitrous oxide emissions from different nitrogen sources in mown grassland, Nutr. Cycl. Agroecosyst., 60, 177–187, https://doi.org/10.1023/a:1012694218748, 2001b.
Shi, M., Fisher, J. B., Phillips, R. P., and Brzostek, E. R.: Neglecting plant–microbe symbioses leads to underestimation of modeled climate impacts, Biogeosciences, 16, 457–465, https://doi.org/10.5194/bg-16-457-2019, 2019.
Sitch, S., Smith, B., Prentice, I. C., Arneth, A., Bondeau, A., Cramer, W., Kaplan, J. O., Levis, S., Lucht, W., Sykes, M. T., Thonicke, K., and Venevsky, S.: Evaluation of ecosystem dynamics, plant geography and terrestrial carbon cycling in the LPJ dynamic global vegetation model, Glob. Change Biol., 9, 161–185, 2003.
Smith, K.: The potential for feedback effects induced by global warming on emissions of nitrous oxide by soils, Glob. Change Biol., 3, 327–338, https://doi.org/10.1046/j.1365-2486.1997.00100.x, 1997.
Sowers, T., Alley, R. B., and Jubenville, J.: Ice core records of atmospheric N2O covering the last 106,000 years, Science, 301, 945–948, https://doi.org/10.1126/science.1085293, 2003.
Spahni, R., Chappellaz, J., Stocker, T. F., Loulergue, L., Hausammann, G., Kawamura, K., Flückiger, J., Schwander, J., Raynaud, D., Masson-Delmotte, V., and Jouzel, J.: Atmospheric methane and nitrous oxide of the late Pleistocene from Antarctic ice cores, Science, 310, 1317–1321, 2005.
Spahni, R., Wania, R., Neef, L., van Weele, M., Pison, I., Bousquet, P., Frankenberg, C., Foster, P. N., Joos, F., Prentice, I. C., and van Velthoven, P.: Constraining global methane emissions and uptake by ecosystems, Biogeosciences, 8, 1643–1665, https://doi.org/10.5194/bg-8-1643-2011, 2011.
Spahni, R., Joos, F., Stocker, B. D., Steinacher, M., and Yu, Z. C.: Transient simulations of the carbon and nitrogen dynamics in northern peatlands: from the Last Glacial Maximum to the 21st century, Clim. Past, 9, 1287–1308, https://doi.org/10.5194/cp-9-1287-2013, 2013.
Stehfest, E., and Bouwman, L.: N2O and NO emission from agricultural fields and soils under natural vegetation: summarizing available measurement data and modeling of global annual emissions, Nutr. Cycl. Agroecosyst., 74, 207–228, https://doi.org/10.1007/s10705-006-9000-7, 2006.
Stocker, B. D., Roth, R., Joos, F., Spahni, R., Steinacher, M., Zaehle, S., Bouwman, L., Xu, R., and Prentice, I. C.: Multiple greenhouse-gas feedbacks from the land biosphere under future climate change scenarios, Nat. Clim. Change, 3, 666–672, https://doi.org/10.1038/nclimate1864, 2013.
Stocker, B. D., Spahni, R., and Joos, F.: DYPTOP: a cost-efficient TOPMODEL implementation to simulate sub-grid spatio-temporal dynamics of global wetlands and peatlands, Geosci. Model Dev., 7, 3089–3110, https://doi.org/10.5194/gmd-7-3089-2014, 2014.
Sullivan, B. W., Smith, W. K., Townsend, A. R., Nasto, M. K., Reed, S. C., Chazdon, R. L., and Cleveland, C. C.: Spatially robust estimates of biological nitrogen (N) fixation imply substantial human alteration of the tropical N cycle, P. Natl. Acad. Sci. USA, 111, 8101, https://doi.org/10.1073/pnas.1320646111, 2014.
Tapia, J., González, R., Townley, B., Oliveros, V., Álvarez, F., Aguilar, G., Menzies, A., and Calderón, M.: Geology and geochemistry of the Atacama Desert, Antonie van Leeuwenhoek Journal of Microbiology, 111, 1273–1291, https://doi.org/10.1007/s10482-018-1024-x, 2018.
Terrer, C., Vicca, S., Hungate, B. A., Phillips, R. P., and Prentice, I. C.: Mycorrhizal association as a primary control of the CO2 fertilization effect, Science, 353, 72–74, 2016.
Terrer, C., Jackson, R. B., Prentice, I. C., Keenan, T. F., Kaiser, C., Vicca, S., Fisher, J. B., Reich, P. B., Stocker, B. D., Hungate, B. A., eñuelas, J., McCallum, I., Soudzilovskaia, N. A., Cernusak, L. A., Talhelm, A. F., Van Sundert, K., Piao, S., Newton, P. C. D., Hovenden, M. J., Blumenthal, D. M., Liu, Y. Y., Müller, C., Winter, K., Field, C. B., Viechtbauer, W., Van Lissa, C. J., Hoosbeek, M. R., Watanabe, M., Koike, T., Leshyk, V. O., Wayne Polley, H. W., and Franklin, O.: Nitrogen and phosphorus constrain the CO2 fertilization of global plant biomass, Nat. Clim. Change, 9, 684–689, https://doi.org/10.1038/s41558-019-0545-2, 2019.
Thornton, P. E., Lamarque, J. F., Rosenbloom, N. A., and Mahowald, N. M.: Influence of carbon-nitrogen cycle coupling on land model response to CO2 fertilization and climate variability, Global Biogeochem. Cy., 21, 1–15, https://doi.org/10.1029/2006gb002868, 2007.
Tian, H., Chen, G., Lu, C., Xu, X., Ren, W., Zhang, B., Banger, K., Tao, B., Pan, S., Liu, M., Zhang, C., Bruhwiler, L., and Wofsy, S.: Global methane and nitrous oxide emissions from terrestrial ecosystems due to multiple environmental changes, Ecosystem Health and Sustainability, 1, 1–20, https://doi.org/10.1890/ehs14-0015.1, 2015.
Tian, H., Yang, J., Lu, C., Xu, R., Canadell, J. G., Jackson, R., Arneth, A., Chang, J., Chen, G., Ciais, P., Gerber, S., Ito, A., Huang, Y., Joos, F., Lienert, S., Messina, P., Olin, S., Pan, S., Peng, C., Saikawa, E., Thompson, R. L., Vuichard, N., Winiwarter, W., Zaehle, S., Zhang, B., Zhang, K., and Zhu, Q.: The global N2O Model Intercomparison Project (NMIP): Objectives, Simulation Protocol and Expected Products, Bull. Am. Meteorol. Soc., 99, 1231–1251, https://doi.org/10.1175/bams-d-17-0212.1, 2018.
Todd-Brown, K. E. O., Randerson, J. T., Post, W. M., Hoffman, F. M., Tarnocai, C., Schuur, E. A. G., and Allison, S. D.: Causes of variation in soil carbon simulations from CMIP5 Earth system models and comparison with observations, Biogeosciences, 10, 1717–1736, https://doi.org/10.5194/bg-10-1717-2013, 2013.
Trimmer, M., Chronopoulou, P.-M., Maanoja, S. T., Upstill-Goddard, R. C., Kitidis, V., and Purdy, K. J.: Nitrous oxide as a function of oxygen and archaeal gene abundance in the North Pacific, Nat. Commun., 7, 13451, https://doi.org/10.1038/ncomms13451, 2016.
van Groenigen, K. J., Osenberg, C. W., and Hungate, B. A.: Increased soil emissions of potent greenhouse gases under increased atmospheric CO2, Nature, 475, 214–216, 2011.
Vet, R., Artz, R. S., Carou, S., Shaw, M., Ro, C.-U., Aas, W., Baker, A., Bowersox, V. C., Dentener, F., Galy-Lacaux, C., Hou, A., Pienaar, J. J., Gillett, R., Forti, M. C., Gromov, S., Hara, H., Khodzher, T., Mahowald, N. M., Nickovic, S., Rao, P. S. P., and Reid, N. W.: A global assessment of precipitation chemistry and deposition of sulfur, nitrogen, sea salt, base cations, organic acids, acidity and pH, and phosphorus, Atmo. Environ., 93, 3–100, https://doi.org/10.1016/j.atmosenv.2013.10.060, 2014.
Vitousek, P. M. and Hobbie, S.: Heterotrophic nitrogen fixation in decomposing litter: Patterns and regulation, Ecology, 81, 2366–2376, https://doi.org/10.2307/177460, 2000.
Vitousek, P. M., Porder, S., Houlton, B. Z., and Chadwick, O. A.: Terrestrial phosphorus limitation: mechanisms, implications, and nitrogen–phosphorus interactions, Ecol. Appl., 20, 5–15, https://doi.org/10.1890/08-0127.1, 2010.
Vitousek, P. M., Menge, D. N. L., Reed, S. C., and Cleveland, C. C.: Biological nitrogen fixation: rates, patterns and ecological controls in terrestrial ecosystems, Philos. T. R. Soc. B, 368, 1–9, 2013.
Walker, A. P., Zaehle, S., Medlyn, B. E., De Kauwe, M. G., Asao, S., Hickler, T., Parton, W., Ricciuto, D. M., Wang, Y.-P., Wårlind, D., and Norby, R. J.: Predicting long-term carbon sequestration in response to CO2 enrichment: How and why do current ecosystem models differ?, Global Biogeochem. Cy., 29, 476–495, https://doi.org/10.1002/2014gb004995, 2015.
Wang, Y., Guo, J., Vogt Rolf, D., Mulder, J., Wang, J., and Zhang, X.: Soil pH as the chief modifier for regional nitrous oxide emissions: New evidence and implications for global estimates and mitigation, Glob. Change Biol., 24, e617–e626, https://doi.org/10.1111/gcb.13966, 2017.
Wang, Y. P. and Houlton, B. Z.: Nitrogen constraints on terrestrial carbon uptake: Implications for the global carbon-climate feedback, Geophys. Res. Lett., 36, 1–5, https://doi.org/10.1029/2009gl041009, 2009.
Wania, R., Ross, I., and Prentice, I. C.: Integrating peatlands and permafrost into a dynamic global vegetation model: 1. Evaluation and sensitivity of physical land surface processes, Global Biogeochem. Cy., 23, GB3014, https://doi.org/10.1029/2008gb003412, 2009.
Wania, R., Ross, I., and Prentice, I. C.: Implementation and evaluation of a new methane model within a dynamic global vegetation model: LPJ-WHyMe v1.3.1, Geosci. Model Dev., 3, 565–584, https://doi.org/10.5194/gmd-3-565-2010, 2010.
Wanner, H., Beer, J., Bütikofer, J., Crowley, T. J., Cubasch, U., Flückigere, J., Goosse, H., Grosjean, M., Joos, F., Kaplan, J. O., Küttel, M., Mueller, S. A., Prentice, C., Solomina, O., Stocker, T. F., Tarasov, P., Wagner, M., and Widmann, M.: Mid- to late Holocene climate change – an overview, Quaternary Sci. Rev., 27, 1791–1828, 2008.
Weier, K. L., Doran, J. W., Power, J. F., and Walters, D. T.: Denitrification and the Dinitrogen/Nitrous Oxide Ratio as Affected by Soil Water, Available Carbon, and Nitrate, Soil Sci. Soc. Am. J., 57, 66–72, https://doi.org/10.2136/sssaj1993.03615995005700010013x, 1993.
Wells, K. C., Millet, D. B., Bousserez, N., Henze, D. K., Griffis, T. J., Chaliyakunnel, S., Dlugokencky, E. J., Saikawa, E., Xiang, G., Prinn, R. G., O'Doherty, S., Young, D., Weiss, R. F., Dutton, G. S., Elkins, J. W., Krummel, P. B., Langenfelds, R., and Steele, L. P.: Top-down constraints on global N2O emissions at optimal resolution: application of a new dimension reduction technique, Atmos. Chem. Phys., 18, 735–756, https://doi.org/10.5194/acp-18-735-2018, 2018.
Werner, C., Butterbach-Bahl, K., Haas, E., Hickler, T., and Kiese, R.: A global inventory of N2O emissions from tropical rainforest soils using a detailed biogeochemical model, Global Biogeochem. Cy., 21, 1–18, https://doi.org/10.1029/2006gb002909, 2007.
Wieder, W. R., Cleveland, C. C., Lawrence, D. M., and Bonan, G. B.: Effects of model structural uncertainty on carbon cycle projections: biological nitrogen fixation as a case study, Environ. Res. Lett., 10, 1–9, 044016, https://doi.org/10.1088/1748-9326/10/4/044016, 2015a.
Wieder, W. R., Cleveland, C. C., Smith, W. K., and Todd-Brown, K.: Future productivity and carbon storage limited by terrestrial nutrient availability, Nat. Geosci., 8, 441–444, https://doi.org/10.1038/ngeo2413, 2015b.
Wrage, N., Velthof, G. L., van Beusichem, M. L., and Oenema, O.: Role of nitrifier denitrification in the production of nitrous oxide, Soil Biol. Biochem., 33, 1723–1732, https://doi.org/10.1016/S0038-0717(01)00096-7, 2001.
Wurzburger, N. and Hedin, L. O.: Taxonomic identity determines N2 fixation by canopy trees across lowland tropical forests, Ecol. Lett., 19, 62–70, https://doi.org/10.1111/ele.12543, 2016a.
Wurzburger, N. and Hedin, L. O.: Corrigendum for Wurzburger and Hedin (2016), Ecol. Lett., 19, 587–590, https://doi.org/10.1111/ele.12592, 2016b.
Xu-Ri and Prentice, I. C.: Terrestrial nitrogen cycle simulation with a dynamic global vegetation model, Glob. Change Biol., 14, 1745–1764, https://doi.org/10.1111/j.1365-2486.2008.01625.x, 2008.
Xu-Ri, Prentice, I. C., Spahni, R., and Niu, H. S.: Modelling terrestrial nitrous oxide emissions and implications for climate feedback, New Phytol., 196, 472–488, 2012.
Xu-Ri and Prentice, I. C.: Modelling the demand for new nitrogen fixation by terrestrial ecosystems, Biogeosciences, 14, 2003–2017, https://doi.org/10.5194/bg-14-2003-2017, 2017.
Xu, R., Tian, H., Lu, C., Pan, S., Chen, J., Yang, J., and Zhang, B.: Preindustrial nitrous oxide emissions from the land biosphere estimated by using a global biogeochemistry model, Clim. Past, 13, 977–990, https://doi.org/10.5194/cp-13-977-2017, 2017.
Zaehle, S.: Terrestrial nitrogen–carbon cycle interactions at the global scale, Philos. T. R. Soc. B, 368, 1–9, https://doi.org/10.1098/rstb.2013.0125, 2013.
Zaehle, S. and Friend, A. D.: Carbon and nitrogen cycle dynamics in the O-CN land surface model: 1. Model description, site-scale evaluation, and sensitivity to parameter estimates, Global Biogeochem. Cy., 24, 1–9, https://doi.org/10.1029/2009GB003521, 2010a.
Zaehle, S., Medlyn, B. E., De Kauwe, M. G., Walker, A. P., Dietze, M. C., Hickler, T., Luo, Y., Wang, Y.-P., El-Masri, B., Thornton, P., Jain, A., Wang, S., Warlind, D., Weng, E., Parton, W., Iversen, C. M., Gallet-Budynek, A., McCarthy, H., Finzi, A., Hanson, P. J., Prentice, I. C., Oren, R., and Norby, R. J.: Evaluation of 11 terrestrial carbon–nitrogen cycle models against observations from two temperate Free-Air CO2 Enrichment studies, New Phytol., 202, 803–822, https://doi.org/10.1111/nph.12697, 2014.
Zhong, L., Bowatte, S., Newton, P. C. D., Hoogendoorn, C. J., and Luo, D.: An increased ratio of fungi to bacteria indicates greater potential for N2O production in a grazed grassland exposed to elevated CO2, Agr. Ecosyst. Environ., 254, 111–116, https://doi.org/10.1016/j.agee.2017.11.027, 2018.
Zhu, Q., Riley, W. J., Tang, J., and Koven, C. D.: Multiple soil nutrient competition between plants, microbes, and mineral surfaces: model development, parameterization, and example applications in several tropical forests, Biogeosciences, 13, 341–363, https://doi.org/10.5194/bg-13-341-2016, 2016.
Zhu, Q., Riley, W. J., and Tang, J.: A new theory of plant–microbe nutrient competition resolves inconsistencies between observations and model predictions, Ecol. Appl., 27, 875–886, https://doi.org/10.1002/eap.1490, 2017.
Zhuang, Q., Lu, Y., and Chen, M.: An inventory of global N2O emissions from the soils of natural terrestrial ecosystems, Atmos. Environ., 47, 66–75, https://doi.org/10.1016/j.atmosenv.2011.11.036, 2012.
Zickfeld, K., Eby, M., Weaver, A. J., Crespin, E., Fichefet, T., Goosse, H., Edwards, N. R., Holden, P. B., Eliseev, A. V., Mokhov, I. I., Feulner, G., Kienert, H., Perrette, M., Schneider von Deimling, T., Forest, C. E., Joos, F., Spahni, R., Steinacher, M., Kawamiya, M., Tachiiri, K., Kicklighter, D., Monier, E., Schlosser, A., Sokolov, A. P., Matsumoto, K., Tokos, K., Olsen, S. M., Pedersen, J. O. P., Shaffer, G., Ridgwell, A., Zeng, N., and Zhao, F.: Long-term Climate Change Commitment and Reversibility: An EMIC Intercomparison, J. Clim., 26, 5782–5809, https://doi.org/10.1175/JCLI-D-12-00584.1, 2013.
Zürcher, S., Spahni, R., Joos, F., Steinacher, M., and Fischer, H.: Impact of an abrupt cooling event on interglacial methane emissions in northern peatlands, Biogeosciences, 10, 1963–1981, https://doi.org/10.5194/bg-10-1963-2013, 2013.
- Abstract
- Introduction
- Introduction to N2O, terrestrial nitrogen and carbon flows
- Methods
- Reconstructed terrestrial N2O emissions and implications
- Transient simulations of terrestrial N2O emissions and the C–N cycle over the past 21 000 years
- Discussion
- Conclusions
- Appendix A: Difference between LPX-Bern v1.4 and LPX-Bern v1.4N
- Data availability
- Author contributions
- Competing interests
- Acknowledgements
- Financial support
- Review statement
- References
- Supplement
Please read the editorial note first before accessing the article.
- Article
(11828 KB) - Full-text XML
- Editorial note
- Companion paper
-
Supplement
(2025 KB) - BibTeX
- EndNote
- Abstract
- Introduction
- Introduction to N2O, terrestrial nitrogen and carbon flows
- Methods
- Reconstructed terrestrial N2O emissions and implications
- Transient simulations of terrestrial N2O emissions and the C–N cycle over the past 21 000 years
- Discussion
- Conclusions
- Appendix A: Difference between LPX-Bern v1.4 and LPX-Bern v1.4N
- Data availability
- Author contributions
- Competing interests
- Acknowledgements
- Financial support
- Review statement
- References
- Supplement