the Creative Commons Attribution 4.0 License.
the Creative Commons Attribution 4.0 License.
 | 06 Jul 2020
A decade of methane measurements at the Boknis Eck Time Series Station in Eckernförde Bay (southwestern Baltic Sea)
Xiao Ma
Mingshuang Sun
Sinikka T. Lennartz
Hermann W. Bange
Coastal areas contribute significantly to the emissions of methane (CH4) from the ocean. In order to decipher its temporal variability in the whole water column, dissolved CH4 was measured on a monthly basis at the Boknis Eck Time Series Station (BE) located in Eckernförde Bay (SW Baltic Sea) from 2006 to 2017. BE has a water depth of about 28 m, and dissolved CH4 was measured at six water depths ranging from 0 to 25 m. In general, CH4 concentrations increased with depth, indicating a sedimentary release of CH4. Pronounced enhancement of the CH4 concentrations in the bottom layer (15–25 m) was found during February, May–June and October. CH4 was not correlated with Chlorophyll a or O2 over the measurement period. Unusually high CH4 concentrations (of up to 696 nM) were sporadically observed in the upper layer (0–10 m; e.g., in November 2013 and December 2014) and coincided with major Baltic inflow (MBI) events. Surface CH4 concentrations were always supersaturated throughout the monitoring period, indicating that Eckernförde Bay is an intense but highly variable source of atmospheric CH4. We did not detect significant temporal trends in CH4 concentrations or emissions, despite ongoing environmental changes such as warming and deoxygenation in Eckernförde Bay. Overall, the CH4 variability at BE is driven by a complex interplay of various biological and physical processes.


Methane (CH4) is an atmospheric trace gas which contributes significantly to global warming (IPCC, 2013) and the evolution of stratospheric ozone (WMO, 2018). Atmospheric CH4 mole fractions have been increasing by about 150 % since the industrial revolution (IPCC, 2013).
The oceanic release of CH4 to the atmosphere plays a minor role in the global atmospheric CH4 budget (Saunois et al., 2016). However, coastal areas have been identified as hotspots of CH4 emissions (see e.g., Bange et al., 1994; Upstill-Goddard et al., 2000; Borges et al., 2016). Dissolved CH4 in coastal waters mainly results from the interplay of (i) sedimentary sources such as anaerobic methanogenesis during the decomposition of organic matter (Xiao et al., 2018; Dale et al., 2019) or seepage from oil and natural gas reservoirs (Bernard et al., 1976; Hovland et al., 1993; Judd et al., 2002) and (ii) microbial CH4 consumption which occurs under oxic conditions in the water column and under anoxic conditions in the sediments (Pimenov et al., 2013; Steinle et al., 2017; Egger et al., 2018). Only recently, Weber et al. (2019) estimated the global oceanic CH4 emissions to range from 6 to 12 Tg yr−1, of which about 0.8–3.8 Tg yr−1 was attributed to coastal waters. Occasional studies of the CH4 production and consumption pathways in coastal waters and the associated CH4 emissions to the atmosphere have received increasing attention during the last few decades (Bange et al., 1994; Reeburgh, 2007; Naqvi et al., 2010). However, time-series measurements of CH4 which would allow for identifying short- and long-term trends in view of the ongoing environmental changes in coastal regions (such as eutrophication, warming and deoxygenation) are still sparse. In this paper we present the monthly measurements of CH4 from a time-series station in Eckernförde Bay (Baltic Sea) during 2006–2017.
Due to severe eutrophication, sediments in Eckernförde Bay receive large amounts of organic matter (Smetacek et al., 1987; Oris et al., 1996; Nittrouer et al., 1998) and thus are active sites of CH4 formation (Schmaljohann, 1996; Whiticar, 2002; Treude et al., 2005; Maltby et al., 2018). Seasonal and inter-annual CH4 variations in concentration, saturation and air–sea flux density were investigated for more than a decade. The aim of this study was to assess the seasonal dynamics of and the environmental controls on CH4 variability in Eckernförde Bay which is affected by high nutrient concentrations, increasing water temperatures and ongoing loss of dissolved oxygen (Lennartz et al., 2014).
The Boknis Eck Time Series Station (BE) is one of the oldest continuously conducted marine time-series stations in the world. The first sampling took place in 1957 and has been conducted on a monthly base with only minor interruptions since then (Lennartz et al., 2014). It is situated in Eckernförde Bay in the southwestern (SW) Baltic Sea, with a depth of approximately 28 m (Fig. 1). The sediments in the Bay are characterized by a high organic matter load and sedimentation rate (Orsi et al., 1996; Whiticar, 2002), which is closely associated with the spring and autumn algae blooms (Smetacek, 1985).
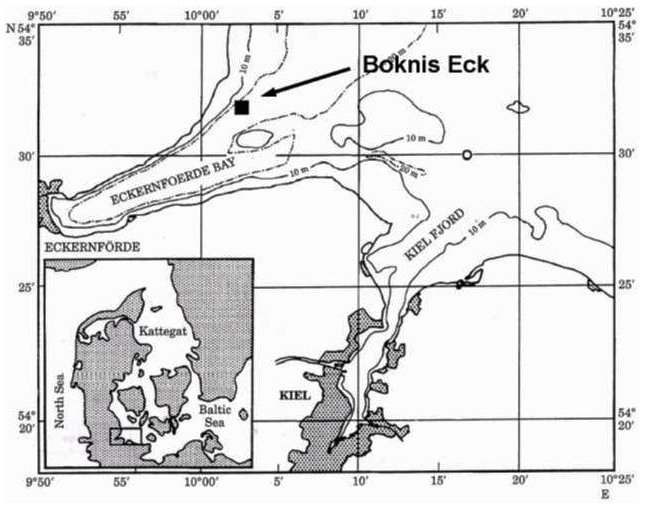
Figure 1Location (black square) of the Boknis Eck Time Series Station in Eckernförde Bay, southwestern Baltic Sea (from Hansen et al., 1999).
The Baltic Sea has only a limited water exchange with the North Sea through the Kattegat, which makes this area very sensitive to climate change and anthropogenic impacts. As a result of global warming, the increasing trend for the global sea surface (<75 m) temperatures (SSTs) was about 0.11 ∘C per decade (IPCC, 2013), while a net SST increase of 1.35 ∘C was observed in the Baltic Sea during 1982–2006, which is one of the most rapid temperature increments in large marine ecosystems (Belkin, 2009). Lennartz et al. (2014) reported a warming trend of up to 0.2 ∘C per decade at BE for the period of 1957–2013. Nutrients in the Baltic Sea had been increasing until the 1980s as a result of intensive agricultural and industrial activities and then started to decline due to effective wastewater control (HELCOM, 2018). However, hypoxia and anoxia have been increasing in the Baltic Sea during the past several decades (Conley et al., 2011; Carstensen et al., 2014). Similar trends in nutrients and O2 were also detected at BE (Lennartz et al., 2014), indicating that Eckernförde Bay is representative of the biogeochemical setting of the SW Baltic Sea. In concert with the declining nutrient concentrations, Chlorophyll a concentrations at BE were declining as well (Lennartz et al., 2014).
Located close to the bottleneck of the water exchange between the North Sea and the Baltic Sea, BE is also sensitive to hydrographic fluctuations such as inflows of saline North Sea water. There is no riverine input to Eckernförde Bay, and thus, the saline water inflow from the North Sea plays a dominant role in the hydrographic setting at BE. Because the inflowing North Sea water has a higher salinity compared to Baltic Sea water, a pronounced summer stratification occurs which leads to the development of a pycnocline at about a 15 m water depth. The seasonal stratification occurs usually from mid-March until mid-September. During this period, vertical mixing is restricted and bacterial decomposition of organic material in the deep layer causes pronounced hypoxia and sporadically occurring anoxia during late summer (Lennartz et al., 2014). Pronounced phytoplankton blooms occur regularly in autumn (September–November) and spring (February–March) and to a lesser extent during summer (July–August; Smetacek et al., 1985).
3.1 Sample collection and measurement
Monthly sampling of CH4 from BE started in June 2006. Seawater was collected from six depths (1, 5, 10, 15, 20 and 25 m) with 5 L Niskin bottles mounted on a CTD rosette. Brown glass vials of 20 mL were filled in triplicates without any bubbles. The vials were sealed immediately with rubber stoppers and aluminum caps. These samples were poisoned with 50 µL of saturated aqueous mercury chloride (HgCl2) solution as soon as possible and then stored in a cool, dark place until measurement. The storage time of the samples before the measurements was less than 3 months.
A static headspace-equilibrium method was adopted for the CH4 measurements. A 10 mL helium (99.9999 %, Air Liquide, Düsseldorf, Germany) headspace was created inside the vial with a gas-tight syringe (VICI Precision Sampling, Baton Rouge, LA, USA). The sample was vibrated with a vortex mixer (G560E, Scientific Industries Inc., NY, USA) for approximately 20 s and then left for at least 2 h to reach the CH4 equilibrium between air and water phases. A 9.5 mL subsample of headspace was injected into a gas chromatograph equipped with a flame ionization detector (GC-FID; Hewlett-Packard 5890 Series II, Agilent Technologies, Santa Clara, CA, USA). Separation took place on a packed column (stainless steel, 1.8 m length, packed with Molsieve 5A, Grace, Columbia, Maryland, USA). Standard gas mixtures with varying mole fractions of CH4 in synthetic air (Deuste Steininger GmbH, Mühlhausen, Germany, and Westfalen AG, Münster, Germany) were used daily to calibrate the response of the FID before measurements. The concentrations of standard gases were adjusted for every measurement to make sure that the values of the samples fall in the range of the calibration curves. The standard gas mixtures were calibrated against NOAA primary gas standard mixtures in the laboratory of the Max Planck Institute for Biogeochemistry in Jena, Germany. Further details about the measurements and calculations of the dissolved CH4 concentration can be found in Bange et al. (2010). The mean precision of the CH4 measurements, calculated as the median of the estimated standard errors (see David, 1951) from all triplicate measurements, was ±1.3 nM. Samples with an estimated standard error of >10 % were omitted. Dissolved O2 concentrations were measured with Winkler titrations, and Chlorophyll a concentrations were measured with a fluorometer (Grasshoff et al., 1999). Secchi depth was measured with a white disk (∼30 cm in diameter). Sea levels were measured at Kiel-Holtenau, which is about 15 km away from BE (http://www.boos.org/, last access: 2 July 2020). A more comprehensive overview of temperature, salinity, dissolved O2 and Chlorophyll a as well as other parameters at BE can be found in Lennartz et al. (2014).
3.2 Calculation of saturation and air–sea flux density
The CH4 saturation (; %) was calculated as
where CH4,obs and CH4 eq. are the observed and equilibrium concentrations of CH4 in seawater, respectively. CH4 eq. was calculated with the in situ temperature and salinity of seawater (Wiesenburg and Guinasso, 1979) and the dry mole fraction of atmospheric CH4 at the time of sampling, which was derived from the monthly atmospheric CH4 data measured at Mace Head, Ireland (AGAGE, http://agage.mit.edu/, last access: 2 July 2020).
The air–sea CH4 flux density (; µmol m−2 d−1) was calculated as
where k (cm h−1) is the gas transfer velocity calculated with the equation given by Nightingale et al. (2000), as a function of the wind speed and the Schmidt number (Sc). Sc was computed with the empirical equations for the kinematic viscosity of seawater (Siedler and Peters, 1986) and the diffusion coefficients of CH4 in water (Jähne et al., 1987). Wind speed data were recorded at Kiel Lighthouse (https://www.geomar.de/service/wetter/, last access: 2 July 2020), which is approximately 20 km away from BE. The wind speeds were normalized to the height of 10 m (u10) with the method given by Hsu et al. (1994).
4.1 Seasonal variations in environmental parameters and dissolved CH4
Seasonal hypoxia was observed every year at BE during 2006–2017 (Fig. 2). O2 depletion was detected in the bottom layer (∼15–25 m) during July–October with minimum O2 concentrations usually occurring in September (Fig. 3). Lennartz et al. (2014) found a significant decrease in dissolved O2 concentrations in the bottom water at BE over the past several decades and suggested that temperature-enhanced O2 consumption and a prolonged stratification period might be the causes of deoxygenation. Anoxia with the presence of hydrogen sulfide (H2S, identified from the strong smell) in the period of concurrent CH4 measurements was found in the autumn of 2007, 2014 and 2016. The anoxic event in 2016 lasted from September until November and was the longest ever recorded at BE. In September 2017, a pronounced undersaturation of O2 (∼50 %) was observed in surface water (Fig. 2). The low temperature together with enhanced salinity in the surface water in September 2017 suggests the occurrence of an upwelling event, which transported O2-depleted and colder bottom waters to the surface. An upwelling signal was also present in the nutrient concentrations (not shown) but was less pronounced than in temperature and dissolved O2 concentrations. Similar events were also detected in September 2011 and 2012.
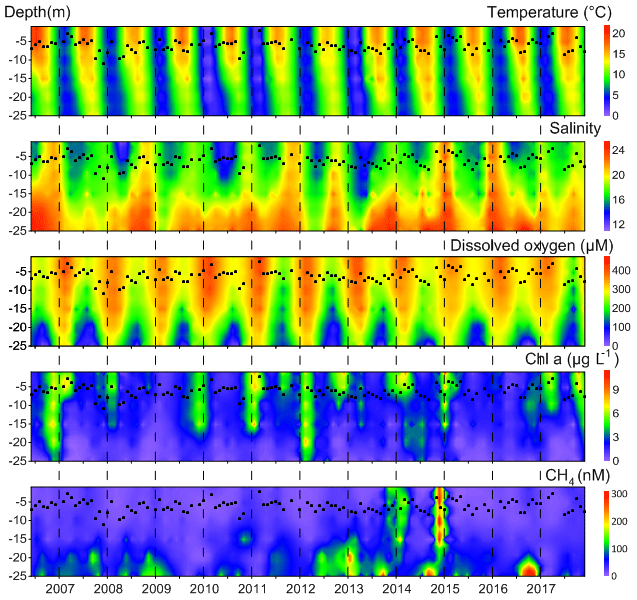
Figure 2Distributions of temperature, salinity, dissolved O2, Chlorophyll a and CH4 at BE during 2006–2017. Black dots indicate the monthly measurements of Secchi depth. To get a better visualization, the maximum color bar for CH4 concentration is 300 nM, but some of the actual concentrations are higher (for example, in December 2014 and in autumn 2016).
Enhanced Chlorophyll a concentrations, which can be used to indicate phytoplankton blooms, were usually observed in spring or autumn but not in every year (Fig. 2). Seasonal variations in Chlorophyll a concentrations were generally consistent with the annual plankton succession reported by Smetacek (1985). During 2006–2017, high Chlorophyll a concentrations were usually found in the upper layers in March (Fig. 3), which is different from the seasonality during 1960–2013 when, on average, high concentrations occupied the whole water column (Lennartz et al., 2014). Another difference is that no prevailing “winter dormancy” of biological activity was observed: Chlorophyll a concentrations usually remained high throughout the autumn–spring period. In November and December 2006 and March 2012, when high Chlorophyll a concentrations were observed all over the water column, nutrients and temperature were generally higher. Although the overall correlation between Chlorophyll a and nutrients (; r2=0.01, p<0.01, n=674) or temperature (r2=0.02, p<0.0001, n=671) is poor, nutrients or temperature might be potential environmental controls on Chlorophyll a distribution. As a proxy for water transparency, the Secchi depth was lowest in March indicating a high turbidity, coincident with the Chlorophyll a maximum. Chlorophyll a concentrations and Secchi depths have been decreasing over the past decades in the Baltic Sea (Sandén and Håkansson, 1996; Fleming-Lehtinen and Laamanen, 2012; Lennartz et al., 2014), but this trend cannot be identified from the median slope at BE during 2006–2017.
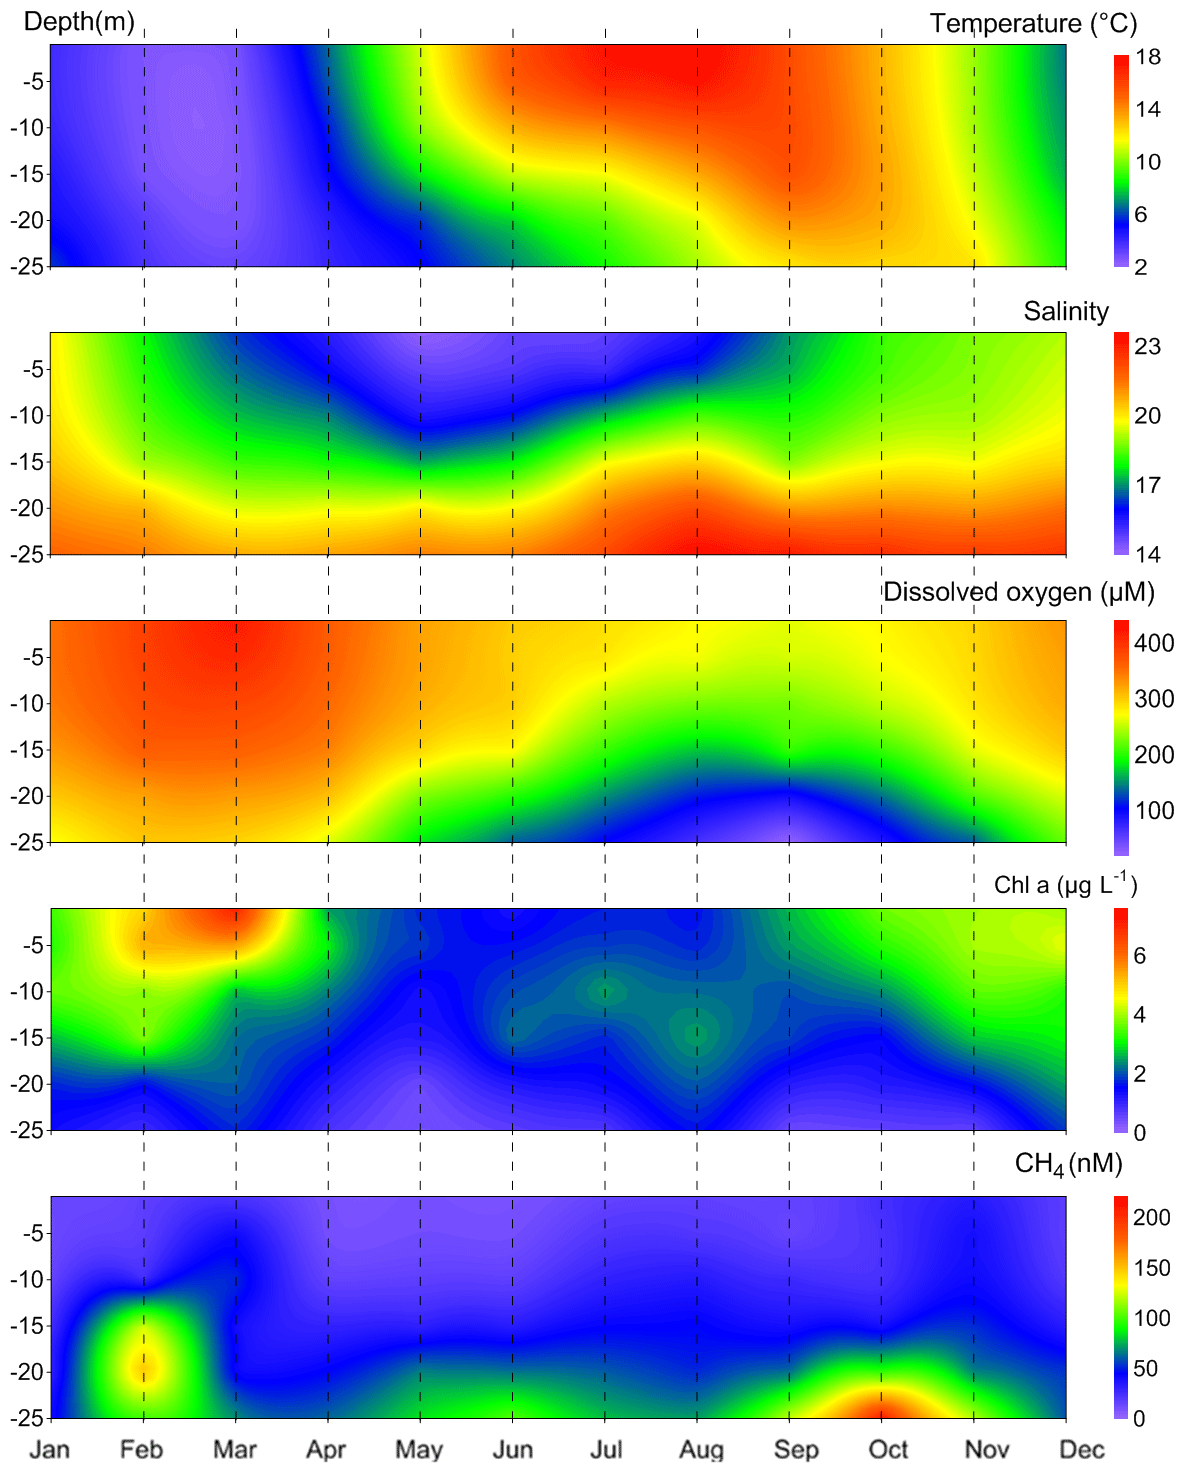
Figure 3Mean seasonal variations in temperature, salinity, dissolved O2, Chlorophyll a and CH4 at BE during 2006–2017. CH4 concentrations in December 2014 were excluded in plotting.
CH4 concentrations at BE showed strong seasonal and inter-annual variability (Fig. 2, Table 1). During 2006–2017, dissolved CH4 concentrations ranged between 2.9 and 695.6 nM, with an average of 51.2±84.2 nM. High concentrations were generally observed in the bottom layer (∼15–25 m). Enhanced CH4 concentrations were mainly observed during February, May–June and October (Fig. 3). Steinle et al. (2017) measured aerobic CH4 oxidation at BE and found that the lowest rates occurred in winter, which might be one of the reasons for the enhanced CH4 concentrations in February.
The CH4 accumulation in May and June can be linked to enhanced methanogenesis fueled by organic matter from the spring algae bloom. Capelle et al. (2019) found a positive correlation between mean monthly CH4 concentrations and Chlorophyll a concentrations in the upper layers of time-series measurements from Saanich Inlet. Bange et al. (2010) also reported correlations between seasonal CH4 variation and Chlorophyll a or Secchi depth, albeit with a time lag of 1 month, at BE during 2006–2008. Although we did not detect such relationships for the extended measurements during 2006–2017, in 2009 and 2016, when no spring algae blooms were detected, CH4 concentrations in the following summer months were lower than average (Fig. 2).
Maximum CH4 concentrations were usually observed in October, at the end of the seasonal hypoxia (Fig. 3). Due to the long-lasting anoxic event, strong CH4 accumulations were observed in autumn 2016 (∼600 nM), which are the highest in the bottom layer during 2006–2017. Prevailing for several months, the depletion of bottom O2 concentrations exerts a strong influence on the underlying sediment. Maltby et al. (2018) detected a shoaling of the sulfate reduction zone in autumn and enhanced methanogenesis in the sediments at BE. Reindl and Bolalek (2012) found similar variations in sedimentary CH4 release in the coastal Baltic Sea. In situ production in the anoxic bottom water might be a potential CH4 source as well (Scranton and Farrington, 1977; Levipan et al., 2007). We, therefore, suggest that the accumulation of CH4 in the bottom water in October is caused by its release from the sediments and in situ production in the overlying water column in combination with the pronounced water column stratification during autumn which prevents ventilation of CH4 to the surface layer.
Table 1Annual mean (arithmetic average ± standard deviation) of water temperature, salinity, wind speed and dissolved CH4 concentrations at BE during 2006–2017. Water temperatures, salinity and CH4 concentrations were averaged over the water column (0–25 m). Wind speeds were recorded at Kiel Lighthouse.
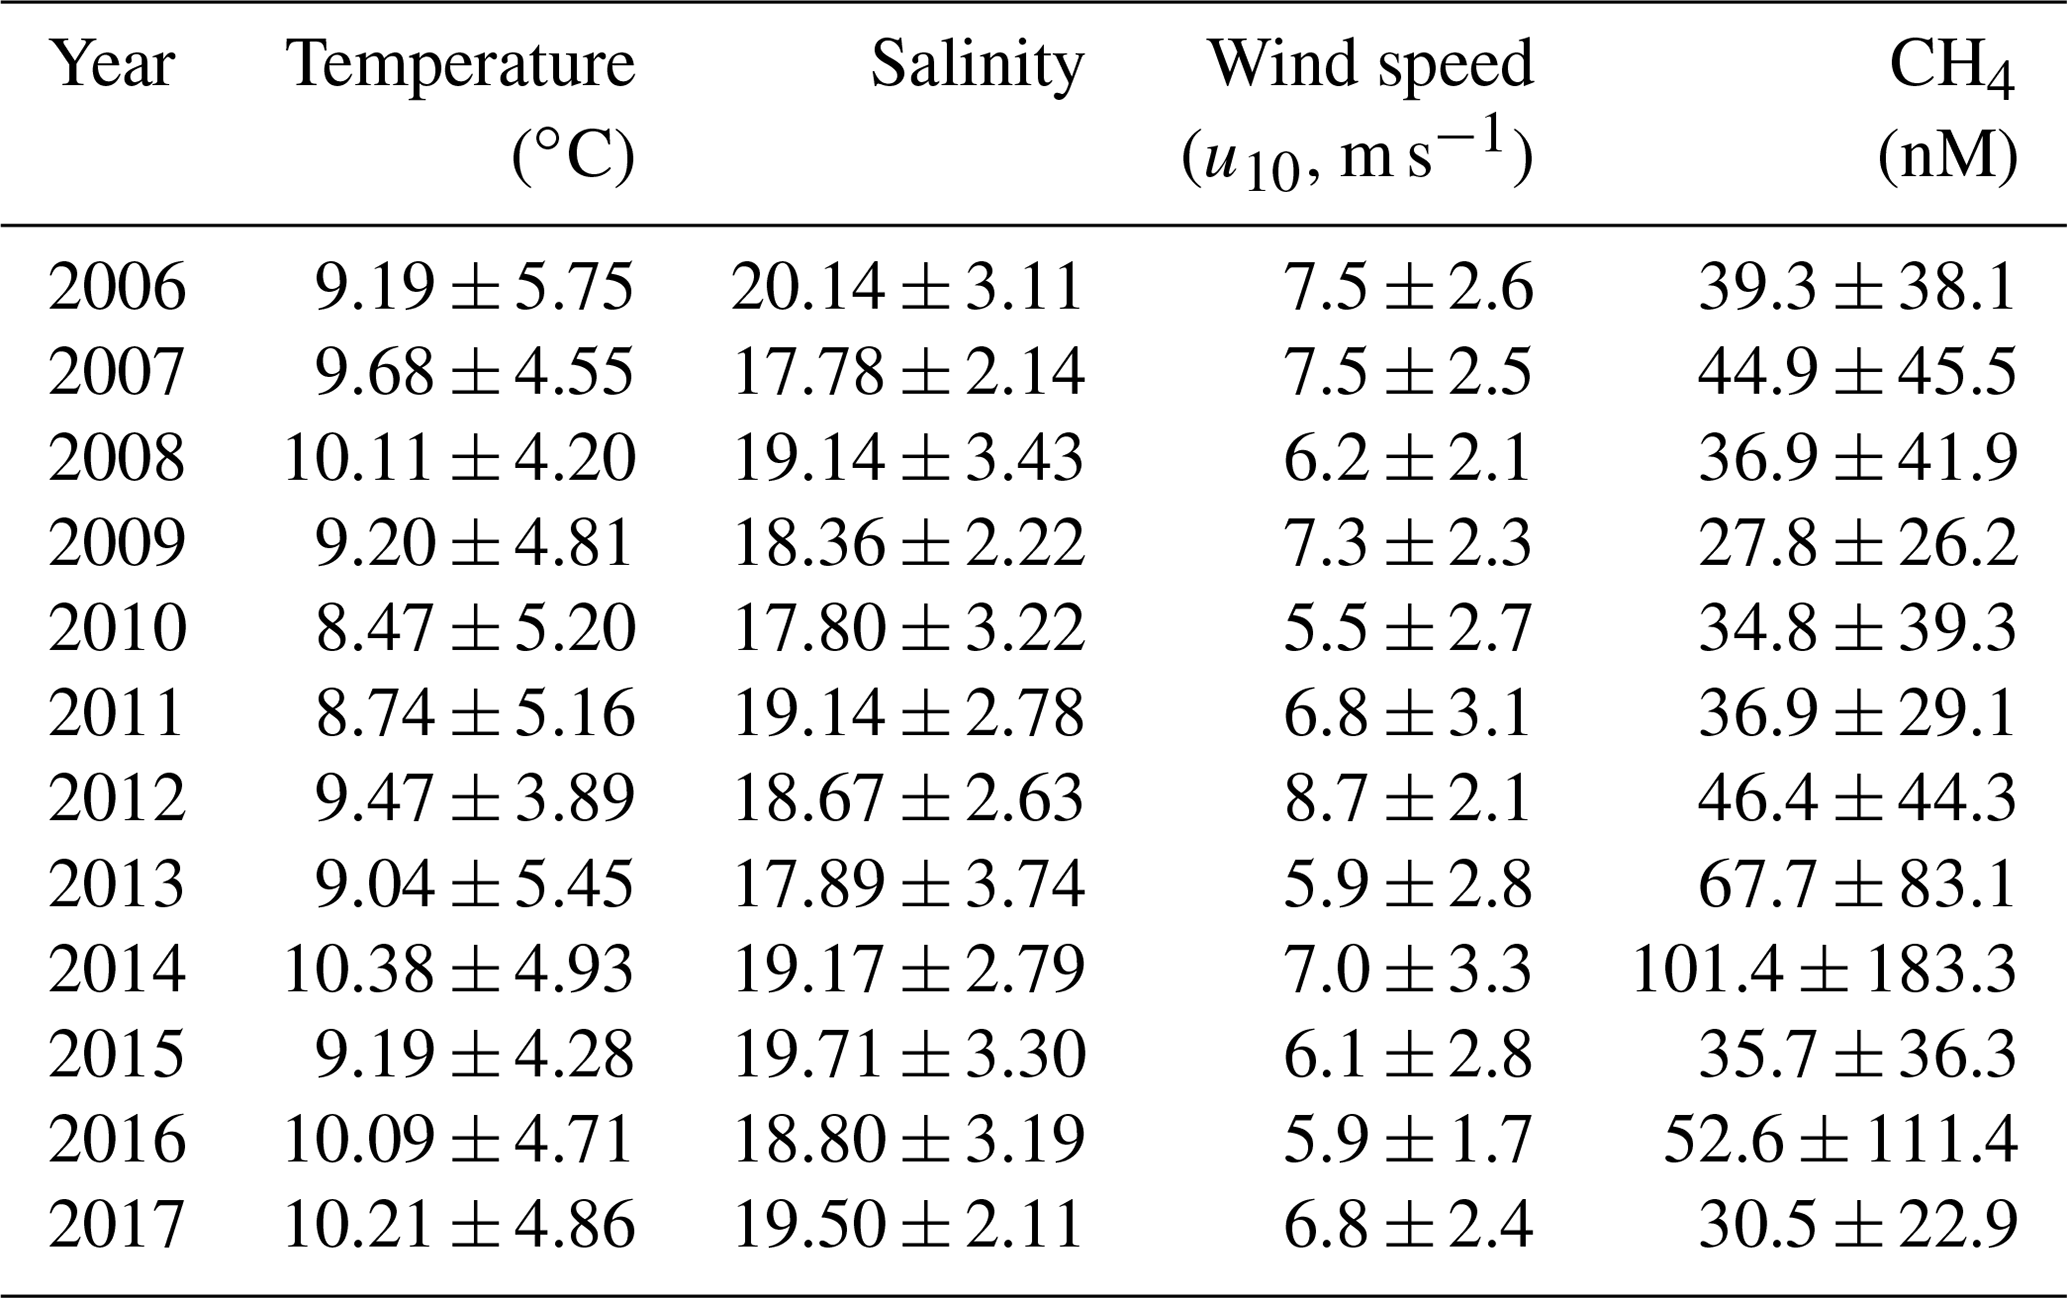
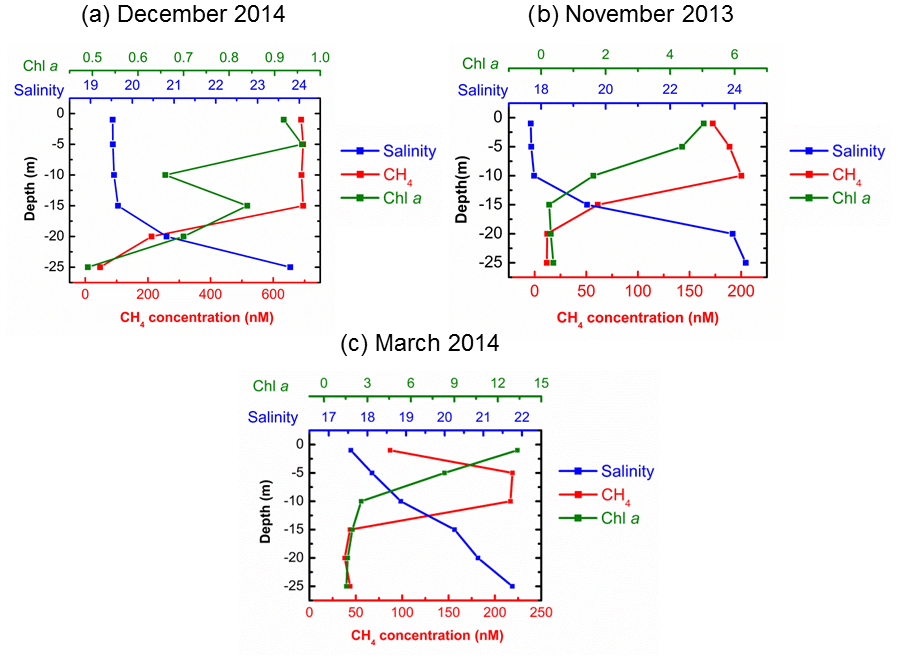
Figure 4Vertical distribution of Chlorophyll a, salinity and CH4 concentrations in the water column in December 2014 (a), November 2013 (b) and March 2014 (c).
4.2 Enhanced CH4 concentrations in the upper water layer
In agreement with Schmale et al. (2010) and Bange et al. (2010), we found that CH4 concentrations generally increase with water depth, indicating a prevailing release of CH4 from the sediments into the water column in the Baltic Sea (see Sect. 4.1). Nonetheless, unusual high CH4 concentrations in the upper layers were detected sporadically at BE during 2006–2017 (Fig. 2). In November 2013 and March 2014, average CH4 concentrations in the upper waters were 187.2±13.9 nM (1–10 m) and 217.8±1.4 nM (5–10 m), which are about 16 and 5 times higher than those found in the bottom layers, respectively (Fig. 4). The most striking event occurred in December 2014, when CH4 concentrations in the upper layer (1–15 m) were as high as 692.6±3.4 nM (19 890±115 %), whereas dissolved CH4 in the bottom layer (20–25 m) was ∼50 nM. The surface CH4 concentration in December 2014 was the highest observed during 2006–2017. In December 2014, a major Baltic inflow (MBI) event occurred, carrying large amounts of saline and oxygenated water from the North Sea into the Baltic Sea (Mohrholz et al., 2015). Dissolved CH4 concentrations in the surface North Sea were much lower than in Eckernförde Bay (Bange et al., 1994; Rehder et al., 1998), and therefore a direct CH4 contribution from the North Sea by oxygenated waters seems unlikely. We hypothesize that this inflow substituted the lower part of the water column which had high CH4 concentration throughout the water depth before, as opposed to, e.g., an in situ production of CH4 at the surface being responsible for the observed concentration profile anomaly. The MBI is the third-strongest event ever recorded, and an unusual outflow period was detected in Eckernförde Bay: sea levels declined from mid-November, reached a minimum on 10 December and then began to increase with the inflow (Fig. 5). The sampling at BE took place on 16 December, during the main inflow period. Extreme weather conditions (wind speed >15 m s−1) were observed several days before the sampling date, and storm-generated waves and currents could have affected the sediment structures in Eckernförde Bay (Oris et al., 1996). Currents across the seabed can result in pressure gradients that drive porewater flow within the permeable sediments (Ahmerkamp et al., 2015), which might be a potential CH4 source. Sediment resuspension might also contribute to enhanced CH4 release, but we did not observe a significant decline in Secchi depths in December 2014 (Fig. 2). The significant decrease in sea level alleviated the static pressure on the sediments. Enhanced CH4 release from the sediments, via gas bubbles or exchange from porewater, may have led to the accumulation of CH4 in the water column. Similar hydrostatic pressure effects were also reported in tidal systems such as mangrove creeks and estuaries (see e.g., Barnes et al., 2006; Maher et al., 2015; Sturm et al., 2017). Atmospheric pressure also contributes to the overall pressure on the sediments, but it is not recorded at BE and thus was omitted. Although the water level fluctuation of ±1 m (Fig. 5) seems rather small compared to the water depth (28 m), it might exert a strong influence on the sediments. Water level fluctuation, when there was no strong wind or inflow event, was approximately ±0.2 m in Eckernförde Bay. Lohrberg et al. (2020) detected a change in water level (±0.5 m) and air pressure (±1500 Pa, equivalent to approximately ±0.15 m of water level fluctuation) during a weak storm in the autumn of 2014. The fluctuation in hydrostatic pressure induced a pronounced CH4 ebullition event in Eckernförde Bay, and a sedimentary CH4 flux of 1916 µmol m−2 d−1 was estimated (Lohrberg et al., 2020). This value is generally in good agreement with the sharp increase in the sea-to-air CH4 fluxes in December 2014 (see Sect. 4.3). The outflow period of the MBI in 2014 lasted for almost a month, and bulk ebullitions and supersaturated water with CH4 could be anticipated. During the inflow period, large amounts of North Sea water flooded into Eckernförde Bay and presumably pushed the CH4-enriched water to the surface. A negative correlation was found between salinity and CH4 concentration in the water column (Fig. 4a; r2=0.84, p=0.01, n=6), indicating that vertical CH4 distributions were linked to the mixing of saline water in the bottom and less-saline water in the upper layers. We suggest that CH4 release driven by hydrostatic pressure fluctuations and the MBI-associated mixing are responsible for the abnormal CH4 profile in December 2014.
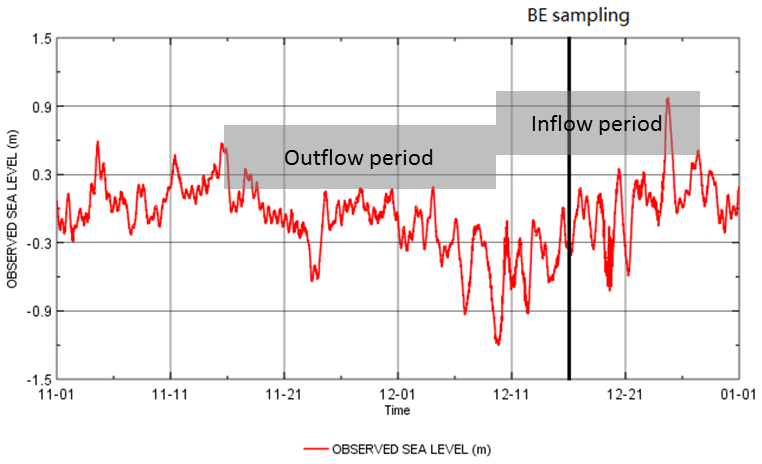
Figure 5Sea level variations in November and December 2014. The black line indicates the occurrence of BE sampling in December 2014.
The CH4 anomaly in November 2013 can be linked to saline water inflow as well. Nausch et al. (2014) reported the occurrence of an inflow event from 27 October to 7 November in 2013. The sampling at BE took place on 5 November, and an increase in salinity was detected in the bottom water (Fig. 4b). The rapid transition from hypoxic (9.8 µM L−1, 25 m in October) to oxic (239.2 µM L−1, 25 m in November) conditions in the bottom layer also supports the occurrence of the inflow (Fig. 2). Steinle et al. (2017) found a change in the temperature optimum of aerobic CH4-oxidizing bacteria (MOB) in November 2013 at BE and linked it to a displacement of the local MOB community as a result of saltwater injection. Although enhanced CH4 concentrations and high net methanogenesis rates were detected in the sediments in November 2013 (Maltby et al., 2018), the saline inflow with less dissolved CH4 was sandwiched between the sediments and the upper-layer waters. As a result, we also found a negative salinity–CH4 correlation in the water column (Fig. 4b; r2=0.86, p<0.01, n=6). This inflow event was much weaker than the MBI in December 2014, and no obvious outflow or inflow period can be identified from sea level variations. There was no strong fluctuation in hydrostatic pressure, and thus sedimentary CH4 release and CH4 supersaturations in the water column were lower than in December 2014. Another difference is that the decrease in salinity and increase in CH4 concentrations were observed between 10 and 20 m, which is at shallower depths compared to the MBI in December 2014, indicating that the saline water volume in the bottom layer was larger at the time of the sampling in November 2013.
The situation in March 2014 is different. We did not find any evidence for saline water inflow or hydrostatic pressure fluctuation, and the correlation between CH4 concentration and salinity is poor (Fig. 4c; r2=0.43, p=0.16, n=6). The occurrences of the unusual CH4 profiles were accompanied by the enhanced Chlorophyll a concentrations in the upper waters. CH4 production by widespread marine phytoplankton has been reported, and the phytoplankton might be a potential source of surface CH4 supersaturations (Lenhart et al., 2016; Klintzsch et al., 2019). However, spring or autumn algae blooms at BE were often observed without CH4 accumulation, and surface CH4 contribution from phytoplankton remains to be proven. Potential sources for the enhanced CH4 in March 2014 are still unclear.
In summary, we suggest that saline water inflow and the subsequent upwelling of water are the most likely causes for the CH4 surface accumulation in November 2013 and December 2014. Nonetheless, the occurrence of inflow does not necessarily lead to enhanced CH4 concentrations in the upper waters. Inflow events are relatively common; for example, in 2013, besides the inflow in November, three other events with similar estimated inflow volumes were detected in January, February and April (Nausch et al., 2014), but no CH4 anomaly was found during that period. The magnitude of the CH4 anomalies might depend on the strength of the inflow events and other factors, such as storms and sediment resuspension. Besides, there is a high chance that the monthly sampling at BE only captured few CH4 pulses. Inflow events usually last days to weeks, but the accumulated CH4 in the upper layers might last even less time because of effective aerobic CH4 oxidation (Steinle et al., 2017) and strong vertical mixing in winter. The occurrences of surface CH4 accumulations at BE might be more frequent than have been observed.
4.3 Surface saturation and flux density
Surface CH4 saturations are directly proportional to CH4 concentrations in the surface water ( × [CH4] + 10.29; R2=0.9794, n=77, p<0.0001; Fig. 6a, b), despite the pronounced seasonal variations in temperature (Fig. 3). This indicates that the net CH4 production at BE is overriding the temperature-driven variability in the CH4 concentrations. Excluding the extreme value from December 2014, surface CH4 saturations at BE varied between 129 % and 5563 %, with an average of 615±688 %. The surface layer was supersaturated with CH4 and thus emitting CH4 to the atmosphere throughout the sampling period.
The coastal Baltic Sea, especially the southwestern part, is a hotspot for CH4 emissions. Area-weighted mean CH4 saturations for the entire Baltic Sea (113 % and 395 % in winter and summer 1992, respectively; Bange et al., 1994) were lower than at BE. Schmale et al. (2010) extensively investigated dissolved CH4 distributions in the Baltic Sea and found that surface CH4 supersaturations were stronger in the shallow western areas.

Figure 6Inter-annual variations in dissolved CH4 concentration (a), saturation (b) and flux density (c) at BE during 2006–2017. Data collected from December 2014 are not shown.
Sea-to-air CH4 flux densities fluctuated between 0.3 and 746.3 µmol m−2 d−1, with an average of 43.8±88.7 µmol m−2 d−1 (excluding the extreme value in December 2014; Fig. 6c). Comparable results in saturation and flux density were observed at the pockmark sites in Eckernförde Bay (Bussmann and Suess, 1998). Although surface CH4 saturations in this study are consistent with the previously published results by Bange et al. (2010; 554±317 %), calculated CH4 flux densities in this study are much higher than in Bange et al. (2010; 6.3–14.7 µmol m−2 d−1). The discrepancy is derived from different flux calculation methods. Bange et al. (2010) adopted the equations by Raymond and Cole (2001) with a lower gas transfer velocity, and they used the median of surface CH4 concentrations for computation, which eliminated the extreme values. Our results are in good agreement with the ones reported by Bange et al. (2010) if we adopt the same method.
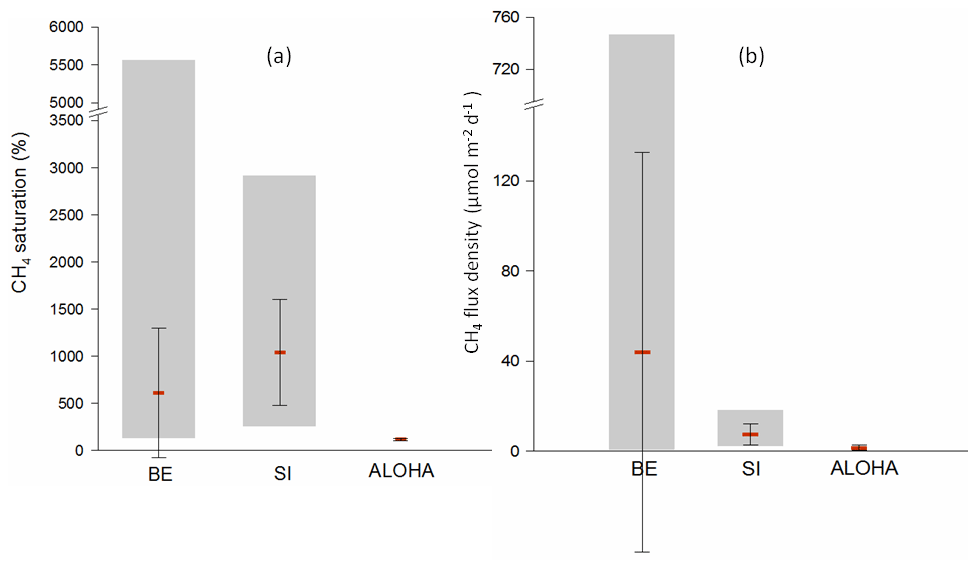
Figure 7Comparison of surface CH4 saturations (a) and flux densities (b) from time-series stations of BE, Saanich Inlet (SI) and ALOHA. For the computation of flux density, the equations of Nightingale et al. (2000) and Wanninkhof (2014) were used for SI and ALOHA, respectively. Data in December 2014 at the BE time series station were not included. Please note the break on the y axis for both charts.
CH4 emissions from coastal waters could be roughly considered as the difference between the formation and oxidation of CH4 in the water column and sediments. Although sediments are substantial CH4 sources, most CH4 is consumed before escaping to the atmosphere (Martens et al., 1999; Treude et al., 2005; Steinle et al., 2017). Treude et al. (2005) compared the potential and field rates of anaerobic oxidation of methane (AOM) in the sediments of Eckernförde Bay and suggested that the AOM-mediating organisms are capable of a fast response to changes in CH4 supply. Steinle et al. (2017) reported that 70 %–95 % of dissolved CH4 was effectively removed in the water column during summer stratification. Apart from the MBI-driven uplift of CH4-enriched bottom water to the surface (see below), wind-driven upwelling events can lead to a ventilation of the accumulated CH4 to the atmosphere. For example, Gülzow et al. (2013) observed elevated CH4 concentrations in the Gotland Basin as a result of wind-induced upwelling. The influence of upwelling at BE, however, is more prominent due to the shallow water depth. In September 2012 and 2017, when upwelling occurred (see Sect. 4.1), sea-to-air CH4 flux densities were 65.9 and 132.3 µmol m−2 d−1, respectively, which were about 50 % and 200 % higher than the mean value.
Enhanced CH4 saturations and associated emissions at BE were also strongly promoted by saline inflows (see Sect. 4.2). We found very high surface CH4 saturation and flux density in November 2013 and December 2014 (Fig. 6). In December 2014, surface CH4 saturations were as high as 19 770 % and the calculated flux density reached 3104.5 µmol m−2 d−1. Inflows of saline waters usually occur in winter, when the well-ventilated water column, relatively low CH4 oxidation rates and high wind speeds are all favorable for high CH4 emissions (Wanninkhof, 2014; Steinle et al., 2017). Assuming that there was no continuous mixing or supply of CH4 to the surface layer, it took about 3.3 d for the accumulated CH4 to come back to equilibrium values under the calculated flux density, during which the annual CH4 emissions from Eckernförde Bay increased by approximately 66 % in 2014. This is also in line with our speculation in Sect. 4.2 that the monthly sampling at BE might have missed some of the short-lived CH4 pulses.
Moreover, methanogenesis in the sediments of Eckernförde Bay is sufficient for CH4 bubble formation (Whiticar, 2002). Hydrostatic pressure fluctuations associated with saline water inflow could have triggered CH4 seepage and gas bubble plumes from the seafloor to the atmosphere (Wever et al., 2006; Lohrberg et al., 2020). Gas ebullition sites were usually found accompanied by pockmark structures (Schneider von Deimling et al., 2011), and Jackson et al. (1998) provided sonar evidence for CH4 ebullition in Eckernförde Bay. However, recently Lohrberg et al. (2020) reported a widespread CH4 ebullition event in Eckernförde Bay and found no direct linkage between pockmarks and ebullitions. They estimated the bubble-driven CH4 flux during a weak storm in the autumn of 2014 was 1916 µmol m−2 d−1. These findings point to the fact that ebullition might be an important, but highly variable, additional CH4 efflux to the atmosphere. However, our measurements did not capture gas bubbles, and, thus, the estimate of the overall CH4 emissions resulting from the MBI might be too low. In this case, time-series monitoring of saline inflows and sea level variations, combined with continuous observation of CH4 variability, especially in winter, are essential for quantifying CH4 emissions from Eckernförde Bay.
4.4 Comparison with other time-series measurements
Besides this study, time-series measurements of CH4 have also been reported from Saanich Inlet (SI), British Columbia, Canada (Capelle et al., 2019) and ALOHA station in the North Pacific Subtropical Gyre (Wilson et al., 2017).
Located in a seasonally anoxic fjord, the time-series station in SI has a similar hydrographic setting compared to BE but a deeper water depth (230 m; Capelle et al., 2019). Surface CH4 saturations at SI fell in the lower end of the range observed here for BE (Fig. 7). Despite the fact that the mean surface saturation in SI was higher, CH4 flux densities were much lower than at BE. Since the air–sea exchange approach of Nightingale et al. (2000) was used in both studies, the discrepancy results from the higher wind speeds at BE. CH4 saturations from ALOHA were only slightly supersaturated (close to the equilibrium saturation), and the flux densities were consequently low as well, which results from the fact that ALOHA is a deep-water (∼4800 m) station located in the oligotrophic open ocean where potential strong CH4 sources such as sedimentary release or methanogenesis under low O2 in the water column are negligible (Wilson et al., 2017).
Wilson et al. (2017) analyzed the time-series CH4 data from ALOHA during 2008–2016 and observed a decline in the surface CH4 concentrations from 2013. They attributed the potential decrease in CH4 production to fluctuations in phosphate concentrations. Capelle et al. (2019) also detected a significant decline in CH4 concentrations in the upper water column over time at SI and proposed a link with the shoaling of the boundary of the hypoxic layer. However, no significant trend was detected in CH4 concentrations or flux densities at BE (Fig. 6), despite the relatively long observation period. The different situations can be explained by the shallow water depth in Eckernförde Bay, which makes the CH4 distribution sensitive to the variability in its sedimentary release and events such as MBI and wind-driven upwelling.
The CH4 measurements at BE showed a strong temporal variability and variations with depths. A pronounced enhancement of the CH4 concentrations was usually found in the bottom layer (15–25 m) during February, May–June and October, which indicates that the release from the sediments is the major source of CH4. Organic matter and dissolved O2 are usually considered as the main controlling factors in CH4 production and consumption pathways, but we did not detect correlations of CH4 with Chlorophyll a or O2 during 2006–2017.
Obviously non-biological processes such as local wind-driven upwelling and the inflow of saline North Sea waters play a significant role in the observed variability in CH4 at BE. However, these phenomena, which occur on relatively short timescales of day or weeks, were not frequently detected, most probably due to the monthly sampling frequency. The surface layer at BE was always supersaturated with CH4, and therefore, BE was a persistent and strong, but highly variable, source of CH4 to the atmosphere. We did not detect significant temporal trends in CH4 concentrations or emissions, despite ongoing environmental changes (warming, deoxygenation) in Eckernförde Bay. Overall, the CH4 variability at BE is driven by a complex interplay of various biological (i.e., methanogenesis, oxidation) and physical (i.e., upwelling, inflow events) processes. Continuous observations at BE, with an emphasis on the period when upwelling and saline inflow usually occur, is therefore of great importance for quantifying CH4 variability and the associated emissions as well as for predicting future CH4 variability in the SW Baltic Sea.
Data are available from the Boknis Eck database at https://www.bokniseck.de//database-access (Bange and Malien, 2020) and the MEMENTO (MarinE MethanE and NiTrous Oxide) database at https://memento.geomar.de (Kock and Bange, 2015).
XM, MS, STL and HWB designed the study and participated in the fieldwork. CH4 measurements and data processing were performed by XM, MS and STL. XM wrote the article with contributions from MS, STL and HWB.
The authors declare that they have no conflict of interest.
The authors thank the captains and crews of the RV Littorina and Polarfuchs as well as the many colleagues and numerous students who helped with the sampling and measurements of the BE time series through various projects. Special thanks go to Annette Kock for her help with sampling, measurements and data analysis. The time series at BE was supported by DWK Meeresforschung (1957–1975), HELCOM (1979–1995), BMBF (1995–1999), the Institut für Meereskunde (1999–2003), IfM-GEOMAR (2004–2011) and GEOMAR (2012–present). The current CH4 measurements at BE are supported by the EU BONUS INTEGRAL project which receives funding from BONUS (Art 185), funded jointly by the EU, the German Federal Ministry of Education and Research, the Swedish Research Council Formas, the Academy of Finland, the Polish National Centre for Research and Development, and the Estonian Research Council. The Boknis Eck Time Series Station (https://www.bokniseck.de, last access: 2 July 2020) is run by the Chemical Oceanography Research Unit of GEOMAR, Helmholtz Centre for Ocean Research Kiel. The sea level data used in this study were made available by the EMODnet Physics project (https://www.emodnet-physics.eu/map, last access: 2 July 2020), funded by the European Commission Directorate-General for Maritime Affairs and Fisheries.
This research has been supported by the China Scholarship Council (grant no. 201306330056) and the BONUS INTEGRAL project (grant no. 03F0773B).
The article processing charges for this open-access
publication were covered by a Research
Centre of the Helmholtz Association.
This paper was edited by Gwenaël Abril and reviewed by two anonymous referees.
Ahmerkamp, S., Winter, C., Janssen, F., Kuypers, M. M., and Holtappels, M.: The impact of bedform migration on benthic oxygen fluxes, J. Geophys. Res.-Biogeo, 120, 2229–2242, https://doi.org/10.1002/2015JG003106, 2015.
Bange, H. W. and Malien, F.: Boknis Eck Time-series Database, Kiel Datamanagement Team, available at: https://www.bokniseck.de//database-access, last access: 23 March 2020.
Bange, H. W., Bartell, U. H., Rapsomanikis, S., and Andreae, M. O.: Methane in the Baltic and North Seas and a reassessment of the marine emissions of methane, Global Biogeochem. Cy., 8, 465–480, https://doi.org/10.1029/94GB02181, 1994.
Bange, H. W., Bergmann, K., Hansen, H. P., Kock, A., Koppe, R., Malien, F., and Ostrau, C.: Dissolved methane during hypoxic events at the Boknis Eck Time Series Station (Eckernförde Bay, SW Baltic Sea), Biogeosciences, 7, 1279–1284, https://doi.org/10.5194/bg-7-1279-2010, 2010.
Barnes, J., Ramesh, R., Purvaja, R., Nirmal Rajkumar, A., Senthil Kumar, B., Krithika, K., Ravichandran, K., Uher, G., and Upstill-Goddard, R.: Tidal dynamics and rainfall control N2O and CH4 emissions from a pristine mangrove creek, Geophys. Res. Lett., 33, L15405, https://doi.org/10.11029/12006GL026829, 2006.
Belkin, I. M.: Rapid warming of large marine ecosystems, Prog. Oceanogr., 81, 207–213, https://doi.org/10.1016/j.pocean.2009.04.011, 2009.
Bernard, B. B., Brooks, J. M., and Sackett, W. M.: Natural gas seepage in the Gulf of Mexico, Earth Planet Sc. Lett., 31, 48–54, 1976.
Borges, A. V., Champenois, W., Gypens, N., Delille, B., and Harlay, J.: Massive marine methane emissions from near-shore shallow coastal areas, Sci. Rep.-UK, 6, 27908, https://doi.org/10.1038/srep27908, 2016.
Bussmann, I. and Suess, E.: Groundwater seepage in Eckernförde Bay (Western Baltic Sea): Effect on methane and salinity distribution of the water column, Cont. Shelf Res., 18, 1795–1806, https://doi.org/10.1016/S0278-4343(98)00058-2, 1998.
Capelle, D. W., Hallam, S. J., and Tortell, P. D.: Time-series CH4 measurements from Saanich Inlet, BC, a seasonally anoxic fjord, Mar. Chem., 215, 103664, https://doi.org/10.1016/j.marchem.2019.103664, 2019.
Carstensen, J., Andersen, J. H., Gustafsson, B. G., and Conley, D. J.: Deoxygenation of the Baltic Sea during the last century, P. Natl. Acad. Sci. USA, 111, 5628–5633, https://doi.org/10.1073/pnas.1323156111, 2014.
Conley, D. J., Carstensen, J., Aigars, J., Axe, P., Bonsdorff, E., Eremina, T., and Lannegren, C.: Hypoxia is increasing in the coastal zone of the Baltic Sea, Environ. Sci. Technol., 45, 6777–6783, https://doi.org/10.1021/es201212r, 2011.
Dale, A. W., Flury, S., Fossing, H., Regnier, P., Røy, H., Scholze, C., and Jørgensen, B. B.: Kinetics of organic carbon mineralization and methane formation in marine sediments (Aarhus Bay, Denmark), Geochim. Cosmochim. Ac., 252, 159–178, https://doi.org/10.1016/j.gca.2019.02.033, 2019.
David, H. A.: Further applications of range to analysis of variance, Biometrika, 38, 393–409, 1951.
Egger, M., Riedinger, N., Mogollon, J. M., and Jørgensen, B. B.: Global diffusive fluxes of methane in marine sediments, Nat. Geosci., 11, 421–425, https://doi.org/10.1038/s41561-018-0122-8, 2018.
Fleming-Lehtinen, V. and Laamanen, M.: Long-term changes in Secchi depth and the role of phytoplankton in explaining light attenuation in the Baltic Sea, Estuar. Coast Shelf S., 102, 1–10, https://doi.org/10.1016/j.ecss.2012.02.015, 2012.
Grasshoff, K., Kremling, K., and Ehrhardt, M.: Methods of seawater analysis, 3rd edition, WILEY-VCH, Weihheim, Germany, 1999.
Gülzow, W., Rehder, G., Schneider von Deimling, J., Seifert, S., and Tóth, Z.: One year of continuous measurements constraining methane emissions from the Baltic Sea to the atmosphere using a ship of opportunity, Biogeosciences, 10, 81–99, https://doi.org/10.5194/bg-10-81-2013, 2013.
Hansen, H. P., Giesenhagen, H. C., and Behrends, G.: Seasonal and long-term control of bottom water oxygen deficiency in a stratified shallow-coastal system, ICES J. Mar. Sci., 56, 65–71, https://doi.org/10.1006/jmsc.1999.0629, 1999.
HELCOM: State of the Baltic Sea – Second HELCOM holistic assessment 2011–2016, Baltic Sea Environ. Proc., 1–155, 2018.
Hovland, M., Judd, A. G., and Burke Jr., R. A.: The global flux of methane from shallow submarine sediments, Chemosphere, 26, 559–578, https://doi.org/10.1016/0045-6535(93)90442-8, 1993.
Hsu, S. A., Meindl, E. A., and Gilhousen, D. B.: Determining the power-law wind-profile exponent under near-neutral stability conditions at sea, J. Appl. Meteorol., 33, 757–765, https://doi.org/10.1175/1520-0450(1994)033<0757:DTPLWP>2.0.CO;2, 1994.
IPCC: Climate Change 2013: The physical science basis. Contribution of Working Group I to the fifth assessment report of the Intergovernmental Panel on Climate Change, Cambridge University Press, Cambridge, UK and New York, NY, 2013.
Jackson, D. R., Williams, K. L., Wever, T. F., Friedrichs, C. T., and Wright, L. D.: Sonar evidence for methane ebullition in Eckernförde Bay, Cont. Shelf Res., 18, 1893–1915, https://doi.org/10.1016/S0278-4343(98)00062-4, 1998.
Jähne, B., Heinz, G., and Dietrich, W.: Measurements of the diffusion coefficients of sparingly soluble gases in water, J. Geophys. Res.-Ocean., 92, 10767–10776, https://doi.org/10.1029/JC092iC10p10767, 1987.
Judd, A. G., Hovland, M., Dimitrov, L. I., Garcia Gil, S., and Jukes, V.: The geological methane budget at continental margins and its influence on climate change, Geofluids, 2, 109–126, https://doi.org/10.1046/j.1468-8123.2002.00027.x, 2002.
Klintzsch, T., Langer, G., Nehrke, G., Wieland, A., Lenhart, K., and Keppler, F.: Methane production by three widespread marine phytoplankton species: release rates, precursor compounds, and potential relevance for the environment, Biogeosciences, 16, 4129–4144, https://doi.org/10.5194/bg-16-4129-2019, 2019.
Kock, A. and Bange, H. W.: Counting the ocean's greenhouse gas emissions, Eos, 96, 10–13, https://doi.org/10.1029/2015EO023665, 2015.
Lenhart, K., Klintzsch, T., Langer, G., Nehrke, G., Bunge, M., Schnell, S., and Keppler, F.: Evidence for methane production by the marine algae Emiliania huxleyi, Biogeosciences, 13, 3163–3174, https://doi.org/10.5194/bg-13-3163-2016, 2016.
Lennartz, S. T., Lehmann, A., Herrford, J., Malien, F., Hansen, H. P., Biester, H., and Bange, H. W.: Long-term trends at the Boknis Eck time-series station (Baltic Sea), 1957–2013: does climate change counteract the decline in eutrophication?, Biogeosciences, 11, 6323–6339, https://doi.org/10.5194/bg-11-6323-2014, 2014.
Levipan, H. A., Quiñones, R. A., Johansson, H. E., and Urrutia, H.: Methylotrophic methanogens in the water column of an upwelling zone with a strong oxygen gradient off central Chile, Microbes Environ., 22, 268–278, 2007.
Lohrberg, A., Schmale, O., Ostrovsky, I., Niemann, H., Held, P., and Schneider von Deimling, J.: Discovery and quantification of a widespread methane ebullition event in a coastal inlet (Baltic Sea) using a novel sonar strategy, Sci. Rep.-UK, 10, 4393, https://doi.org/10.1038/s41598-020-60283-0, 2020.
Maher, D. T., Cowley, K., Santos, I. R., Macklin, P., and Eyre, B. D.: Methane and carbon dioxide dynamics in a subtropical estuary over a diel cycle: Insights from automated in situ radioactive and stable isotope measurements, Mar. Chem., 168, 69–79, https://doi.org/10.1016/j.marchem.2014.10.017, 2015.
Maltby, J., Steinle, L., Löscher, C. R., Bange, H. W., Fischer, M. A., Schmidt, M., and Treude, T.: Microbial methanogenesis in the sulfate-reducing zone of sediments in the Eckernförde Bay, SW Baltic Sea, Biogeosciences, 15, 137–157, https://doi.org/10.5194/bg-15-137-2018, 2018.
Martens, C. S., Albert, D. B., and Alperin, M. J.: Stable isotope tracing of anaerobic methane oxidation in the gassy sediments of Eckernförde Bay, German Baltic Sea, Am. J. Sci., 299, 589–610, 1999.
Mohrholz, V., Naumann, M., Nausch, G., Krüger, S., and Gräwe, U.: Fresh oxygen for the Baltic Sea-An exceptional saline inflow after a decade of stagnation, J. Marine Syst., 148, 152–166, https://doi.org/10.1016/j.jmarsys.2015.03.005, 2015.
Naqvi, S. W. A., Bange, H. W., Farías, L., Monteiro, P. M. S., Scranton, M. I., and Zhang, J.: Marine hypoxia/anoxia as a source of CH4 and N2O, Biogeosciences, 7, 2159–2190, https://doi.org/10.5194/bg-7-2159-2010, 2010.
Nausch, G., Naumann, M., Umlauf, L., Mohrholz, V., and Siegel, H.: Hydrographisch-hydrochemische Zustandseinschätzung der Ostsee 2013, Leibniz-Institut für Ostseeforschung Warnemünde, Germany, 2014.
Nightingale, P. D., Malin, G., Law, C. S., Watson, A. J., Liss, P. S., Liddicoat, M. I., Boutin, J., and Upstill-Goddard, R. C.: In situ evaluation of air-sea gas exchange parameterizations using novel conservative and volatile tracers, Global Biogeochem. Cy., 14, 373–387, https://doi.org/10.1029/1999GB900091, 2000.
Nittrouer, C. A., Lopez, G. R., Wright, L. D., Bentley, S. J., D'Andrea, A. F., Friedrichs, C. T., Craig, N. I., and Sommerfield, C. K.: Oceanographic processes and the preservation of sedimentary structure in Eckernförde Bay, Baltic Sea. Cont. Shelf Res., 18, 1689–1714, https://doi.org/10.1016/S0278-4343(98)00054-5, 1998.
Orsi, T. H., Werner, F., Milkert, D., Anderson, A. L., and Bryant, W. R.: Environmental overview of Eckernförde bay, northern Germany, Geo-Mar. Lett., 16, 140–147, 1996.
Pimenov, N. V., Ul'yanova, M. O., Kanapatskii, T. A., Mitskevich, I. N., Rusanov, I. I., Sigalevich, P. A., Nemirovskaya, I. A., and Sivkov, V. V.: Sulfate reduction, methanogenesis, and methane oxidation in the upper sediments of the Vistula and Curonian Lagoons, Baltic Sea, Microbiology, 82, 224–233, https://doi.org/10.1134/S0026261713020136, 2013.
Raymond, P. A. and Cole, J. J.: Gas exchange in rivers and estuaries: Choosing a gas transfer velocity, Estuaries, 24, 312–317, https://doi.org/10.2307/1352954, 2001.
Reeburgh, W. S.: Oceanic methane biogeochemistry, Chem. Rev., 107, 486–513, https://doi.org/10.1021/cr050362v, 2007.
Rehder, G., Keir, R. S., Suess, E., and Pohlmann, T.: The multiple sources and patterns of methane in North Sea waters, Aquat. Geochem., 4, 403–427, https://doi.org/10.1023/A:1009644600833, 1998.
Reindl, A. R., and Bolałek, J.: Methane flux from sediment into near-bottom water in the coastal area of the Puck Bay (Southern Baltic), Oceanol. Hydrobiol. St., 41, 40–47, https://doi.org/10.2478/s13545-012-0026-y, 2012.
Sandén, P. and Håkansson, B.: Long-term trends in Secchi depth in the Baltic Sea, Limnol. Oceanogr., 41, 346–351, https://doi.org/10.4319/lo.1996.41.2.0346, 1996.
Saunois, M., Bousquet, P., Poulter, B., Peregon, A., Ciais, P., Canadell, J. G., Dlugokencky, E. J., Etiope, G., Bastviken, D., Houweling, S., Janssens-Maenhout, G., Tubiello, F. N., Castaldi, S., Jackson, R. B., Alexe, M., Arora, V. K., Beerling, D. J., Bergamaschi, P., Blake, D. R., Brailsford, G., Brovkin, V., Bruhwiler, L., Crevoisier, C., Crill, P., Covey, K., Curry, C., Frankenberg, C., Gedney, N., Hoglund-Isaksson, L., Ishizawa, M., Ito, A., Joos, F., Kim, H. S., Kleinen, T., Krummel, P., Lamarque, J. F., Langenfelds, R., Locatelli, R., Machida, T., Maksyutov, S., McDonald, K. C., Marshall, J., Melton, J. R., Morino, I., Naik, V., O'Doherty, S., Parmentier, F. J. W., Patra, P. K., Peng, C. H., Peng, S. S., Peters, G. P., Pison, I., Prigent, C., Prinn, R., Ramonet, M., Riley, W. J., Saito, M., Santini, M., Schroeder, R., Simpson, I. J., Spahni, R., Steele, P., Takizawa, A., Thornton, B. F., Tian, H. Q., Tohjima, Y., Viovy, N., Voulgarakis, A., van Weele, M., van der Werf, G. R., Weiss, R., Wiedinmyer, C., Wilton, D. J., Wiltshire, A., Worthy, D., Wunch, D., Xu, X. Y., Yoshida, Y., Zhang, B. W., Zhang, Z., and Zhu, Q.: The global methane budget 2000–2012, Earth Syst. Sci. Data, 8, 697–751, https://doi.org/10.5194/essd-8-697-2016, 2016.
Schmale, O., Schneider von Deimling, J., Gülzow, W., Nausch, G., Waniek, J. J., and Rehder, G.: Distribution of methane in the water column of the Baltic Sea, Geophys. Res. Lett., 37, L12604, https://doi.org/10.1029/2010GL043115, 2010.
Schmaljohann, R.: Methane dynamics in the sediment and water column of Kiel Harbour (Baltic Sea), Mar. Ecol. Prog. Ser., 131, 263–273, https://doi.org/10.3354/meps131263, 1996.
Schneider von Deimling, J., Gülzow, W., Ulyanova, M., Klusek, Z., and Rehder, G.: Detection and monitoring of methane ebullition, BONUS-Baltic GAS Final report WP 3.3, 1–11, 2011.
Scranton, M. I. and Farrington, J. W.: Methane production in the waters off Walvis Bay, J. Geophys. Res., 82, 4947–4953, https://doi.org/10.1029/JC082i031p04947, 1977.
Siedler, G. and Peters, H.: Properties of sea water: physical properties, in: Oceanography, edited by: Sündermann, J., Springer, Berlin, Germany, 233–264, 1986.
Smetacek, V.: The annual cycle of Kiel Bight plankton: A long-term analysis, Estuaries, 8, 145–157, 1985.
Smetacek, V., von Bodungen, B., von Bröckel, K., Knoppers, B., Martens, P., Peinert, R., Pollehne, F., Stegmann, P., and Zeitzschel, B.: Seasonality of plankton growth and sedimentation, in: Seawater-Sediment Interactions in Coastal Waters, edited by: Rumohr, J., Walger, E., and Zeitzschel, B., Springer, Berlin, Germany, 34–56, 1987.
Steinle, L., Maltby, J., Treude, T., Kock, A., Bange, H. W., Engbersen, N., Zopfi, J., Lehmann, M. F., and Niemann, H.: Effects of low oxygen concentrations on aerobic methane oxidation in seasonally hypoxic coastal waters, Biogeosciences, 14, 1631–1645, https://doi.org/10.5194/bg-14-1631-2017, 2017.
Sturm, K., Werner, U., Grinham, A., and Yuan, Z.: Tidal variability in methane and nitrous oxide emissions along a subtropical estuarine gradient, Estuar. Coast Shelf S., 192, 159–169, https://doi.org/10.1016/j.ecss.2017.04.027, 2017.
Treude, T., Krüger, M., Boetius, A., and Jørgensen, B. B.: Environmental control on anaerobic oxidation of methane in the gassy sediments of Eckernförde Bay (German Baltic), Limnol. Oceanogr., 50, 1771–1786, https://doi.org/10.4319/lo.2005.50.6.1771, 2005.
Upstill-Goddard, R. C., Barnes, J., Frost, T., Punshon, S., and Owens, N. J.: Methane in the southern North Sea: Low-salinity inputs, estuarine removal, and atmospheric flux, Global Biogeochem. Cy., 14, 1205–1217, https://doi.org/10.1029/1999GB001236, 2000.
Wanninkhof, R.: Relationship between wind speed and gas exchange over the ocean revisited, Limnol. Oceanogr.-Method., 12, 351–362, https://doi.org/10.4319/lom.2014.12.351, 2014.
Weber, T., Wiseman, N. A., and Kock, A.: Global ocean methane emissions dominated by shallow coastal waters, Nat. Commun., 10, 4584, https://doi.org/10.1038/s41467-019-12541-7, 2019.
Wever, T. F., Lühder, R., Voß, H., and Knispel, U.: Potential environmental control of free shallow gas in the seafloor of Eckernförde Bay, Germany, Mar. Geol., 225, 1–4, https://doi.org/10.1016/j.margeo.2005.08.005, 2006.
Whiticar, M. J.: Diagenetic relationships of methanogenesis, nutrients, acoustic turbidity, pockmarks and freshwater seepages in Eckernförde Bay, Mar. Geol., 182, 29–53, https://doi.org/10.1016/S0025-3227(01)00227-4, 2002.
Wiesenburg, D. A. and Guinasso Jr., N. L.: Equilibrium solubilities of methane, carbon monoxide, and hydrogen in water and sea water, J. Chem. Eng. Data, 24, 356–360, 1979.
Wilson, S. T., Ferrón, S., and Karl, D. M.: Interannual variability of methane and nitrous oxide in the North Pacific Subtropical Gyre, Geophys. Res. Lett., 44, 9885–9892, https://doi.org/10.1002/2017GL074458, 2017.
WMO: Scientific assessment of ozone depletion: 2018, World Meteorological Organization, Geneva, Switzerland, Global Ozone Research and Monitoring Project–Report No. 58, 588 pp., 2018.
Xiao, K. Q., Beulig, F., Roy, H., Jørgensen, B. B., and Risgaard-Petersen, N.: Methylotrophic methanogenesis fuels cryptic methane cycling in marine surface sediment, Limnol. Oceanogr., 63, 1519–1527, https://doi.org/10.1002/lno.10788, 2018.