the Creative Commons Attribution 4.0 License.
the Creative Commons Attribution 4.0 License.
 | 18 Jun 2020
Relevance of aboveground litter for soil organic matter formation – a soil profile perspective
Patrick Liebmann
Patrick Wordell-Dietrich
Karsten Kalbitz
Robert Mikutta
Fabian Kalks
Susanne K. Woche
Leena R. Dsilva
Georg Guggenberger
In contrast to mineral topsoils, in subsoils the origin and processes leading to the formation and stabilization of organic matter (OM) are still not well known. This study addresses the fate of litter-derived carbon (C) in whole soil profiles with regard to the conceptual cascade model, which proposes that OM formation in subsoils is linked to sorption–microbial processing–remobilization cycles during the downward migration of dissolved organic carbon (DOC). Our main objectives were to quantify the contribution of recent litter to subsoil C stocks via DOC translocation and to evaluate the stability of litter-derived OM in different functional OM fractions.
A plot-scale stable isotope-labeling experiment was conducted in a temperate beech forest by replacing the natural litter layer with 13C enriched litter on an area of 20 m2 above a Dystric Cambisol. After 22 months of field exposure, the labeled litter was replaced again by natural litter and soil cores were drilled down to 180 cm soil depth. Water extraction and density fractionation were combined with stable isotope measurements in order to link the fluxes of recent litter-derived C to its allocation into different functional OM fractions. A second sampling was conducted 18 months later to further account for the stability of translocated young litter-derived C.
Almost no litter-derived particulate OM (POM) entered the subsoil, suggesting root biomass as the major source of subsoil POM. The contribution of aboveground litter to the formation of mineral-associated OM (MAOM) in topsoils (0–10 cm) was 1.88±0.83 g C m−2 and decreased to 0.69±0.19 g C m−2 in the upper subsoil (10–50 cm) and 0.01±0.02 g C m−2 in the deep subsoil >100 cm soil depth during the 22 months. This finding suggests a subordinate importance of recent litter layer inputs via DOC translocation to subsoil C stocks, and implies that most of the OM in the subsoil is of older age. Smaller losses of litter-derived C within MAOM of about 66 % compared to POM (77 %–89 %) over 18 months indicate that recent carbon can be stabilized by interaction with mineral surfaces; although the overall stabilization in the sandy study soils is limited. Our isotope-labeling approach supports the concept of OM undergoing a sequence of cycles of sorption, microbial processing, and desorption while migrating down a soil profile, which needs to be considered in models of soil OM formation and subsoil C cycling.
- Article
(589 KB) - Full-text XML
-
Supplement
(593 KB) - BibTeX
- EndNote


The capability of soils to incorporate and preserve large quantities of organic matter (OM) is a key function in the global carbon (C) cycle (Wiesmeier et al., 2019). While in the past most studies on carbon inventories focused on topsoils, only some of the recent research also expands to subsoil environments (Fontaine et al., 2007; Salomé et al., 2010; Bernal et al., 2016), considering that a significant proportion of soil OM (SOM) is stored in subsoil horizons (Batjes, 1996; Jobbagy and Jackson, 2000). In forest ecosystems, major pathways of OM to enter subsoils are rhizodeposition, root exudation, and dissolved organic matter (DOM) leached from the horizons above (Wilkinson et al., 2009; Rumpel and Kögel-Knabner, 2011; Kaiser and Kalbitz, 2012). Dissolved organic matter was estimated to contribute about 19 % to 50 % to the total mineral soil C stock in forest soils (Kalbitz and Kaiser, 2008; Sanderman and Amundson, 2008) and is considered a main source of subsoil OM in temperate forest soils (Kaiser and Guggenberger, 2000), next to belowground inputs (Nadelhoffer and Raich, 1992; Majdi, 2001). Further, its high affinity towards reactive mineral phases, thus forming mineral-associated OM (MAOM) makes DOM an important contributor to stabilized SOM (Scheel et al., 2007; Leinemann et al., 2016).
Kaiser and Kalbitz (2012) described the interaction of OM with minerals as a sequence of processes including DOM sorption, microbial processing, and desorption, often referred to as the “cascade model”. This model not only accounts for changes in dissolved organic carbon (DOC) concentration and bioavailability with depth but also considers the depth-dependent changes in the 14C age of SOM (Trumbore et al., 1992) and in DOM and SOM composition from plant-derived and microbial-derived OM, as was found in e.g., forest soils (Guggenberger and Zech, 1994; Kaiser et al., 2004). The cascade model also points at a microbial impact on exchange reactions of OM at mineral surfaces, which has been recently confirmed in a laboratory percolation experiment (Leinemann et al., 2018). Modern 14C ages of MAOM in mineral topsoil horizons, where most sorption sites are likely already occupied, also suggest such exchange of OM (Angst et al., 2018). Increasing OM degradation and transformation with soil depth often result in changes in the stable isotopic composition of SOM. In most soils, δ13C values increase with soil depth, which is related to the isotopic discrimination of the heavier C isotopes during microbial respiration (Nadelhoffer and Fry, 1988; Balesdent et al., 1993; van Dam et al., 1997) or a shift in the fungal to bacterial ratio in favor of the more 13C-enriched bacteria (Kohl et al., 2015). This depth trend can also reflect a translocation of relatively δ13C-enriched OM to greater depth due to preferential sorption of the δ13C-depleted carboxylated lignin degradation products via multiple sorption–decomposition–desorption steps (Kaiser et al., 2001). On the other hand, Rumpel et al. (2012) questioned the slow turnover of subsoil OM, since DOC and root exudate fluxes can substantially increase the subsoil C pool within decades, a view which is in contrast to the frequently high 14C ages of subsoil OM.
While the qualitative aspects of subsoil C cycling with respect to possible OM sources and processes are known, e.g., as summarized by Schmidt et al. (2011) and Rumpel et al. (2012), this does not refer to the controlling mechanisms and the turnover of the different subsoil C fractions. Assessment of OM turnover in the subsoil under real conditions still remains a major challenge, as it has to involve analysis of the different C sources (plant-derived versus microbial-derived) and the quantification of respective inputs and outputs. In order to quantify individual C fractions and fluxes, isotope labeling, e.g., using 13C- or 14C-enriched litter material, has been proven to be a very powerful tool (Bird et al., 2008; Moore-Kucera and Dick, 2008; Kramer et al., 2010). Extensive retention of DOC in topsoil horizons has been documented for field-exposed mesocosms (Fröberg et al., 2009) or in field approaches (Kammer et al., 2012). Yet, to the best of our knowledge, there are no field studies available that employed stable isotope tracing to estimate the contribution of recent aboveground litter to subsoil C cycling. Additionally, the role of recent litter-derived DOM in the formation of MAOM in the soil profile has not been quantified so far, nor has the biological stability of this newly incorporated OM been determined.
This study therefore addresses the fate of litter-derived C in the subsoil with regard to the conceptual cascade model (Kaiser and Kalbitz, 2012) under field conditions. Specifically, we aim to answer the following questions.
-
Does recent aboveground litter significantly contribute to the accumulation of OM in subsoils?
-
Is OM transferred into the subsoil directly via the DOM pathway or is subsoil OM the result of repeated sorption–microbial processing–desorption cycles?
-
To what extent is recent aboveground litter-derived C sorbed to soil minerals and does this fraction represent a source of stable SOM?
To quantify the contribution of recent litter to subsoil C stocks via DOM movement and evaluate the stability of litter-derived SOM, we carried out a 13C-labeling experiment, where the natural litter layer on a Dystric Cambisol underneath European beech was replaced by a 13C-enriched leaf litter. The contribution of litter to subsoil OM was assessed by δ13C analysis in soil cores down to 180 cm soil depth sampled 22 and 40 months after field labeling. The labeled litter was changed back to unlabeled litter before sampling of the first cores, allowing an indication of exchange processes of labeled C in the soil in the subsequent 18 months. Soil density fractionation was used to assess the contribution of young DOM to the formation of MAOM and to differentiate between particulate and dissolved pathways in the contribution of litter-derived C to subsoil OM.
2.1 Site description
The field experiment was carried out in the Grinderwald beech forest (Fagus sylvatica), 40 km north of Hanover, Germany (52∘34′22′′ N, 9∘18′49′′ E), comprising a stand age of 103 years. The common soil type in the research area is a Dystric Cambisol (IUSS Working Group WRB, 2014), which developed from periglacial fluviatile sandy deposits. The mean annual temperature is 9.7 ∘C, and the mean annual precipitation is 762 mm (Deutscher Wetterdienst, Nienburg, 1981–2010). Selected soil properties of the Grinderwald sites are given in Table 1. More detailed site descriptions can be found in Angst et al. (2016) and Bachmann et al. (2016).
Table 1Selected soil properties given as the mean of all three sites (n=3) and standard deviation in brackets (data adapted from Leinemann et al. 2016).
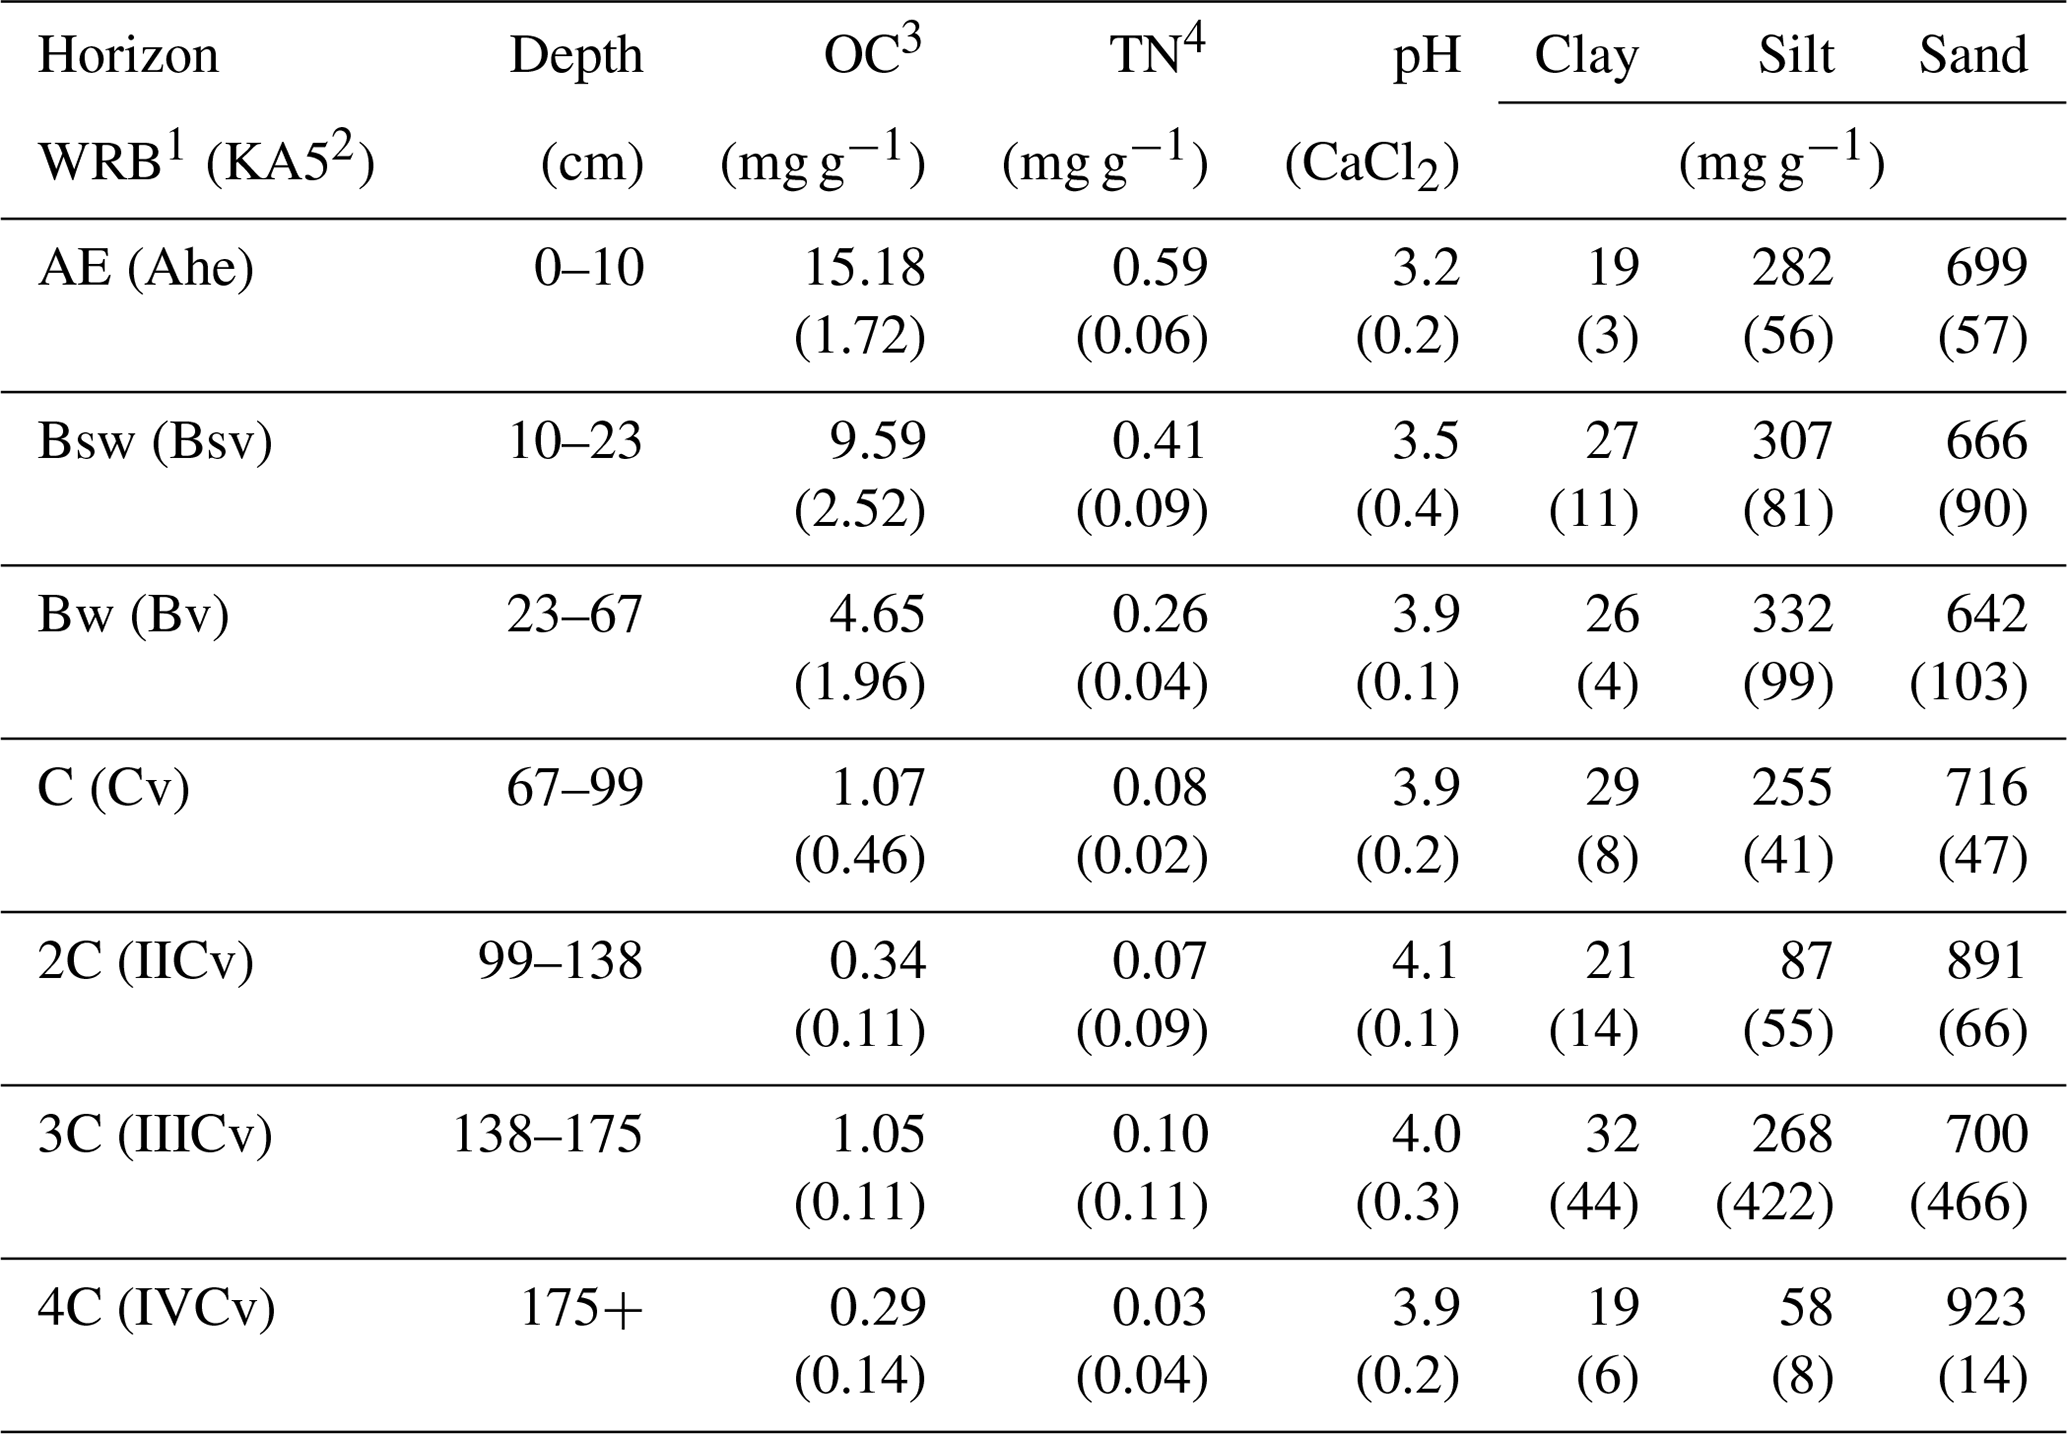
1 According to IUSS Working Group WRB (2014). 2 According to German soil classification (Ad-hoc-Arbeitsgruppe Boden, 2005). 3 Organic carbon (OC). 4 Total nitrogen (TN).
2.2 Experimental setup
The study site Grinderwald includes three soil observatories on which 13C-labeled beech litter was applied (Leinemann et al., 2016; Wordell-Dietrich et al., 2019); hereafter referred to as plots 1 to 3. Each plot was divided in two compartments of 6.57 m2 each. One compartment was labeled with 13C-enriched litter and the other remained unlabeled as a control. The experiment started in January 2015. For the labeling, the natural litter layer was removed manually and replaced by an equivalent amount of 275 g 13C-enriched beech litter per square meter, representing a typical input of beech litter in Germany (Meier et al., 2005). Labeled litter was prepared as a mixture of highly labeled beech litter (10 at % uniformly labeled due to growth under 13CO2-enriched atmosphere in a greenhouse, IsoLife, Wageningen, the Netherlands) and beech litter, which resulted in a final 13C-enrichment of 1241 ‰ to 1880 ‰ (Wordell-Dietrich et al., 2019). A net (2 cm mesh size) was installed on top of the litter layer to, first, prevent surface translocation by wind and, second, avoid dilution of the labeled litter over time by the seasonally fallen litter. The labeled litter stayed in the field for 22 months. In November 2016, the labeled litter was removed manually and amounted to an average of about 405 g m−2 per plot. We thus removed more litter than we initially applied due to incorporation of small leaf debris and beechnut shells during the 22 months. About 25 % of the removed litter were residues of the applied labeled litter. A total of about 36 %–40 % of the initially applied labeled litter C left as CO2 (Wordell-Dietrich, unpublished).
Following the removal of the labeled litter, three soil cores per plot and treatment (labeled versus unlabeled) were taken down to a depth of 200 cm using a machine-driven percussion coring system (Nordmeyer Geotool, Berlin, Germany). Since it was not possible for each soil core to secure the lowest increment of 180–200 cm, this depth was rejected from further processing. The cores were divided into 15 increments, starting with 5 cm increments from 0 to 10 cm, 10 cm increments from 10 to 100 cm, and 20 cm increments from 100 to 180 cm. Depth increments of the soil cores taken from 0 to 5 cm and 5 to 10 cm are defined as “topsoil”, increments between 10 and 50 cm are defined as “upper subsoil”, those between 50 to 100 cm are defined as “mid-subsoil”, and increments below 100 cm are defined as “deep subsoil”. Directly after sampling, an equivalent amount of the natural beech litter of the surrounding area was used for the replacement of the litter that was removed before. A second sampling was conducted 18 months later, in May 2018, in total 40 months after applying the labeled litter on the plots.
Soil samples were oven-dried at 60 ∘C and sieved to <2 mm. Three replicates per plot and treatment were combined to one composite sample per depth increment on a mass equivalent basis for further processing. Aliquots for water extractions were stored frozen (−20 ∘C) directly after sampling.
2.3 Analysis of bulk soil
Bulk samples were analyzed for organic C (OC), total nitrogen (TN) and 13C∕12C ratio, using a vario ISOPRIME cube (Elementar Analysesysteme GmbH, Hanau, Germany) elemental analyzer coupled to an IsoPrime100 (IsoPrime Ltd, Cheadle Hulme, UK) stabile isotope ratio mass spectrometer (EA-IRMS). Carbon isotope values are given in delta notation relative to the Vienna Pee Dee Belemnite standard (VPDB; Hut, 1987). Data were corrected with a variety of standards from the International Atomic Energy Agency (IAEA) and in-house standards (Supplement, Table S1). Pedogenic Fe and Al fractions were analyzed by selective extractions. Oxalate extractions were conducted according to McKeague and Day (1966) by using 0.2 M ammonium oxalate (pH 3) to dissolve poorly crystalline aluminosilicates and Fe hydroxides like ferrihydrite, as well as Fe and Al from organic complexes (Feo, Alo). Iron present in organic complexes, poorly crystalline, and crystalline Fe oxides (Fed) was analyzed by extraction in dithionite-citrate following the method created by Mehra and Jackson (1960) and modified by Sheldrick and McKeague (1975). All extraction solutions were analyzed for dissolved Fe and Al by inductively coupled plasma optical emission spectroscopy (ICP-OES; Varian 725-ES, Palo Alto, California, USA)..
Water-extractable OM (WEOM) was used as surrogate of DOM migrating in the soil profile (Corvasce et al., 2006). Prior to the extraction, the frozen samples were thawed for 24 h at 4 ∘C and thereafter sieved to <2 mm. Following the procedure of Chantigny et al. (2007), 25 g of fresh, field-moist soil was extracted with 1 mM CaCl2 solution at a soil ∕ solution ratio of 1∕3. Samples were shaken horizontally for 1 h at a frequency of 3 s1 at 4 ∘C. After centrifugation for 30 min at 3500 g at 4 ∘C, extracts were filtered through 0.45 µm cellulose-nitrate membranes (Sartorius Stedim Biotech GmbH, Göttingen, Germany). Prior to the filtration, filters were pre-rinsed with 250 mL of the 1 mM CaCl2 solution. Organic carbon concentrations in the extracts (CWEOM) were measured by high-temperature combustion with a varioTOC elemental analyzer (Elementar, Hanau, Germany). The δ13C values of WEOM were measured with an isoTOC cube coupled to an IRMS vision (Elementar, Hanau, Germany; Leinemann et al., 2018). The ultraviolet (UV) absorbance at 280 nm of WEOC was measured with the Specord 200 UV-VIS spectrometer (Analytic Jena AG, Jena, Germany). Specific ultra violet absorbance at 280 nm (SUVA) was calculated according to Chin et al. (1994) as the ratio of UV absorbance at 280 nm and DOC concentration. Prior to fluorescence measurements, samples, if necessary, were diluted to absorbance values <0.1 at 280 nm. Thereafter, emission spectra from 300 to 500 nm were measured at an excitation wavelength of 254 nm (Zsolnay et al., 1999) at a Perkin Elmer LS 50 luminescence spectrometer (Perkin Elmer, Waltham, MA, USA). For all measurements the scan rate was 100 nm min−1 and the ex slit ∕ em slit was 15∕10. The stability of the instrument was checked with the Raman peak of deionized water at 350 nm. The fluorescence emission index (HIX) was calculated as the ratio of the area between 435 and 480 nm and the area between 300 and 345 nm of the emission spectrum (Zsolnay et al., 1999) using FL Winlab Software.
2.4 Density fractionation
Samples for density fractionation were selected in order to represent the topsoil (0–5, 5–10 cm), the upper subsoil (10–20, 20–30, 30–40, 40–50 cm), and the deeper subsoil (100–120, 120–140 cm). Density fractionation was conducted according to Golchin et al. (1994a, b), with the following adjustments based on pretests. Aliquots of 25±0.05 g bulk soil were separated into two light fractions (LF), free and occluded particulate OM (fPOM and oPOM), and one heavy fraction (HF) containing MAOM. After adding 125 mL sodium polytungstate (SPT) solution (SPT 0, TC-Tungsten Compounds, Grub am Forst, Germany) with a density of 1.6 g cm−3 (Kaiser and Guggenberger, 2007; Cerli et al., 2012), the suspensions were manually stirred and allowed to rest for 1 h. Afterwards, the samples were centrifuged at 4000 g and 17 ∘C for 30 min (Cryofuge 6000, Heraeus Holding GmbH, Hanau, Germany) and the supernatant, containing fPOM material, was filtered through 0.45 µm polyethersulfone filters (PALL Life Sciences, Ann Arbor, Michigan, USA). The fractionation of the fPOM was repeated once. In a second step, aggregates were destroyed to release oPOM by ultrasonic treatment (Sonopuls HD2200, Bandelin electronic GmbH & Co KG, Berlin, Germany) with an energy input of 60 J mL−1 (Gentsch et al., 2015; Schiedung et al., 2016). Prior to the treatment, ultrasonic power of the sonotrode was assessed calorimetrically and ultrasound durations were calculated according to North (1976). After centrifugation at 6000 g for 30 min, the supernatant with oPOM material was filtered as well. Both fPOM and oPOM were washed with ultrapure water (18.2MΩ) until the electrical conductivity of the eluate was <5 µS cm−1 (Angst et al., 2016). The HF was washed three to four times with 200 mL ultrapure water until the conductivity was <50 µS cm−1. The water used for washing the HF was collected and measured for dissolved OC (CW). We also measured dissolved OC in all posttreatment SPT solutions. This SPT-mobilized C (CSPT) was taken to represent mobilizable and potentially labile soil OC (Gentsch et al., 2018), derived from POM and MAOM. The dissolved OC concentrations were measured within 2 d after the fractionation by high-temperature combustion with a limit of quantification of 1 mg C L−1 (Leinemann et al., 2016) using a vario TOC cube (Elementar, Hanau, Germany). Aliquots of both liquid phases were freeze-dried similar to the soil fractions for analysis of OC, TN, and 13C∕12C ratios by EA-IRMS. Due to negligible amounts of POM material in the deeper subsoil samples (100–140 cm), fPOM and oPOM were no longer differentiated. The mean mass recovery in fPOM, oPOM, and HF after fractionation was 99.1±0.9 %. The mean C recovery after fractionation was 98.3±26.5 %, including data for the mobilized CW and CSPT. On average, 2.0±2.2 % of the C was mobilized by the fractionation procedure. Nitrate and ammonium were extracted from bulk and HF samples to analyze inorganic N contents (Nmin). Extraction was carried out according to Blume et al. (2010) by mixing 4±0.01 g soil with 16 mL 0.0125 M CaCl2 solution and shaking the mixture for 1 h on an overhead shaker. After sedimentation, the supernatant was filtered through 0.45 µm cellulose acetate filters (BerryTec GmbH, Grünwald, Germany) and measured by a segmented flow analyzer (San++ analyzer, Breda, the Netherlands) with a limit of quantification of 0.1 mg N L−1. Organic N contents were calculated by subtraction of Nmin from TN. Surfaces of the HF were further investigated by X-ray photoelectron spectroscopy (XPS) with respect to the elemental composition as a function of soil depth. Method description and data are presented in the Supplement.
2.5 Calculations and statistics
Soil OC stocks (kg m−2) were calculated according to Eq. (1):
with the OC content (mg g−1) and bulk density of the fine earth fraction (g cm−3) of each soil increment multiplied by the increment thickness (cm). The proportion of each SOM fraction (OCfrac, in %) in percent of the total recovered OC was calculated based on the sum of all fractions (ΣOC):
Water-extractable OC (CWEOM) was calculated as the percentage proportion relative to OC in the respective bulk soil sample, according to Eq. (3):
As mentioned earlier, all soil fractions released C to the CSPT pool, whereas the CW fraction solely originated from the MAOM in the HF fraction. Thus, the CW fraction was added to the MAOM. Further, the δ13C values of the MAOM (CMAOM, in ‰) were corrected for the δ13C values of CW by using Eq. (4):
with MMAOM as the C mass (mg) of the HF fraction, M as the C mass (mg) in the total washing solution, and the δ13C values (‰) of both fractions (δ13CMAOM and δ13CW, respectively).
The 13C-labeled samples were used to calculate the proportion of native SOC (SOCnat, in %) and label-derived SOC (SOCL, in %) by Eqs. (5) and (6):
with 13CL as the δ13C value of the labeled sample, 13CuL as the δ13C value of the unlabeled control in the same soil depth, and 13Cin as the δ13C value of the initial labeled litter.
The recovered label-derived SOC was further quantified by calculating the SOC stocks in each respective depth, further calculating the proportion of label-derived SOC, and finally relating the label-derived SOC to the amount of the labeled C in the litter input. The total recovered label was calculated as the sum of the label recovered in all OM fractions and respective soil depth increments and given in g C m−2. The potential loss over time was calculated as the relative decrease in recovered label in the 18-month interval between both sampling times.
If not stated differently, data are given as the mean of the three replicates ± the standard deviation (SD). Depths refer to the mean depth per depth increment. δ13C values (‰) of the labeled samples and fractions (13CL) were tested for significant enrichments compared to the natural variations in the control with the upper 90 % quantile limit of the frequency distribution (Nielsen and Wendroth, 2003), using Eq. (7):
with as the mean and SDuL as the standard deviation of the unlabeled control samples of the respective soil increment (n=3). The t value originated from the Student's t distribution (; p=0.9). Only values passing this comparison were used for recovery calculations. Data were tested for normal distribution by using Shapiro–Wilk normality test, prior to linear correlation analyses. Analyses were performed with SigmaPlot 14 (Systat Software GmbH, San Jose, USA) by using Pearson correlations (for normal distributed data, p<0.05) or Spearman rank-order correlations (for not normal distributed data, p<0.05). Label recoveries in density fractions and WEOM were tested for significant changes with depth and between both sampling times by analysis of variance (ANOVA, p<0.05) with the Tukey test as post hoc analysis.
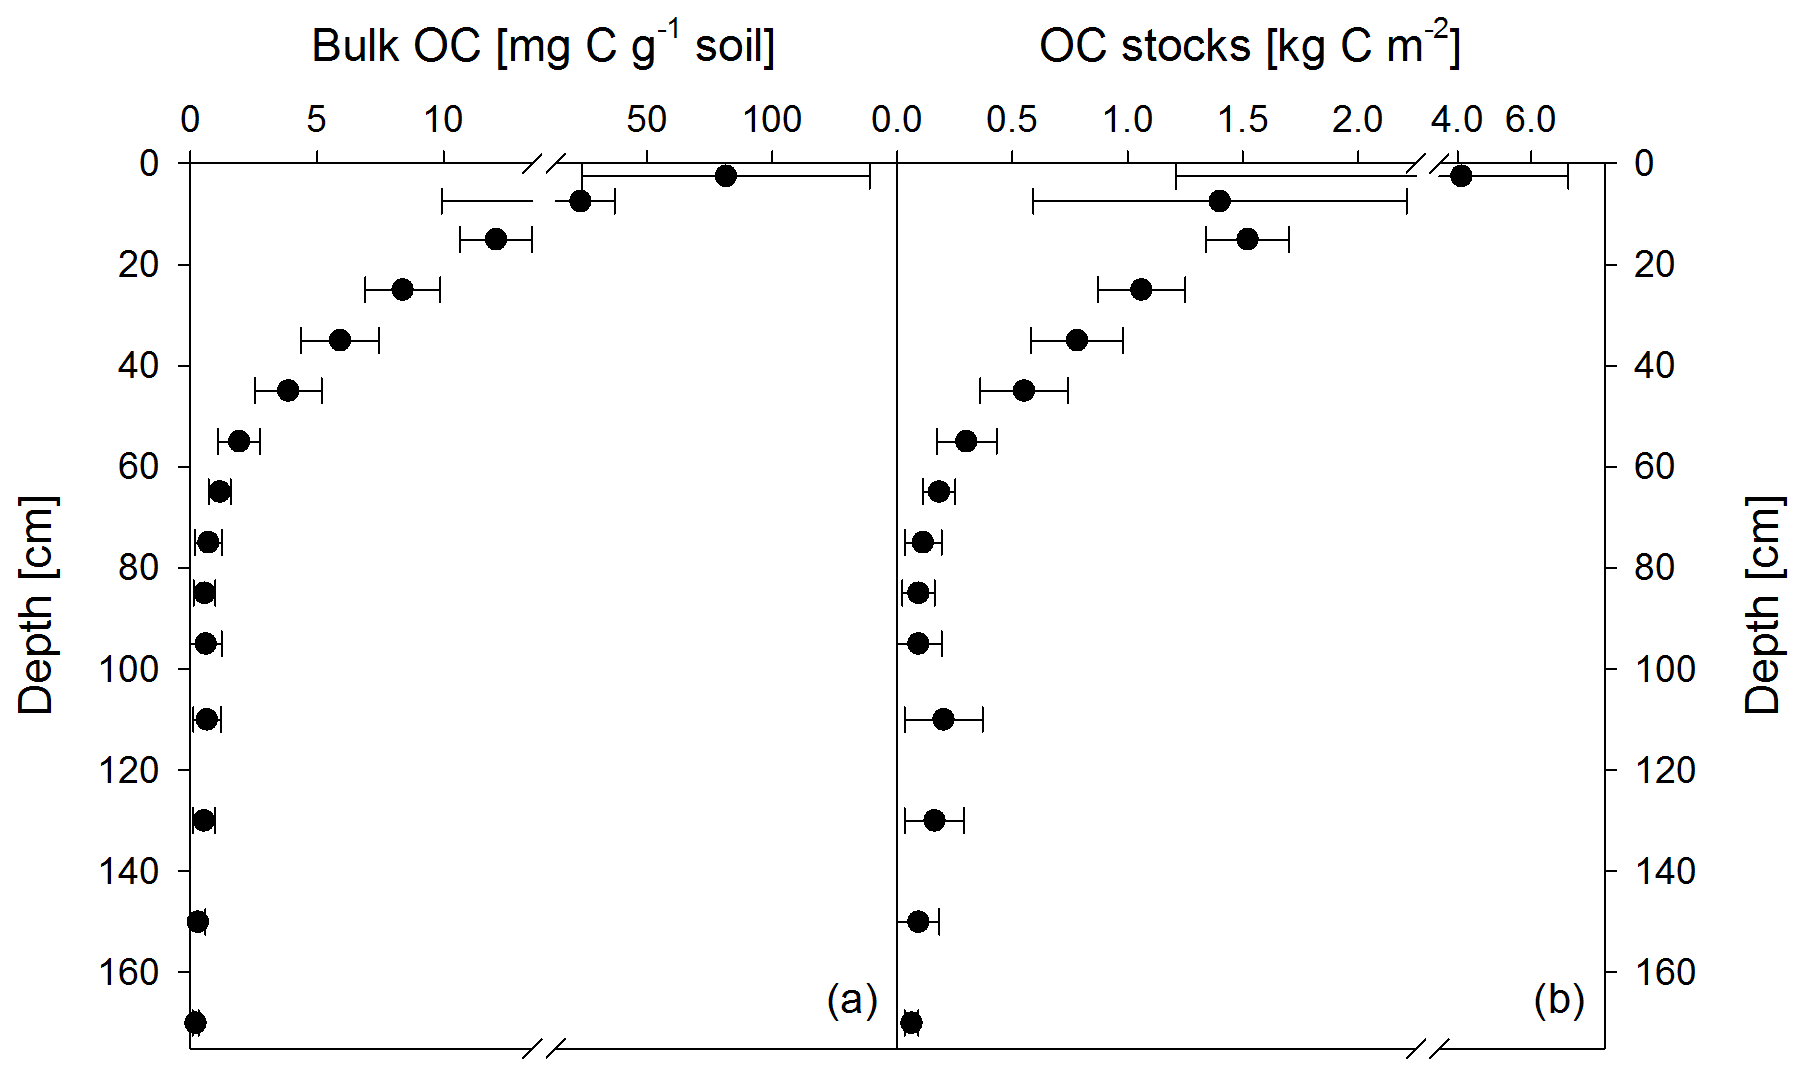
Figure 1Mean bulk OC contents of both sampling times (November 2016 and May 2018) (a) and calculated OC stocks as the mean of both sampling times (b). Apparent re-increasing OC stocks below 100 cm are the result of doubling the thickness of the analyzed depth increments (i.e., 5 cm increments from 0 to 10 cm, 10 cm increments from 10 to 100 cm, and 20 cm increments from 100 to 180 cm). Data show the mean of 12 samples, and error bars depict the standard deviation.
3.1 Depth distribution and properties of SOC
Soil OC contents decreased strongly from about 82±57 mg g−1 in the upper topsoil increment (0–5 cm) to 4±1 mg g−1 in the upper subsoil at 40–50 cm soil depth (Fig. 1a). Within the deeper subsoil, OC content further decreased to about 0.2 mg g−1 in the deepest increment at 160–180 cm. Organic C stocks in the topsoil (0–10 cm depth) averaged about 5.5 kg C m−2 at both sampling dates, representing 48 % of the OC stock down to a soil depth of 180 cm (Table 2). Deeper subsoil only accounted for 5 % of the SOC stock (Table 2).
Table 2Mean OC stocks in bulk soil of different soil compartments down to 180 cm presented as absolute values and as a percent of total soil OC stock (n=12; standard deviation is given in brackets).

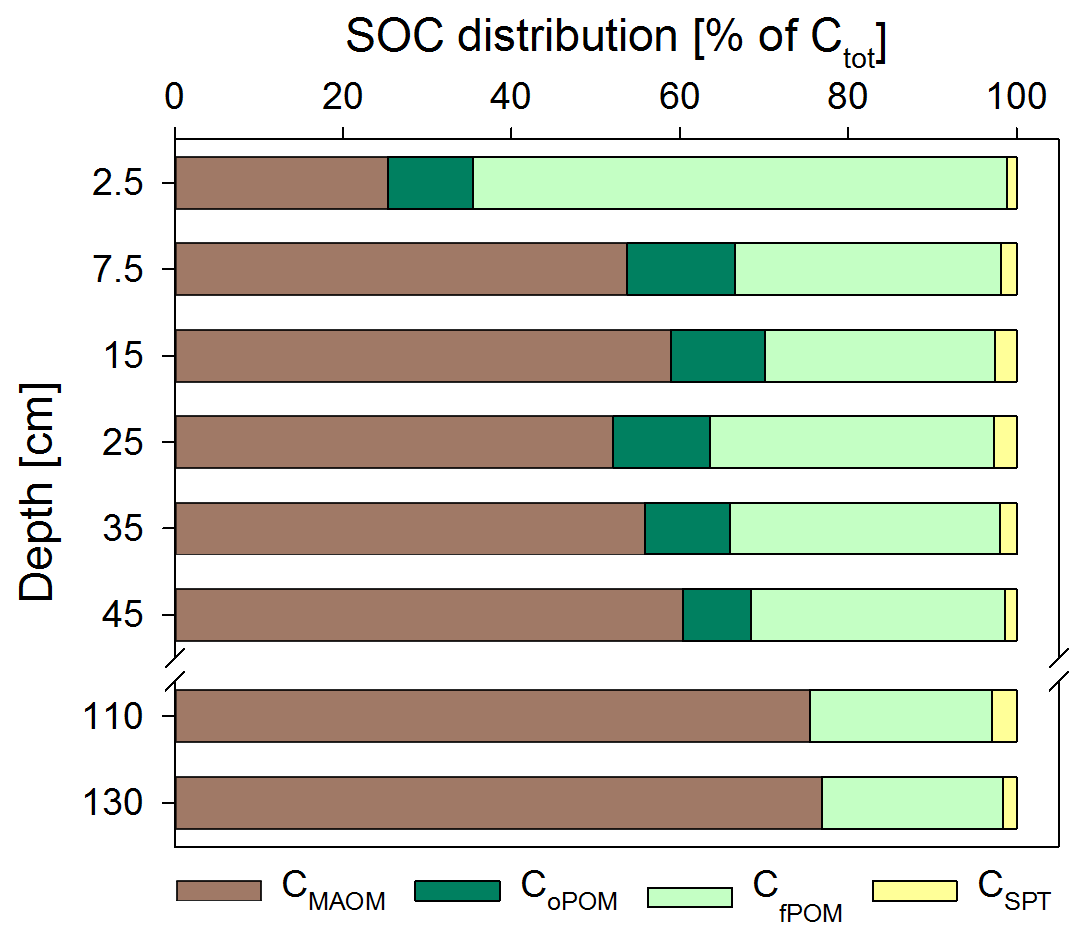
Figure 2Soil OC (SOC) distribution in the Dystric Cambisol at the Grinderwald site as a function of soil depth: C in mineral-associated OM (CMAOM), occluded particulate OM (CoPOM), and free particulate OM (CfPOM); C mobilized by sodium polytungstate during density fractionation (CSPT). All data are given as mean of both samplings (n=12; standard deviation varied for CMAOM between 7 % and 19 %, for CoPOM between 2 % and 5 %, for CfPOM between 7 % and 19 %, and for CSPT between 0.3 % and 5 %). Note that the CMAOM fraction was corrected for the C loss during washing (see Sect. 2).
Directly underneath the litter layer, the majority of SOC was present as POM (Fig. 2). With increasing soil depth, the relative contribution of CPOM to SOC decreased to <25 %, whereas the contribution of CMAOM increased. As for SOC, the CMAOM content also declined from about 10 to 22 mg C g−1 HF in the topsoil to 0.3 to 0.4 mg C g−1 HF in the deeper subsoil of 100–140 cm soil depth (Fig. 3a). The C ∕ N ratio of the MAOM decreased with depth from about 20 in the topsoil to ∼5 in the deep subsoil (Fig. 3b), similar to the bulk soil C ∕ N (Fig. S1). Mean ratios from the first sampling in November 2016 were insignificantly (but consistently) higher compared to the second sampling in May 2018. The CSPT fraction amounted to 1 % to 3 % of the SOC for all soil depths without a consistent trend (Fig. 2). The contribution of CWEOM showed an increase with soil depth from 0.2 % of SOC in the topsoil to 0.7 % to 1.3 % in the deeper subsoil (Fig. 4a). In addition, water extracts showed a compositional change with increasing soil depth, as SUVA values decreased below 10 cm soil depth until reaching the minimum in the deep subsoil (Fig. 4b). The humification index derived from fluorescence spectra first increased from the topsoil to its maximum in the heavily rooted upper subsoil (Heinze et al., 2018; Wordell-Dietrich et al., 2019). Below this, a constant decrease with increasing soil depth was observed (Fig. 4c).
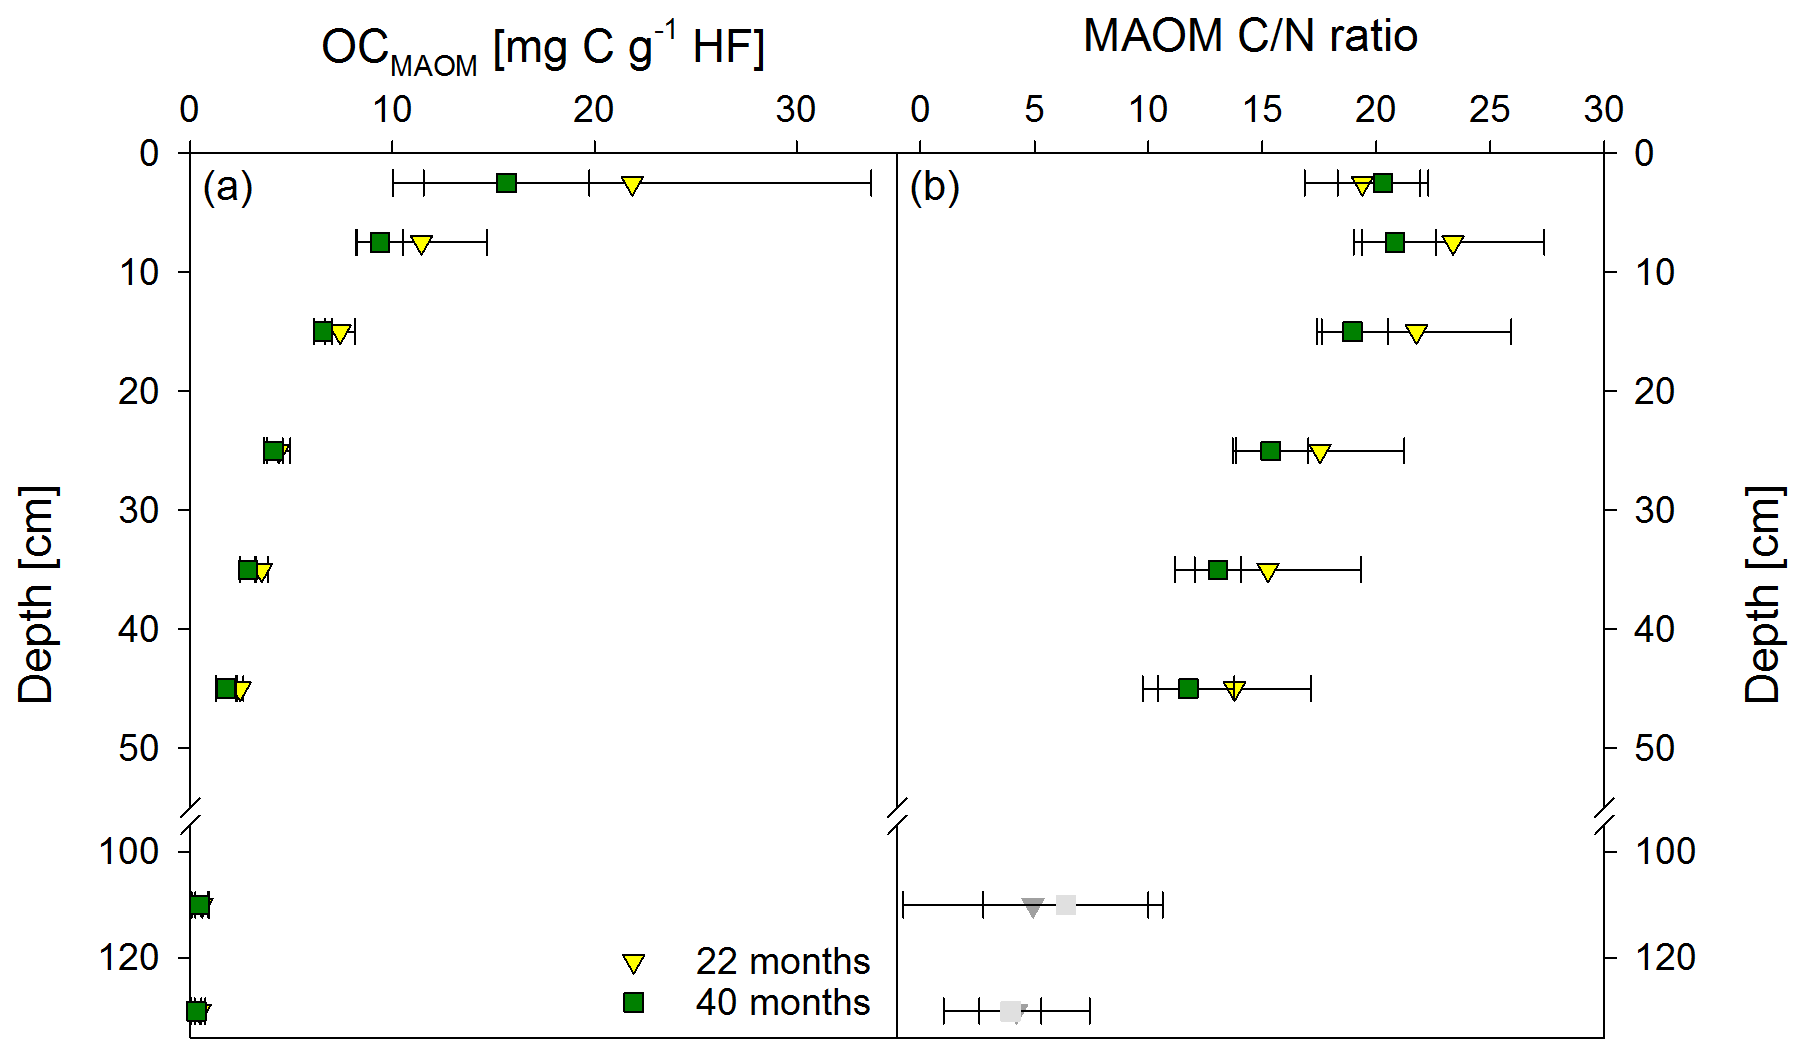
Figure 3Mean OC contents in the heavy fraction (HF) (a) and mean C ∕ N ratios (b) of the mineral-associated organic matter fraction (MAOM) from both sampling times, 22 and 40 months after labeled litter application (n=6; error bars represent the standard deviation). Nitrogen contents in the HF were corrected for extractable nitrate and ammonium contents; N contents in samples below 100 cm were unreliable, and C ∕ N ratios are therefore marked in grey.
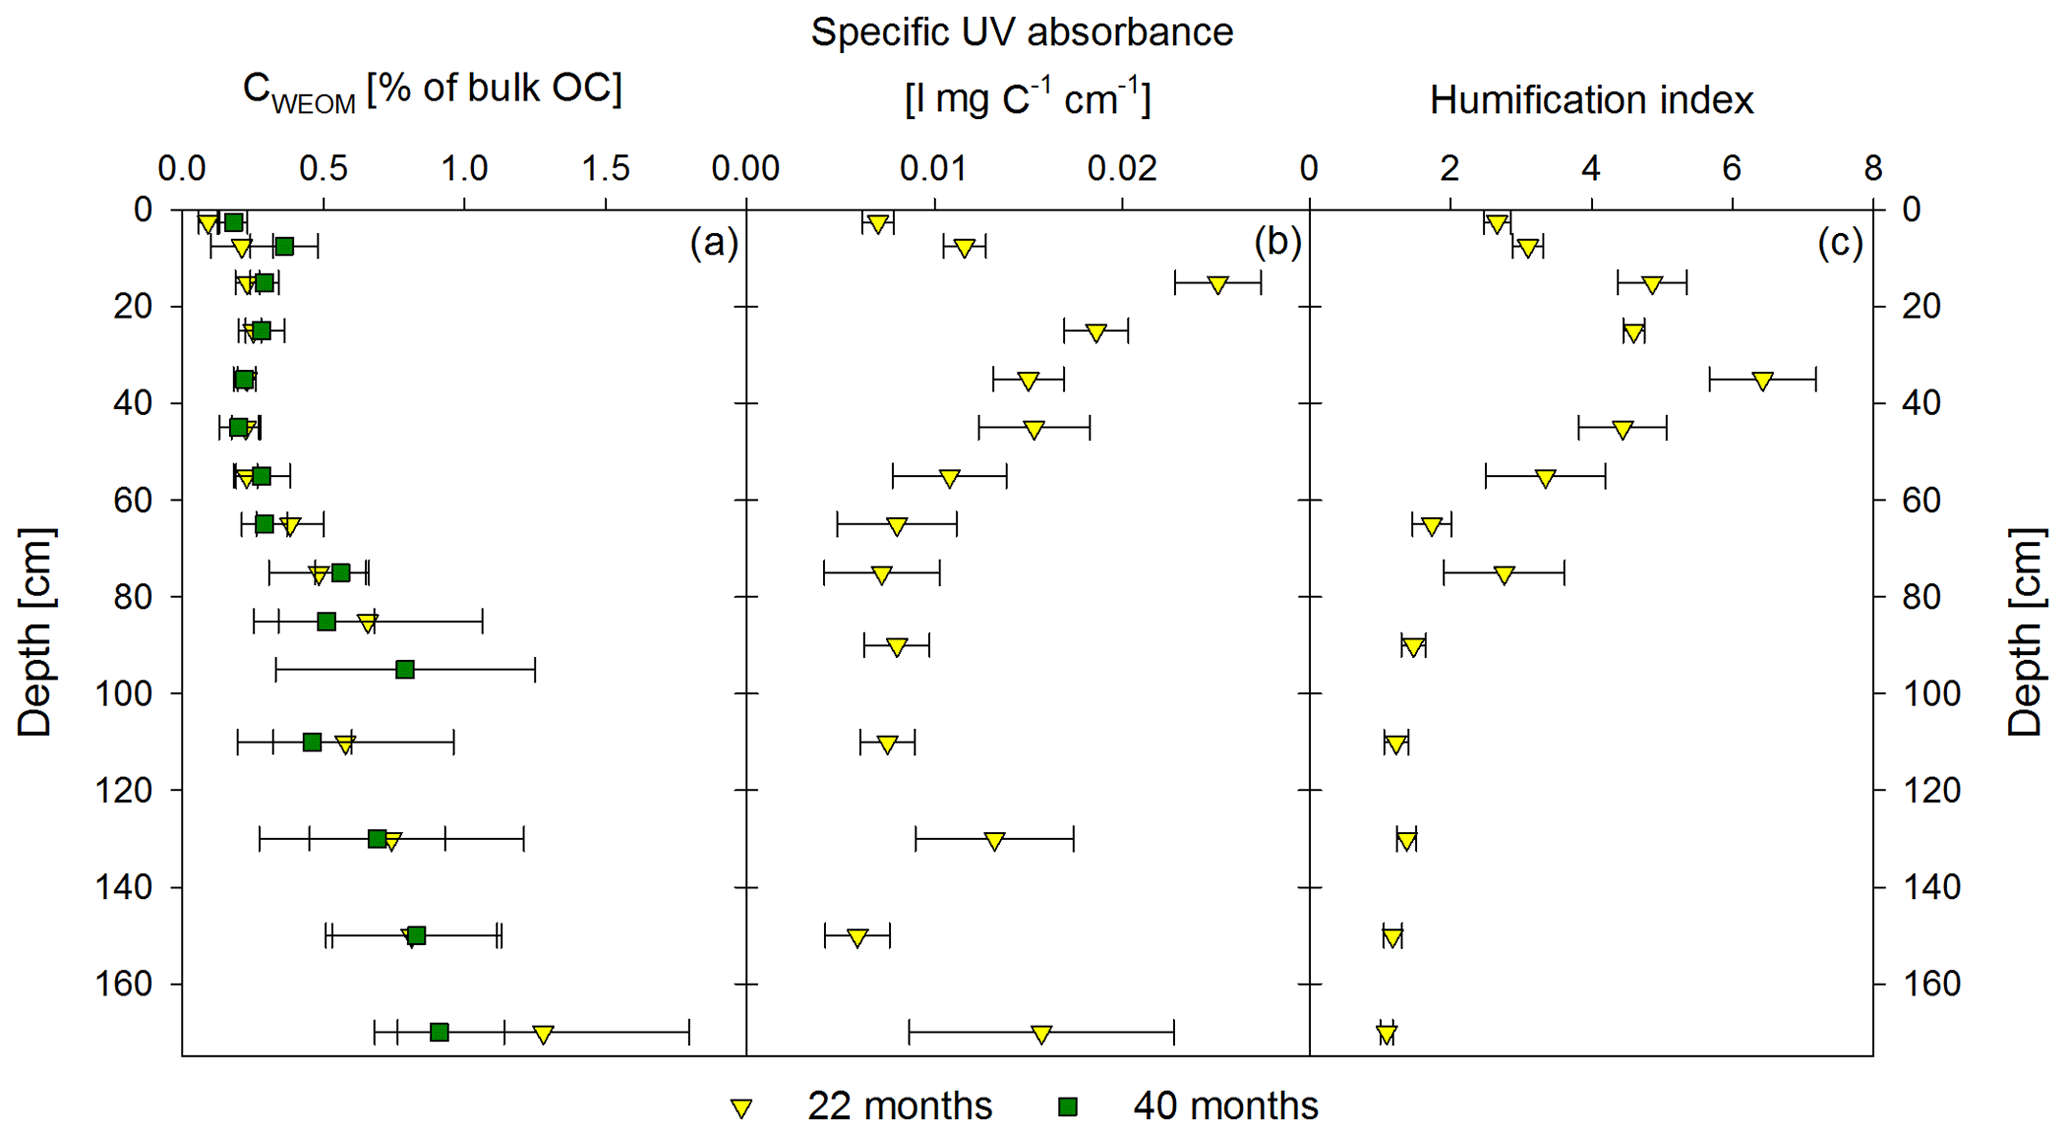
Figure 4Mean proportion of water-extractable OC (CWEOM) per depth increment given in percentage of the total soil OC in bulk soil for both sampling times, 22 months and 40 months after labeled litter application (n=6; error bars represent the standard deviation) is shown in (a). Specific UV absorbance at 280 nm (b) and humification index deduced from fluorescence spectra (c) of the water extracts are given as the mean (n=6) of the first sampling in November 2016. Error bars represent the standard error.
3.2 Labeled litter-derived C in functional soil OM fractions
Based on δ13C values, bulk OM was more enriched in 13C from labeled litter than MAOM (Fig. 5a, b). Enrichments in MAOM were significant down to 20 cm soil depth compared to the control. After 40 months, the 13C-enrichment of MAOM was still significant down to 20 cm, but δ13C values shifted closer towards the background (Fig. 5b). Water-extractable OC showed a significant 13C-enrichment at greater soil depth (60 cm) compared to the bulk soil and MAOM at both sampling dates (Fig. 5a–c). Below this depth, there was still a noticeable 13C-enrichment of CWEOC in the labeled plots, albeit not a significant one.
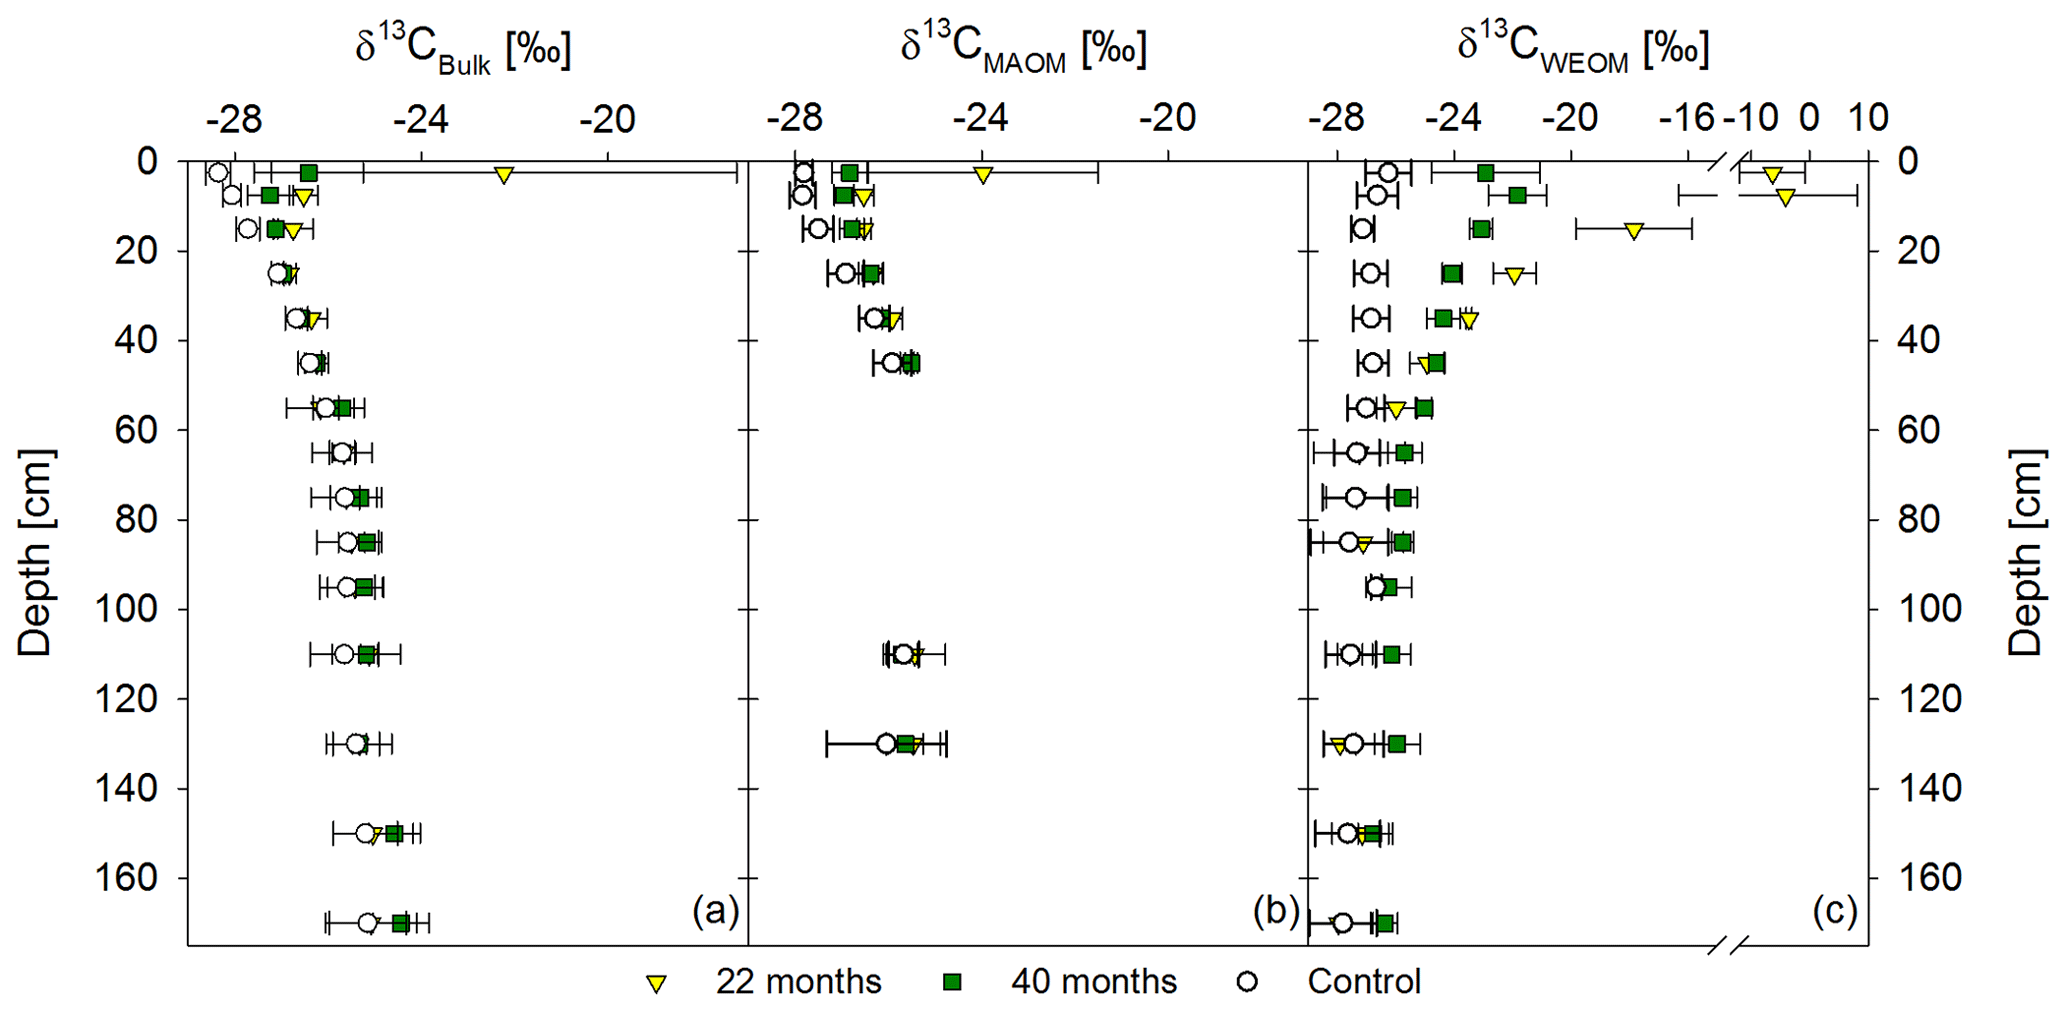
Figure 5Mean δ13C values of the bulk soil (a), mineral-associated OM (CMAOM) (b), and water-extractable OM (CWEOM) (c). The graphs show labeled samples of both sampling times, 22 and 40 months after labeled litter application, in colored symbols, compared to the respective unlabeled background distribution in white symbols. Labeled samples represent the mean of three replicates per sampling time, while the control represents the mean of both sampling times (n=6). Please note that the x axis in (c) has a different scale.
After 22 months, about 11.2 % of the 13C-labeled litter exposed at the soil surface was recovered in the selected depth increments (0–50, 100–140 cm), with a minor contribution of the deeper depth increments (Figs. 6a, S3). Considering the 13C of litter origin at 50–100 cm soil depth by linear interpolation between the increments of 40–50 cm and 100–120 cm, this value would increase by only 0.03 %. The majority of 87 % of the 13C label was recovered in the first 5 cm of the topsoil, while below 40 cm the recovery was negligible (<0.2 % of total labeled litter). A total of 18 months later, the recovered labeled 13C was lower in all depths compared to the first sampling, albeit not significant due to large variations between the plots, with a total recovery of 1.8 %. In the soil increments below 40 cm, the label vanished completely in the density fractions at the second sampling, while minor proportions of label were still recovered within CWEOM (Fig. 5c).
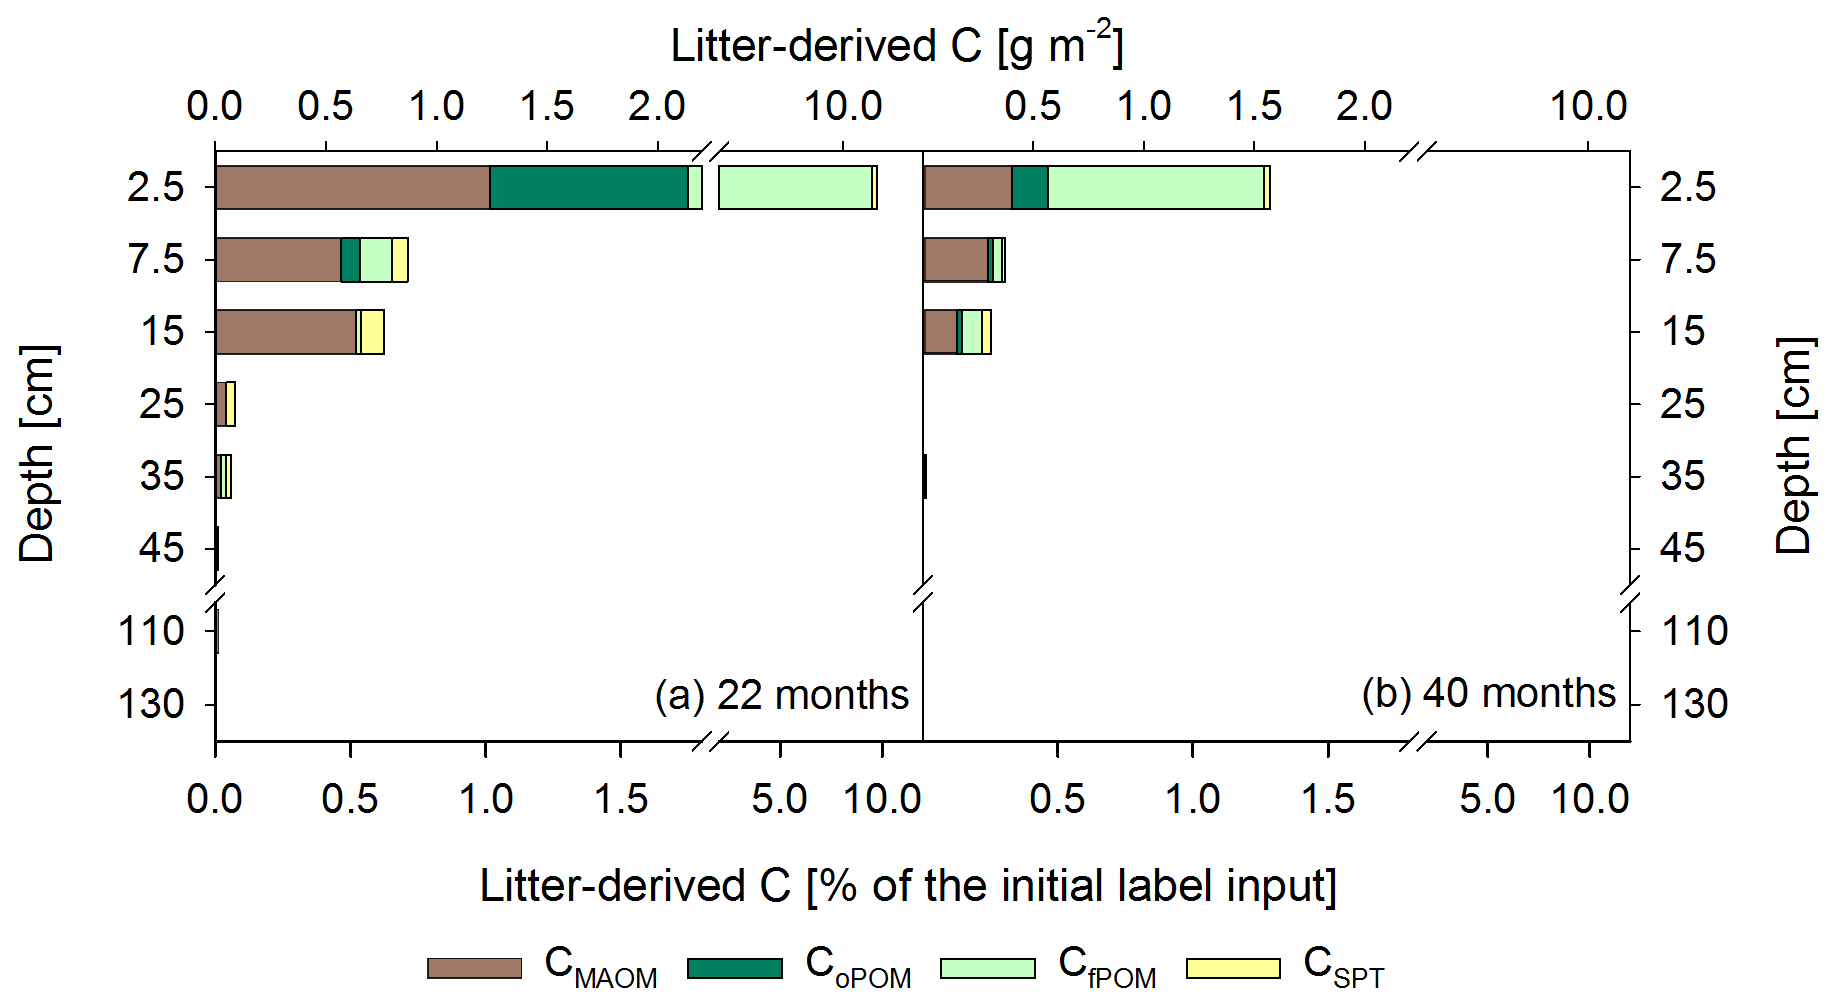
Figure 6Mean labeled litter-derived 13C recovered in different OM fractions: C in mineral-associated OM (CMAOM), occluded particulate OM (CoPOM), and free particulate OM (CfPOM); C mobilized by sodium polytungstate during density fractionation (CSPT). The upper x axis shows the recovered 13C in g m−2, and the lower x axis shows the percentage recovery of initially added labeled litter after 22 months (a) and 40 months following labeled litter application (b). Bars show the sum of all fractions per depth increment, while the different colors represent the respective contribution of each fraction to the total recovery (n=3). According to ANOVA tests there were no significant changes in 13C recovery for each fraction with depth per sampling, due to high standard deviations in the range of 0.02–0.53 for CMAOM, 0.01–0.75 for CoPOM, 0.02–4.9 for CfPOM, and 0.01–0.13 for CSPT.
In total, we found that within 22 months about 8.7±5.6 % of the applied labeled litter was incorporated as POM in the mineral topsoil (Fig. 6a). This corresponds to 9.9±6.1 g C m−2 fPOM and 1.0±0.9 g C m−2 oPOM, most of it located in the 0–5 cm topsoil increment. Below, the contribution of labeled litter-derived POM decreased strongly. Nevertheless, recovered labeled litter in the oPOM fraction was detected at even greater depth (30–40 cm) after 40 months. Litter-derived 13C in the MAOM fraction represented 0.7 % to 2.0 % of the recovered label in the top 20 cm at both sampling dates (Fig. 6), representing a contribution of litter-derived C to the total CMAOM of only about ∼0.2 %. Below, contributions were even lower. Additionally, the CSPT fraction, particularly that of the topsoil and upper subsoil of the first sampling date, showed a 13C-enrichment (Fig. 6a).

Figure 7Mean proportion of litter-derived C in water extractable organic OM (WEOM) in percentage of the initial label input for both sampling times, 22 and 40 months after labeled litter application, with soil depth (n=3; error bars represent the standard deviation). According to ANOVA tests, significant changes between both samplings were only present in the 0–5 and 10–20 cm increments (p<0.05). Significant differences between soil increments were only present for the topsoil increments compared to all subsoil increments for each sampling time.
Table 3Mean contents of labeled litter-derived OM in different soil fractions of all depth increments used for density fractionation (0–50 cm, 100–140 cm), 22 months (November 2016) and 40 months (May 2018) after labeled litter application (n=3; standard deviation is given in brackets). The percentage loss over 18 months was calculated based on differences in C contents in OM fractions at both samplings. Overall, 36 %–40 % of the initially applied litter was lost by respiration during 22 months of field exposure (Wordell-Dietrich, unpublished).
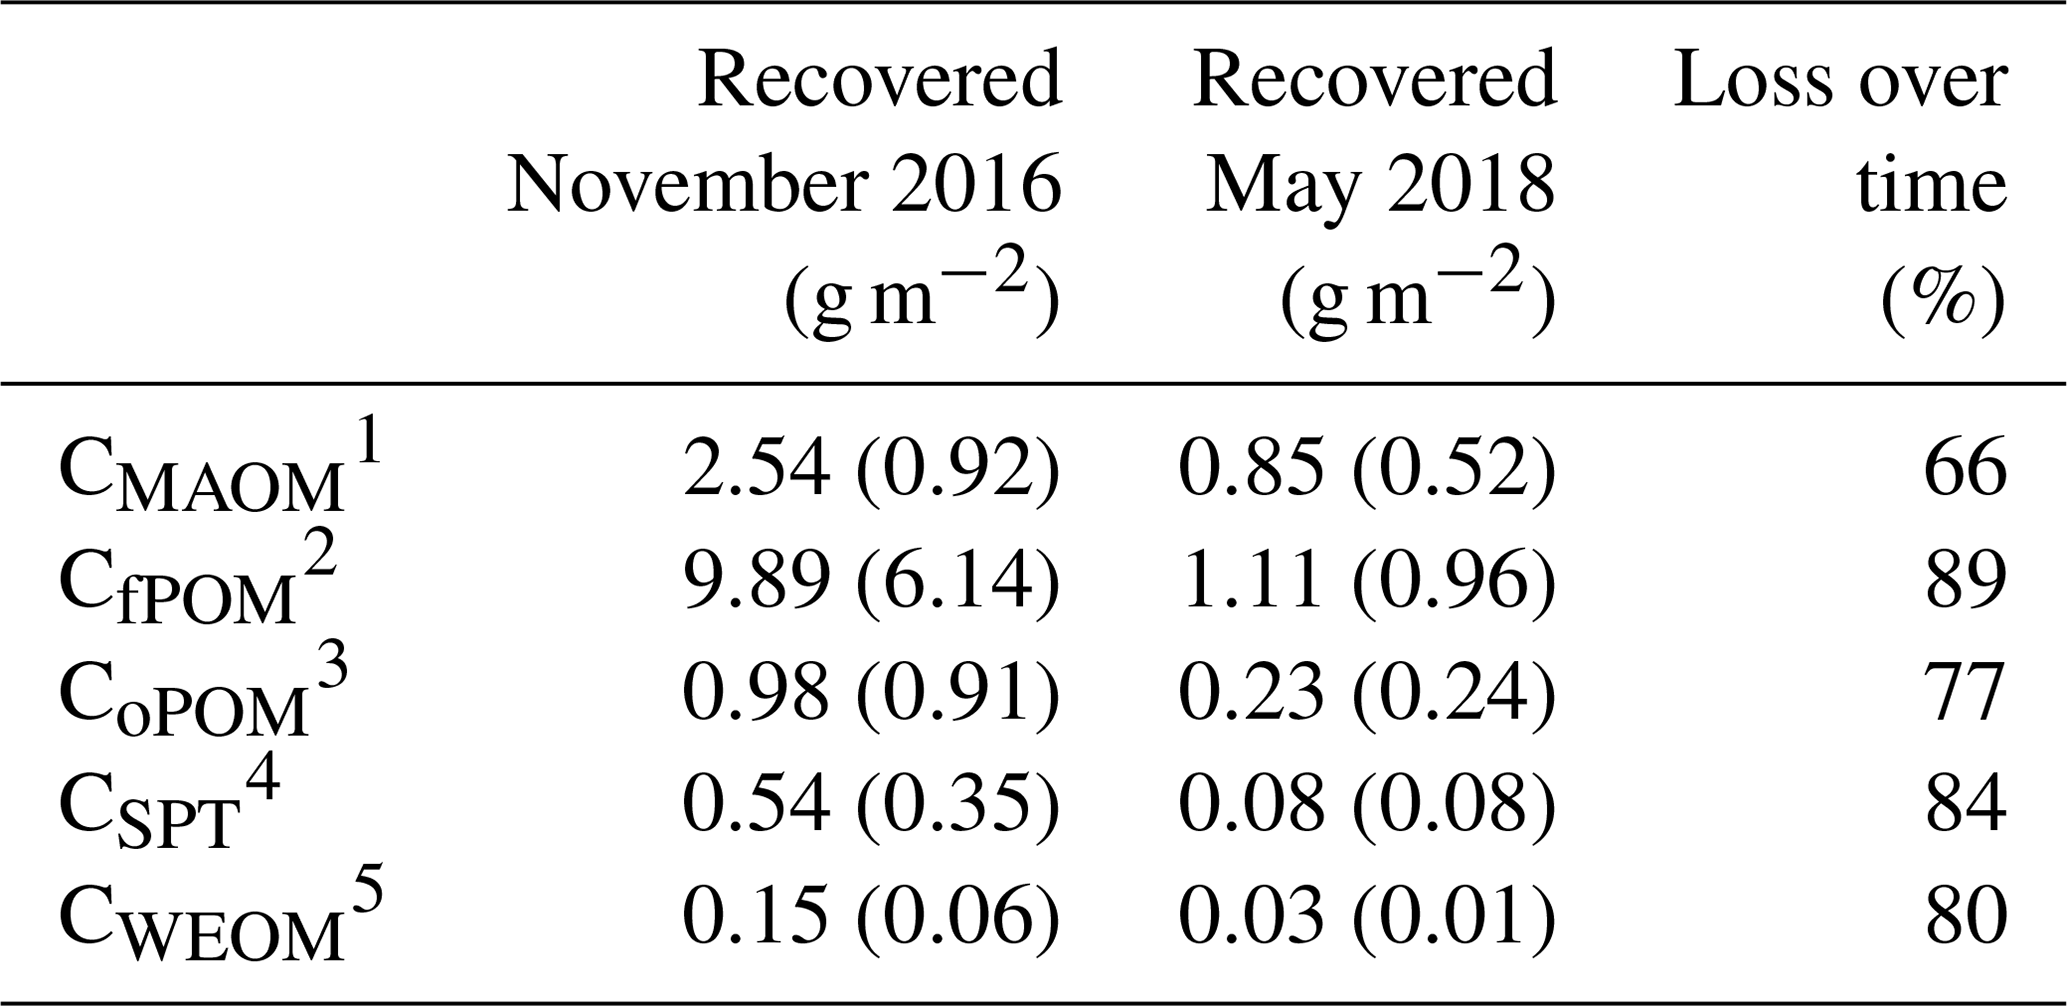
1 Carbon in mineral-associated OM (CMAOM). 2 Carbon in free particulate OM (CfPOM). 3 Carbon in occluded particulate OM (CoPOM). 4 Sodium polytungstate–mobilizable C (CSPT). 5 Carbon in water-extractable organic matter (CWEOM).
However, 18 months after replacing the labeled by unlabeled litter, the proportion of labeled litter-derived C in the SPT solution decreased by 84 % on average (Table 3) and the label was only detectable down to 20 cm soil depth (Fig. 6b).
Proportions of labeled litter-derived C in WEOM illustrated clear depth and temporal trends (Fig. 7). The CWEOM fraction in the topsoil contained more than 1 % of C originally derived from the litter layer at the end of the labeling period in November 2016, with a strong decrease with depth. Below 40 cm, proportions were consistently <0.2 %. A total of 18 months after litter replacement, the contribution of labeled litter-derived C in WEOM decreased to <0.3 % in the whole soil profile.
Mean loss of the recovered litter-derived 13C over the time period of 18 months between the two samplings was 79 %, and all fractions showed a considerable loss of >65 % (Table 3). The losses followed the sequence: fPOM (89 %) > WEOM (80 %) > oPOM (77 %) > MAOM (66 %). The decline of the label from mass-weighted individual OM fractions was similar in magnitude to the loss of labeled litter-derived C in the bulk samples (77 %; data not shown).
4.1 Particulate OM in the soil profile and contribution of litter-derived POM
Particulate OC contributed 59±16 % to SOC in the Grinderwald topsoil. This high contribution of POM is likely a consequence of translocation by the mesofauna and macrofauna, as bioturbation can drive both inputs and mineralization of SOC (Wilkinson et al., 2009). Results are somewhat higher than findings of Schrumpf et al. (2013), who reported 25±16 % POM contribution to the SOC for several European study sites. Below the topsoil, amounts of POM were only minor (Supplement, Fig. S2). The proportional decrease in POM with soil depth confirms the findings of Kaiser et al. (2002), who reported a similar decrease in the contribution of POM to SOM from about 65 % in the topsoil to 5 % in the subsoil C horizons, illustrating a decreasing role of root input and bioturbation in subsoil horizons (Heinze et al., 2018). Our results suggest that the majority of POM in the topsoil is not directly connected to annual litter inputs as these are very small compared to the total POM pool. Similar to our observations, Lajtha et al. (2014b) reported that a 2-fold increase in litter input did not affect the C concentrations in either the bulk soil, POM, or the HF fraction of the mineral topsoil and upper subsoil within 20 years. They concluded that forest SOC pools are not tightly coupled to changes in aboveground litter inputs in the short term. In the upper and deeper subsoil, recent litter-derived POM was barely present after 22 months, and completely vanished after 40 months, suggesting that most POM in the subsoil instead derives from root biomass.
In the 18 months between both samplings, we found that 89 % of recent litter-derived fPOM and 77 % of the oPOM material were lost in the soil profile. Consequently, new POM inputs are unstable and prone to decomposition, in line with reported turnover times of <10 years (Gaudinski et al., 2000; Baisden et al., 2002). Along with that, Crow et al. (2009) described the aboveground litter as the source of the most actively cycling soil C. The smaller C loss from oPOM compared to fPOM within 18 months (77 % and 89 %) reflects a better protection of occluded POM compared to free POM even in this loamy sand soil (Table 1).
4.2 Mineral-associated OM and incorporation of litter-derived C via the DOC pathway
Beside bioturbation and rhizodeposition, translocation and sorption of DOM to the soil matrix are the other prominent processes transferring C to the subsoil (Kaiser and Kalbitz, 2012; Mikutta et al., 2019). The observed strong decrease in the contents of mineral-associated OC with soil depth (Fig. 3a) is in line with smaller root exudation rates (Tückmantel et al., 2017) and DOC fluxes (Leinemann et al., 2016) with increasing soil depth at the Grinderwald site. This also reflects a decrease in available sorption sites with depth due to increasing sand contents (Table 1) and decreasing amounts of poorly crystalline Fe phases (Feo contents; Supplement, Table S2). Leinemann et al. (2016) observed a decrease in SUVA values of DOM with increasing soil depth, indicating a preferential sorption of plant-derived compounds in the upper parts of the soil profile. Specific UV absorbance and the fluorescence indices (HIX) of our water extracts showed a similar decline with soil depth, thus underpinning sorption as a relevant process. Decomposition of roots can substantially contribute to the subsoil SOM pool as well (Rasse et al., 2005). But since root density (Heinze et al., 2018; Wordell-Dietrich et al., 2019) and root exudation (Tückmantel et al., 2017) are low in the Grinderwald subsoil, we assume that the increasing share of MAOM with soil depth instead suggests an increasing importance of DOM as a dominant source of C in this forest subsoil, irrespective of its origin. This depth trend was accompanied by a compositional change of MAOM, as indicated by decreasing C ∕ N ratios and increasing δ13C values. Fresh litter-derived MAOM in the topsoil had typically wide C ∕ N ratios of about 19 to 22 and low natural abundance δ13C values of about −27 ‰ to −28 ‰ (Figs. 3b, 5b). Microbial processing (Six et al., 2001; Schmidt et al., 2011) and preferential sorption of 13C-depleted plant-derived phenols in the topsoil (Guggenberger and Zech, 1994; Kaiser et al., 2001) alter the SOM characteristics with increasing soil depth by narrowing the C ∕ N ratio and increasing the 13C content. In line with this view, the δ13C of MAOM in the unlabeled control soil showed a consistent increase with decreasing C ∕ N ratio with depth (Supplement, Fig. S4), thus pointing towards an increasing contribution of microbially processed MAOM with soil depth, as proposed in the “dynamic exchange” or “cascade model” (Kaiser and Kalbitz, 2012). Gleixner (2005) likewise attributed this trend to a higher contribution of plant and root litter in topsoil horizons, whereas the deeper subsoil horizons are dominated by microbial-derived OM. A change towards microbial-derived OM is further supported by decreasing SUVA and HIX values of WEOM from the upper subsoil downwards, suggesting more aromatic and complex plant-derived OM components like phenols being retained in the topsoil, while more microbial-derived components like carbohydrates are present in the subsoil.
On average 1.46±0.67 % of the fresh litter layer C was associated with minerals in the topsoil (0.57±0.12 % in the upper subsoil and only 0.01±0.02 % in deeper subsoil compartments) 22 months after adding the labeled beech litter, emphasizing the subordinate importance of recent aboveground litter inputs to soil C stocks in all depths, especially in the deeper subsoil. Lajtha et al. (2014a) also showed that 50 years of doubled litter inputs in a deciduous forest stand did not result in a net accumulation of OC in the topsoil HF, likely as sorption sites in topsoils are already largely occupied by OM (Mikutta et al., 2019). The chemical composition of the HF particle surface layer supports this assumption, as the C and N contents decreased with increasing soil depth (Supplement, Fig. S5). Additionally, a higher content of mineral-borne Al and Fe within the HF surface layer with increasing depth suggests a higher proportion of uncovered mineral surfaces (Supplement, Fig. S5).
For the Dystric Cambisol under European beech, the average annual inputs from the recent litter layer into the HF were estimated as 0.99±0.45 g C m−2 yr−1 in the topsoil, 0.37±0.10 g C m−2 yr−1 in the upper subsoil, and 0.01±0.01 g C m−2 yr−1 in the deeper subsoil. This estimation follows the assumption of a constant input of labeled litter-derived OM during the 22 months, which is a sufficient approximation for this estimate but may not reflect the actual conditions in the field. Fröberg et al. (2007a) reported annual DOC fluxes of about 4–14 g C m−2 yr−1 in 15 cm soil depth and 1.5 to 4.5 g C m−2 yr−1 in 70 cm soil depth, from which, on average, 14 % was derived from recent litter. This corresponds to fluxes of 0.5 to 2 and 0.2 to 0.6 g C m−2 yr−1, respectively, which is similar in magnitude as the observed 13C fluxes from the labeled litter into the HF at our study site. Given this similarity, it is reasonable to assume that recent litter-derived C contributes to the MAOM pool in different soil depths mainly by the DOC pathway. The decreasing input and contribution of recent litter-derived C with depth further implies that there is an increasing contribution of older OC to DOC with increasing soil depth, as likewise found when dating 14C ages of DOC (Don and Schulze, 2008).
There was a substantial decrease in the recovered 13C label in the MAOM fraction within the 18 months between the first and second sampling. This can be explained either by desorption of litter-derived compounds (either due to microbial degradation or abiotic exchange processes) and/or sorption of fresh unlabeled DOM. We assume that sorption of DOM from the soil solution and the accompanied replacement of litter-derived C from mineral surfaces is the most plausible reason for the observed 13C loss. This is because the C content of the HF at both samplings was rather constant (Fig. 3a) and the considerable DOC fluxes of 0.7 to 2.1 g m−2 yr−1 in the deep subsoil (Leinemann et al., 2016) ensure sufficient probability for sorption and displacements reactions. In total, 1.69 g m−2 of initially 2.54 g m−2 recent litter-derived MAOM were lost throughout the soil profile (66 %) within 18 months. This indicates that young OM associated with minerals, especially in the upper soil, is not effectively stabilized by mineral surfaces (Schrumpf et al., 2013). The minor retention of 13C by soil minerals and the subsequent remobilization of mineral-bound C in the topsoil are both facilitated by the generally low contents of clay (<3 %) and pedogenic Fe and Al oxides (Supplement, Table S2). In addition, the clay fraction might be dominated by illite, which is a relatively less sorptive phyllosilicate under acidic conditions (Kaiser et al., 1997).
Despite the fast transformation of recently formed MAOM in the topsoil, this does not result in a significant downward translocation of C within the timeframe of 18 months. This hints to intense microbial processing as desorbed or exchanged recent litter-derived C has a higher bioavailability (Marschner and Kalbitz, 2003). Another reason for explaining the minor 13C transfer to the subsoil would be the downward translocation of unlabeled litter-derived C (after litter displacement), which could have diluted the tracer with increasing soil depth. On the other hand, at the second sampling, part of the translocated DOM was likely already originating from horizons (O layers and upper mineral soil horizons) already enriched in 13C, thus potentially counteracting the dilution by new unlabeled DOM to a certain extent.
4.3 Mobilizable OM – linking litter inputs and MAOM formation
The concept of C translocation from topsoil into the subsoil assumes continuous exchange processes at mineral surfaces, leading to partial desorption of microbially altered OM and thus its downward transport (Kaiser and Kalbitz, 2012). Here, WEOM was considered to represent such mobilizable OM, being most susceptible to translocation and, hence, a source for subsoil OM. Accordingly, we found an increasing importance of WEOM with increasing soil depth, as its proportion to SOC was higher in the subsoil than in the topsoil. This implies that the deeper soil compartments were comprised of relatively more soluble OM. A similar depth trend was detected for the mobilization of C during density fractionation, supporting the findings for WEOM. In accordance with Chantigny (2003), WEOM represents only a small part of SOC but was more enriched in litter-derived 13C than bulk SOC or MAOM (Fig. 5). Despite the higher enrichment, this accounted only for <1.7 % of total WEOM, suggesting that the majority of mobilizable OC is older than 22 months (for sampling in November 2016) or 40 months (for sampling in May 2018). In line with this, Fröberg et al. (2007b) and Hagedorn et al. (2003) reported that recent litter-derived DOC contributes only minorly to the total DOC leached from the organic layer into the mineral soil.
The high δ13C values of CWEOM (Fig. 5c) and the strong decline of litter-derived C in CWEOM within the upper 20 cm of the soil profile (Fig. 7) suggest that litter-derived POM is a considerable source of WEOM. For example, the beech litter residues that were removed after 22 months and sieved <5 mm still contained up to 2 % CWEOM (data not shown), which might become liberated in soil. In the subsoil, WEOM likely derives from MAOM and root-derived POM, the latter representing a negligible fraction in the deeper subsoil at the Grinderwald site. In a recent soil column experiment, Leinemann et al. (2018) showed that 20 % of the MAOM can be replaced by percolating DOM in samples collected from three depths down to 100 cm soil depth. Most intriguingly, we did not observe a downward migration of the 13C label within WEOC 18 months later, again pointing to losses of litter-derived C in all soil increments by microbial decomposition. This assumption is supported by findings from Tipping et al. (2012) who showed that the majority of DOM released from the mineral matrix can be lost by mineralization. This also matches well to the fact that subsoil MAOM is only to a minor extent fed by recent litter-derived C sources. In summary, topsoil WEOC at least partly derives from the recent litter layer, whereas this is not the case in the deeper soil. This finding thus supports the view, as proposed in the cascade model, that the downward migration of C involves the mobilization of older SOM components.
A prominent concept for the build-up of soil OC stocks not only considers the input of plant residues into soil but also the subsequent fate of OM inputs, where C is assumed to undergo a sequence of cycles including sorptive retention, microbial processing, and desorption on its way down the soil profile (Kaiser and Kalbitz, 2012). This study thus investigated the impact of recent aboveground litter for OC sequestration and the subsequent partitioning of litter-derived C in different soil layers and OM fractions. Annual C inputs from the recent litter layer into the mineral soil were low compared to the C already stored in soil. Most of new litter-derived C is retained in the topsoil, mainly as POM. In fact, we did not find a translocation of considerable amounts of recent litter-derived C into the deep subsoil, indicating that most translocated OM at the study site is of older age. Our field study supports the concept that C accumulation in deeper soil involves several (re)mobilization cycles of OM during its downward migration. The large C losses in the topsoil during a period of 18 months without concomitant increase in subsoil C indicate that the young SOC, especially in the form of POM, represents an actively cycling C pool. Slower turnover of litter-derived C was observed for MAOM compared to both POM fractions, supporting the assumption that accessibility and sorptive stabilization reduces the vulnerability of OM to microbial decomposition. The loss of about 66 % of the C from the HF within 18 months, however, confirms earlier findings (Schrumpf et al., 2013) that part of the MAOM is rather labile, especially in the presence of less reactive minerals, such as quartz or illite, at our study site.
In summary, given the highly active C cycling in the topsoil and upper subsoil at the Grinderwald site, only marginal C from a recent litter layer enters the deep mineral subsoil. The build-up of subsoil C stocks is thus not connected to a direct transfer from the litter layer but goes along with repeated sorption and remobilization cycles of OM during downward migration over a much longer period than 3.5 years.
All compiled data in this study are published in figures and tables. Detailed primary data are saved and published in the BonaRes Repository and available: Liebmann et al. (2020) _Site_parameter_Grinderwald (https://doi.org/10.20387/bonares-HZGX-GB9S) (last access: 15 June 2020), Liebmann et al. (2020) _Bulk_data (https://doi.org/10.20387/bonares-69H2-56Q9) (last access: 15 June 2020), and Liebmann et al. (2020) _Fractions_data (https://doi.org/10.20387/bonares-DNDW-5T58) (last access: 15 June 2020).
The supplement related to this article is available online at: https://doi.org/10.5194/bg-17-3099-2020-supplement.
AD, KK, RM, and GG designed the experiment, and PL, FK, and PWD carried it out in the field. PWD, LRD, FK, and PL processed the samples and did the analyses. SKW conducted the XPS measurements. PL took the lead in preparing the manuscript, with contributions from all co-authors.
The authors declare that they have no conflict of interest.
The authors would like to thank Timo Leinemann for all his work in the first SUBSOM phase, including the labeling and sampling for this experiment. We thank Frank Hegewald for support in the field, Manuela Unger for carrying out the 13C analysis of the water extracts, and all lab teams for assistance in the lab. We also want to thank Leopold Sauheitl for helpful discussions about density fractionation and detection limits and Jürgen Böttcher for helpful discussions about data analysis. We further thank Markus Koch and Moritz Rahlfs for their valuable comments on earlier versions of this manuscript.
We gratefully acknowledge comments from Yolima Carrillo and four anonymous reviewers and a comment from Paul Hanson, which helped to improve the manuscript.
This study was performed within the framework of the research unit “The forgotten part of carbon cycling: Organic matter storage and turnover in subsoils (SUBSOM)” (FOR1806). This research has been supported by the Deutsche Forschungsgemeinschaft (DFG) through projects GU 406/28-1,2; KA 1737/10-2; MI 1377/15-2; and DO1734/4-2.
The publication of this article was funded by the open-access fund of Leibniz Universität Hannover.
This paper was edited by Yakov Kuzyakov and reviewed by Yolima Carrillo and four anonymous referees.
Ad-hoc-Arbeitsgruppe Boden: Bodenkundliche Kartieranleitung KA5, 5 Edn., E. Schweizerbart'sche Verlagsbuchhandlung, available at: http://www.schweizerbart.de/publications/detail/isbn/9783510959204, (last access: 1 October 2016), 2005.
Angst, G., Kögel-Knabner, I., Kirfel, K., Hertel, D., and Mueller, C. W.: Spatial distribution and chemical composition of soil organic matter fractions in rhizosphere and non-rhizosphere soil under European beech (Fagus sylvatica L.), Geoderma, 264, 179–187, https://doi.org/10.1016/j.geoderma.2015.10.016, 2016.
Angst, G., Messinger, J., Greiner, M., Häusler, W., Hertel, D., Kirfel, K., Kögel-Knabner, I., Leuschner, C., Rethemeyer, J., and Mueller, C. W.: Soil organic carbon stocks in topsoil and subsoil controlled by parent material, carbon input in the rhizosphere, and microbial-derived compounds, Soil Biol. Biochem., 122, 19–30, https://doi.org/10.1016/j.soilbio.2018.03.026, 2018.
Bachmann, J., Krueger, J., Goebel, M.-O., and Heinze, S.: Occurrence and spatial pattern of water repellency in a beech forest subsoil, J. Hydrol. Hydromech., 64, 100–110, https://doi.org/10.1515/johh-2016-0005, 2016.
Baisden, W. T., Amundson, R., Cook, A. C., and Brenner, D. L.: Turnover and storage of C and N in five density fractions from California annual grassland surface soils, Global Biogeochem. Cy., 16, 117–132, https://doi.org/10.1029/2001GB001822, 2002.
Balesdent, J., Girardin, C., and Mariotti, A.: Site-related δ13C of tee leaves and soil organic matter in a temperate forest, Ecology, 74, 1713–1721, https://doi.org/10.2307/1939930, 1993.
Batjes, N. H.: Total carbon and nitrogen in the soils of the world, Eur. J. Soil Sci., 47, 151–163, https://doi.org/10.1111/ejss.12114_2, 1996.
Bernal, B., McKinley, D. C., Hungate, B. A., White, P. M., Mozdzer, T. J., and Megonigal, J. P.: Limits to soil carbon stability; Deep, ancient soil carbon decomposition stimulated by new labile organic inputs, Soil Biol. Biochem., 98, 85–94, https://doi.org/10.1016/j.soilbio.2016.04.007, 2016.
Bird, J. A., Kleber, M., and Torn, M. S.: 13C and 15N stabilization dynamics in soil organic matter fractions during needle and fine root decomposition, Org. Geochem., 39, 465–477, https://doi.org/10.1016/j.orggeochem.2007.12.003, 2008.
Blume, H.-P., Stahr, K., and Leinweber, P.: Laboruntersuchungen, in Bodenkundliches Praktikum: Eine Einführung in pedologisches Arbeiten für Ökologen, insbesondere Land- und Forstwirte, und für Geowissenschaftler, edited by: Blume, H.-P., Stahr, K., and Leinweber, P., Spektrum Akademischer Verlag, Heidelberg, 77–154, 2010.
Cerli, C., Celi, L., Kalbitz, K., Guggenberger, G., and Kaiser, K.: Separation of light and heavy organic matter fractions in soil – Testing for proper density cut-off and dispersion level, Geoderma, 170, 403–416, https://doi.org/10.1016/j.geoderma.2011.10.009, 2012.
Chantigny, M. H.: Dissolved and water-extractable organic matter in soils: a review on the influence of land use and management practices, Geoderma, 113, 357–380, https://doi.org/10.1016/S0016-7061(02)00370-1, 2003.
Chantigny, M. H., Angers, D. A., Kaiser, K., and Kalbitz, K.: Extraction and Charaterization of Dissolved Organic Matter, in Soil sampling and methods of analysis, edited by: M. R. Carter and E. G. Gregorich, CRC Press, Boca Raton, USA, 617–635, 2007.
Chin, Y.-P., Aiken, G., and O'Loughlin, E.: Molecular weight, polydispersity, and spectroscopic properties of aquatic humic substances, Environ. Sci. Technol., 28, 1853–1858, https://doi.org/10.1021/es00060a015, 1994.
Corvasce, M., Zsolnay, A., D'Orazio, V., Lopez, R., and Miano, T. M.: Characterization of water extractable organic matter in a deep soil profile, Chemosphere, 62, 1583–1590, https://doi.org/10.1016/j.chemosphere.2005.07.065, 2006.
Crow, S. E., Lajtha, K., Filley, T. R., Swanston, C. W., Bowden, R. D., and Caldwell, B. A.: Sources of plant-derived carbon and stability of organic matter in soil: implications for global change, Glob. Change Biol., 15, 2003–2019, https://doi.org/10.1111/j.1365-2486.2009.01850.x, 2009.
Don, A. and Schulze, E.-D.: Controls on fluxes and export of dissolved organic carbon in grasslands with contrasting soil types, Biogeochemistry, 91, 117–131, https://doi.org/10.1007/s10533-008-9263-y, 2008.
Fontaine, S., Barot, S., Barré, P., Bdioui, N., Mary, B., and Rumpel, C.: Stability of organic carbon in deep soil layers controlled by fresh carbon supply, Nature, 450, 277–280, https://doi.org/10.1038/nature06275, 2007.
Fröberg, M., Jardine, P. M., Hanson, P. J., Swanston, C. W., Todd, D. E., Tarver, J. R., and Garten, C. T.: Low dissolved organic carbon input from fresh litter to deep mineral soils, Soil Sci. Soc. Am. J., 71, 347, https://doi.org/10.2136/sssaj2006.0188, 2007a.
Fröberg, M., Berggren Kleja, D., and Hagedorn, F.: The contribution of fresh litter to dissolved organic carbon leached from a coniferous forest floor, Eur. J. Soil Sci., 58, 108–114, https://doi.org/10.1111/j.1365-2389.2006.00812.x, 2007b.
Fröberg, M., Hanson, P. J., Trumbore, S. E., Swanston, C. W., and Todd, D. E.: Flux of carbon from 14C-enriched leaf litter throughout a forest soil mesocosm, Geoderma, 149, 181–188, doi:10.1016/j.geoderma.2008.11.029, 2009.
Gaudinski, J. B., Trumbore, S. E., Davidson, E. A., and Zheng, S.: Soil carbon cycling in a temperate forest: radiocarbon-based estimates of residence times, sequestration rates and partitioning of fluxes, Biogeochemistry, 51, 33–69, https://doi.org/10.1023/A:1006301010014, 2000.
Gentsch, N., Mikutta, R., Alves, R. J. E., Barta, J., Čapek, P., Gittel, A., Hugelius, G., Kuhry, P., Lashchinskiy, N., Palmtag, J., Richter, A., Šantrůčková, H., Schnecker, J., Shibistova, O., Urich, T., Wild, B., and Guggenberger, G.: Storage and transformation of organic matter fractions in cryoturbated permafrost soils across the Siberian Arctic, Biogeosciences, 12, 4525–4542, https://doi.org/10.5194/bg-12-4525-2015, 2015.
Gentsch, N., Wild, B., Mikutta, R., Čapek, P., Diáková, K., Schrumpf, M., Turner, S., Minnich, C., Schaarschmidt, F., Shibistova, O., Schnecker, J., Urich, T., Gittel, A., Šantrůčková, H., Bárta, J., Lashchinskiy, N., Fuß, R., Richter, A., and Guggenberger, G.: Temperature response of permafrost soil carbon is attenuated by mineral protection, Glob. Change Biol., 24, 3401–3415, https://doi.org/10.1111/gcb.14316, 2018.
Gleixner, G.: Stabile isotope composition of soil organic matter, in: Stable Isotopes and Biosphere-Atmosphere Interactions: Processes and Biological Controls, edited by: Flanagan, L. B., Ehleringer, J. R., and Pataki, D. E., Elsevier, San Diego, 29–46, 2005.
Golchin, A., Oades, J. M., Skjemstad, J. O., and Clarke, P.: Soil structure and carbon cycling, Soil Res., 32, 1043–1068, https://doi.org/10.1071/sr9941043, 1994a.
Golchin, A., Oades, J. M., Skjemstad, J. O., and Clarke, P.: Study of free and occluded particulate organic matter in soils by Solid state 13C CP/MAS NMR Spectroscopy and Scanning Electron Microscopy, Aust. J. Soil Res., 32, 285–309, 1994b.
Guggenberger, G. and Zech, W.: Composition and dynamics of dissolved carbohydrates and lignin-degradation products in two coniferous forests, N.E. Bavaria, Germany, Soil Biol. Biochem., 26, 19–27, 1994.
Hagedorn, F., Saurer, M., and Blaser, P.: A 13C tracer study to identify the origin of dissolved organic carbon in forested mineral soils, Eur. J. Soil Sci., 55, 91–100, https://doi.org/10.1046/j.1365-2389.2003.00578.x, 2003.
Heinze, S., Ludwig, B., Piepho, H.-P., Mikutta, R., Don, A., Wordell-Dietrich, P., Helfrich, M., Hertel, D., Leuschner, C., Kirfel, K., Kandeler, E., Preusser, S., Guggenberger, G., Leinemann, T., and Marschner, B.: Factors controlling the variability of organic matter in the top- and subsoil of a sandy Dystric Cambisol under beech forest, Geoderma, 311, 37–44, https://doi.org/10.1016/j.geoderma.2017.09.028, 2018.
Hut, G.: Consultants' group meeting on stable isotope reference samples for geochemical and hydrological investigations, available at: http://inis.iaea.org/Search/search.aspx?orig_q=RN:18075746, (last access: 13 July 2018), 1987.
IUSS Working Group WRB: World reference base for soil resources 2014, International soil classification system for naming soils and creating legends for soil maps, World Soil Resources Reports No. 106, FAO, Rome, 181 pp., 2014.
Jobbagy, E. G. and Jackson, R. B.: The vertical distribution of soil organic carbon and its relation to climate and vegetation, Ecol. Appl., 10, 423–436, https://doi.org/10.2307/2641104, 2000.
Kaiser, K. and Guggenberger, G.: The role of DOM sorption to mineral surfaces in the preservation of organic matter in soils, Org. Geochem., 31, 711–725, 2000.
Kaiser, K. and Guggenberger, G.: Distribution of hydrous aluminium and iron over density fractions depends on organic matter load and ultrasonic dispersion, Geoderma, 140, 140–146, https://doi.org/10.1016/j.geoderma.2007.03.018, 2007.
Kaiser, K. and Kalbitz, K.: Cycling downwards – dissolved organic matter in soils, Soil Biol. Biochem., 52, 29–32, https://doi.org/10.1016/j.soilbio.2012.04.002, 2012.
Kaiser, K., Guggenberger, G., Haumaier, L., and Zech, W.: Dissolved organic matter sorption on subsoils and minerals studied by 13C-NMR and DRIFT spectroscopy, Eur. J. Soil Sci., 48, 301–310, 1997.
Kaiser, K., Guggenberger, G., and Zech, W.: Isotopic fractionation of dissolved organic carbon in shallow forest soils as affected by sorption, Eur. J. Soil Sci., 52, 585–597, https://doi.org/10.1046/j.1365-2389.2001.00407.x, 2001.
Kaiser, K., Eusterhues, K., Rumpel, C., Guggenberger, G., and Kögel-Knabner, I.: Stabilization of organic matter by soil minerals – investigations of density and particle-size fractions from two acid forest soils, J. Plant Nutr. Soil Sci., 165, 451–459, 2002.
Kaiser, K., Guggenberger, G., and Haumaier, L.: Changes in dissolved lignin-derived phenols, neutral sugars, uronic acids, and amino sugars with depth in forested Haplic Arenosols and Rendzic Leptosols, Biogeochemistry, 70, 135–151, 2004.
Kalbitz, K. and Kaiser, K.: Contribution of dissolved organic matter to carbon storage in forest mineral soils, J. Plant Nutr. Soil Sci., 171, 52–60, https://doi.org/10.1002/jpln.200700043, 2008.
Kohl, L., Laganière, J., Edwards, K. A., Billings, S. A., Morrill, P. L., Van Biesen, G., and Ziegler, S. E.: Distinct fungal and bacterial δ13C signatures as potential drivers of increasing δ13C of soil organic matter with depth, Biogeochemistry, 124, 13–26, https://doi.org/10.1007/s10533-015-0107-2, 2015.
Kramer, C., Trumbore, S., Fröberg, M., Cisneros Dozal, L. M., Zhang, D., Xu, X., Santos, G. M., and Hanson, P. J.: Recent (<4 year old) leaf litter is not a major source of microbial carbon in a temperate forest mineral soil, Soil Biol. Biochem., 42, 1028–1037, https://doi.org/10.1016/j.soilbio.2010.02.021, 2010.
Lajtha, K., Townsend, K. L., Kramer, M. G., Swanston, C., Bowden, R. D., and Nadelhoffer, K.: Changes to particulate versus mineral-associated soil carbon after 50 years of litter manipulation in forest and prairie experimental ecosystems, Biogeochemistry, 119, 341–360, https://doi.org/10.1007/s10533-014-9970-5, 2014a.
Lajtha, K., Bowden, R. D., and Nadelhoffer, K.: Litter and root manipulations provide insights into soil organic matter dynamics and stability, Soil Sci. Soc. Am. J., 78, 261–269, https://doi.org/10.2136/sssaj2013.08.0370nafsc, 2014b.
Leinemann, T., Mikutta, R., Kalbitz, K., Schaarschmidt, F., and Guggenberger, G.: Small scale variability of vertical water and dissolved organic matter fluxes in sandy Cambisol subsoils as revealed by segmented suction plates, Biogeochemistry, 131, 1–15, https://doi.org/10.1007/s10533-016-0259-8, 2016.
Leinemann, T., Preusser, S., Mikutta, R., Kalbitz, K., Cerli, C., Höschen, C., Mueller, C. W., Kandeler, E., and Guggenberger, G.: Multiple exchange processes on mineral surfaces control the transport of dissolved organic matter through soil profiles, Soil Biol. Biochem., 118, 79–90, https://doi.org/10.1016/j.soilbio.2017.12.006, 2018.
Liebmann, P., Wordell-Dietrich, P., Kalbitz, K., Mikutta, R., Kalks, F., Don, A., Woche, S. K., and Guggenberger, G.: Soil profile description from the research site Grinderwald, part of the research unit SubSOM (Version 1.0) (Data set), BonaRes Data Centre (ZALF), https://doi.org/10.20387/BONARES-HZGX-GB9S, 2020.
Liebmann, P., Wordell-Dietrich, P., Kalbitz, K., Mikutta, R., Kalks, F., Don, A., Woche, S. K., and Guggenberger, G.: Litter manipulation experiment Grinderwald – Bulk soil data from soil core samples (Version 1.0) (Data set), BonaRes Data Centre (ZALF), https://doi.org/10.20387/BONARES-69H2-56Q9, 2020.
Liebmann, P., Wordell-Dietrich, P., Kalbitz, K., Mikutta, R., Kalks, F., Don, A., Woche, S. K., and Guggenberger, G.: Litter manipulation experiment Grinderwald – Density fractionation data from soil core samples (Version 1.0) (Data set), BonaRes Data Centre (ZALF), https://doi.org/10.20387/BONARES-DNDW-5T58, 2020.
Majdi, H.: Changes in fine root production and longevity in relation to water and nutrient availability in a Norway spruce stand in northern Sweden, Tree Physiol., 21, 1057–1061, https://doi.org/10.1093/treephys/21.14.1057, 2001.
Marschner, B. and Kalbitz, K.: Controls of bioavailability and biodegradability of dissolved organic matter in soils, Geoderma, 113, 211–235, https://doi.org/10.1016/S0016-7061(02)00362-2, 2003.
McKeague, J. A. and Day, J. H.: Dithionite and oxalate-extractable Fe and Al as aids in differentiating various classes of soils, Can. J. Soil Sci., 46, 13–22, https://doi.org/10.4141/cjss66-003, 1966.
Mehra, O. P. and Jackson, M. L.: Iron oxide removal from soils and clays by a dithionite-citrate system buffered by sodium bicarbonate, in: Clays and Clay Minerals, edited by: Ingerson, E., Pergamon, 317–327, 1960.
Meier, I. C., Leuschner, C., and Hertel, D.: Nutrient return with leaf litter fall in Fagus sylvatica forests across a soil fertility gradient, Plant Ecol., 177, 99–112, https://doi.org/10.1007/s11258-005-2221-z, 2005.
Mikutta, R., Turner, S., Schippers, A., Gentsch, N., Meyer-Stüve, S., Condron, L. M., Peltzer, D. A., Richardson, S. J., Eger, A., Hempel, G., Kaiser, K., Klotzbücher, T., and Guggenberger, G.: Microbial and abiotic controls on mineral-associated organic matter in soil profiles along an ecosystem gradient, Sci. Rep., 9, 1–9, https://doi.org/10.1038/s41598-019-46501-4, 2019.
Moore-Kucera, J. and Dick, R. P.: Application of 13C-labeled litter and root materials for in situ decomposition studies using phospholipid fatty acids, Soil Biol. Biochem., 40, 2485–2493, https://doi.org/10.1016/j.soilbio.2008.06.002, 2008.
Nadelhoffer, K. J. and Fry, B.: Controls on natural nitrogen-15 and carbon-13 abundances in forest soil organic matter, Soil Sci. Soc. Am. J., 52, 1633–1640, https://doi.org/10.2136/sssaj1988.03615995005200060024x, 1988.
Nadelhoffer, K. J. and Raich, J. W.: Fine root production estimates and belowground carbon allocation in forest ecosystems, Ecology, 73, 1139–1147, https://doi.org/10.2307/1940664, 1992.
Nielsen, D. R. and Wendroth, O.: Spatial and temporal statistics: sampling field soils and their vegetation, Spat. Temporal Stat. Sampl. Field Soils Their Veg., available at: https://www.cabdirect.org/cabdirect/abstract/20033041440, (last access: 20 August 2019), 2003.
North, P. F.: Towards an absolute measurement of soil structural stability using ultrasound, J. Soil Sci., 27, 451–459, https://doi.org/10.1111/j.1365-2389.1976.tb02014.x, 1976.
Rasse, D. P., Rumpel, C., and Dignac, M.-F.: Is soil carbon mostly root carbon? Mechanisms for a specific stabilisation, Plant Soil, 269, 341–356, https://doi.org/10.1007/s11104-004-0907-y, 2005.
Rumpel, C. and Kögel-Knabner, I.: Deep soil organic matter – a key but poorly understood component of terrestrial C cycle, Plant Soil, 338, 143–158, https://doi.org/10.1007/s11104-010-0391-5, 2011.
Rumpel, C., Chabbi, A., and Marschner, B.: Carbon storage and sequestration in subsoil horizons: Knowledge, gaps and potentials, in: Recarbonization of the biosphere, edited by: Lal, R., Lorenz, K., Hüttl, R. F., Schneider, B. U., and von Braun, J., Springer Netherlands, Dordrecht, 445–464, 2012.
Salomé, C., Nunan, N., Pouteau, V., Lerch, T. Z., and Chenu, C.: Carbon dynamics in topsoil and in subsoil may be controlled by different regulatory mechanisms, Glob. Change Biol., 16, 416–426, https://doi.org/10.1111/j.1365-2486.2009.01884.x, 2010.
Sanderman, J. and Amundson, R.: A comparative study of dissolved organic carbon transport and stabilization in California forest and grassland soils, Biogeochemistry, 89, 309–327, https://doi.org/10.1007/s10533-008-9221-8, 2008.
Scheel, T., Dörfler, C., and Kalbitz, K.: Precipitation of dissolved organic matter by aluminum stabilizes carbon in acidic forest soils, Soil Sci. Soc. Am. J., 71, 64–74, 2007.
Schiedung, M., Don, A., Wordell-Dietrich, P., Alcántara, V., Kuner, P. and Guggenberger, G.: Thermal oxidation does not fractionate soil organic carbon with differing biological stabilities, J. Plant Nutr. Soil Sci., 180, 18–26, https://doi.org/10.1002/jpln.201600172, 2016.
Schmidt, M. W. I., Torn, M. S., Abiven, S., Dittmar, T., Guggenberger, G., Janssens, I. A., Kleber, M., Kögel-Knabner, I., Lehmann, J., Manning, D. A. C., Nannipieri, P., Rasse, D. P., Weiner, S., and Trumbore, S. E.: Persistence of soil organic matter as an ecosystem property, Nature, 478, 49–56, https://doi.org/10.1038/nature10386, 2011.
Schrumpf, M., Kaiser, K., Guggenberger, G., Persson, T., Kögel-Knabner, I., and Schulze, E.-D.: Storage and stability of organic carbon in soils as related to depth, occlusion within aggregates, and attachment to minerals, Biogeosciences, 10, 1675–1691, https://doi.org/10.5194/bg-10-1675-2013, 2013.
Sheldrick, B. H. and McKeague, J. A.: A comparison of extractable Fe and Al data using methods follwed in the USA and Canada, Can. J. Soil Sci., 55, 77–78, https://doi.org/10.4141/cjss75-012, 1975.
Six, J., Guggenberger, G., Paustian, K., Haumaier, L., Elliott, E. T., and Zech, W.: Sources and composition of soil organic matter fractions between and within soil aggregates, Eur. J. Soil Sci., 52, 607–618, https://doi.org/10.1046/j.1365-2389.2001.00406.x, 2001.
Tipping, E., Chamberlain, P. M., Fröberg, M., Hanson, P. J., and Jardine, P. M.: Simulation of carbon cycling, including dissolved organic carbon transport, in forest soil locally enriched with 14C, Biogeochemistry, 108, 91–107, https://doi.org/10.1007/s10533-011-9575-1, 2012.
Trumbore, S. E., Schiff, S. L., Aravena, R., and Elgood, R.: Sources and transformation of dissolved organic carbon in the harp lake forested catchment: The role of soils, Radiocarbon, 34, 626–635, https://doi.org/10.1017/S0033822200063918, 1992.
Tückmantel, T., Leuschner, C., Preusser, S., Kandeler, E., Angst, G., Mueller, C. W., and Meier, I. C.: Root exudation patterns in a beech forest: Dependence on soil depth, root morphology, and environment, Soil Biol. Biochem., 107, 188–197, https://doi.org/10.1016/j.soilbio.2017.01.006, 2017.
van Dam, D., van Breemen, N., and Veldkamp, E.: Soil organic carbon dynamics: variability with depth in forested and deforested soils under pasture in Costa Rica, Biogeochemistry, 39, 343–375, https://doi.org/10.1023/A:1005880031579, 1997.
Wiesmeier, M., Urbanski, L., Hobley, E., Lang, B., von Lützow, M., Marin-Spiotta, E., van Wesemael, B., Rabot, E., Ließ, M., Garcia-Franco, N., Wollschläger, U., Vogel, H.-J., and Kögel-Knabner, I.: Soil organic carbon storage as a key function of soils – A review of drivers and indicators at various scales, Geoderma, 333, 149–162, https://doi.org/10.1016/j.geoderma.2018.07.026, 2019.
Wilkinson, M. T., Richards, P. J., and Humphreys, G. S.: Breaking ground: Pedological, geological, and ecological implications of soil bioturbation, Earth-Sci. Rev., 97, 257–272, https://doi.org/10.1016/j.earscirev.2009.09.005, 2009.
Wordell-Dietrich, P., Don, A., Wotte, A., Rethemeyer, J., Bachmann, J., Helfrich, M., Kirfel, K., and Leuschner, C.: Vertical partitioning of CO2 production in a Dystric Cambisol, Biogeosciences Discuss., https://doi.org/10.5194/bg-2019-143, in review, 2019.
Zsolnay, A., Baigar, E., Jimenez, M., Steinweg, B., and Saccomandi, F.: Differentiating with fluorescence spectroscopy the sources of dissolved organic matter in soils subjected to drying, Chemosphere, 38, 45–50, https://doi.org/10.1016/S0045-6535(98)00166-0, 1999.