the Creative Commons Attribution 4.0 License.
the Creative Commons Attribution 4.0 License.
 | 15 May 2020
Reconstructing N2-fixing cyanobacterial blooms in the Baltic Sea beyond observations using 6- and 7-methylheptadecane in sediments as specific biomarkers
Jérôme Kaiser
Norbert Wasmund
Mati Kahru
Anna K. Wittenborn
Regina Hansen
Katharina Häusler
Matthias Moros
Detlef Schulz-Bull
Helge W. Arz
Summer cyanobacterial blooms represent a threat to the Baltic Sea ecosystem, causing deoxygenation of the bottom water and the spread of the so-called dead zones. The history of the Baltic Sea cyanobacterial blooms is known from in situ and satellite observations since the early 1980s but is still not well understood. By comparing both weekly resolved sediment trap material and a well-dated sediment core from the eastern Gotland Basin with monitoring and satellite cyanobacterial data of the last ca. 35 years, it is shown here that 6- and 7-methylheptadecane lipids (expressed as 6+7Me-C17 : 0) may be potentially considered semiquantitative biomarkers for diazotrophic cyanobacteria, and more specifically for Nodularia spumigena. Using this organic proxy, it was thus possible to reconstruct the history of cyanobacterial blooms beyond the observational period with a resolution of 2–4 years since 1860. Cyanobacteria were constantly present but in relatively low abundance until 1920, when they started to alternate between periods with high and low abundance. Interestingly, there seems to be no significant increase in cyanobacterial abundance in the 1950s, when eutrophication and deoxygenation of the Baltic Sea increased considerably. While the early increase in cyanobacteria may be related to a small increase in phosphorus loading, decadal to multi-decadal fluctuations are likely related to variability in the Baltic Sea surface temperature and, ultimately, to the Atlantic Multi-decadal Oscillation. A 7000-year 6+7Me-C17 : 0 record from the Bothnian Sea also suggests a relationship with the mean summer temperature in the Baltic Sea region but at a multi-centennial to multi-millennial timescale. The intensity of the cyanobacterial blooms in the Baltic Sea is thus likely mainly related to natural processes such as temperature variability, at least at a multi-decadal to multi-millennial timescale.
- Article
(2629 KB) -
Supplement
(668 KB) - BibTeX
- EndNote


Late summer (July–August) massive accumulations of N2-fixing (diazotrophic) filamentous heterocystous cyanobacteria from the family Nostocaceae are a regular phenomenon in the surface layer of the Baltic Sea (Kahru et al., 1994; Kahru and Elmgren, 2014; Wasmund et al., 2018). These cyanobacterial blooms, which can cover an area of ca. 200 000 km2 in the central Baltic Sea, are dominated primarily by the species Nodularia spumigena and Aphanizomenon sp. and, to a minor extent, Dolichospermum spp. and other species from the family Nostocaceae (Congestri et al., 2000; Stal et al., 2003, 1999; Larsson et al., 2001; Wasmund et al., 2011, 2018; Hajdu et al., 2007; Hällfors, 2004; Kanoshina et al., 2003; Karjalainen et al., 2007; Sivonen et al., 2007; Celepli et al., 2017). These cyanobacteria aggregate near the surface during calm and warm weather (Kononen, 1992; Finni et al., 2001). If diazotrophic cyanobacteria occur in large blooms, they contribute to nitrogen eutrophication, where the massive export and decay of cyanobacterial biomass results in O2 consumption, leading to the spread of bottom water hypoxia and anoxia (Zillén and Conley, 2010; Feistel et al., 2016). Furthermore, Nodularia spumigena and Dolichospermum spp. have the potential to be toxic, whereas the toxicity of Aphanizomenon sp. has not been confirmed yet in the Baltic Sea (Wasmund, 2002; Luckas et al., 2005).
While cyanobacterial blooms have occurred in the Baltic Sea for thousands of years (Bianchi et al., 2000; Poutanen and Nikkilä, 2001; Jilbert et al., 2015; Funkey et al., 2014; Sollai et al., 2017; Szymczak-Żyła et al., 2019), it is often assumed that their frequency and intensity have increased due to anthropogenic impact. Long-term monitoring programs indicate that the frequency and abundance of diazotrophic cyanobacteria have increased since the early 1900s and even more significantly since the 1970s (Kahru et al., 1994), due to the massive anthropogenic loading of nutrients (in particular phosphorus) to the Baltic Sea (Finni et al., 2001; Poutanen and Nikkilä, 2001; Stal et al., 2003; Vahtera et al., 2007). As cyanobacteria grow better at higher temperatures when compared to pelagic microalgae, the ongoing global warming may represent a catalyst for further expansion of cyanobacterial blooms in the Baltic Sea and their dominance in many other aquatic ecosystems (Paerl and Huisman, 2008).
Biomarkers considered to be characteristic for cyanobacteria in modern and past ecosystems include some carotenoid pigments (zeaxanthin and echinenone; Lotocka, 1998; Bianchi et al., 2000; Poutanen and Nikkilä, 2001; Funkey et al., 2014; Jilbert et al., 2015; Szymczak-Żyła et al., 2019). However, zeaxanthin and echinenone are not entirely specific to cyanobacteria and are certainly not limited to nitrogen-fixing cyanobacteria (Bianchi, 2007; Sollai et al., 2017). Furthermore, carotenoids are amongst the most unstable organic biomarkers because of their very labile conjugated system of double bonds (Britton et al., 2008; Fleischmann and Zorn, 2008). Some bacteriohopanepolyols (BHPs; Summons et al., 1999; Talbot et al., 2008), as well as heterocyst glycolipids (HGs) that have been reported exclusively from the heterocyst cell envelope of heterocystous cyanobacteria (Gambacorta et al., 1999; Bauersachs et al., 2009), are also used as cyanobacterial biomarkers in sediments (Gibson et al., 2008; Blumenberg et al., 2013; Sollai et al., 2017). Information on the diagenetic stability of BHPs and HGs is currently only sparse, but they show potential to preserve well in the sedimentary archive, particularly under strongly reducing conditions. While BHPs specific for cyanobacteria were not found in Baltic Sea sediments (Blumenberg et al., 2013), HGs appear as useful markers for the study of diazotrophic cyanobacteria in Holocene Baltic Sea sediments (Sollai et al., 2017). The first lipids to be suggested as exclusively produced by cyanobacteria (diazotrophic and non-diazotrophic), and thus as having a strong potential as cyanobacterial biomarkers, are probably mid-chain branched alkanes (Han and Calvin, 1969; Gelpi et al., 1970; Shiea et al., 1990; Jüttner, 1991; Summons et al., 1996; Köster et al., 1999). Normal and mid-chain branched alkanes are amongst the most refractory lipids, and they do not experience major alterations during diagenesis (Peters et al., 2005). Given their exceptionally high preservation and the high specificity of mid-chain branched alkanes (Coates et al., 2014; Bauersachs et al., 2017), these components are considered well suited to examine the presence of diazotrophic cyanobacteria in the modern and past Baltic Sea, and possibly other aquatic ecosystems as well. Furthermore, compared to other analytical methods involving cost-intensive instruments (Summons et al., 1999; Talbot et al., 2003, 2007; Bauersachs et al., 2017), these compounds can be measured easily by gas chromatography–flame ionization detection (GC-FID).
Cyanobacteria possess the unique capacity to naturally produce hydrocarbons from fatty acids. Alkanes (e.g., heptadecane) and branched alkanes (e.g., 7-methylheptadecane) are produced via a two-step conversion of fatty acids, first to fatty aldehydes and then to alkanes, which involves a fatty acyl ACP reductase (FAAR) and aldehyde-deformylating oxygenase (ADO) (Schirmer et al., 2010). Additionally, 11-octadecanoic acid (vaccenic acid) is very likely the precursor to the methylheptadecanes (Han et al., 1968; Fehler and Light, 1970; Coates et al., 2014). However, the mechanism for the introduction of branched groups (methyl, ethyl, etc.) in cyanobacteria remains unknown (Liu et al., 2013). The physiological or ecological function of alkane production in cyanobacteria is not known yet but may be related to prevention of grazing, chemical signalling (pheromones), prevention of desiccation, enhanced buoyancy, or membrane fluidity and stability (Coates et al., 2014). Branched alkanes, most commonly as 7-methylheptadecane, were predominantly observed in particular clades, including heterocystous, ramified, and some filamentous cyanobacteria, and rarely in unicellular cyanobacteria (Liu et al., 2013; Coates et al., 2014). Recently, Bauersachs et al. (2017) examined the lipid profiles of heterocystous cyanobacteria strains belonging to the genera Dolichospermum, Aphanizomenon and Nodularia, isolated from the Baltic Sea. Mid-chain branched alkanes were not detected in any of the investigated Dolichospermum strains, although 7-methylheptadecane (7Me-C17 : 0) and 8-methylheptadecane (8Me-C17 : 0) have been reported in a representative of this genus before (Coates et al., 2014; Fehler and Light, 1970). In the Aphanizomenon strain, small quantities of monomethyl alkanes were also detected, with 8Me-C17 : 0 being the most dominant (7 %) followed by 7Me-C17 : 0 (3 %). The hydrocarbon profile of Nodularia spumigena included two dimethyl heptadecanes, 7,11Me-C17 : 0 and 6,12Me-C17 : 0, in relative abundances of 5 %–28 % and <5 %, respectively. However, the profile was dominated by 7Me-C17 : 0 and 6-methylheptadecane (6Me-C17 : 0), which together accounted for 65 % to 88 % of all hydrocarbons. As 6Me-C17 : 0 and 7Me-C17 : 0 were not detected in the other heterocystous cyanobacteria investigated (with the exception of 7Me-C17 : 0 occurring in minor abundance in the Aphanizomenon strain), they can be considered most diagnostic for tracing planktonic cyanobacteria of the genus Nodularia in the Baltic Sea (Bauersachs et al., 2017). Indeed, 7Me-C17 : 0 has been found in the surface waters of the central Baltic Sea (Landsort Deep) in summer (Berndmeyer et al., 2014).
The aim of the present study is to evaluate if 6Me-C17 : 0 and 7Me-C17 : 0 represent specific biomarkers for the most abundant, potentially toxic diazotrophic cyanobacteria Nodularia spumigena and, to a minor extent, Aphanizomenon spp. in Baltic Sea sediments. For this purpose, sediment traps covering the period from May 2010 to January 2011 in the central Baltic Sea (eastern Gotland Basin, EGB) are investigated for their relative abundance of cyanobacteria and their related specific biomarkers. Then, a well-dated short sediment core from nearly the same location (Fårö Deep) is analyzed in order to reconstruct the past occurrence of diazotrophic cyanobacterial blooms in the central Baltic Sea since ca. 1860 CE with a sub-decadal temporal resolution (2–4 years). Finally, a Holocene sediment core from the Bothnian Sea is analyzed with a mean temporal resolution of 170 years.
Sinking particles were collected from May 2010 to January 2011 in the eastern Gotland Basin (EGB; Fig. 1; Table S1 in the Supplement) at a water depth of 180 m with a classical cone-shaped automated Kiel sediment trap with a sampling area of 0.5 m2 (Zeitzschel et al., 1978). The collection intervals were set to 7 or 10 d. Buffered formalin (4 %) was used as a fixative. After recovery, large zooplankton organisms were removed by sieving (400 µm gauze). Aliquots of the sediment trap material were qualitatively analyzed for the main phytoplankton species (1: present; 2: abundant, 3: highly abundant) using an inverted microscope (Zeiss Axiovert 200). The determination of the total flux of sedimentary matter were performed as described by Struck et al. (2004). The short sediment core MSM51-2/20 was retrieved with a device keeping the sediment–water interface undisturbed (multi-corer equipped with eight 60 cm tubes). The core was sampled every 0.5 to 1 cm. The sediment samples were freeze-dried and homogenized (n=73). The long sediment core POS435/10 retrieved with a gravity corer (Häusler et al., 2017) was sampled every 10–20 cm. The sediment samples were freeze-dried and homogenized (n=45). The age model of core POS435/10 has been published in Häusler et al. (2017).

Figure 1Location of the monitoring stations (black dots), the sediment trap (triangle), the short sediment cores MSM51-2/20 and EMB1215/7 (circle), and the long sediment core POS435/10 (circle) investigated in the present study. The dotted lines represent the limits of the area considered to determine the frequency of cyanobacterial accumulations index of the eastern Gotland Basin (Kahru et al., 2018). The locations of Lake Flarken and Lake Klotjärnen (Seppä et al., 2009) are also shown (stars). ÅS stands for Åland Sea. Ocean Data View software (Schlitzer, 2016) was used to create the map and plot the data. See also Table S1.
2.1 Total organic carbon, XRF scanning, 137Cs, and PCB analyses
Total organic carbon (TOC) was calculated by the subtraction of total inorganic carbon (TIC) from total carbon (TC) values. TC was analyzed by means of an EA1110 CHN (CE-instruments). TIC was determined by means of a TIC module connected with a Multi EA 2000 CS (Analytik, Jena) elemental analyzer, involving the acidic removal of carbonates from sediment samples and analysis of the CO2 released in a carrier gas stream (Leipe et al., 2011). Polychlorinated biphenyls (PCBs), 137Cs, and XRF data were used to elaborate the age model of core MSM51-2/20 following the approach developed in Moros et al. (2017). The activity of 137Cs radionuclide was measured by gamma spectrometry with a Canberra BE3830 broad energy germanium detector (Moros et al., 2017). The analysis of PCBs was performed with gas chromatography coupled to mass spectrometry (Thermo Fisher Scientific Trace DSQ GC-MS) (Schulz-Bull et al., 1995; Moros et al., 2017). The sum content of the most abundant 23 PCB congeners was used here. An ITRAX X-ray fluorescence (XRF) scanner (Cox Analytical Systems) equipped with a Cr tube operated at 30 kV and 30 mA (exposure time of 15 s) was used to estimate the elemental composition of core MSM51-2/20 sediments with a 200 µm resolution. Mn, Fe (expressed as count per second, cps), and the incoherence ∕ coherence ratio (inc ∕ coh; e.g., Chawchai et al., 2015) were used here to help correlate sediment cores EMB1215/7 (Moros et al., 2017) and MSM51-2/20 (this study) together.
2.2 Age model
The age model of core MSM51-2/20 (42 cm; Fig. 2; Table S2) was obtained by correlating time markers defined in sediment core EMB1215/7 (39 cm), retrieved from about the same location (Fig. 1), and published in Moros et al. (2017). Briefly, using an event stratigraphy approach Moros et al. (2017) have assigned dates to the sediment using (1) the early increase in Hg and 210Pbunsupp. that occurred around 1900 CE; (2) the early increase in PCBs in 1935 CE; (3) the beginning and maximum of atom weapons tests in 1953 and 1963, respectively, as recorded by 241Am; (4) the 137Cs peak related to the Chernobyl nuclear accident in 1986; and (5) the sedimentary chemical signature (Mn, Fe, Hg) related to two major inflows of oxygenated North Sea water into the central Baltic Sea (Major Baltic Sea Inflows; Mohrholz et al., 2015) in 1994 and 2003. We assigned an age of 2016 CE for the core top, i.e., the year of the core recovery, and an extrapolated age of 1860 CE to the core bottom. Estimated error bars for an age model based on an event stratigraphy are ca. 5–10 and 1–2 years for the time markers, respectively, before and after 1960 CE (Kaiser et al., 2018). Linear sedimentation rates were assumed between the time markers. This dating method is the most adapted in marine environments, where the sediment composition can vary between homogenous (low organic carbon content) and laminated (high organic carbon content) over relatively short depth intervals, as is the case for the Baltic Sea and the Black Sea (Moros et al., 2017; Kaiser et al., 2018). The mean sedimentation rate of core MSM51-2/20 increases constantly from ca. 0.2 cm yr−1 before the 1900s to ca. 0.7 cm yr−1 toward the present day, in agreement with published data (Moros et al., 2017). In the upper 1–2 cm of the core, the sedimentation rate drops to 0.2 cm yr−1. This is an artifact related to the evaporation of the water from the fluff layer (>95 % of water) resulting in sediment compaction before core sampling. The mean sedimentation rate of core MSM51-2/20 is thus ca. 0.4 cm yr−1. This means that each sample represents an average of ca. 2–3 years.
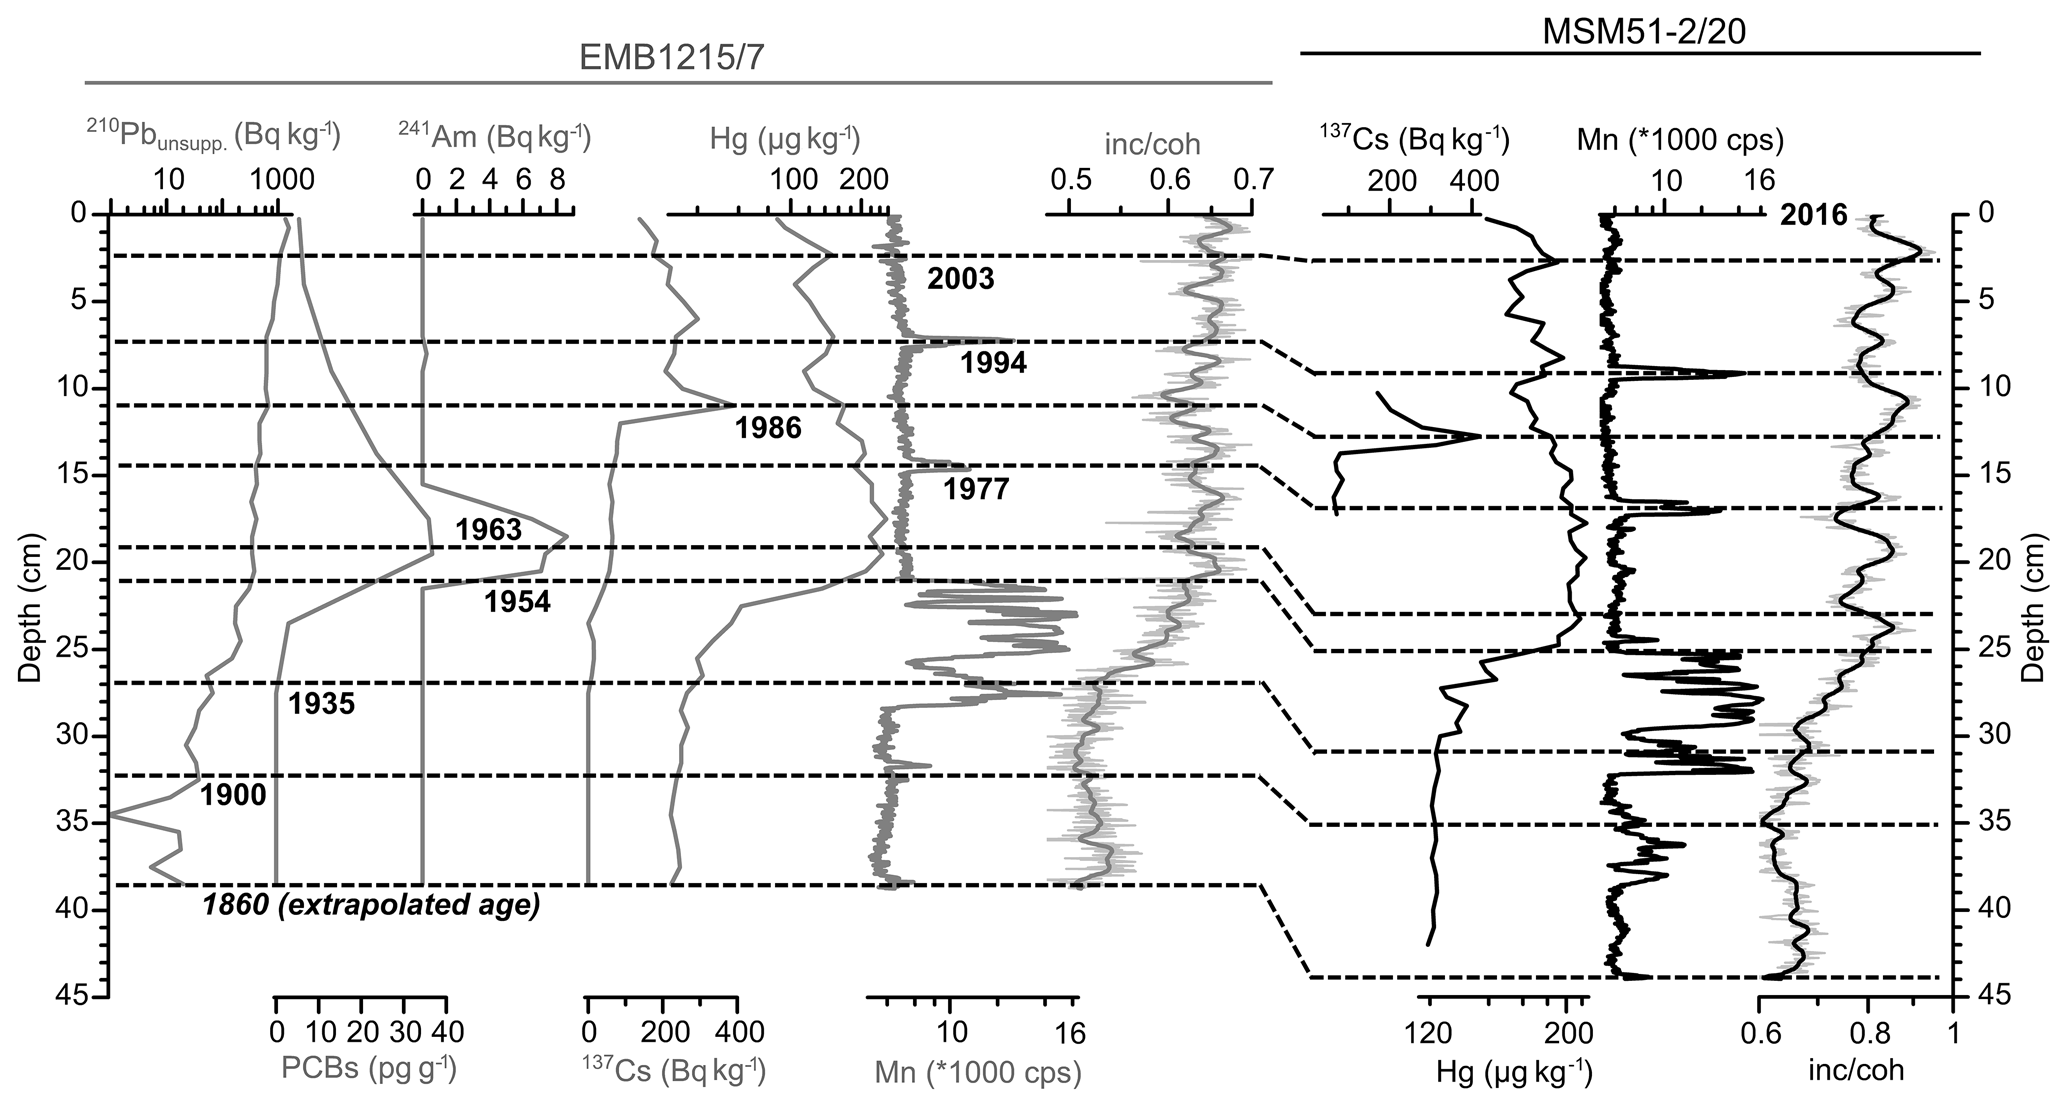
Figure 2Age models of short sediment cores EMB1215/7 (grey curves) and MSM51-2/20 (black curves) based on records of pollutants (mercury, Hg; sum of polychlorinated biphenyls, PCBs), radionuclides (unsupported 210lead, 210Pbunsupp.; 241americium, 241Am; 137caesium, 137Cs), and XRF-scanning elements (Mn in counts per second and the inc ∕ coh ratio). The dashed lines represent core EMB1215/7 depths dated by event stratigraphy (year CE) as published in Moros et al. (2017) (except for the PCBs record) and their equivalent depths in core MSM51-2/20. The data are listed in Table S2.
2.3 Lipid analysis
Sediment trap material (n=18) and sediments (n=118) were extracted using accelerated solvent extraction (Dionex ASE 350) with DCM ∕ MeOH (9 : 1, v : v). After extraction, squalane was added as an internal standard. The apolar lipid fractions were obtained by column chromatography (SiO2) using hexane as eluent. They were analyzed by gas chromatography–mass spectrometry (GC-MS) using an Agilent Technologies 7890B GC system coupled to a 5977B Mass Selective Detector equipped with a HP-5ms capillary column (30 m × 0.25 mm × 0.25 µm). The oven temperature was programmed from 40 to 320 ∘C at 8 ∘C min−1 followed by a 15 min isotherm. GC-MS data were collected in total ion current (TIC) (m∕z 50–600). The apolar fractions were also analyzed using a multichannel TraceUltra gas chromatograph (Thermo Fischer Scientific) equipped with a DB-5ms capillary column (30 m × 0.25 mm × 0.25 µm) and a flame ionization detector (FID). The temperature program was identical to that used for analysis by GC-MS. Peak identification was made by comparison of retention indexes using the two methods. For quantification, the GC-FID response of each lipid was normalized to that of the internal standard and the amount of sediment extracted. The detection limit was estimated to ca. 5 ng g−1. Because 6Me-C17 : 0 and 7Me-C17 : 0 monomethyl alkanes elute very close to each other on a DB-5ms capillary column, their total sum (6+7Me-C17 : 0) was considered preferentially. However, the contents of 6Me-C17 : 0 and 7Me-C17 : 0 monomethyl alkanes are also provided. In order to correct for potential effects of lipid preservation, degradation, and/or dilution by terrestrial inputs, the data were normalized to total organic carbon (TOC) in both core MSM51-2/20 and core POS435/10 (TOC data published in Häusler et al., 2017), and the results are expressed as µg gTOC−1. The data are listed in Tables S3, S4, S5, and S7.
2.4 Monitoring data
The phytoplankton data were gathered according to the guidelines for the Baltic Monitoring Program of HELCOM (HELCOM, 1988), which has been only slightly modified over the 38 years of the monitoring program (for regular updates, see HELCOM, 2020). For representative sampling of the euphotic zone, the upper 10 m was considered, in most cases by pooling discrete samples from 1, 2.5, 5, 7.5, and 10 m depth to one integrated sample. Acetic Lugol solution was used as a fixative. The principles of the quantitative and qualitative microscopic analysis of phytoplankton are described by Utermöhl (1958) and Olenina et al. (2006). The species list created by the HELCOM Phytoplankton Expert Group forms the basis of unified species identification and biomass calculation in the Baltic Monitoring Program. The HELCOM monitoring data, including the IOW data, are kept in the ICES database and are freely available (http://www.ices.dk, last access: 1 October 2019). They were downloaded and restructured for our purposes. A total of 530 observations from 14 stations located in the EGB (Fig. 1; Table S1) were used here. The data for the years 2010–2011 are listed in Table S3, while the annual mean and summer (July–August) biomass data for the period 1983–2016 are listed in Table S4.
2.5 Frequency of cyanobacteria accumulations (FCA)
Quantitative estimates of the presence and extent of cyanobacteria blooms by satellite sensors are affected by the frequent cloud cover. In order to normalize the detections of cyanobacteria accumulations to the amount of available cloud-free imagery, Kahru and co-workers (Kahru et al., 2007; Kahru and Elmgren, 2014) introduced the frequency of cyanobacteria accumulations (FCA) index, which normalizes the number of cyanobacteria detections to the number of unobstructed views of a satellite pixel. In 2010 the satellite observations were pooled from the MODIS-Aqua and MODIS-Terra sensors. FCA can be calculated over variable periods. For the characterization of the annual bloom we used a period of 2 months (July–August), and for the characterization of the seasonal dynamics we used 5 d intervals. FCA values for each 1 km2 pixel were averaged for the whole EGB region (Fig. 1; Table S3). The FCA data for the years 2010–2011 are listed in Table S3 and for the period 1987–2016 are listed in Table S4. The latter data have been published recently in Kahru et al. (2018).
2.6 Statistics
For the monitoring time interval (1983–2016), the biomass, FCA, and biomarker data (Table S4) were processed without pre-treatment. For comparison with the ca. 2-year resolved 6+7Me-C17 : 0 record, the annually resolved HadISST1, AMO, and NAO data (Table S5) were smoothed with a two-point adjacent averaging, resampled with a 2-year step, normalized (min-max normalization), and linearly detrended before computing the correlation coefficient using the PAST v3.25 software (Hammer et al., 2001). Considering the different datasets and uncertainties related to the age model of core MSM51-2/20, the correlation analyses were restricted to the period 1870–2006.
In the EGB sediment trap material from May 2010 to January 2011, 6+7Me-C17 : 0 was found in May, July, August, early September, and early October 2010 (Fig. 3a). The 6+7Me-C17 : 0 fluxes ranged between ca. 5 and 200 µg m−2 d−1, with maxima in July and August. Among the specific producers of 6Me-C17 : 0 and 7Me-C17 : 0 in the Baltic Sea (Bauersachs et al., 2017), the qualitative analysis of the main cyanobacterial genera in the sediment trap material indicates the presence of Aphanizomenon sp. in May, July, August, late September, October, and December 2010 and early January 2011, with abundance maxima in July and early October (Fig. 3b). Nodularia spumigena was observed in the sediment trap material in July, August, early September, and early October 2010, with abundance maxima in July and August. Monitoring data based on stations from the EGB (Fig. 1) display a cyanobacterial summer bloom in July–August, with the highest total biomass in July (137 mg m−3) (Fig. 3c). While Aphanizomenon sp. was present from May to November, Nodularia spumigena was present only in July–August. FCA data indicate that the bulk of cyanobacterial accumulations occurred over the whole month of July (Fig. 3d). The maximum FCA was detected during the 5 d period between 10 and 14 July, when FCA reached nearly 40 %, i.e., during this period nearly 40 % of the satellite views of the sea surface in the EGB were classified as having accumulations.

Figure 3May 2010 to January 2011 fluxes of the sum of 6Me-C17 : 0 and 7Me-C17 : 0 (6+7Me-C17 : 0) (a), relative abundance (1: present; 2: abundant; 3: highly abundant; bars are stacked) of Nodularia spumigena and Aphanizomenon sp. cyanobacteria in sediment trap material from the eastern Gotland Basin (b), biomass data of Nodularia spumigena and Aphanizomenon sp. cyanobacteria from monitoring stations located in the eastern Gotland Basin (Fig. 1) (c), and the FCA (frequency of cyanobacteria accumulations) index (d). The data are listed in Table S3.
Annual and summer (July–August) monitoring data of cyanobacterial biomass in the study area are highly positively correlated for the period 1983–2016 (r2=0.97; n=33; Table S4). For comparison purposes, the summer data are preferentially used here. The mean and standard deviation of the sum of Nodularia spumigena and Aphanizomenon sp. are 356±632 mg m−3 (Fig. 4a). Maxima occurred in the mid-1980s, the early 1990s, and the mid-2000s. The highest total biomass value was recorded in 1986 (3139 mg m−3). Biomass minima occurred in the early and the late 1980s, the mid-1990s, and in the mid-2000s. The lowest value (20 mg m−3) was registered in 2006.
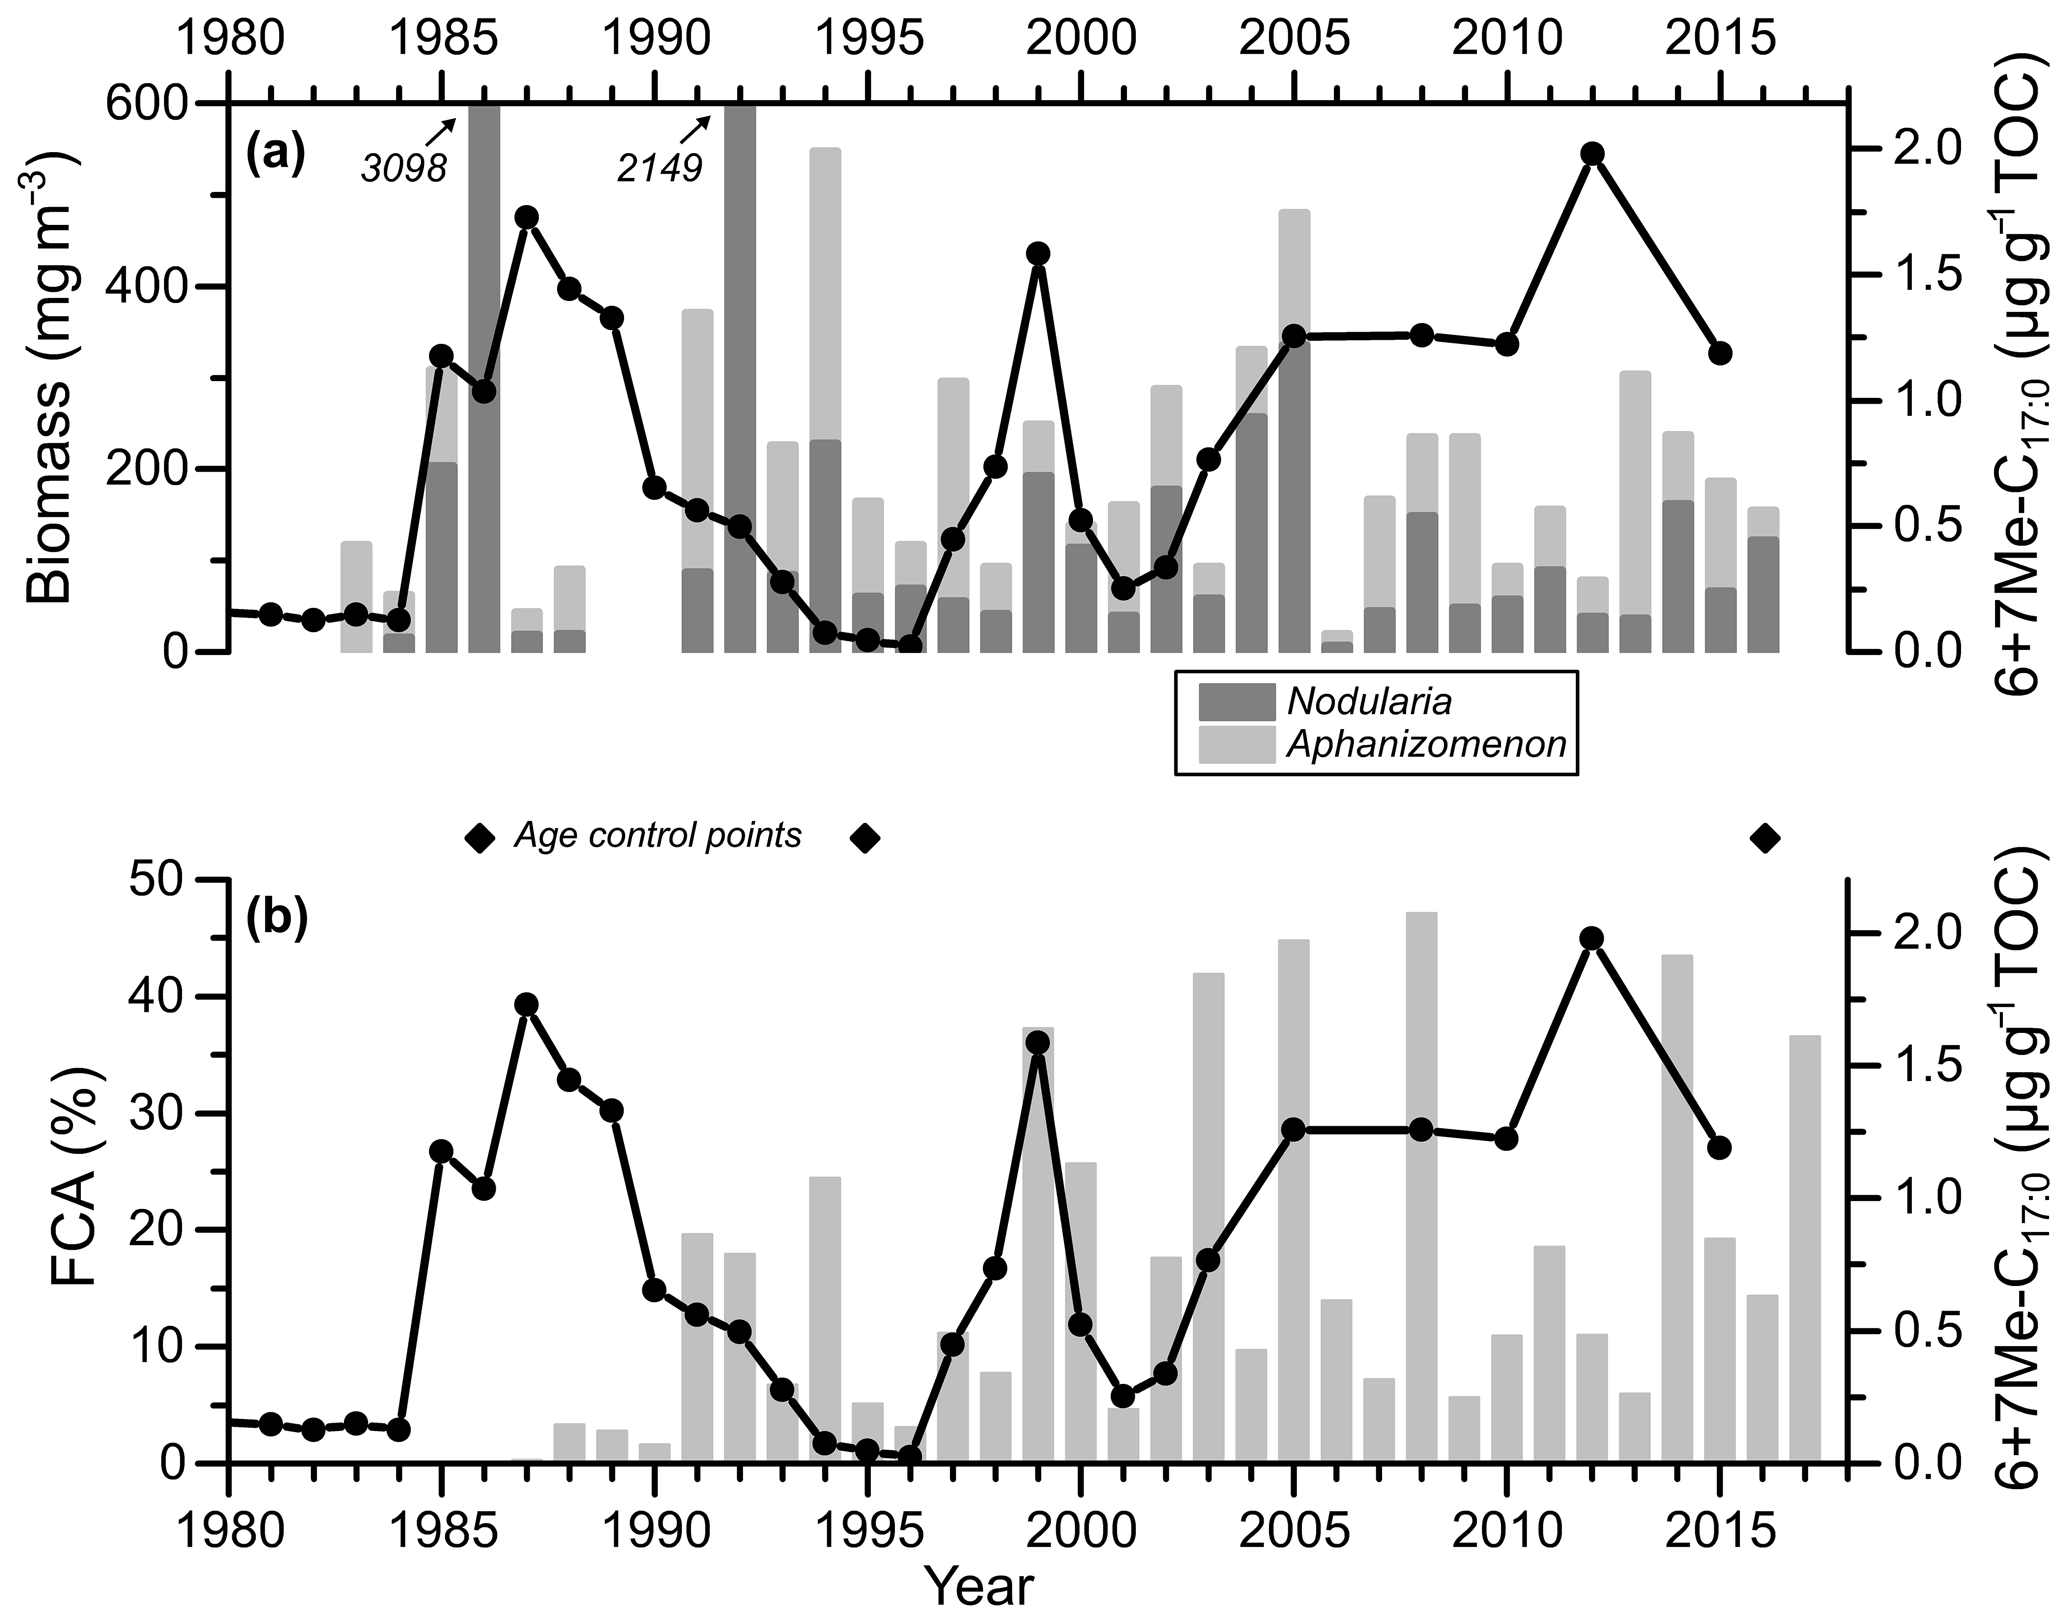
Figure 4Core MSM51-2/20 record of the sum of 6Me-C17 : 0 and 7Me-C17 : 0 (6+7Me-C17 : 0) normalized to TOC (line with dots) (a, b) and bar plots of Nodularia spumigena and Aphanizomenon sp. summer (July–August) biomass (a) and the FCA (frequency of cyanobacteria accumulations) index (Kahru et al., 2018) (b), both for the eastern Gotland Basin (Fig. 1). The diamonds represent the age control points of core MSM51-2/20 (Fig. 2; Table S2). The data are listed in Table S4.
In core MSM51-2/20, the mean and standard deviation values of 6+7Me-C17 : 0 content are 0.5±0.5 µg gTOC−1 (Figs. 4a–b and 5a). The record of 6+7Me-C17 : 0 content displays the first increase in the early 1920s. Maximum contents occurred in the late 1930s, the mid-1950s, the early and late 1960s, the early 1970s, the mid-to-late 1980s, the late 1990s, and in 2012, with values up to 2 µg gTOC−1. The main minima were found in the late 1940s, the late 1950s, the mid-1960s, the late 1970s, the late 1980s, the late 1990s, and the 2010s. The lowest values (0.02–0.05 µg gTOC−1) occurred in the mid-1990s. In core POS435/10, the mean and standard deviation values of 6+7Me-C17 : 0 content are 17±60 µg gTOC−1 (Fig. 6a). Three main maxima are centered around 2500, 4500, and 6500 cal. yr BP, and two main minima are centered around 3500 and 5500 cal. yr BP.
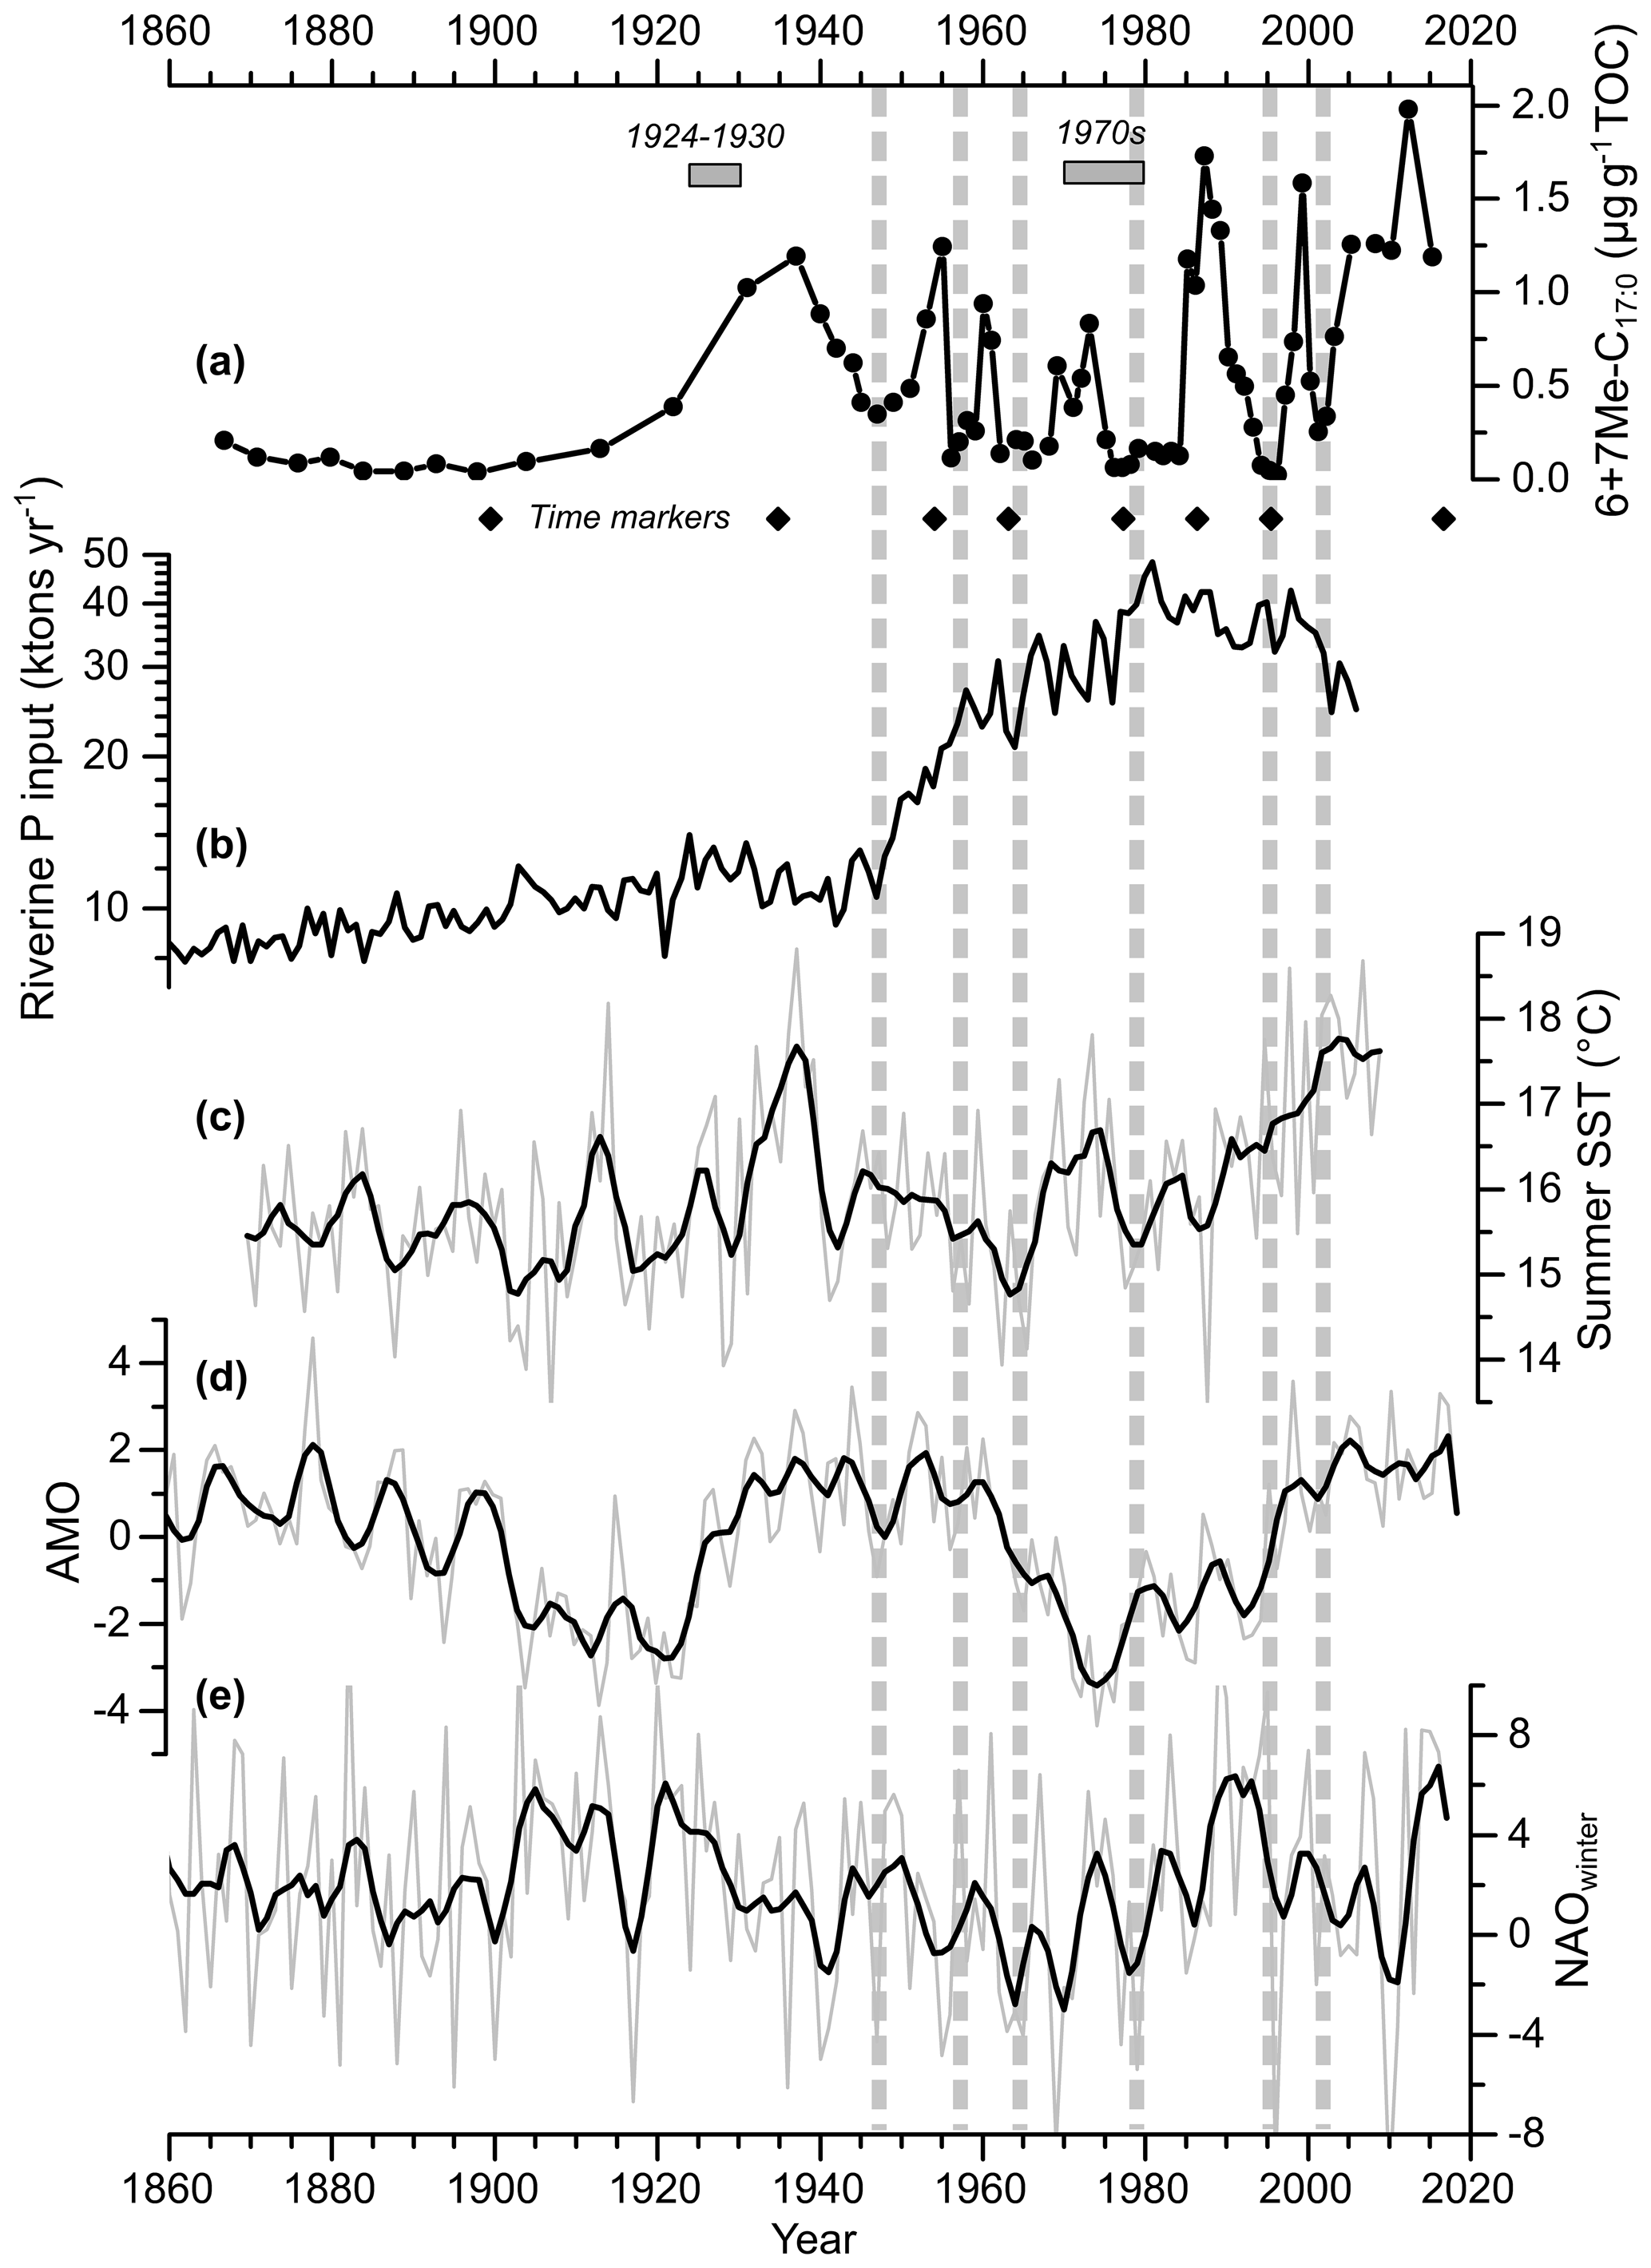
Figure 5Core MSM51-2/20 record of the sum of 6Me-C17 : 0 and 7Me-C17 : 0 (6+7Me-C17 : 0) normalized to TOC (line with dots) (a), annual riverine phosphorus input to the Baltic Sea (Gustafsson et al., 2012) (b), summer (July–August) HadISST1 (Rayner et al., 2003) sea surface temperature (SST) for the Baltic Sea (c), the Atlantic Multi-decadal Oscillation index (AMO; Enfield et al., 2001; https://www.esrl.noaa.gov/psd/data/timeseries/AMO/, last access: 1 October 2019) (d), and the winter (DJFM) North Atlantic Oscillation index (NAO; Hurrell, 1995; Jones et al., 1997; https://www.esrl.noaa.gov/psd/gcos_wgsp/Timeseries/NAO/, last access: 1 October 2019) (e). Both raw (light grey) and five-point adjacent averaged (black line) data are shown. The diamonds represent the age control points of core MSM51-2/20 (Fig. 2; Table S2). The horizontal grey rectangles represent two periods with relatively high cyanobacterial blooms as inferred from historical records (Finni et al., 2001). The vertical dashed lines highlight the periods with low 6+7Me-C17 : 0 content. The data are listed in Table S5.
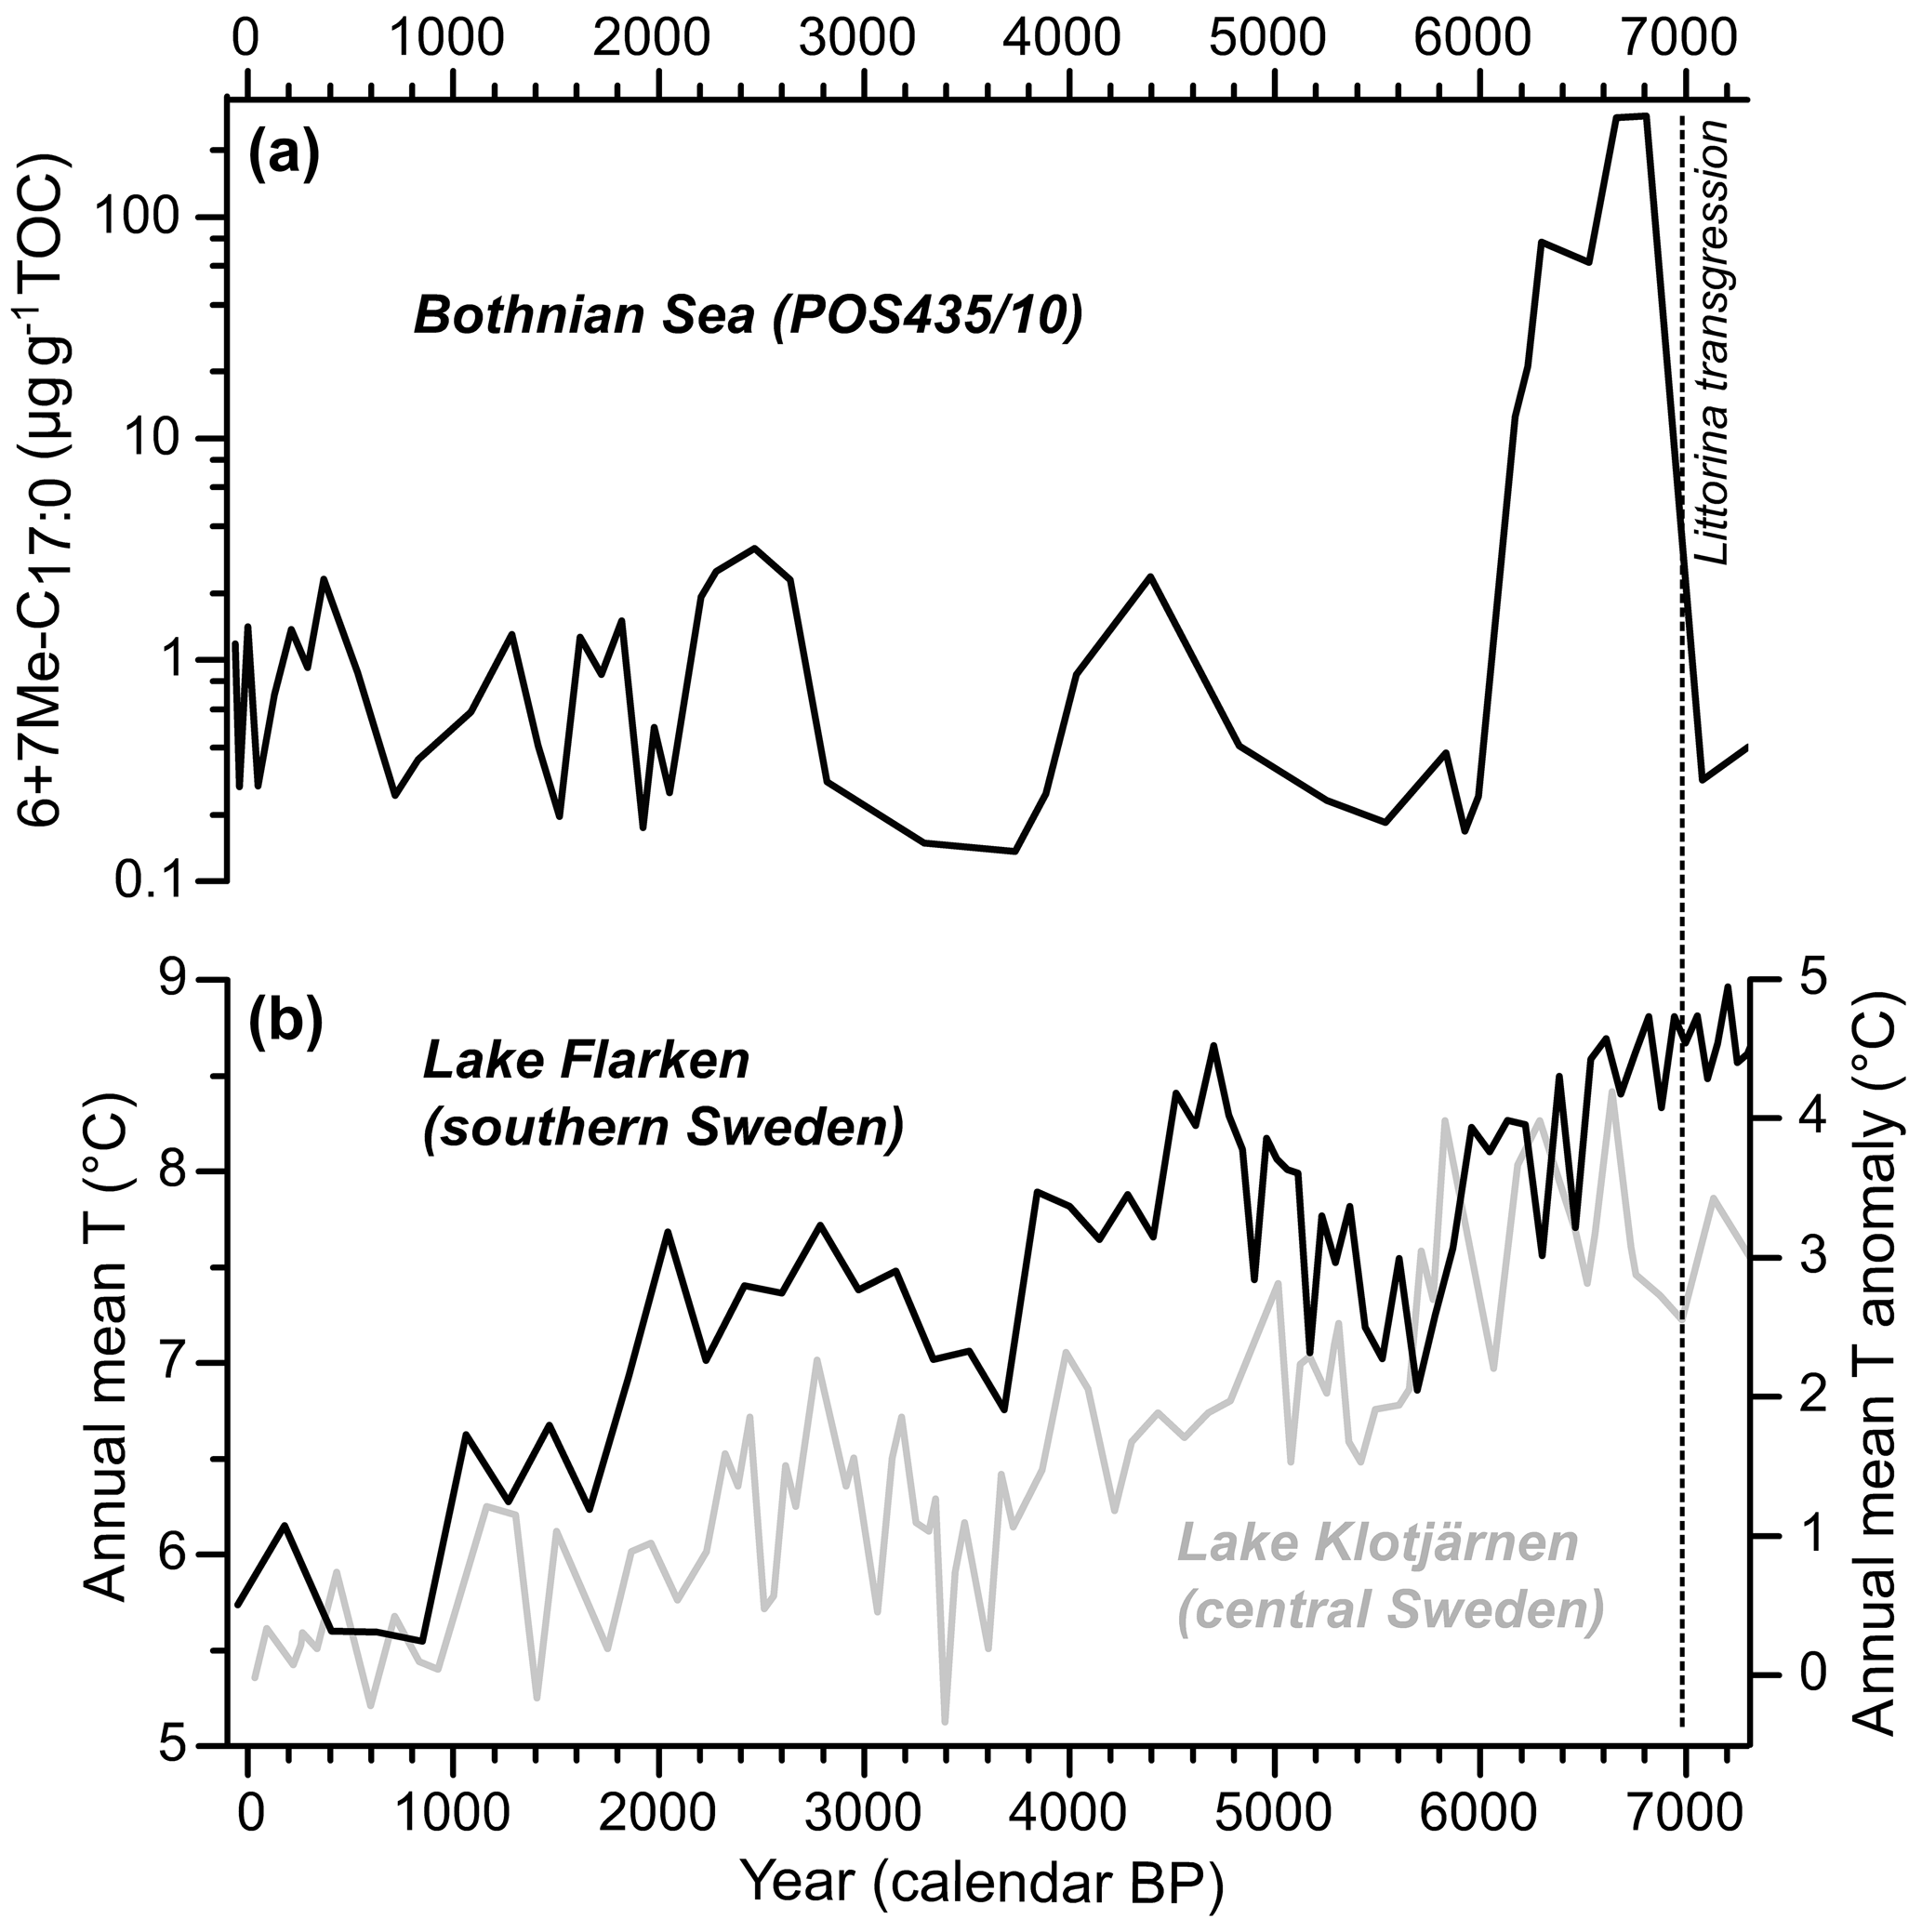
Figure 6Holocene (0–7000 cal. yr BP) records of the TOC normalized sum of 6Me-C17 : 0 and 7Me-C17 : 0 (6+7Me-C17 : 0; log scale) in the Bothnian Sea (core POS435/10; Häusler et al., 2017) (a) and of two pollen-based annual mean temperature reconstructions from Swedish lakes (Seppä et al., 2009) (b). The Littorina transgression marking the limit between the Ancylus Lake stage and the Littorina Sea stage is shown as a dashed line. The data are listed in Table S7.
Bauersachs et al. (2017) found five monomethyl alkanes (6Me-C17 : 0, 7Me-C17 : 0, 8Me-C17 : 0, 7Me-C16 : 0, and 7Me-C15 : 0) and two dimethyl alkanes (6,12Me-C17 : 0 and 7,11Me-C17 : 0) in cultures of cyanobacteria strains belonging to the genera Dolichospermum, Aphanizomenon, and Nodularia isolated from the Baltic Sea. However, no monomethyl alkanes (other than 6Me-C17 : 0 and 7Me-C17 : 0) or dimethyl alkanes were found in the sediments. This may be due to a relatively low production of these lipids compared to 6Me-C17 : 0 and, more specifically, to 7Me-C17 : 0. Furthermore, Bauersachs et al. (2017) found that the 6Me-C17 : 0 to 7Me-C17 : 0 ratio was consistently around 0.25 in all four Nodularia spumigena strains. Similar values were found in the Baltic Sea sediments, with 0.22±0.02 (mean and standard deviation) in the sediment trap material, 0.21±0.04 in core MSM51-2/20 sediments, and 0.27±0.07 in core POS435/10 sediments.
4.1 Diazotrophic cyanobacterial blooms in the central Baltic Sea in 2010–2011
The highest fluxes of 6+7Me-C17 : 0 in July–August 2010 reflect the main cyanobacterial blooming period that is characteristic of the central Baltic Sea as observed in sediment trap material (Fig. 3). The occurrence of 6+7Me-C17 : 0 fluxes correspond to an abundant to highly abundant presence of both Aphanizomenon sp. and Nodularia spumigena. While Aphanizomenon sp. produces only relatively small amounts of 7Me-C17 : 0, both 6Me-C17 : 0 and 7Me-C17 : 0 are produced in relatively high amounts by Nodularia spumigena (Bauersachs et al., 2017). However, 6Me-C17 : 0 and 7Me-C17 : 0 were present in May 2010, despite Nodularia spumigena not being observed. Aphanizomenon sp. is very likely the source of 7Me-C17 : 0, but the presence of 6Me-C17 : 0 is somewhat puzzling. The absence of 6+7Me-C17 : 0 in December 2010 and January 2011 despite Aphanizomenon sp. being observed very likely results from both its low relative amount (mainly only “present”) and its relatively low production of monomethyl alkanes (Bauersachs et al., 2017). The fluxes of 6+7Me-C17 : 0 are not correlated to the relative amounts of Aphanizomenon sp. (r=0.19; p=0.66; n=8) but are slightly positively correlated to Nodularia spumigena (r=0.53; p=0.28; n=6). Both the biomass data and FCA data suggest that the main phase of the cyanobacterial bloom occurred in July, with a maximum extent of ca. 70 000 km2 estimated on the 12 July (Hansson and Öberg, 2010), and decreased in August. Relatively high abundance of cyanobacteria in sediment trap material as late as early September and early October may be related to a delayed signal between the water surface and the sediment trap related to the lower sinking velocities after the main phase of the bloom. Despite this possible delay, the 6+7Me-C17 : 0 content of the sediment potentially semiquantitatively reflects the summer bloom of Nodularia spumigena, which is usually the most abundant diazotrophic cyanobacterial strain in central Baltic Sea summer blooms (Kononen, 1992; Finni et al., 2001; Wasmund et al., 2018).
4.2 Diazotrophic cyanobacterial blooms in the central Baltic Sea between 1983 and 2016
In order to further constrain 6+7Me-C17 : 0 as potential cyanobacterial biomarker for the Baltic Sea, the 6+7Me-C17 : 0 contents of the dated core MSM51-2/20 were compared to both July–August monitoring and satellite-derived FCA data (Fig. 4). Monitoring and satellite (FCA) data are not easy to compare on a long-term trend for two main reasons. First, monitoring data are punctual in space and time, while the satellite-based data used here are integrated on a basin-wide scale. Second, the satellite data used here mostly reflect the surface and near-surface accumulations and not the organisms thriving deeper in the water column (Kahru and Elmgren, 2014), while monitoring data integrate the upper 10 m of the water column. However, when removing the exceptionally high biomass of Nodularia spumigena in 1992 (2149 mg m−3; Table S4), the FCA index is significantly correlated to the biomass of Nodularia spumigena (r=0.61; p<0.01; n=27) but not to the biomass of Aphanizomenon sp. (r=0.01; p=0.97; n=27). This can be expected as Nodularia spumigena concentrates at the water surface (Eigemann et al., 2018), whereas Aphanizomenon spp. may accumulate in subsurface water layers (Hajdu et al., 2007). The 6+7Me-C17 : 0 content is not significantly positively correlated to the FCA index (r=0.08; p=0.71; n=22), the biomass of Nodularia spumigena (r=0.10; p=0.62; n=26), or the biomass of Aphanizomenon sp. (; p=0.07; n=26). This is very likely because each sediment sample integrates 2–3 years and because the age uncertainties of the biomarker-based record are large (± 1–2 years) compared to satellite and monitoring observations. However, considering this age uncertainty, it seems that 6+7Me-C17 : 0 contents are relatively high (low) when both Nodularia spumigena biomass and the FCA index are high (low), e.g., between the early 1990s and the mid-2000s. Therefore, we suggest that 6+7Me-C17 : 0 is potentially semiquantitatively reflecting fluctuations in cyanobacterial biomass and accumulations in the EGB, as already indicated by the sediment trap data.
4.3 Diazotrophic cyanobacterial blooms in the central Baltic Sea over the last 140 years
Based on a compilation of published historical records, Finni et al. (2001) could provide a discontinuous record of cyanobacterial open-sea blooms before the beginning of Baltic Sea monitoring programs. In the early 20th century, cyanobacterial accumulations were rare, which may be explained by relatively cool to moderate summers. Blooms occurred abundantly in successive summers between 1924 and 1930. Favorable weather conditions with several warm summers promoted strong blooms in the 1970s (Kononen and Niemi, 1984). These observations are in agreement with the 6+7Me-C17 : 0 record, which suggests a quasi-absence of diazotrophic cyanobacteria (and more specifically Nodularia spumigena) in the central Baltic Sea between 1860 and 1910, in the late 1940s, the late 1950s, and the mid-1960s but a relatively high abundance in the 1920s–1930s, in the mid-1950s, in the early and late 1960s, and in the early 1970s (Fig. 5a). While it has been suggested that the massive anthropogenic loading of nutrients to the Baltic Sea increased cyanobacterial productivity (Finni et al., 2001; Poutanen and Nikkilä, 2001; Stal et al., 2003; Vahtera et al., 2007), it is interesting to note here that no significant increase in cyanobacteria occurred in the 1950s, when nutrient inputs, eutrophication, and deoxygenation of the Baltic Sea became explicit (Fig. 5b; Zillén et al., 2008; Gustafsson et al., 2012; Savchuk et al., 2012; Carstensen et al., 2014). However, the small increase (ca. 16 %) of riverine phosphorus input to the Baltic Sea may have partly triggered the early increase in cyanobacteria abundance in the 1920s (Fig. 5b). Our data provide the first, continuous record of cyanobacterial activity in the central Baltic Sea at a sub-decadal resolution beyond instrumental data and allows for analyzing its decadal to multi-decadal variability over the last 140 years.
A positive correlation exists between fluctuations in cyanobacterial biomass in the central Baltic Sea, as reconstructed with the 6+7Me-C17 : 0 proxy and Baltic Sea summer (July–August) sea surface temperature at a decadal to multi-decadal timescale (r=0.25; p<0.05; n=70; Table S6), i.e., higher (lower) cyanobacterial blooms during years with higher (lower) temperature (Fig. 5a–b). Although temperature has been suggested as a key factor that triggers the formation of a bloom (Sellner, 1997), temperature does not affect the euphotic depth (below which cyanobacteria are unable to perform net photosynthesis) or the critical depth (below which the depth-integrated cyanobacterial primary productivity is zero) of the cyanobacterial community (Stal et al., 2003). Instead, changes in solar irradiance reaching the surface and in the angle of the sun affect the critical depth. Indeed, years with more sunshine in July–August tend to have more cyanobacterial accumulation (Kahru et al., 1994). Temperature is, however, an important contributory factor since it causes a stabilization of the water column and decreases the mixing depth, thereby increasing the light irradiance available for the cyanobacteria (Stal et al., 2003). Recently, Kniebusch et al. (2019) and Börgel et al. (2018) found that the Atlantic Multi-decadal Oscillation (AMO; Fig. 5c; Knight et al., 2006) causes changes in Baltic Sea surface temperature. The AMO, which is defined as the alternation of cold and warm phases in North Atlantic surface temperature with a period of 60–90 years, is positively correlated to the 6+7Me-C17 : 0 (r=0.30; p<0.05; n=70; Table S6). Therefore, the AMO is likely a factor determining the variability of cyanobacterial biomass in the central Baltic Sea at a multi-decadal timescale. The North Atlantic Oscillation (NAO; Hurrell et al., 2003) is another large-scale climate mode that dominates winter climate variability in Europe. At a multi-annual to decadal timescale, the NAO determines, to a large extent, ice cover, surface wind, freshwater runoff, and temperature in the Baltic region (Hänninen et al., 2000; Omstedt and Chen, 2001; Kauker and Meier, 2003). Using computer simulations, Janssen et al. (2004) proposed a cause-and-effect chain between the NAO and cyanobacterial blooms. Positive NAO leads to low ice cover; high wind stress, triggering a deepening of the surface mixed-layer; and an increase in excess dissolved inorganic phosphorus, favoring late summer cyanobacterial blooms during the following summer. However, the 6+7Me-C17 : 0 record is not correlated to the NAO index over the last 140 years (r=0.10; p=0.43; n=70; Table S6). There is also no correlation between the 6+7Me-C17 : 0 and the annual riverine P input records (; p=0.47; n=70; Table S6). Therefore, our data suggest that fluctuations in the cyanobacterial biomass in the central Baltic Sea at a decadal to multi-decadal timescale are at least partly related to sea surface temperature changes, which are ultimately triggered by the AMO. However, it has to be considered that the response of cyanobacterial blooms to environmental variables, such as nutrient loading and temperature, are likely nonlinear, which may explain the relatively low correlations. Indeed, a very recent study shows that cyanobacterial blooms are highly correlated to environmental variables at a decadal timescale when considering a set of biogeochemical variables related to the amount of phosphorus and hypoxia in bottom layers, as well as surface water temperature (Kahru et al., 2020).
4.4 Diazotrophic cyanobacterial blooms in the Bothnian Sea during the Holocene
The 6+7Me-C17 : 0 contents in the Bothnian Sea during the Holocene thermal maximum (HTM; 4500–8000 cal. yr BP sensu lato; Borzenkova et al., 2015) were up to 100-fold higher than in the modern central Baltic Sea (Figs. 4 and 5a). This suggests a high abundance of diazotrophic cyanobacteria (at least regarding Nodularia spumigena) in a region of the Baltic Sea where the diazotrophic cyanobacterial biomass is ca. 4- to 5-fold lower than in the central Baltic Sea in the present day (Wasmund et al., 2018). An abundant presence of cyanobacteria in the central and northern Baltic Sea during the HTM has already been shown in previous studies (Bianchi et al., 2000; Funkey et al., 2014; Jilbert et al., 2015; Sollai et al., 2017). This pattern is very likely related to three main factors. First, the volume of the Baltic Sea was much larger than today due to glacial overdeepening and early Holocene eustatic sea-level rise, resulting in a stronger influence of North Sea water and, very likely, a pronounced water column stratification (Jilbert et al., 2015; Häusler et al., 2017). Second, temperature and insolation were higher than today during the HTM (Seppä et al., 2005, 2009; Borzenkova et al., 2015). Third, intensely hypoxic to anoxic conditions during the HTM may have stimulated the sediment-bound phosphorus to be released into the water column (Vahtera et al., 2007; Jilbert and Slomp, 2013; Jilbert et al., 2015; Funkey et al., 2014). These conditions very likely provided an ideal environment for diazotrophic cyanobacteria to thrive. In turn, frequent cyanobacterial blooms may have contributed to the formation of hypoxic to anoxic deep waters (Jilbert et al., 2015; Häusler et al., 2017), as is the case for the central Baltic Sea in the present day (Zillén and Conley, 2010). The 6+7Me-C17 : 0 record suggests a fluctuating abundance of diazotrophic cyanobacteria between 0 and 3000 years before present. This pattern is absent in a previous study using echinenone and zeaxanthin pigments to reconstruct cyanobacterial blooms in a sediment core from the Bothnian Sea (Jilbert et al., 2015). The non-specificity to diazotrophic cyanobacteria (Bianchi, 2007) and the diagenetic instability (Britton et al., 2008) of these organic biomarkers may explain the discrepancies between both records. The variability in diazotrophic cyanobacterial blooms in the Bothnian Sea over the last 7000 years seems to be related to mean annual temperature changes as recorded in lake sediments from southern and central Sweden (Fig. 6b; Seppä et al., 2009). Periods with relatively high temperatures co-occur with a higher presence of cyanobacterial lipids in the sediments, which may be related to the enhancement of cyanobacteria blooms by higher temperatures (Stal et al., 2003). However, as suggested by Jilbert et al. (2015), the shoaling of the Åland Sea sills (Fig. 1) and the resulting decline in P availability may have been a major factor explaining the decline in cyanobacterial blooms from ca. 6300 cal. yr BP. The present results indicate that 6+7Me-C17 : 0 is a relevant proxy for diazotrophic cyanobacterial blooms in the Baltic Sea for the whole duration of the Holocene.
Using in situ monitoring data, satellite data, sediment trap material, and sediment cores from the EGB it was possible to show that the 6+7Me-C17 : 0 content of the sediment is potentially semiquantitatively reflecting the biomass of diazotrophic cyanobacteria and Nodularia spumigena in particular, which is the most abundant diazotrophic cyanobacterial species in the central Baltic Sea summer bloom. By applying this biomarker to a short sediment core, a continuous reconstruction of diazotrophic cyanobacterial abundance in the central Baltic Sea with a sub-decadal resolution that extends beyond instrumental data was provided for the first time. This record suggests that anthropogenic nutrient loading is likely not the main trigger for cyanobacterial blooms but may have represented a threshold favoring an early increase in the 1920s. Cyanobacterial biomass fluctuation seems to be at least partly related to sea surface temperature changes and the AMO climate mode at a decadal to multi-decadal timescale over the last 140 years. The application of the 6+7Me-C17 : 0 biomarker on a long sediment core from the northern Baltic Sea revealed that the variability in cyanobacterial blooms was also related to temperature variability for the whole duration of the Holocene. The present results are of significance for the Baltic Sea ecosystem when considering the ongoing global warming.
The data used in the present study are available in the Supplement (Tables S2 to S7).
The supplement related to this article is available online at: https://doi.org/10.5194/bg-17-2579-2020-supplement.
JK, NW, and MK wrote the manuscript. JK, AKW, and KH produced the biomarker data; NW and RH produced the biomass data; and MK produced the satellite data. MM provided the 137Cs data, and DSB provided the PCBs data. HWA and all co-authors contributed to the discussion and commented on the manuscript.
The authors declare that they have no conflict of interest.
We are extremely grateful to Falk Pollehne for his comments on an earlier version of the manuscript. Nadine Hollmann is thanked for her lab work. The referees and the associate editor are thanked for critically reading the manuscript and suggesting substantial improvements.
This research has been supported by the Deutsche Forschungsgemeinschaft (DFG) (grant no. KA 3228/2-1) and the Leibniz-Gemeinschaft (grant no. SAW-2017-IOW-2).
The publication of this article was funded by the
Open Access Fund of the Leibniz Association.
This paper was edited by Marcel van der Meer and reviewed by Tom Jilbert and one anonymous referee.
Bauersachs, T., Hopmans, E. C., Compaore, J., Stal, L. J., Schouten, S., and Sinninghe Damsté, J. S.: Rapid analysis of long-chain glycolipids in heterocystous cyanobacteria using high-performance liquid chromatography coupled to electrospray ionization tandem mass spectrometry, Rapid. Commun. Mass Sp., 23, 1387–1394, 2009.
Bauersachs, T., Talbot, H. M., Sidgwick, F., Sivonen, K., and Schwark, L.: Lipid biomarker signatures as tracers for harmful cyanobacterial blooms in the Baltic Sea, PLoS ONE, 12, e0186360, https://doi.org/10.1371/journal.pone.0186360, 2017.
Berndmeyer, C., Thiel, V., Schmale, O., Wasmund, N., and Blumenberg, M.: Biomarkers in the stratified water column of the Landsort Deep (Baltic Sea), Biogeosciences, 11, 7009–7023, https://doi.org/10.5194/bg-11-7009-2014, 2014.
Bianchi, T. S.: Biogeochemistry of Estuaries, Oxford University Press, New York, 706 pp., 2007.
Bianchi, T. S., Engelhaupt, E., Westman, P., Andrén, T., Rolff, C., and Elmgren, R.: Cyanobacterial blooms in the Baltic Sea: Natural or human-induced?, Limnol. Oceanogr., 3, 716–726, 2000.
Blumenberg, M., Berndmeyer, C., Moros, M., Muschalla, M., Schmale, O., and Thiel, V.: Bacteriohopanepolyols record stratification, nitrogen fixation and other biogeochemical perturbations in Holocene sediments of the central Baltic Sea, Biogeosciences, 10, 2725–2735, https://doi.org/10.5194/bg-10-2725-2013, 2013.
Börgel, F., Frauen, C., Neumann, T., Schimanke, S., and Meier, H. E. M.: Impact of the Atlantic Multidecadal Oscillation on Baltic Sea variability, Geophys. Res. Lett., 45, 9880–9888, 2018.
Borzenkova, I., Zorita, E., Borisova, O., Kalniņa, L., Kisielienė, D., Koff, T., Kuznetsov, D., Lemdahl, G., Sapelko, T., Stančikaitė, M., and Subetto, D.: Climate Change During the Holocene (Past 12,000 Years), in: Second Assessment of Climate Change for the Baltic Sea Basin, edited by: The BACC II Author Team, Regional Climate Studies, Springer, Cham, 25–49, 2015.
Britton, G., Liaaen-Jensen, S., and Pfander, H.: Special Molecules, Special Properties, in: Carotenoids – volume 4: Natural Functions, edited by: Britton, G., Liaaen-Jensen, S., and Pfander, H., Birkhäuser Verlag, Basel, 1–6, 2008.
Carstensen, J., Andersen, J. H., Gustafsson, B. G., and Conley, D. J.: Deoxygenation of the Baltic Sea during the last century, P. Natl. Acad. Sci. USA, 11, 5628–5633, 2014.
Celepli, N., Sundh, J., Ekman, M., Dupont, C. L., Yooseph, S., Bergman, B., and Ininbergs, K.: Meta-omic analyses of Baltic Sea cyanobacteria: diversity, community structure and salt acclimation, Environ. Microbiol., 19, 673–686, 2017.
Chawchai, S., Kylander, M. E., Chabangborn, A., Löwemark, L., and Wohlfarth, B.: Testing commonly used X-ray fluorescence core scanning-based proxies for organic-rich lake sediments and peat, Boreas, 45, 180–189, 2015.
Coates, R. C., Podell, S., Korobeynikov, A., Lapidus, A., Pevzner, P., Sherman, D. H., Allen, E. E., Gerwick, L., and Gerwick, W. H.: Characterization of Cyanobacterial Hydrocarbon Composition and Distribution of Biosynthetic Pathways, PLoS ONE, 9, e85140, https://doi.org/10.1371/journal.pone.0085140, 2014.
Congestri, R., Federici, R., and Albertano, P.: Evaluating biomass of Baltic filamentous cyanobacteria by image analysis, Aquat. Microb. Ecol., 22, 283–290, 2000.
Eigemann, F., Schwartke, M., and Schulz-Vogt, H.: Niche separation of Baltic Sea cyanobacteria during bloom events by species interactions and autecological preferences, Harmful Algae, 72, 65–73, 2018.
Enfield, D. B., Mestas-Nunez, A. M., and Trimble, P. J.: The Atlantic Multidecadal Oscillation and its relationship to rainfall and river flows in the continental U.S., Geophys. Res. Lett., 28, 2077–2080, 2001.
Fehler, S. W. G. and Light, R. J.: Biosynthesis of hydrocarbons in Anabaena variabilis. Incorporation of [methyl-14C]- and [methyl-2H3] methionine into 7- and 8-methylheptadecanes, Biochemistry, 9, 418–422, 1970.
Feistel, S., Feistel, R., Nehring, D., Matthäus, W., Nausch, G., and Naumann, M.: Hypoxic and anoxic regions in the Baltic Sea, 1969–2015, Marine Science Reports, 100, Warnemünde, Germany, 84 pp., 2016.
Finni, T., Kononen, K., Olsonen, R., and Wallström, K.: The history of cyanobacterial blooms in the Baltic Sea, Ambio, 30, 172–178, 2001.
Fleischmann, P. and Zorn, H.: Pathways for Formation of Carotenoid Cleavage Products, in: Carotenoids – Volume 4: Natural Functions, edited by: Britton, G., Liaaen-Jensen, S., and Pfander, H., Birkhäuser Verlag, Basel, 341–366, 2008.
Funkey, C. P., Conley, D. J., Reuss, N. S., Humborg, C., Jilbert, T., and Slomp, C. P.: Hypoxia sustains cyanobacteria blooms in the Baltic sea, Environ. Sci. Technol., 48, 2598–2602, 2014.
Gambacorta, A., Trincone, A., Soriente, A., and Sodano, G.: Chemistry of glycolipids from the heterocysts of nitogen-fixing cyanobacteria, Current Topics in Phytochemistry, 2, 145–150, 1999.
Gelpi, E., Schneider, H., Mann, J., and Oro, J.: Hydrocarbons of geochemical significance in microscopic algae, Phytochemistry, 9, 603–612, 1970.
Gibson, R. A., Talbot, H. M., Kaur, G., Pancost, R. D., and Bruce Mountain, B.: Bacteriohopanepolyol signatures of cyanobacterial and methanotrophic bacterial populations recorded in a geothermal vent sinter, Org. Geochem., 39, 1020–1023, 2008.
Gustafsson, B. G., Schenk, F., Blenckner, T., Eilola, K., Meier, H. E. M., Müller-Karulis, B., Neumann, T., Ruoho-Airola, T., Savchuk, O. P., and Zorita, E.: Reconstructing the Development of Baltic Sea Eutrophication 1850–2006, Ambio, 41, 534–548, 2012.
Hajdu, S., Höglander, H., and Larsson, U.: Phytoplankton vertical distributions and composition in Baltic Sea cyanobacterial blooms, Harmful Algae, 6, 189–205, 2007.
Hällfors, G.: Checklist of Baltic Sea Phytoplankton Species (including some heterotrophic protistan groups), HELCOM Baltic Sea Environment Proceedings, 95, 1–208, 2004.
Hammer, Ø., Harper, D. A. T., and Ryan, P. D.: PAST: Paleontological Statistics Software Package for Education and Data Analysis, Palaeontologia Electronica, 4, 9 pp., 2001.
Han, J. and Calvin, M.: Hydrocarbon distribution of algae and bacteria and microbial activity in sediments, P. Natl. Acad. Sci. USA, 60, 436–443, 1969.
Han, J., McCarthy, E. D., Van Hoeven, W., Calvin, M., and Bradley, W. H.: Organic geochemical studies, II. A preliminary report on the distribution of aliphatic hydrocarbons in algae, in bacteria, and in a recent lake sediment, P. Natl. Acad. Sci. USA, 59, 29–33, 1968.
Hänninen, J., Vuorinen, I., and Hjelt, P.: Climatic factors in the Atlantic control the oceanographic and ecological changes in the Baltic Sea, Limnol. Oceanogr., 45, 703–710, 2000.
Hansson, M. and Öberg, J.: Cyanobacterial blooms in the Baltic Sea, HELCOM Baltic Sea Environment Fact Sheet, Online, available at: https://helcom.fi/baltic-sea-trends/environment-fact-sheets/eutrophication/cyanobacterial-blooms-in-the-baltic-sea/ (last access: 12 July 2019), 2010.
Häusler, K., Moros, M., Wacker, L., Hammerschmidt, L., Dellwig, O., Leipe, T., Kotilainen, A., and Arz, H. W.: Mid- to late Holocene environmental separation of the northern and central Baltic Sea basins in response to differential land uplift, Boreas, 46, 111–128, 2017.
HELCOM: Guidelines for the Baltic Monitoring Programme for the third stage. Part D. Biological determinands, Baltic Sea Environment Proceedings, 27, 1–161, 1988.
HELCOM: Monitoring of phytoplankton species composition, abundance and biomass, 19 pp., available at: https://helcom.fi/helcom-at-work/publications/manuals-and-guidelines/, last access: 1 February 2020.
Hurrell, J. W.: Decadal trends in the North Atlantic Oscillation: Regional temperatures and precipitation, Science, 269, 676–678, 1995.
Hurrell, J. W., Kushnir, Y., Ottersen, G., and Visbeck, M.: An Overview of the North Atlantic Oscillation, in: The North Atlantic Oscillation: Climatic Significance and Environmental Impact, edited by: Hurrell, J. W., Kushnir, Y., Ottersen, G., and Visbeck, M., Geoph. Monog. Series, 134, 1–35, 2003.
Janssen, F., Neumann, T., and Schmidt, M.: Inter-annual variability in cyanobacteria blooms in the Baltic Sea controlled by wintertime hydrographic conditions, Mar. Ecol.-Prog. Ser., 275, 59–68, 2004.
Jilbert, T. and Slomp, C. P.: Rapid high-amplitude variability in Baltic Sea hypoxia during the Holocene, Geology, 41, 1183–1186, https://doi.org/10.1130/G34804.1, 2013.
Jilbert, T., Conley, D. J., Gustafsson, B. G., Funkey, C. P., and Slomp, C. P.: Glacio-isostatic control on hypoxia in a high-latitude shelf basin, Geology, 43, 427–430, 2015.
Jones, P. D., Jonsson, T., and Wheeler, D.: Extension to the North Atlantic Oscillation using early instrumental pressure observations from Gibraltar and south-west Iceland, Int. J. Climatol., 17, 1433–1450, 1997.
Jüttner, F.: Taxonomic characterization of Limnothrix and Planktothrix using secondary metabolites (hydrocarbons), Algological Studies/Archiv für Hydrobiologie, 64, 261–266, 1991.
Kahru, M. and Elmgren, R.: Multidecadal time series of satellite-detected accumulations of cyanobacteria in the Baltic Sea, Biogeosciences, 11, 3619–3633, https://doi.org/10.5194/bg-11-3619-2014, 2014.
Kahru, M., Horstmann, U., and Rud, O.: Increased cyanobacterial blooming in the Baltic Sea detected by satellites: Natural fluctuation or ecosystem change?, Ambio, 23, 469–472, 1994.
Kahru, M., Savchuk, O. P., and Elmgren, R.: Satellite measurements of cyanobacterial bloom frequency in the Baltic Sea: interannual and spatial variability, Mar. Ecol.-Prog. Ser., 343, 15–23, 2007.
Kahru, M., Elmgren, R., Di Lorenzo, E., and Savchuk, O.: Unexplained interannual oscillations of cyanobacterial blooms in the Baltic Sea, Sci. Rep.-UK, 8, 6365, https://doi.org/10.1038/s41598-018-24829-7, 2018.
Kahru, M., Elmgren, R., Kaiser, J., Wasmund, N., and Savchuk, O.: Cyanobacterial blooms in the Baltic Sea: Correlations with environmental factors, Harmful Algae, 92, 101739, https://doi.org/10.1016/j.hal.2019.101739, 2020.
Kaiser, J., Moros, M., Tomczak, M., Dellwig, O., Schulz-Bull, D., and Arz, H. W.: The invasive diatom Pseudosolenia calcar-avis and specific C25 isoprenoid lipids as a sedimentary time marker in the Black Sea, Geology, 46, 507–510, 2018.
Kanoshina, I., Lips, U., and Leppänen, J.-M.: The influence of weather conditions (temperature and wind) on cyanobacterial bloom development in the Gulf of Finland (Baltic Sea), Harmful Algae, 2, 29–41, 2003.
Karjalainen, M., Engström-Ost, J., Korpinen, S., Peltonen, H., Pääkkönen, J.-P., Rönkkönen, S., Suikkanen, S., and Viitasalo, M.: Ecosystem consequences of cyanobacteria in the northern Baltic Sea, Ambio, 36, 195–202, 2007.
Kauker, F. and Meier, H. E. M.: Modeling decadal variability of the Baltic Sea: 1. Reconstructing atmospheric surface data for the period 1902–1998, J. Geophys. Res., 108, 3267, https://doi.org/10.1029/2003JC001797, 2003.
Kniebusch, M., Meier, H. E. M., Neumann, T., and Börgel, F.: Temperature variability of the Baltic Sea since 1850 and attribution to atmospheric forcing variables, J. Geophys. Res.-Oceans, 124, 4168–4187, 2019.
Knight, J. R., Folland, C. K., and Scaife, A. A.: Climate impacts of the Atlantic multidecadal oscillation, Geophys. Res. Lett., 33, L17706, https://doi.org/10.1029/2006GL026242, 2006.
Kononen, K.: Dynamics of the Toxic Cyanobacterial Blooms in the Baltic Sea, PhD thesis, Finnish Marine Reasearch, University of Helsinki, Helsinki, Finland, 1992.
Kononen, K. and Niemi, Å.: Long-term variation in phytoplankton composition at the entrance to the Gulf of Finland, Ophelia, 3, 101–110, 1984.
Köster, J., Volkman, J. K., Rullkötter, J., Scholz-Böttcher, B. M., Rethmeier, J., and Fischer, U.: Mono-, di- and trimethyl-branched alkanes in cultures of the filamentous cyanobacterium Calothrix scopulorum, Org. Geochem., 30, 1367–1379, 1999.
Larsson, U., Hajdu, S., Walve, J., and Elmgren, R.: Baltic Sea nitrogen fixation estimated from the summer increase in upper mixed layer total nitrogen, Limnol. Oceanogr., 4, 811–820, 2001.
Leipe, T., Tauber, F., Vallius, H., Virtasalo, J., Uscinowicz, S., Kowalski, N., Hille, S., Lindgren, S., and Myllyvirta, T.: Particulate organic carbon (POC) in surface sediments of the Baltic Sea, Geo-Mar. Lett., 31, 175–188, 2011.
Liu, A., Zhu, T., Lu, X., and Song, L.: Hydrocarbon profiles and phylogenetic analyses of diversified cyanobacterial species, Appl. Energ., 111, 383–393, 2013.
Lotocka, M.: Carotenoid pigments in Baltic Sea sediments, Oceanologia, 40, 27–38, 1998.
Luckas, B., Dahlmann, J., Erler, K., Gerdts, G., Wasmund, N., Hummert, C., and Hansen, P. D.: Overview on key phytoplankton toxins and their recent occurrence in the North and Baltic Seas, Environ. Toxicol. 20, 1–17, 2005.
Mohrholz, V., Naumann, M., Nausch, G., Krüger, S., and Gräwe, U.: Fresh oxygen for the Baltic Sea – An exceptional saline inflow after a decade of stagnation, J. Marine Syst., 148, 152–166, 2015.
Moros, M., Andersen, T. J., Schulz-Bull, D., Häusler, K., Bunke, D., Snowball, I., Kotilainen, A., Zillén, L., Jensen, J. B., Kabel, K., Hand, I., Leipe, T., Lougheed, B. C., Wagner, B., and Arz, H. W.: Towards an event stratigraphy for Baltic Sea sediments deposited since AD 1900: approaches and challenges, Boreas, 46, 129–142, 2017.
Olenina, I., Hajdu, S., Andersson, A., Edler, L., Wasmund, N., Busch, S., Göbel, J., Gromisz, S., Huseby, S., Huttunen, M., Jaanus, A., Kokkonen, P., Ledaine, I., and Niemkiewicz, E: Biovolumes and size-classes of phytoplankton in the Baltic Sea, HELCOM Baltic Sea Environment Proceedings, 106, 144 pp., Baltic Marine Environment Protection Commission, Helsinki Commission, Helsinki, Finland, 2006.
Omstedt, A. and Chen, D.: Influence of atmospheric circulation on the maximum ice extent in the Baltic Sea, J. Geophys. Res., 106, 4493–4500, 2001.
Paerl, H. W. and Huisman, J.: Climate – Blooms like it hot, Science, 320, 57–58, 2008.
Peters, K. E., Walters, C. C., and Moldowan, J. M.: The Biomarker Guide, Cambridge University Press, Cambridge, 2005.
Poutanen, E. L. and Nikkilä, K.: Carotenoid pigments as tracers of cyanobacterial blooms in recent and postglacial sediments of the Baltic Sea, Ambio, 30, 179–183, 2001.
Rayner, N. A., Parker, D. E., Horton, E. B., Folland, C. K., Alexander, L. V., Rowell, D. P., Kent, E. C., and Kaplan, A.: Global analyses of sea surface temperature, sea ice, and night marine air temperature since the late nineteenth century, J. Geophys. Res., 108, 4407, https://doi.org/10.1029/2002JD002670, 2003.
Savchuk, O. P., Gustafsson, B. G., Rodríguez Medina, M., Sokolov, A. V., and Wulff, F. V.: External Nutrient Loads to the Baltic Sea, 1970–2006, Baltic Net Institute Technical Report, 5, 19 pp., 2012.
Schirmer, A., Rude, M. A., Li, X., Popova, E., and del Cardayre, S. B.: Microbial biosynthesis of alkanes, Science, 329, 559–562, 2010.
Schlitzer, R.: Ocean Data View, available at: https://odv.awi.de (last access: 14 September 2019), 2016.
Schulz-Bull, D. E., Petrick, G., Kannan, N., and Duinker, J. C.: Distribution of individual chlorobiphenyls in solution and suspension in the Baltic Sea, Mar. Chem., 48, 245–270, 1995.
Sellner, K. G.: Physiology, ecology, and toxic properties of marine cyanobacteria blooms, Limnol. Oceanogr., 42, 1089–1104, 1997.
Seppä, H., Hammarlund, D., and Antonsson, K.: Low-frequency and high-frequency changes in temperature and effective humidity during the Holocene in south-central Sweden: implications for atmospheric and oceanic forcings of climate, Clim. Dynam., 25, 285–297, 2005.
Seppä, H., Bjune, A. E., Telford, R. J., Birks, H. J. B., and Veski, S.: Last nine-thousand years of temperature variability in Northern Europe, Clim. Past, 5, 523–535, https://doi.org/10.5194/cp-5-523-2009, 2009.
Shiea, J., Brassell, S. C., and Ward, D. M.: Mid-chain branched mono- and dimethyl alkanes in hot spring cyanobacterial mats: A direct biogenic source for branched alkanes in ancient sediments?, Org. Geochem., 15, 223–231, 1990.
Sivonen, K., Halinen, K., Sihvonen, L. M., Koskenniemi, K., Sinkko, H., Rantasärkkä, K., Moisander, P. H., and Lyra, C.: Bacterial diversity and function in the Baltic Sea with an emphasis on cyanobacteria, Ambio, 36, 180–185, 2007.
Sollai, M., Hopmans, E. C., Bale, N. J., Mets, A., Warden, L., Moros, M., and Sinninghe Damsté, J. S.: The Holocene sedimentary record of cyanobacterial glycolipids in the Baltic Sea: an evaluation of their application as tracers of past nitrogen fixation, Biogeosciences, 14, 5789–5804, https://doi.org/10.5194/bg-14-5789-2017, 2017.
Stal, L. J., Staal, M., and Villbrandt, M.: Nutrient control of cyanobacterial blooms in the Baltic Sea, Aquat. Microb. Ecol., 18, 165–173, 1999.
Stal, L. J., Albertano, P., Bergman, B., von Brockel, K., Gallon, J. R., Hayes, P. K., Sivonen, K., and Walsby, A. E.: BASIC: Baltic Sea cyanobacteria. An investigation of the structure and dynamics of water blooms of cyanobacteria in the Baltic Sea – Responses to a changing environment, Cont. Shelf Res., 23, 1695–1714, 2003.
Struck, U., Pollehne, F., Bauerfeind, E., and Bodungen, B. V.: Sources of nitrogen for the vertical particle flux in the Gotland Sea (Baltic Proper) – Results from sediment trap studies, J. Marine Syst., 45, 91–101, 2004.
Summons, R. E., Jahnke, L. L., Hope, J. M., and Logan, G. A.: 2-Methylhopanoids as biomarkers for cyanobacterial oxygenic photosynthesis, Nature, 400, 554–557, 1999.
Summons, R. E., Jahnke, L. L., and Simoneit, B. R. T.: Lipid biomarkers for bacterial ecosystems: Studies of cultured organisms, hydrothermal environments and ancient sediments. Evolution of hydrothermal ecosystems on Earth (and Mars?), Chichester, Wiley, 174–194, 1996.
Szymczak-Żyła, M., Krajewska, M., Witak, M., Ciesielski, Tich mo. M., Ardelan, M. V., Jenssen, B. M., Goslar, T., Winogradow, A., Filipkowska, A., Lubecki, L., Zamojska, A., and Kowalewska, G.: Present and past-millennial eutrophication in the Gulf of Gdańsk (southern Baltic Sea), Paleoceanogr. Paleocl., 34, 136–152, 2019.
Talbot, H. M., Squier, A. H., Keely, B. J., and Farrimond, P.: Atmospheric pressure chemical ionisation reversed phase liquid chromatography/ion trap mass spectrometry of intact bacteriohopanepolyols, Rapid. Commun. Mass Sp., 17, 728–737, 2003.
Talbot, H. M., Rohmer, M., and Farrimond, P.: Rapid structural elucidation of composite bacterial hopanoids by atmospheric pressure chemical ionisation liquid chromatography/ion trap mass spectrometry, Rapid Commun. Mass Sp., 21, 880–892, 2007.
Talbot, H. M., Summons, R. E., Jahnke, L. L., Cockell, C. S., Rohmer, M., and Farrimond, P.: Cyanobacterial bacteriohopanepolyol signatures from cultures and natural environmental settings, Org. Geochem., 39, 232–263, 2008.
Utermöhl, H.: Zur Vervollkommnung der quantitativen Phytoplankton-Methodik, SIL Communications 1953–1996, 9, 1–38, 1958.
Vahtera, E., Conley, D., Gustafson, B., Kuosa, H., Pitkänen, H., Savchuck, O., Tamminen, T., Viitasalo, M., Voss, M., Wasmund, N., and Wulff, F.: Internal ecosystem feedbacks enhance nitrogen-fixing cyanobacteria blooms and complicate management in the Baltic Sea, Ambio, 36, 186–194, 2007.
Wasmund, N.: Harmful algal blooms in coastal waters of the south-eastern Baltic Sea, in: Baltic coastal ecosystems, edited by: Schernewski, G. and Schiewer, U., Springer, Berlin, Heidelberg, New York, 93–116, 2002.
Wasmund, N., Tuimala, J., Suikkanen, S., Vandepitte, L., and Kraberg, A.: Long term trends in phytoplankton composition in the western and central Baltic Sea, J. Marine Syst., 87, 145–159, 2011.
Wasmund, N., Busch, S., Göbel, J., Gromisz, S., Höglander, H., Huseby, S., Jaanus, A., Jakobsen, H. H., Johansen, M., Jurgensone, I., Kownacka, J., Kraśniewski, W., Lehtinen, S., Olenina, I., and v. Weber, M.: Cyanobacteria Biomass 1990–2017, HELCOM Baltic Sea Environmental Fact Sheet 2017, available at: http://www.helcom.fi/baltic-sea-trends/environment-fact-sheets/eutrophication/cyanobacteria-biomass/ (last access: 23 July 2019), 2018.
Zeitzschel, B., Diekmann, P., and Uhlmann, L.: A new multisample sediment trap, Mar. Biol., 45, 285–289, 1978.
Zillén, L. and Conley, D. J.: Hypoxia and cyanobacteria blooms – are they really natural features of the late Holocene history of the Baltic Sea?, Biogeosciences, 7, 2567–2580, https://doi.org/10.5194/bg-7-2567-2010, 2010.
Zillén, L., Conley, D. J., Andren, T., Andren, E., and Bjorck, S.: Past occurrences of hypoxia in the Baltic Sea and the role of climate variability, environmental change and human impact, Earth-Sci. Rev., 91, 77–92, 2008.