the Creative Commons Attribution 4.0 License.
the Creative Commons Attribution 4.0 License.
 | 07 May 2020
The nonconservative distribution pattern of organic matter in the Rajang, a tropical river with peatland in its estuary
Joanne Oakes
Bradley Eyre
Youyou Hao
Edwin Sien Aun Sia
Shan Jiang
Moritz Müller
Jing Zhang
Southeast Asian peatland-draining rivers have attracted much attention due to their high dissolved organic carbon (DOC) yield and high CO2 emissions under anthropogenic influences. In August 2016, we carried out a field investigation of the Rajang River and its estuary, a tropical system located in Sarawak, Malaysia. The Rajang has peatland in its estuary, while the river basin is covered by tropical rainforest. DOC-δ13C in the Rajang ranged from −28.7 ‰ to −20.1 ‰, with a U-shaped trend from river to estuary. For particulate organic carbon (POC), δ13C ranged between −29.4 ‰ and −31.1 ‰ in the river, and there was a clear increasing trend towards more enriched δ13C values with higher salinity. In the estuary, there was a linear conservative dilution pattern for dissolved organic matter composition (as quantified by D- and L-amino acid enantiomers) plotted against DOC-δ13C, whereas when plotted against salinity, dissolved D- and L-amino acid enantiomer values were higher than the theoretical dilution value. Together, these data indicate that the addition of DOC to the estuary (by peatland) not only increased the DOC concentration but also altered its composition, by adding more biodegraded, 13C-depleted organic matter into the bulk dissolved organic matter. Alteration of organic matter composition (addition of a more degraded subpart) was also apparent for the particulate phase, but patterns were less clear. The Rajang was characterized by DOC to DON (dissolved organic nitrogen) ratios of 50 in the river section, with loss of DON in the estuary increasing the ratio to 140, suggesting an unbalanced export of organic carbon and nitrogen. Where affected by anthropogenic activities, further assessment of organic carbon to nitrogen ratios is needed.


Fluxes and cycling of organic matter (OM) in rivers and estuaries are important influences on global biogeochemical cycles and climate change. In river basins, vascular plants are the ultimate sources of organic matter (Hedges and Man, 1979), but algae, moss, and bacteria are also important (Hernes et al., 2007). As well as providing a source of OM, bacteria may strongly modify the composition of organic matter within a river and the organic matter's resistance to degradation. The lability of organic matter determines how rapidly organic carbon will be transformed into inorganic carbon (CO2), which can vary from hours to millions of years. The lability of organic matter therefore plays a role in determining whether organic matter is a source or a sink of carbon in the atmosphere (Zhang et al., 2018). Based on 14C in organic carbon, Mayorga et al. (2005) determined that the degradation of recently synthesized organic matter in the river basin was the main reason Amazonian river waters were supersaturated in CO2 and hence a source of atmospheric CO2. This highlights the potential importance of organic matter stability for carbon cycling within river systems. Nitrogen is another important element in organic matter, which is not independent of carbon but instead is closely combined with carbon in various chemical compounds (like amino acids). Due to the nature of these specific compounds, the behavior of bulk carbon and nitrogen can differ substantially. In basins with peatland, the leaching of dissolved organic carbon (DOC) is related to the status of peatland (disturbed vs. undisturbed), whereas the leaching of dissolved organic nitrogen (DON) is controlled by the soil inorganic nitrogen content (Kalbitz and Geyer, 2002). The different leaching mechanisms of organic carbon and nitrogen indicate that the comparison of these two elements would deepen our understanding of organic matter cycles.

Figure 1Study area and sampling stations. (a) Location of Sarawak, Malaysia, and (b) the Rajang with its estuary and river mouth shown. Samples upstream of S5 had 0 salinity and downstream of S5 had salinity > 0. Hence, from S5 to S10 was regarded as the freshwater section (red triangles), and downstream of S5 was regarded as the estuarine section (blue triangles). Note that the salinity of samples at S15, S17, S18, and S19 was also 0 during our sampling.
Tropical southeast Asian rivers play an important role in both dissolved and particulate organic matter export (Baum et al., 2007; Huang et al., 2017; Müller et al., 2016). Located in Sarawak, Malaysia (Fig. 1a), the turbid Rajang River (hereafter refer to as the Rajang) is the longest river in Malaysia. The Rajang flows through tropical rainforest, and peatland and mangroves are distributed in the estuary. A dam was constructed in the upper reaches of the Rajang in 2015, but the total suspended matter (TSM) in the river remains at 100–200 mg L−1 (Müller-Dum et al., 2019). This terrestrial organic matter can be expected to be diluted at the adjacent coast, given that the turbidity of the river strongly limits organic matter photodegradation within the river and estuary. Fluvial organic matter is therefore dominated by bacterial utilization and abiotic processes such as desorption and adsorption between particulate and dissolved phases (Martin et al., 2018). Further, dissolved oxygen is negatively related to pCO2, likely due to instream heterotrophic respiration (Müller-Dum et al., 2019). In the Rajang brackish estuary, where peatland is located, the addition of peatland DOC into river water is suggested by the nonconservative mixing pattern of DOC with increasing salinity (Martin et al., 2018), whereas removal of DON in the Rajang estuary is suggested by nitrogen stable isotopes (Jiang et al., 2019).
While stable isotopes of carbon and nitrogen are useful tools for tracing organic matter, amino acids (AAs) are the most important organic carbon and nitrogen carriers that have been chemically identified, accounting for up to ∼100 % of the particulate nitrogen in aquatic environments and up to nearly half of the particulate organic carbon pool (Jennerjahn et al., 2004). Due to the selective removal and accumulation of certain amino acids, amino acids are important biomarkers in early diagenesis, allowing for quantification of organic matter lability and resistance (Dauwe and Middelburg, 1998; Kaiser and Benner, 2009). With the exception of glycine, amino acids are chiral. L-forms of amino acids are from animals, plants, and plankton, whereas D-forms mainly come from bacteria and are key chemical compounds in peptidoglycan, which forms the basic structure of bacterial cell membranes (Vollmer et al., 2008). Due to the key role of bacteria in OM alteration and early diagenesis, D-AAs (D-forms of AAs) tend to accumulate during OM degradation. A higher ratio of D- to L-AAs (D ∕ L ratio) therefore indicates that OM is more refractory (Davis et al., 2009). As a nonprotein amino acid, accumulation of GABA (γ-aminobutyric acid) is also highly related to OM degradation (Davis et al., 2009). Conversely, a lower D ∕ L ratio and GABA percentage indicate that OM is relatively less degraded and hence more labile. In river waters, elevated D-AAs also indicate the presence of soil humic substances, which are a product of bacteria and their detritus (Kimber et al., 1990).
Tropical rivers are dominated by refractory (or biodegraded) organic matter, yet labile OM is also known to play a role in river carbon cycles (Mayorga et al., 2005). It is hence expected that fluvial organic matter within a river would be a mixture of labile organic matter (which can be respired to support pCO2) and refractory terrestrial organic matter (which will be diluted or degraded after entering the sea; Martin et al., 2018), while in the estuary there would be an addition of dissolved OM from peatland and mangrove (Dittmar et al., 2001b; Müller et al., 2016). Previous studies of OM in southeast Asian rivers mainly focused on its bulk concentrations, ages, or optical properties (Martin et al., 2018, and references therein). The use of biomarker approaches has been very limited (Baum et al., 2007; Gandois et al., 2014). Given the processes described above and their potential contribution to the carbon (Müller-Dum et al., 2019) and nitrogen cycles (Jiang et al., 2019), it is somewhat surprising that there has been limited application of amino acid approaches, including D-AAs, to investigate organic matter composition and the role of estuarine peatland and mangrove in OM regulation (Jennerjahn et al., 2004). Southeast Asian rivers are subject to multiple stressors due to increasing anthropogenic activities in both their riverine (e.g., damming and logging and secondary plantation) and estuarine sections (e.g., drainage and oil palm plantations; Hooijer et al., 2015). Amino acid enantiomers and carbon and nitrogen isotopes have the ability to provide molecular-level evidence for the impact of these stressors on carbon and nitrogen cycling and bulk biogeochemistry, as well as insight into the mechanisms underlying such changes.
In this study, we carried out a field investigation in the Rajang in August 2016, from stations S10 to S1, located on the coast of the South China Sea adjacent to the Rajang (Fig. 1b). AA enantiomers and δ13C values of DOC were used to elucidate the succession of organic matter sources and organic matter composition from the freshwater to the estuarine sections of the Rajang. Our aim was to address the following questions. (1) Given that peatland contributes additional DOC to fluvial DOC (Müller et al., 2016), does the composition of dissolved OM change from river to estuary? (2) Do changes in organic nitrogen mirror changes in organic carbon? (3) Hence, what is the role of peatland and mangroves on OM composition and lability in the Rajang? Globally, rivers at low latitudes receive much less attention relative to temperate and polar rivers (36 vs. 958 studies; Cloern et al., 2014), while they could be equally important for global carbon cycles (Cloern et al., 2014). This study ultimately aims to enrich our understanding of organic carbon and nitrogen cycles in tropical rivers and estuaries.
All abbreviations, together with the amino acids measured in this study, are listed in the Appendix.
2.1 Brief background
The Rajang River and its estuary are located in Sarawak, Malaysia. The climate is wet year-round, but the main precipitation typically occurs in winter (November to February). Climate is influenced by the El Niño–Southern Oscillation (ENSO) and Madden–Julian oscillation. In August 2016, the discharge was estimated as 2440 m3 s−1, in comparison with an annual mean discharge of 4000 m3 s−1 for 2016 and 2017 (Müller-Dum et al., 2019).
Based on salinity, station S5 is regarded as the boundary of the fresh and estuarine water of the Rajang (Fig. 1b). In this work all samples with a salinity of 0 were regarded as fresh water, while samples with salinity >0 were regarded as estuarine. In the estuary, there are several branches, namely Igan, Lassa, Paloh, and Rajang itself (Fig. 1b). Since water in all these branches is derived from the Rajang River (i.e., upstream of S5), in this study all these branches are regarded as the Rajang estuary. Peatland and mangroves are common in the estuary (shown in Fig. 1b), while tropical rainforest is widely distributed upstream of S5 (not shown in Fig. 1b). The peatland is under strong pressure from draining and change in use to oil palm plantations, while logging and secondary growth is very common in the river basin (Hooijer et al., 2015). Compared with other peatland-draining tropical blackwater rivers, the Rajang is more like a turbid tropical rainforest river (Müller-Dum et al., 2019) but with notable peatland and mangrove in its estuary (Fig. 1b).
2.2 Field sampling
The fieldwork was carried out in August 2016. The sampling stations covered from S10 (the uppermost station in this study) to S1 on the coast. At each station, a precleaned and sample-rinsed bucket was used to collect surface water from the center of the channel in a boat. After sample collection, pretreatment was performed immediately onboard the boat. For DOC and its stable carbon isotope ratios (δ13C), water samples were collected by syringe filtering (precombusted Whatman GF/F; 0.7 µm) approximately 30 mL of sample water into a precombusted 40 mL borosilicate vial. Samples were preserved with five drops of concentrated phosphoric acid and sealed with a lid containing a Teflon-coated septa. For total dissolved amino acids (TDAA), water samples were filtered through a 0.4 µm nylon filter. For particulate OM samples (TSM, particulate organic carbon (POC), POC-δ13C, particulate nitrogen (PN) and PN-δ15N, and total particulate amino acids (TPAA)), suspended particles were concentrated onto glass fiber filters (precombusted Whatman GF/F; 0.7 µm). The GF/F filters were folded and packed in precombusted aluminum. All samples were immediately stored frozen (−20 ∘C) until analysis. At every station both particulate and dissolved samples were collected, but a few samples were lost (broken) during transportation back to Shanghai. The lost samples were the particulate samples (POC and TSM) from stations S16 (conductivity was 64 µS cm−1), S4 (salinity was 4.8), S25 (salinity was 11.7), and S29 (salinity was 4.3) and a TDAA sample from station S24 (salinity was 19.1). A portable meter (Aquaread, AP-2000) was used to obtain the conductivity and salinity, temperature, dissolved oxygen, and pH.
2.3 Laboratory analyses
Concentrations and δ13C of DOC were measured at the Centre for Coastal Biogeochemistry at Southern Cross University (Lismore, Australia) via continuous-flow wet-oxidation isotope-ratio mass spectrometry using an Aurora 1030W total organic carbon analyzer coupled to a Thermo Delta V Plus IRMS (Oakes et al., 2010). Glucose of a known isotopic composition dissolved in He-purged Milli-Q was used as a standard to correct for drift and to verify sample concentrations and δ13C values. Reproducibility for concentrations and δ13C was ±0.2 mg L−1 and ±0.4 ‰. For the determination of POC, samples (GF/F glass fiber filters) were freeze-dried and analyzed with a CHNOS analyzer (model vario EL III) after removing the inorganic carbon by reaction with HCl vapor. For PN, a similar procedure was followed, with no acid treatment. The detection limit for POC was g, with precision better than 6 %, based on repeated determinations (Zhu et al., 2006). The POC-δ13C and PN-δ15N values were determined using a DELTAplus XL isotopic ratio mass spectrometer (Finnigan MAT, USA) interfaced with a Carlo Erba 2500 elemental analyzer. The standard for δ13C was PDB, and the precision of the analysis was ±0.2 ‰. For δ15N, the standard was air and precision was ±0.3 ‰.
Total hydrolyzable AAs were extracted and analyzed following the method of Fitznar et al. (1999) with slight modifications (Zhu et al., 2014). Briefly, samples were first hydrolyzed with HCl at 110 ∘C. After precolumn derivatization with o-Phthaldialdehyde (OPA) and N-Isobutyryl-L/D-cysteine (IBLC/IBDC), AAs and their enantiomers were analyzed using an HPLC (Agilent 1200) comprising an online vacuum degasser, a quaternary pump, an auto-sampler, a thermostatted column, and a fluorescence detector (excitation 330 nm, emission 445 nm). The analytical column was a Phenomenex HyperClone column (BDS C18, 250×4 mm, 5 µm) with a corresponding precolumn. To eliminate the influence of racemization of L-type AAs in the hydrolysis process, the concentration of D- and L-AAs measured in actual samples was corrected according to the formula obtained by Kaiser and Benner (2005). The detection limits for glycine (Gly) and individual AA enantiomers were at the lower picomolar level. Asx and Glx were used for aspartic acid plus asparagine and glutamic acid plus glutamine, respectively (see Appendix), as the corresponding acids are formed via deamination during hydrolysis.
A few samples (e.g., TDAA in S1 station) were not measured due to instrument hardware problems. Therefore, there is not always corresponding particulate and dissolved data for some stations.
Table 1TSM, DOC, POC, and stable carbon isotopes in the fresh water and estuary of the Rajang (mean (min–max)).
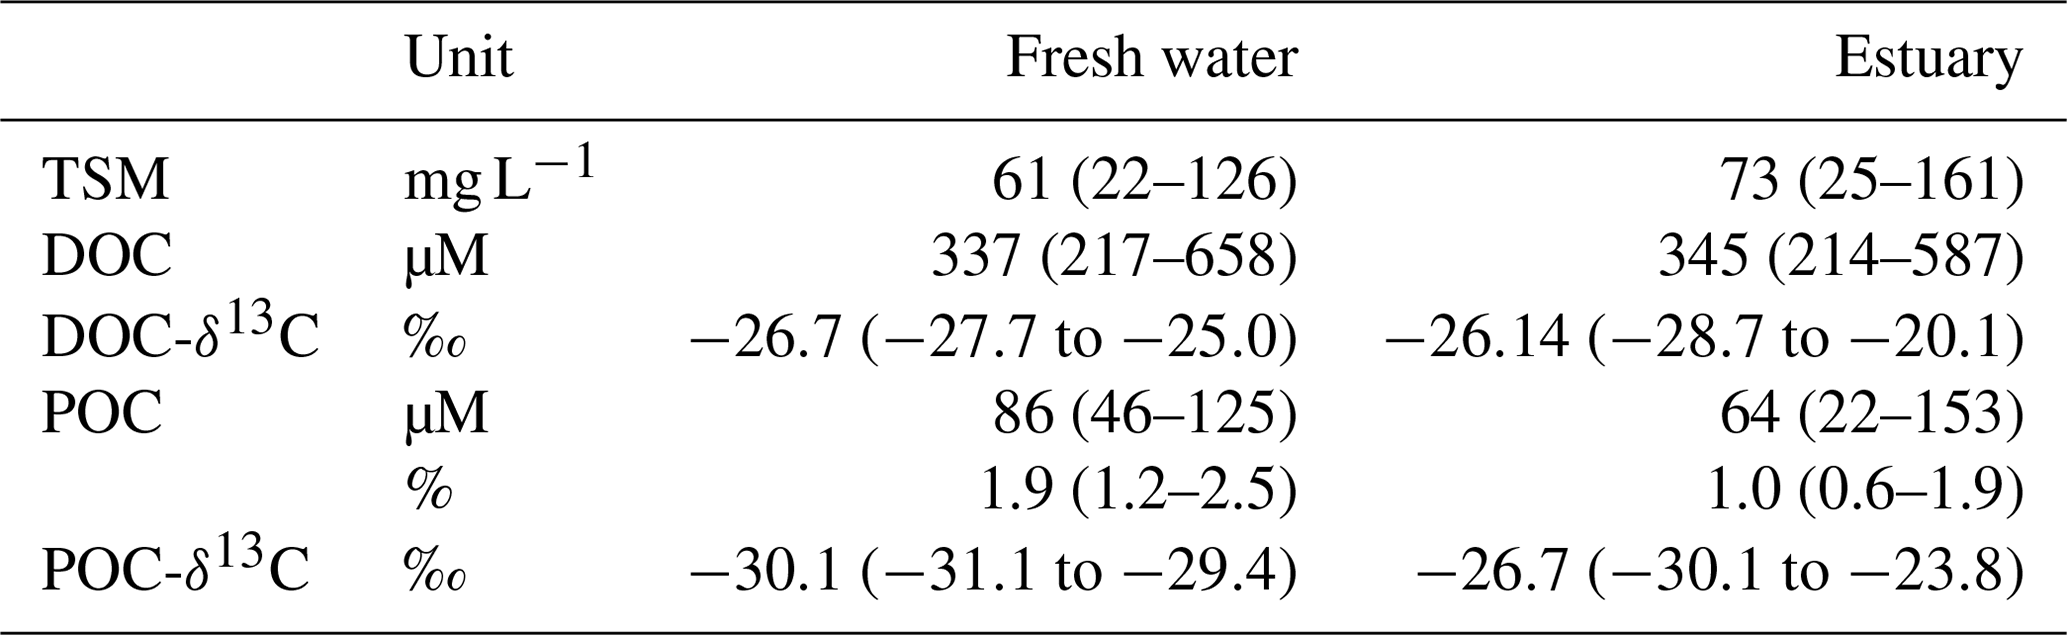
In August 2016, the TSM concentration in the Rajang ranged from 22 to 161 mg L−1. Mean TSM concentrations in the freshwater and estuarine sections were 61 and 161 mg L−1, respectively (Table 1). Throughout the system DOC concentrations exceeded POC concentrations. DOC and POC in the freshwater section averaged 337 and 86 µM and in the estuarine section 345 and 64 µM, respectively (Table 1). DOC concentrations were slightly higher in the estuary than in the freshwater section (Table 1), and maximum concentrations for both DOC and POC were found at around salinity 15 to 20 in the estuary (Fig. 2).
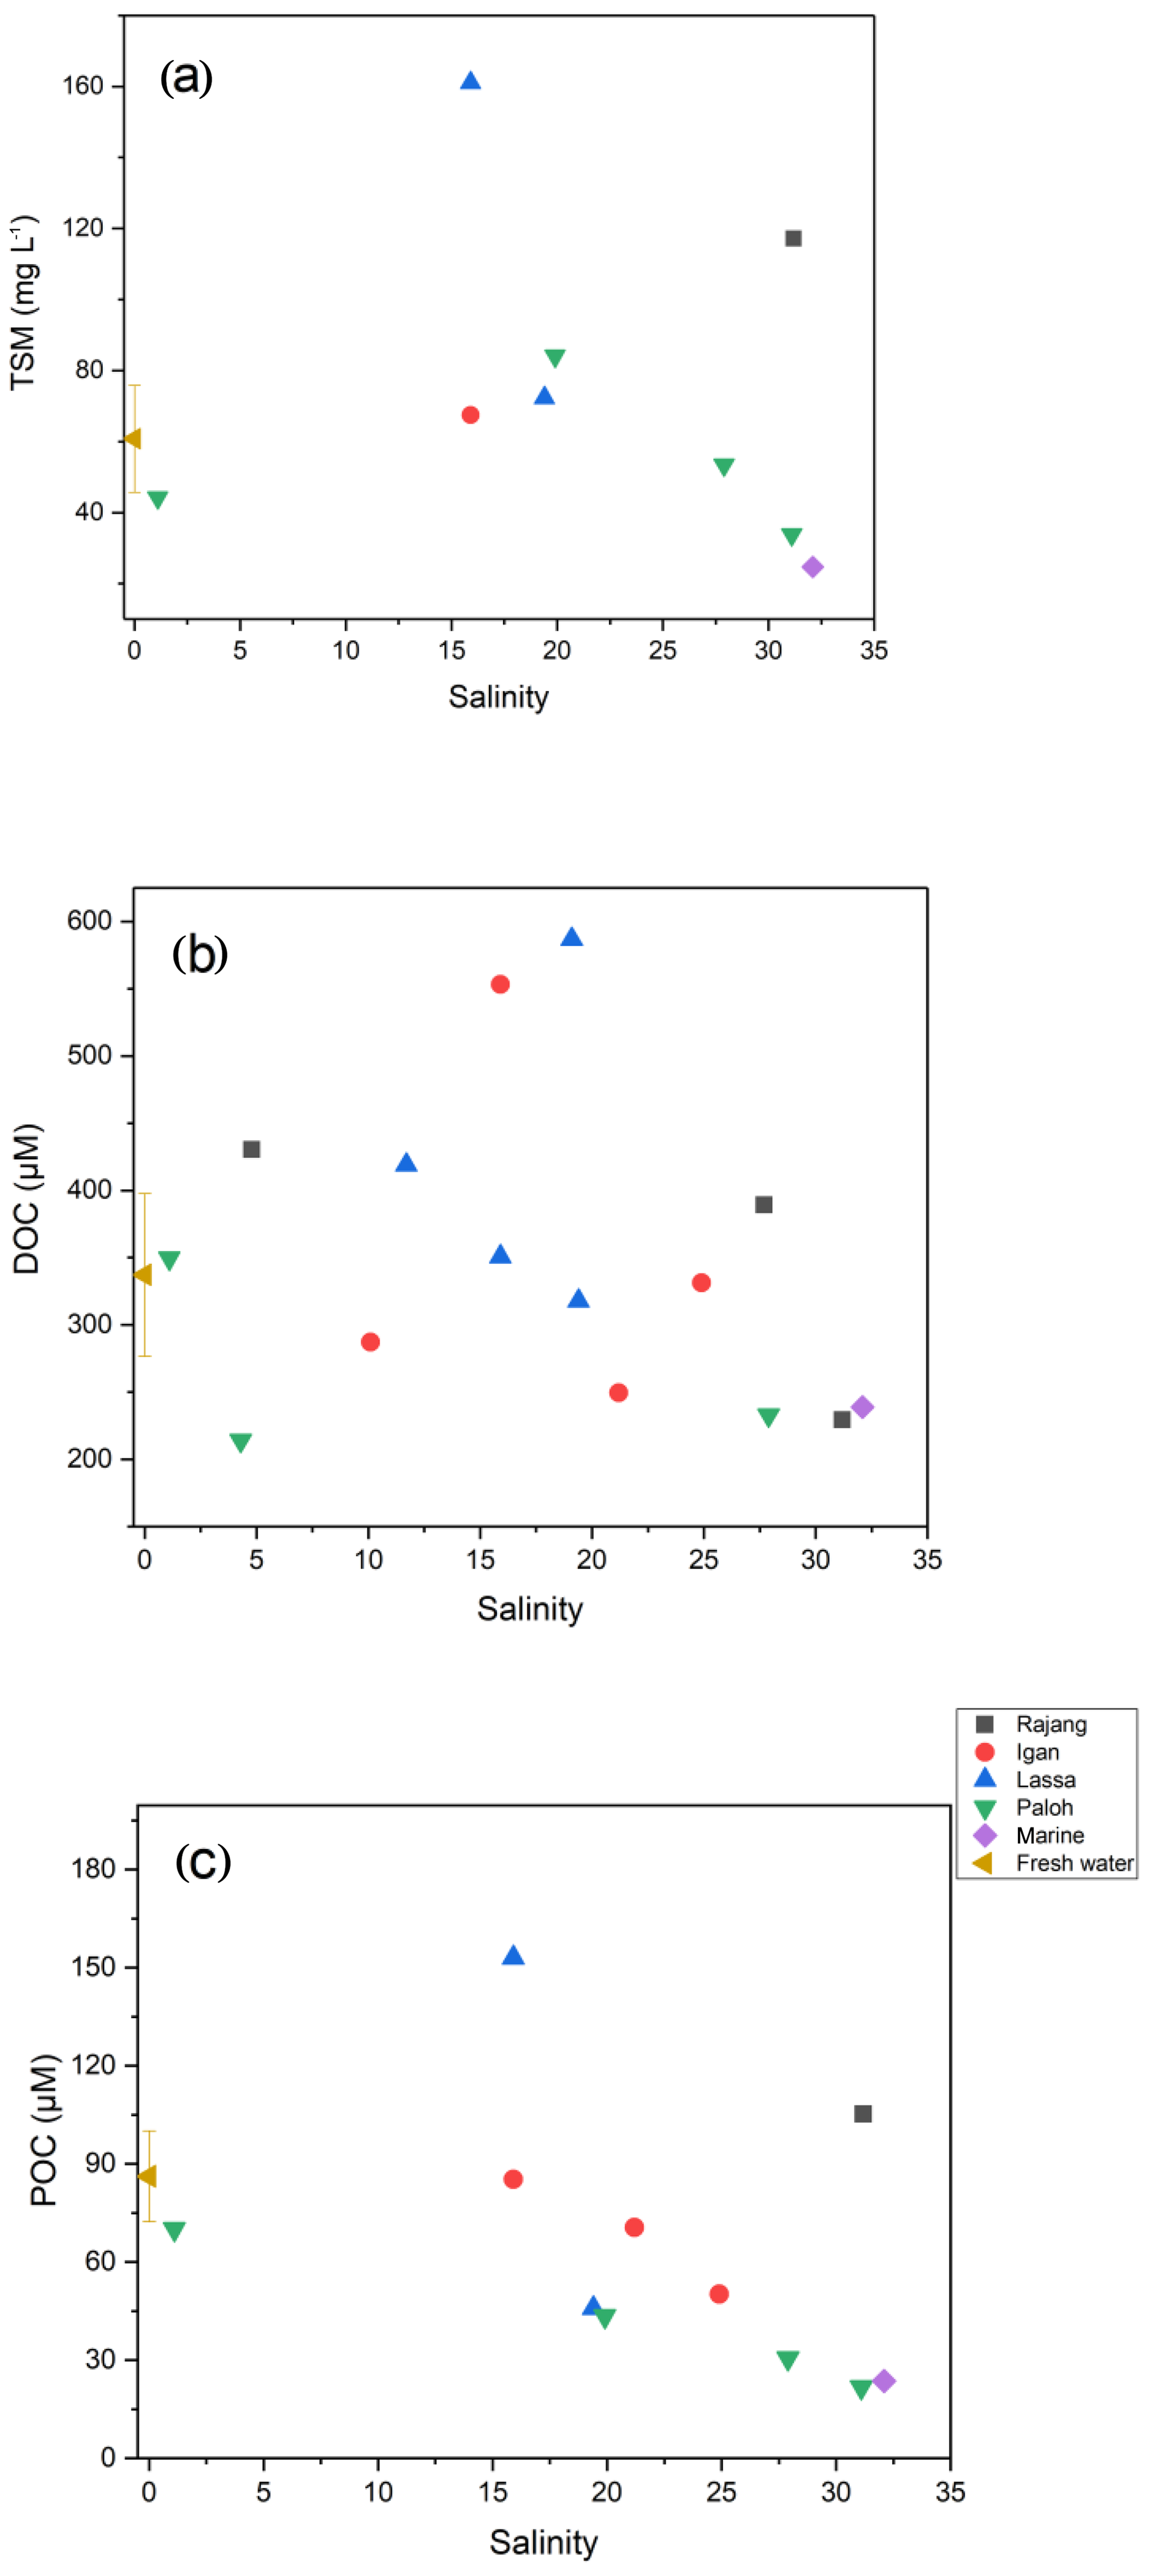
Figure 2Distribution patterns of (a) TSM, (b) DOC, and (c) POC along with salinity in the Rajang. The freshwater data point represents all samples with a salinity of 0, and the error bar corresponds to the standard deviation. The marine data point represents S1.
DOC-δ13C ranged from −28.7 ‰ to −20.1 ‰ (Table 1). There was a U-shaped trend in DOC-δ13C from the freshwater to the estuary section, with one outlier from the Rajang main stream at a salinity of 5 (S2 station; Fig. 3a). The minimum DOC-δ13C (bottom of the U) was detected at a salinity of ∼10 (Fig. 3a). For particulate OM, δ13C ranged between −29.4 ‰ to −31.1 ‰ in the freshwater section. In the estuary section, there was a clear increasing trend with increasing salinity, from −30 ‰ (S=1.1) to values close to −24 ‰ (S>30; Fig. 3b).
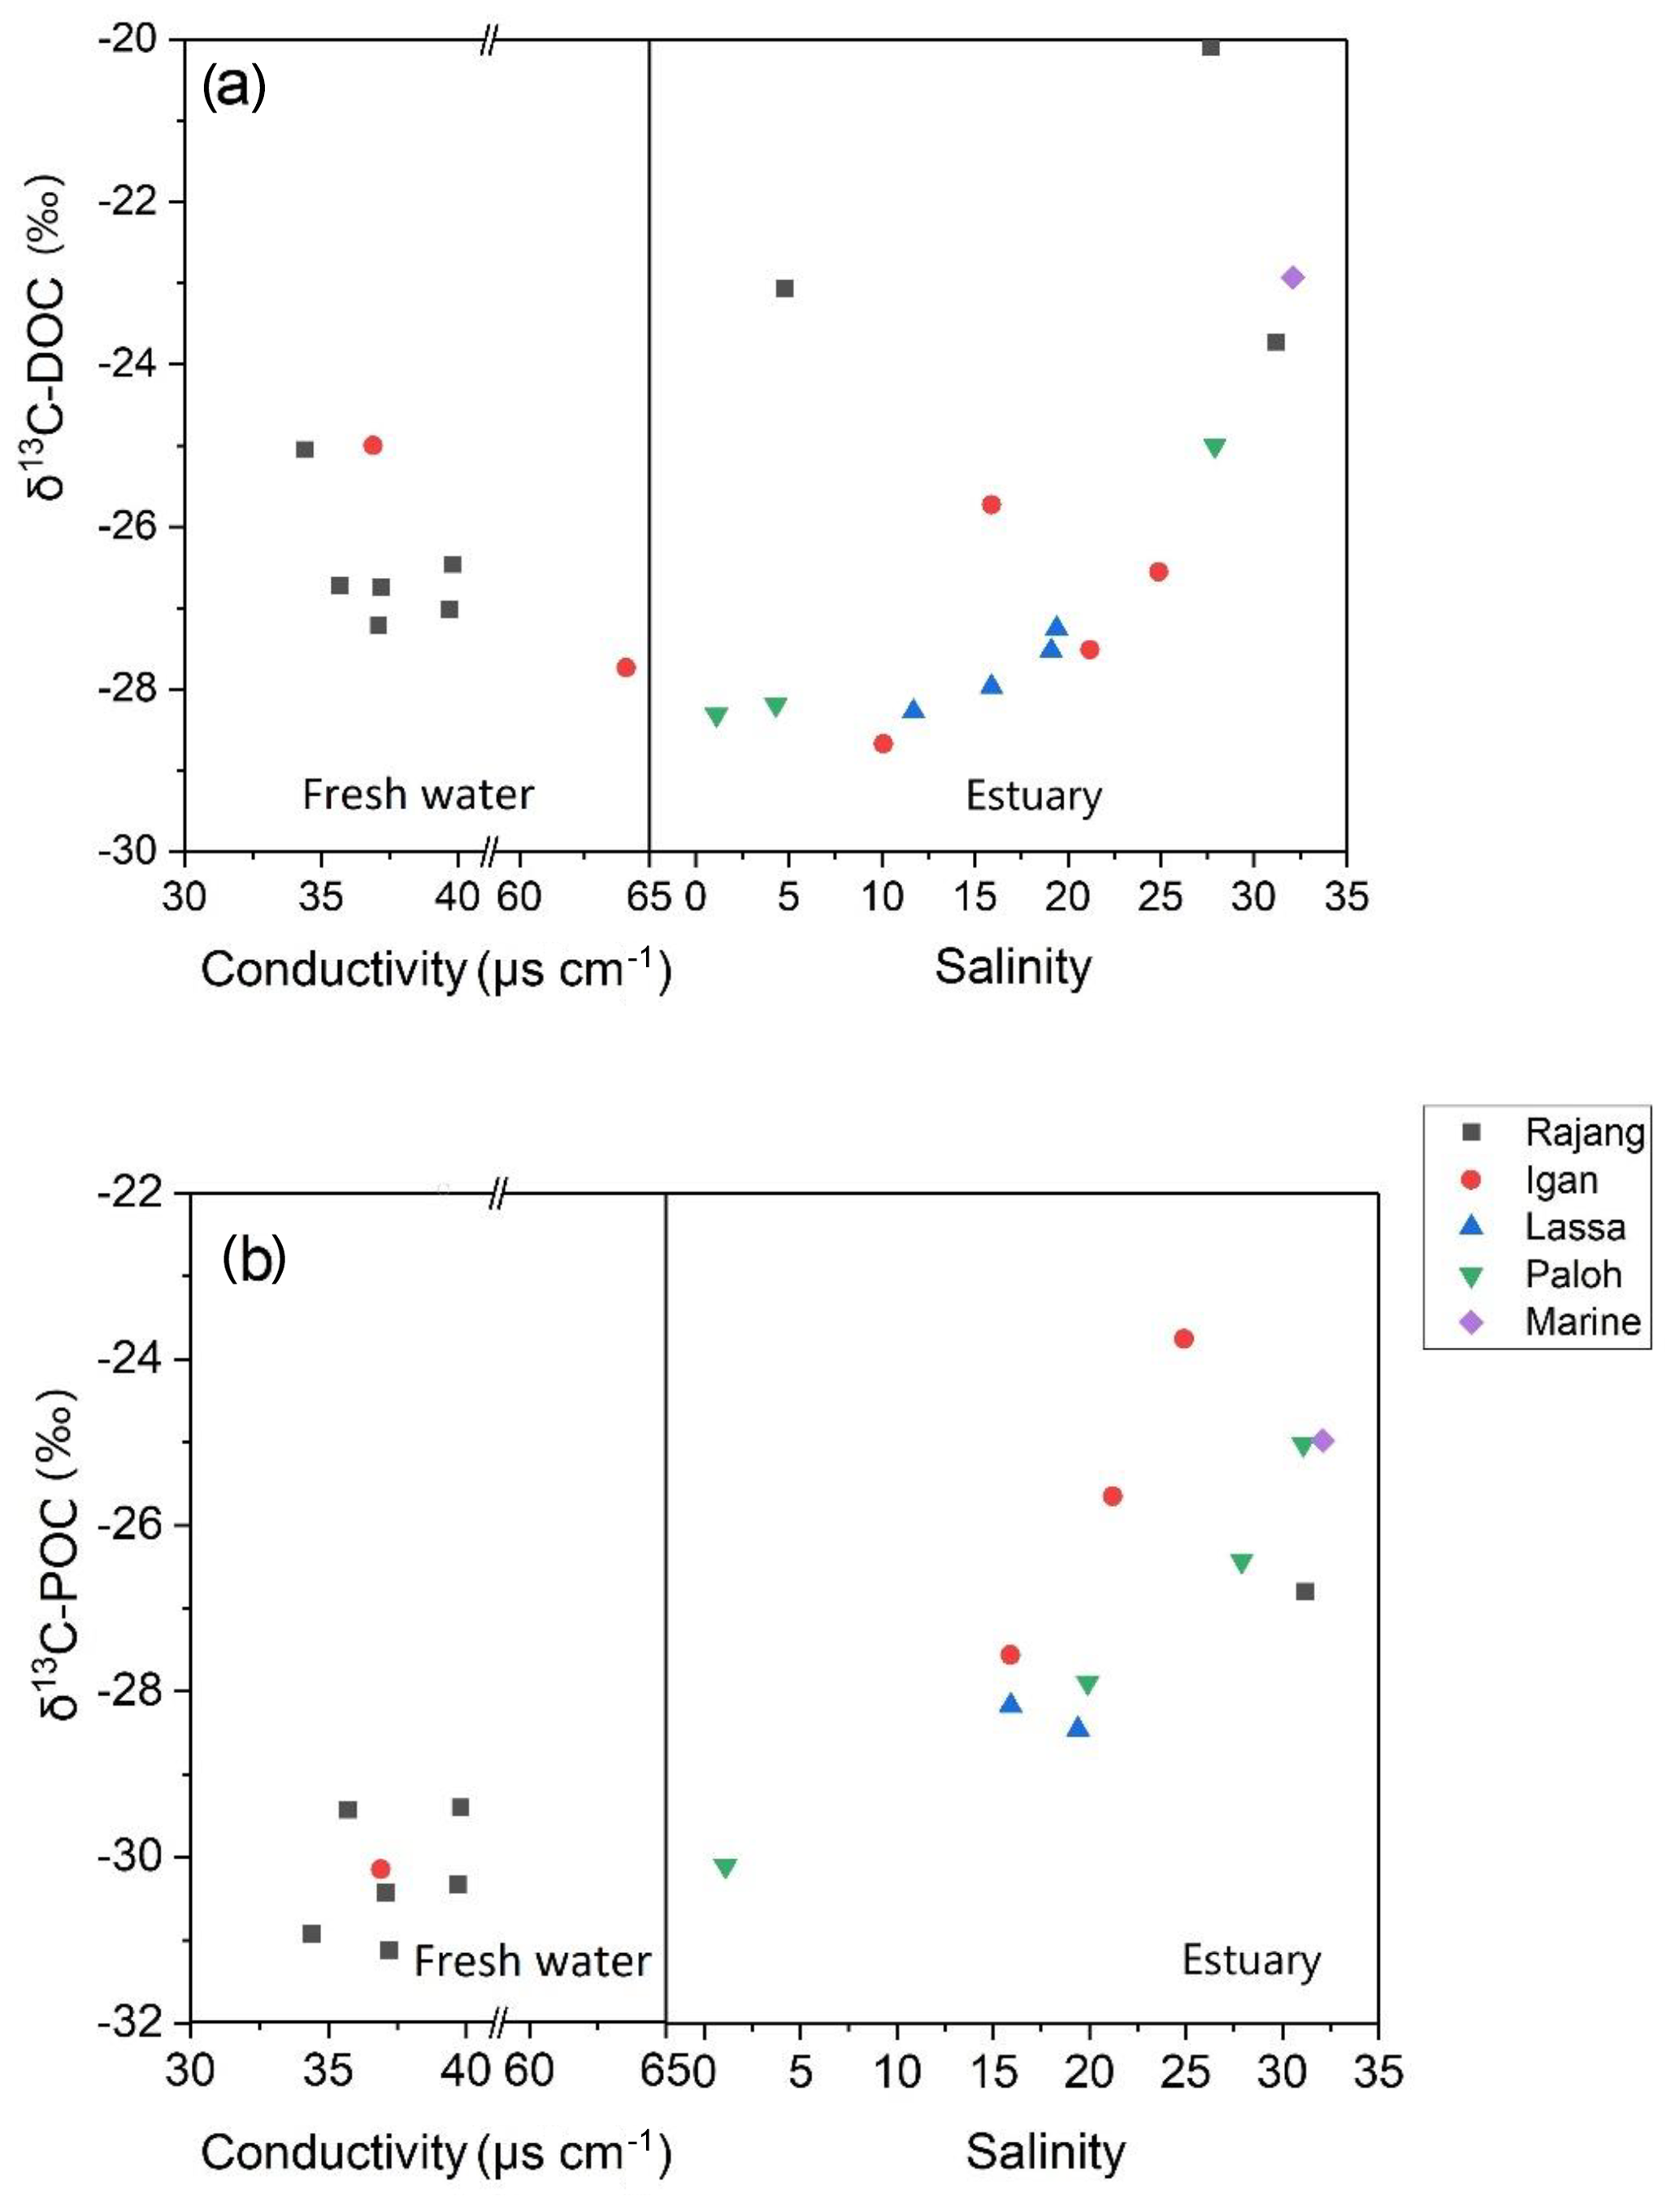
Figure 3Distribution patterns of (a) DOC-δ13C and (b) POC-δ13C along with conductivity and salinity in the Rajang. The legend indicates the branches that the samples were collected from, and the marine data points correspond to station S1.
Table 2Rajang AAs (mean (min–max)) in August 2016.
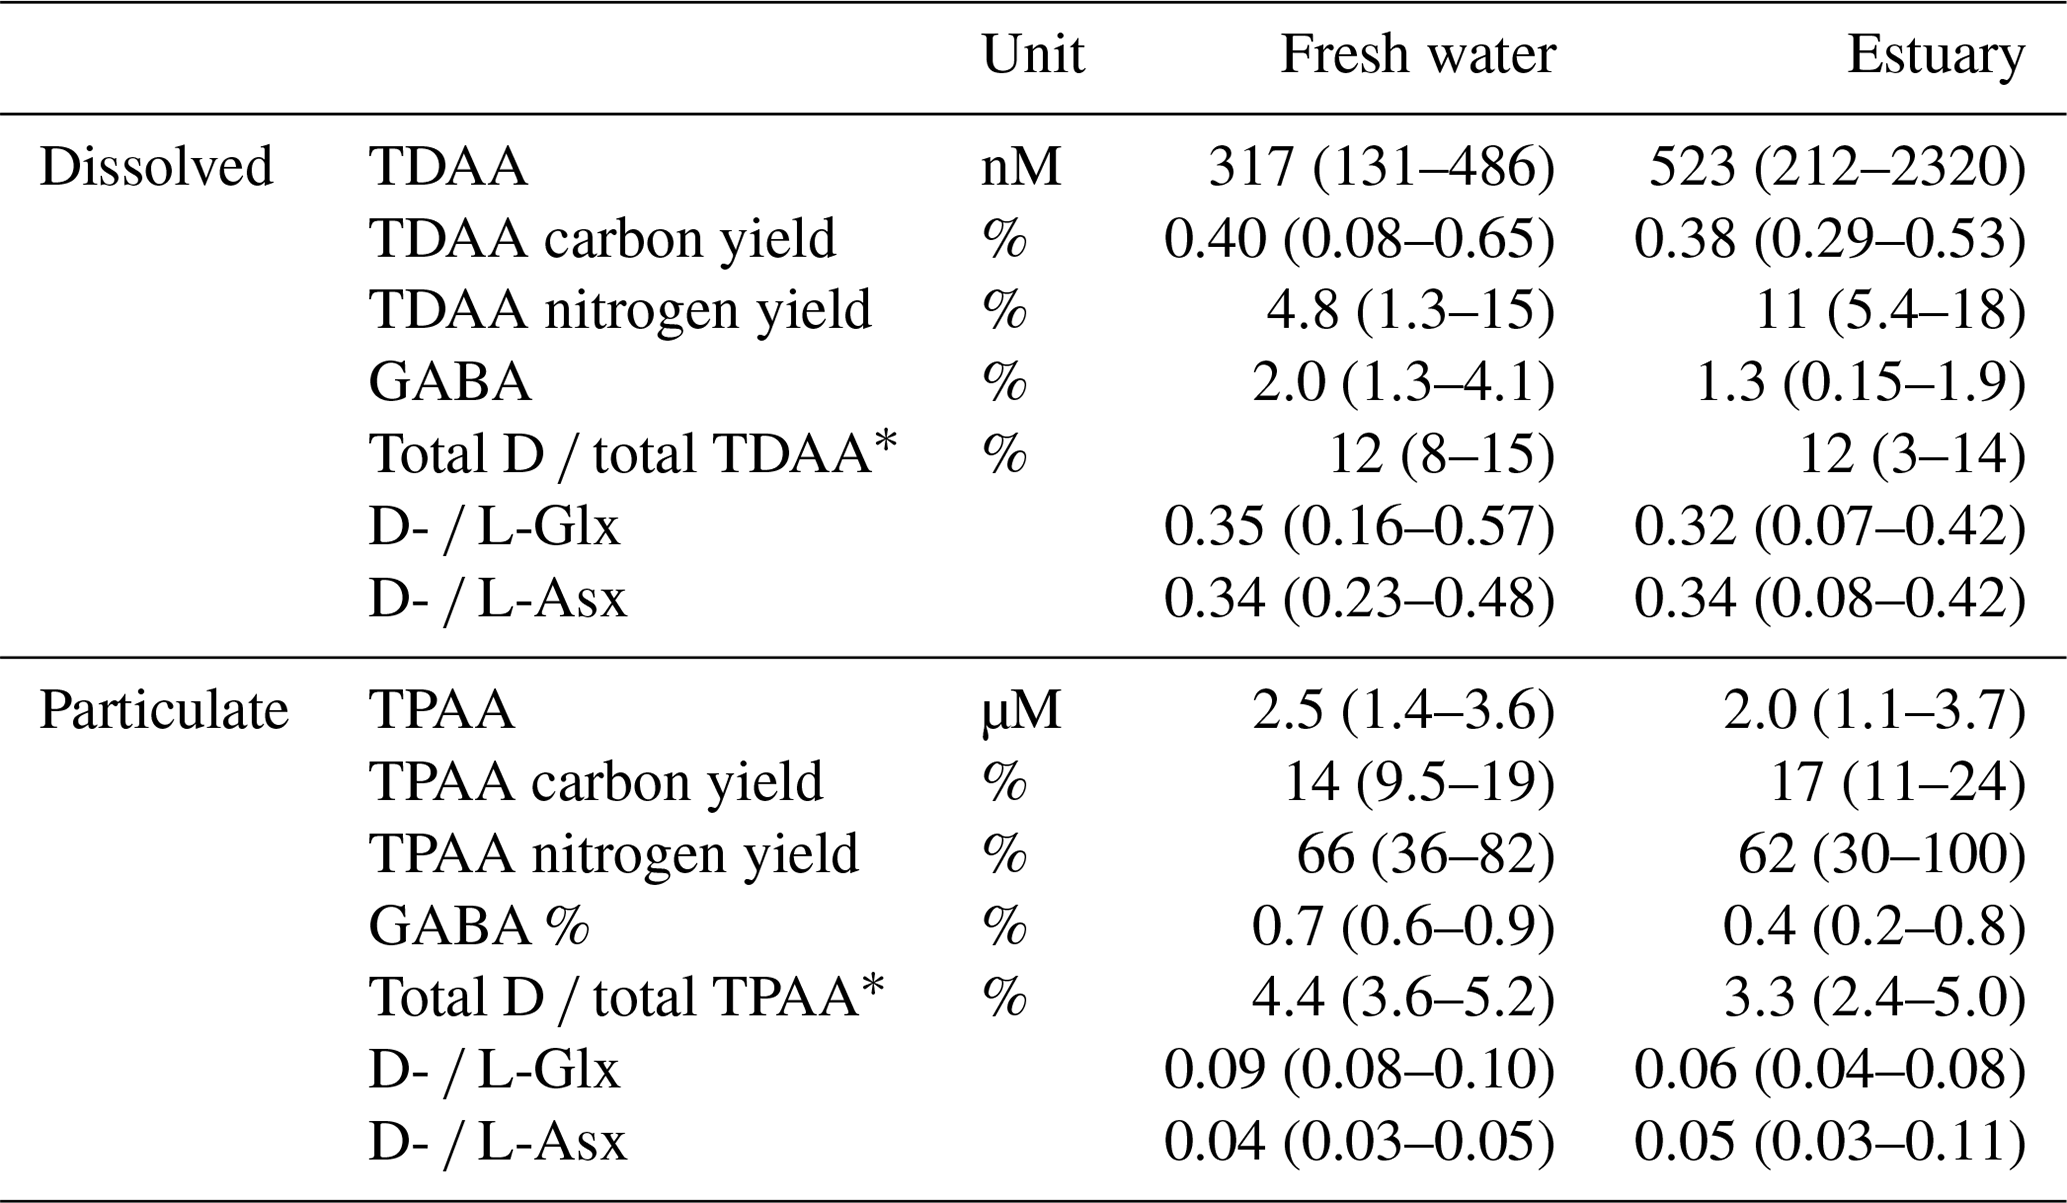
∗ Total D ∕ TDAA is total D-form AA versus TDAA. Total D ∕ TPAA is total D-form AA versus TPAA.
In the freshwater section, the mean TDAA and TPAA concentrations were 0.3 and 2.5 µM, respectively (Table 2). For TDAA, the AA carbon yield (the carbon from AA divided by bulk DOC or POC, in %) was similar in both freshwater and estuary sections, namely 0.40 % and 0.38 % (mean), respectively (Table 2). In contrast, the AA nitrogen yield was higher in the estuary (11 %) than in the freshwater section (4.8 %; Table 2). For TPAA, there was little difference between the freshwater and estuary sections in AA carbon yield (13.5 % and 16.8 %, respectively) and nitrogen yield (66 % and 62 %, respectively; Table 2).
In both the dissolved and the particulate phase, Gly, Glx, Ala, and Asx were the most abundant AA compounds. These four AAs together accounted for 66 % of TDAA and 47 % of TPAA in the freshwater section and 59 % of TDAA and 48 % of TPAA in the estuary. The nonprotein AA GABA was detected in trace amounts but was more abundant in the dissolved phase than in the particulate phase, as indicated by the higher GABA percentage in the dissolved phase (Table 2). GABA percentage decreased from 2 % (freshwater section mean) to 1.3 % (estuarine section mean) in the dissolved phase and decreased from 0.7 % (freshwater section mean) to 0.4 % (estuarine section mean) in the particulate phase (Table 2). In the estuary, GABA percentage in the dissolved phase remained stable (∼1.5 %) in brackish water (salinity 5 to 20) and quickly dropped to <1 % where salinity was over 30 (Fig. 4a). Most of the GABA percentage values lay above the theoretical mixing line (Fig. 4a). In the particulate phase, there was an overall decrease in GABA percentage with increasing salinity within the estuary (Fig. 4b).
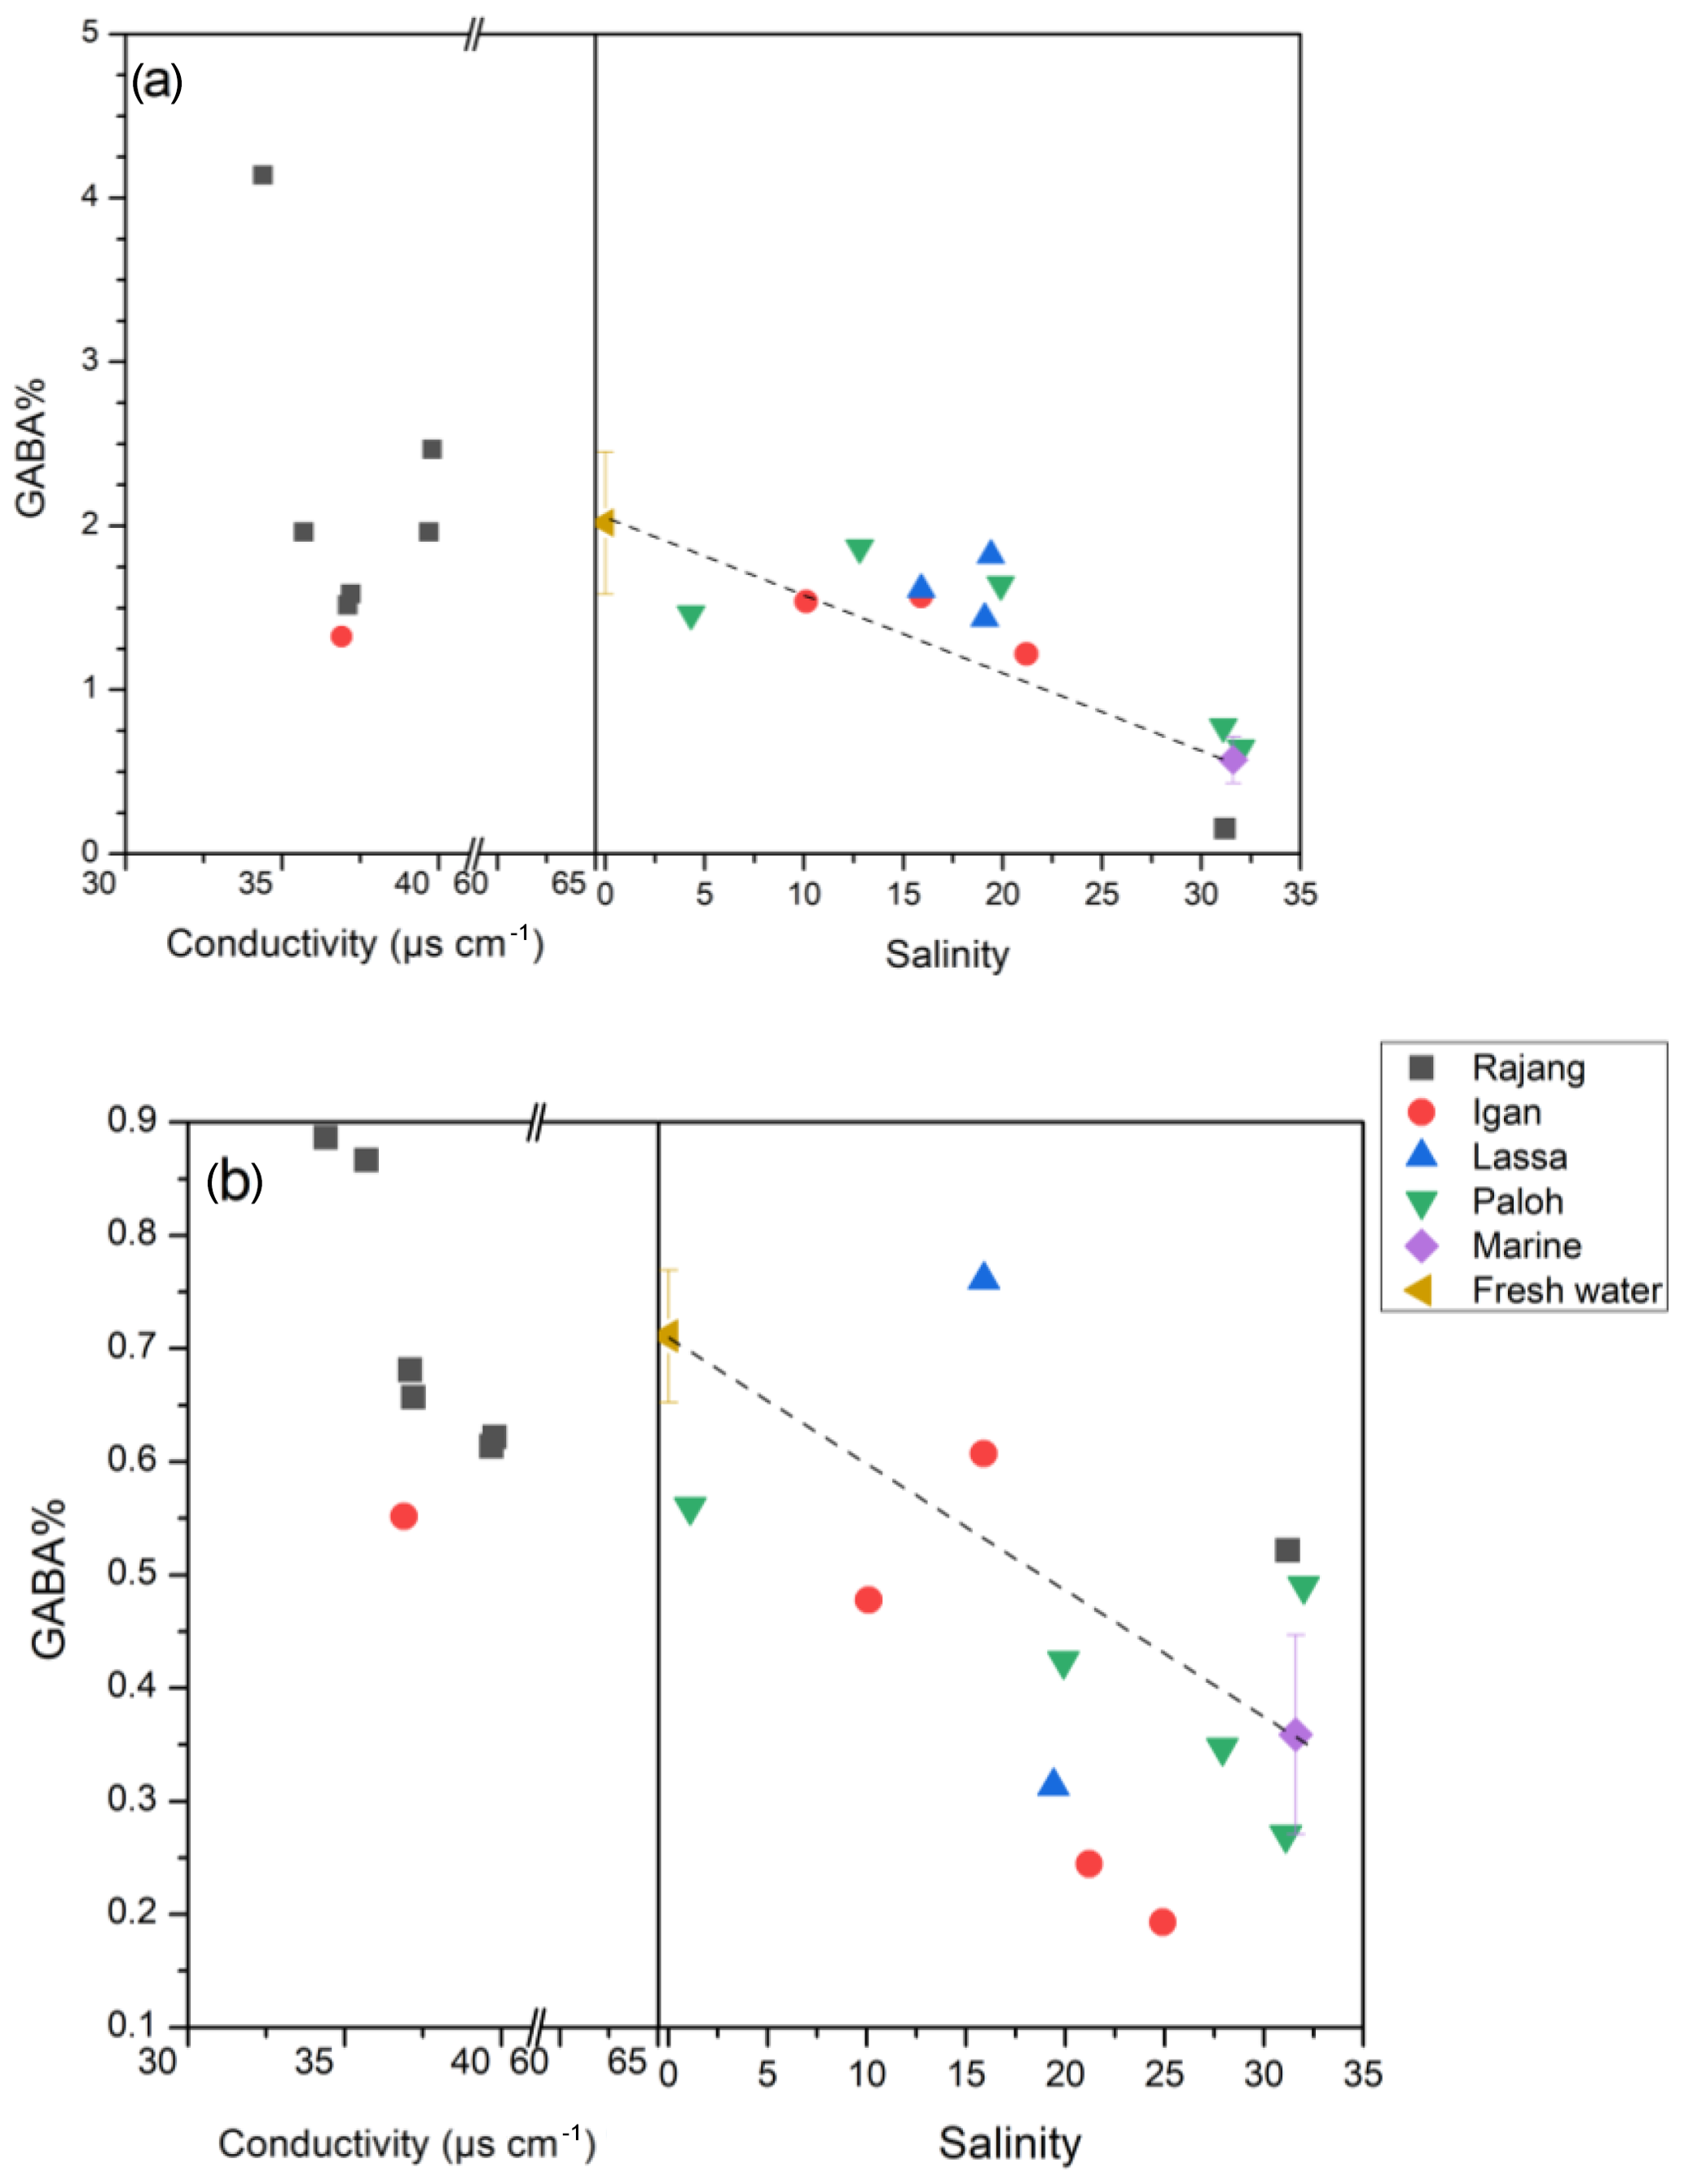
Figure 4The GABA percentage distribution pattern from fresh water to the estuary in the Rajang: (a) dissolved and (b) particulate. Note the different x-axis scales between plots (a) and (b). The dashed line indicates the linear mixing line between freshwater and marine endmembers. The freshwater endmember (brown triangle) was calculated as the mean of all freshwater samples (salinity 0), and the marine endmember (purple diamond) was calculated as the mean of all offshore samples with salinity > 30. The error bar indicates the standard deviation.
The percentage of D-form enantiomers of AAs in TDAA averaged 12 % for both freshwater and estuarine sections, with Glx and Asx being the most abundant D-form AAs. The percentage of D-form AAs was much lower in TPAA, decreasing from a mean of 4.4 % in the freshwater section to a mean of 3.3 % in the estuary (Table 2). Patterns in the variation in D- and L-Glx (Fig. 5) along the conductivity–salinity gradient in the Rajang were similar to those for GABA percentage (Fig. 4) for both dissolved and particulate phases. Similar to GABA percentage, all the dissolved samples in the estuary had elevated values for D- and L-Glx (i.e., values above the theoretical dilution line; Figs. 4a and 5a).

Figure 5The D- ∕ L-Glx distribution pattern from fresh water to the estuary in the Rajang: (a) dissolved and (b) particulate. Note the different x-axis scales between plots (a) and (b). The dashed line indicates the linear mixing line between freshwater and marine endmembers. The freshwater endmember (brown triangle) was calculated as the mean of all freshwater samples (salinity 0), and the marine endmember (purple diamond) was calculated as the mean of all offshore samples with salinity > 30. The error bar indicates the standard deviation.
4.1 Distribution patterns of OM composition
4.1.1 Dissolved OM
Terrestrial OM usually has a more negative δ13C value (−32 ‰ to −26 ‰ for C3 plants), whereas marine OM has more positive values (δ13C, ‰; Lamb et al., 2006; Mayorga et al., 2005). Overall, the very negative δ13C values for DOC ( ‰) in the riverine section of the Rajang clearly indicate that the OM had a C3 plant source (e.g., mangroves and oil palms; Jennerjahn et al., 2004; Lamade et al., 2009; Wu et al., 2019), whereas DOC-δ13C values of ‰ in the estuary (salinity > 30) suggest a mixture of terrestrial and marine OM sources (Fig. 3a). The most depleted δ13C values for DOC occurred at a salinity of 10 (Fig. 3a). Above this salinity, the influence of marine OM became more overwhelming, and the bulk DOC δ13C signal was more enriched (Fig. 3a).
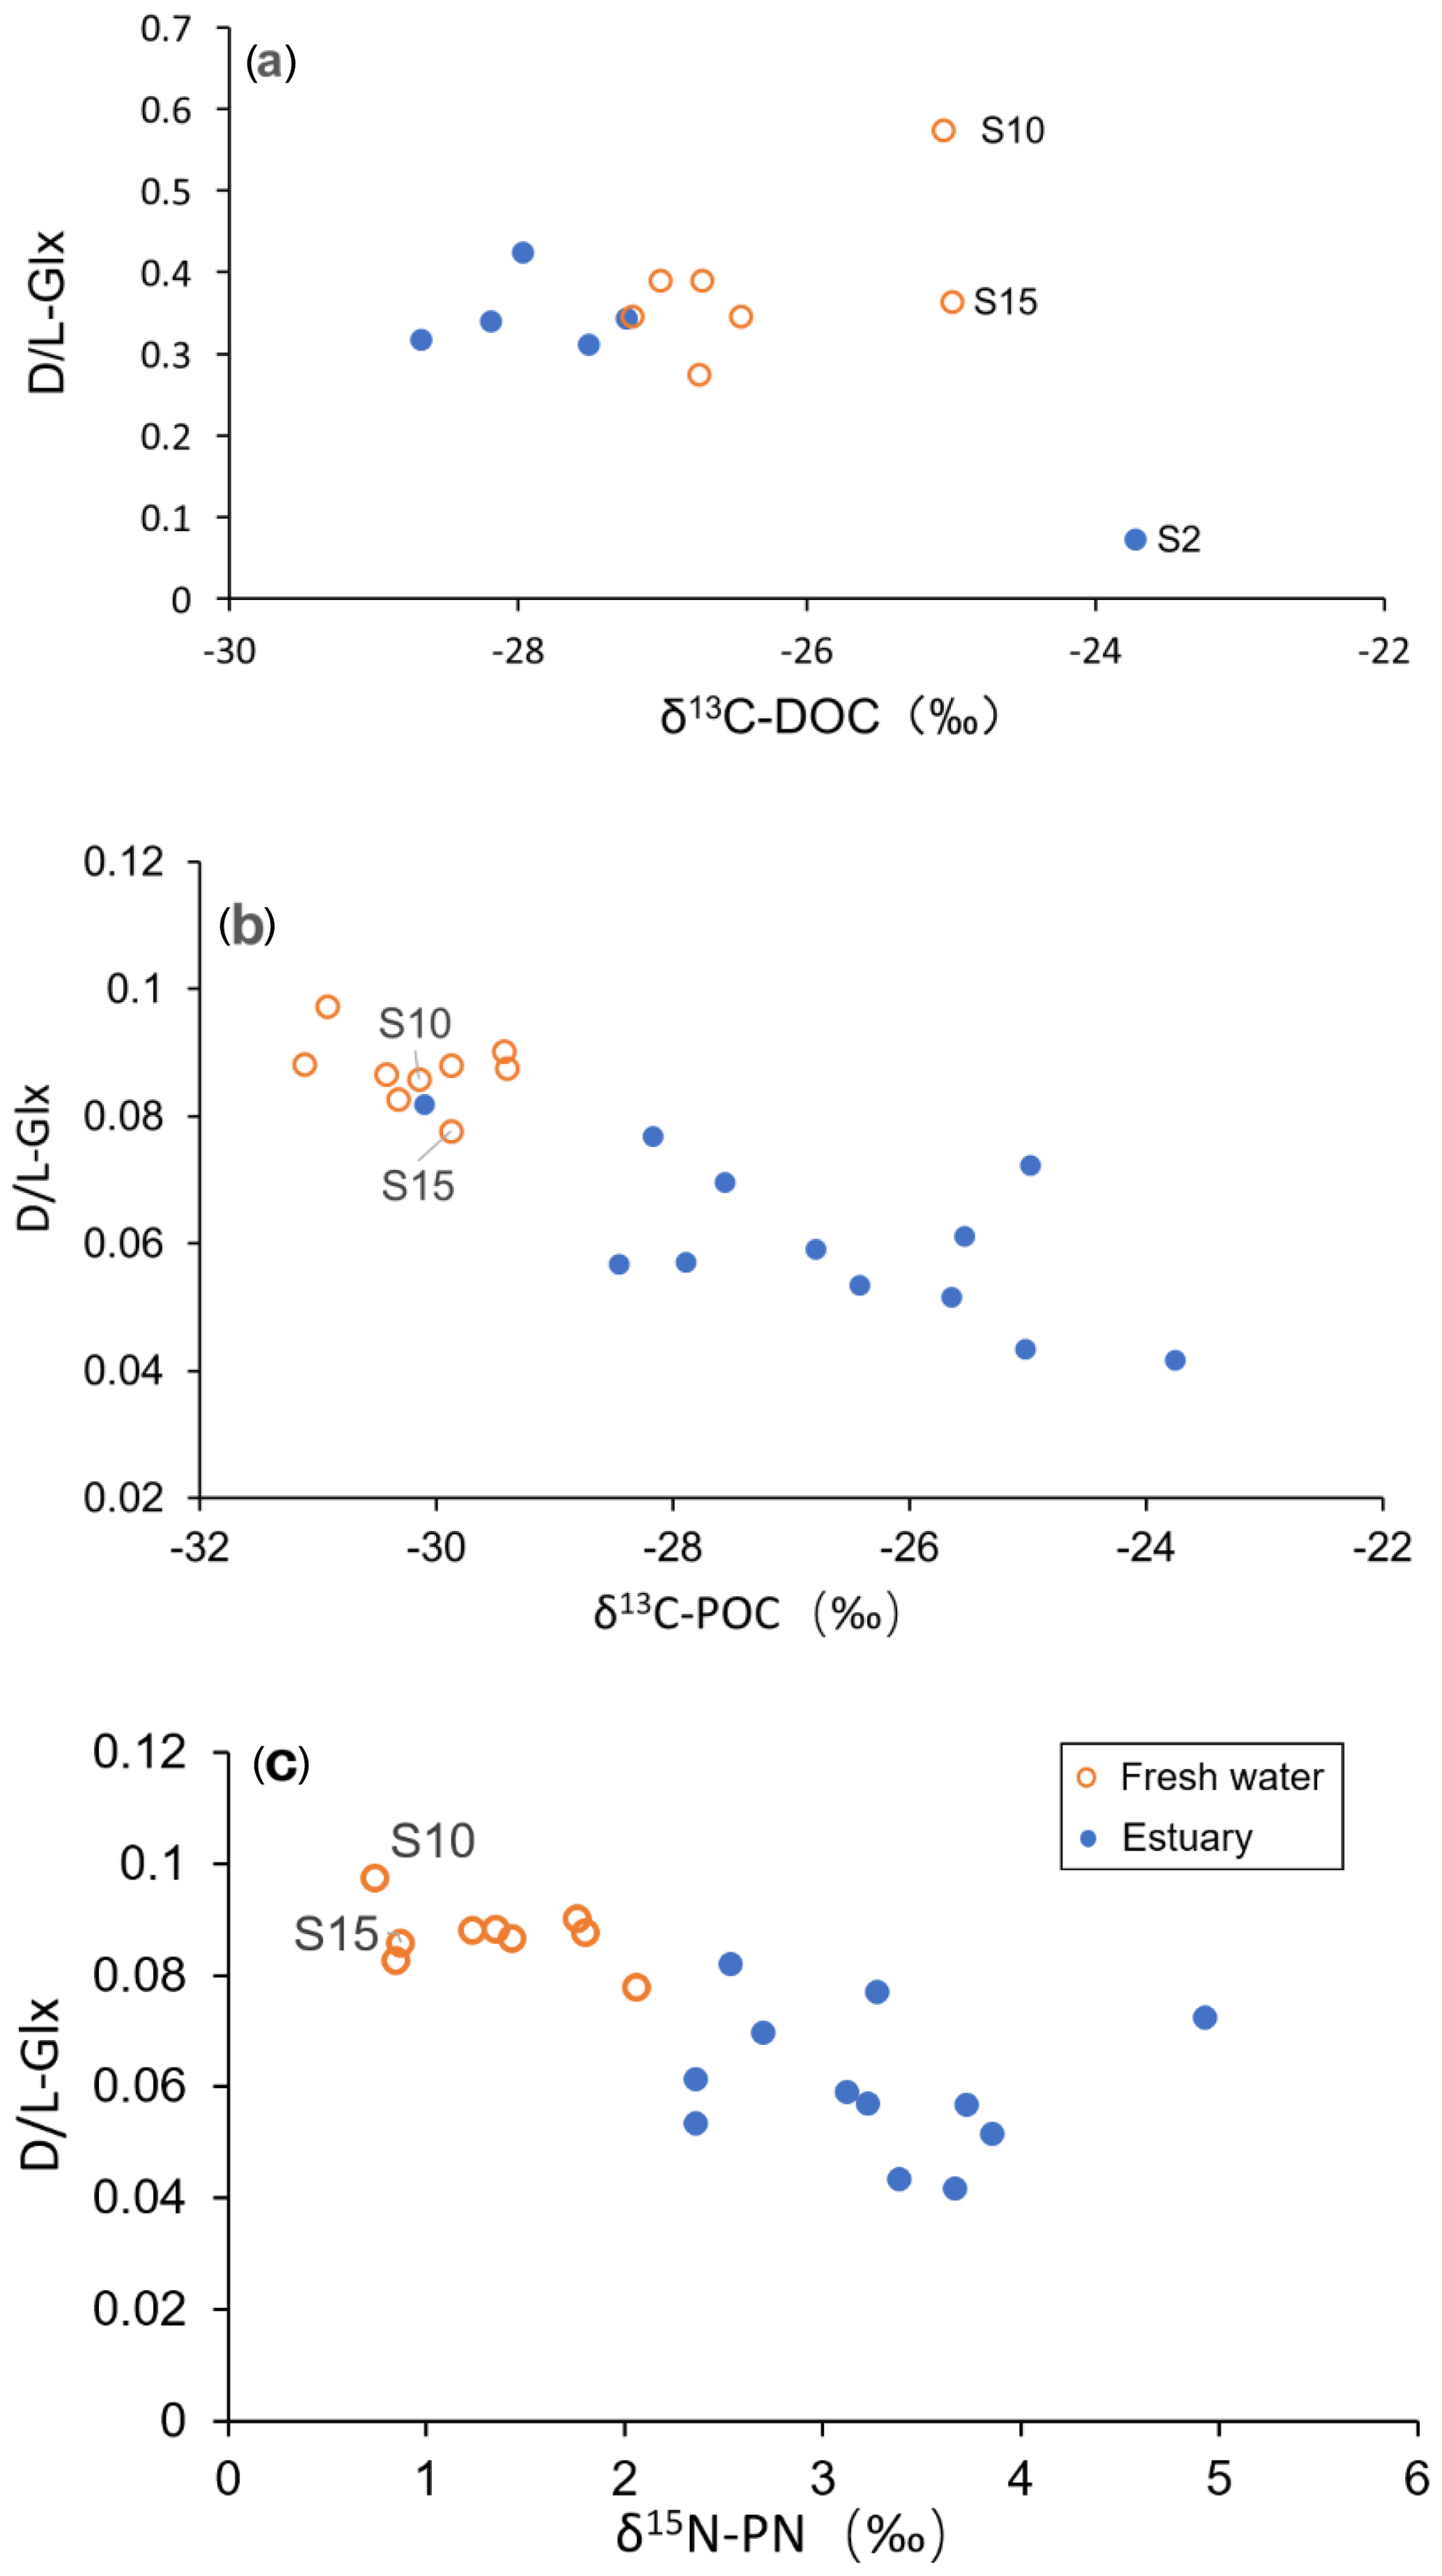
Figure 6D ∕ L ratio of AAs (as Glx) plotted against (a) DOC-δ13C (b) POC-δ13C, and (c) PN-δ15N.
Among samples in the freshwater section, the most enriched DOC-δ13C values (S10 and S15; DOC-δ13C −25 ‰; Fig. 3a), although initially appearing to be outliers, were characterized by very elevated D- ∕ L-amino acid ratios (Fig. 6a). This was particularly the case for the sample from S10 (the uppermost station in this study; Fig. 1b), which showed a maximum D- ∕ L-Glx ratio of 0.57 (Fig. 6a). In addition, these samples from S10 and S15 also showed a higher D ∕ L ratio for Asp (S10 0.49; S15 0.38; figure not shown) when compared to all freshwater or estuary samples (mean 0.34; Table 2). On land, D-form amino acids can be derived from abiotic racemization. This process occurs over a very long timescale (e.g., over thousands of years) and results in L-form amino acids slowly changing into their corresponding D-form (Schroeder and Bada, 1976). More significantly, in contemporary environments D-form amino acids are widely synthesized by bacteria during cell membrane construction (Schleifer and Kandler, 1972). D- ∕ L-glutamic acid and D- ∕ L-aspartic acid ratios of pure peptidoglycan (Staphylococcus aureus, gram-positive) are 0.49 and 0.30, respectively (Amon et al., 2001). Although δ13C values for bacteria in the Rajang remain unknown, bacteria have been reported to have δ13C values from −12 ‰ to −27 ‰ (Lamb et al., 2006). The contribution of OM derived from bacteria may therefore explain the relatively enriched δ13C values observed at inland station S10 and station S15. A possible OM source at these stations is soil humic substances, which are expected to have a high contribution from bacteria and therefore D-form amino acids (Dittmar et al., 2001a). A more depleted pattern of DOC-δ13C from mountain to lowland is suggested to be due to dilution and mixing with younger OM in the lowland (Mayorga et al., 2005). This is consistent with the pattern we observed of depleted DOC-δ13C values within the freshwater section corresponding with a lower D ∕ L ratios pattern, which suggests dilution with less degraded OM (see orange circles in Fig. 6a). Whether the elevated D ∕ L ratios and relatively positive δ13C values for dissolved samples in the freshwater section at S10 and S15 (Fig. 6a) reflect the presence of soil humic substances or instead reflect the direct presence of bacteria requires further study.
In the estuarine section, it was very clear that terrestrial biodegraded OM (indicated by elevated D ∕ L ratios and more negative δ13C) is diluted with more labile OM (lower in D ∕ L ratio but more positive δ13C; see solid blue data points in Fig. 6a). However, this apparent dilution trend became less clear or showed no trend when the D ∕ L ratio was plotted against salinity (Fig. 5a). This was also confirmed by the GABA percentage distribution pattern which showed a platform-like pattern at a salinity between 5 and 20 (Fig. 4a). Though TDAA at S1 was missing, the composition of TDAA at S2 (salinity 31.2) was very typical of marine OM (i.e., a very low D ∕ L ratio and relatively enriched DOC-δ13C; Fig. 6a). Hence there is a conservative distribution pattern for dissolved OM in the estuary when plotted against δ13C (Fig. 6a) but not when plotted against salinity (Figs. 4a and 5a). The location above the conservative dilution line of all OM data in the brackish estuary (salinity 10 to 25; Figs. 4a and 5a), indicates that the OM in the estuarine section was more degraded than theoretically expected. The combination of degraded OM and DOC concentration increase in the estuary (345 µM in the estuary vs. 337 µM in the freshwater section; Fig. 2b) suggests the addition of degraded DOC to the Rajang. Nonconservative dissolved OM behavior in the estuary has previously been reported based on an optical approach (Martin et al., 2018), and minimal OM alteration during estuarine transport was suggested (Martin et al., 2018). Hence, it is likely that changes in dissolved OM composition (Figs. 4a and 5a) may largely take place on land and in estuaries (e.g., in pore water of soil) and impact the Rajang riverine dissolved OM via leaching from soils.
4.1.2 Particulate OM
In the river section of the Rajang, depleted POC-δ13C indicated the strong influence of terrestrial OM; this OM is likely derived from C3 plant material, which is a major component of the sediment OM (Wu et al., 2019). In the estuarine section of the Rajang, there was seaward enrichment of POC-δ13C (Fig. 3b), suggesting that the OM was diluted with marine particulate OM and aligning with similar isotope enrichment of suspended particles in brackish water observed in other estuaries (Cifuentes et al., 1996; Raymond and Bauer, 2001). Unlike dissolved OM, there were no POC samples with unusually enriched δ13C values in the freshwater section (Fig. 6b, c). D- ∕ L-Glx ratios of particulate OM in the freshwater section were higher when compared with those in the estuary section (Table 2), and overall, when compared with dissolved OM, particulate OM basically became more labile when transported seawards, as indicated by shifts in its composition (Figs. 4b and 5b) and isotope ratio with salinity (Fig. 6b, c).
Although particulate OM had a lower D ∕ L ratio than dissolved OM (Fig. 6), it should be noted that this does not imply that mean dissolved OM is more aged or degraded than particulate OM. Riverine POM and DOM usually show different ages (Bianchi and Bauer, 2011), and this can be influenced by selective desorption and adsorption of bacteria and related detritus between the particulate and dissolved phases which can strongly modify the biomarker-indicated degradation status of OM (Dittmar et al., 2001a).

Figure 7DOC ∕ DON ratio distribution pattern along with salinity in the Rajang. For fresh water and estuary, the mean DOC ∕ DON value was 50 and 140, respectively. DON concentrations are taken from Jiang et al. (2019).
4.2 Different fate of bulk organic carbon and nitrogen
Leaching of DOC and DON from peatlands is driven by different mechanisms: DOC release is related to the status of peatland (pristine vs. degraded), whereas DON release is determined by the dissolved inorganic nitrogen (DIN) content of peatland soil (Kalbitz and Geyer, 2002). In the Rajang, bulk DOC and DON concentrations were not coupled, as indicated by variations in DOC ∕ DON ratios (Fig. 7). The average DOC concentration in the estuary part was slightly higher (345 µM) than in the river part (337 µM; Table 2), suggesting the addition of DOC in the estuary. In comparison, there appears to have been removal of DON in the estuary (Jiang et al., 2019).
In the Rajang, estuarine DOC exhibited nonconservative dilution behavior based on optical properties (Martin et al., 2018), which is consistent with other peatland-draining rivers in Sarawak (Müller et al., 2016). The contribution of marine sources to dissolved OM is reflected in the increasing DOC-δ13C in the estuary part (Fig. 3a). Peatland, however, is known for its high contribution to fluvial DOC, and it has been suggested that it contributes to the DOC in the Rajang (Martin et al., 2018). In peatland-draining rivers west of the Rajang, the DOC concentration endmember can be as high as 3690 µM (Müller et al., 2015). Under such a high-DOC background, a simple three-point mixing model, with endmembers of (1) observed fluvial DOC concentration, (2) peatland DOC concentration, and (3) inferred fluvial DOC concentration from a marine-river mixing curve, suggested that peatland DOC addition accounts for 3 % of the fluvial DOC in the Saribas River and 15 % in the Lupar River (Müller et al., 2016). Assuming that peatland in the Rajang estuary has a comparable endmember DOC concentration to other peatland in Sarawak (i.e., 3690 µM; Müller et al., 2015) and given our observed Rajang freshwater DOC endmember value of 337 µM (DOC concentration at S5 station) and a marine DOC endmember of 238 µM (S1 station), a similar mixing-model approach suggests that peatland DOC contributed 4 % of the Rajang fluvial DOC, which is comparable to the Saribas River and much lower than the Lupar River (Müller et al., 2016). In the meantime, as mentioned in the previous section, there is a nonconservative dilution pattern, with dissolved OM in the estuary part more degraded than expected based on simple dilution with a marine endmember (Figs. 4a and 5a). Hence it is reasonable to infer that peatland not only contributed to the fluvial DOC in concentration (Martin et al., 2018) but also modified the dissolved OM composition (more biodegraded) in the estuary. In another tropical-river study, mangroves in the estuary exerted a stronger influence on fluvial dissolved OM than hinterland vegetation did (Dittmar et al., 2001b). This is consistent with the Rajang, for which estuarine processes apparently impact the dissolved OM in terms of both DOC concentration (by increasing the bulk amount) and composition (by adding biodegraded DOC). The estuarine dissolved OM showed higher biodegraded characteristics (e.g., elevated GABA percentage and D ∕ L ratio; Figs. 4a and 5a), but this subpart may be photolabile (Martin et al., 2018). Photodegradation is expected to be enhanced when TSM decreases and light penetration in the water column increases (e.g., as OM enters the sea; Martin et al., 2018). Other oceanic degradation mechanisms include the priming effect (Bianchi, 2011). The fate of the terrestrial OM in the sea requires further study. As we lack the DON concentration endmember in peatland, peatland impact on DON in the estuary was not estimated in the current study.
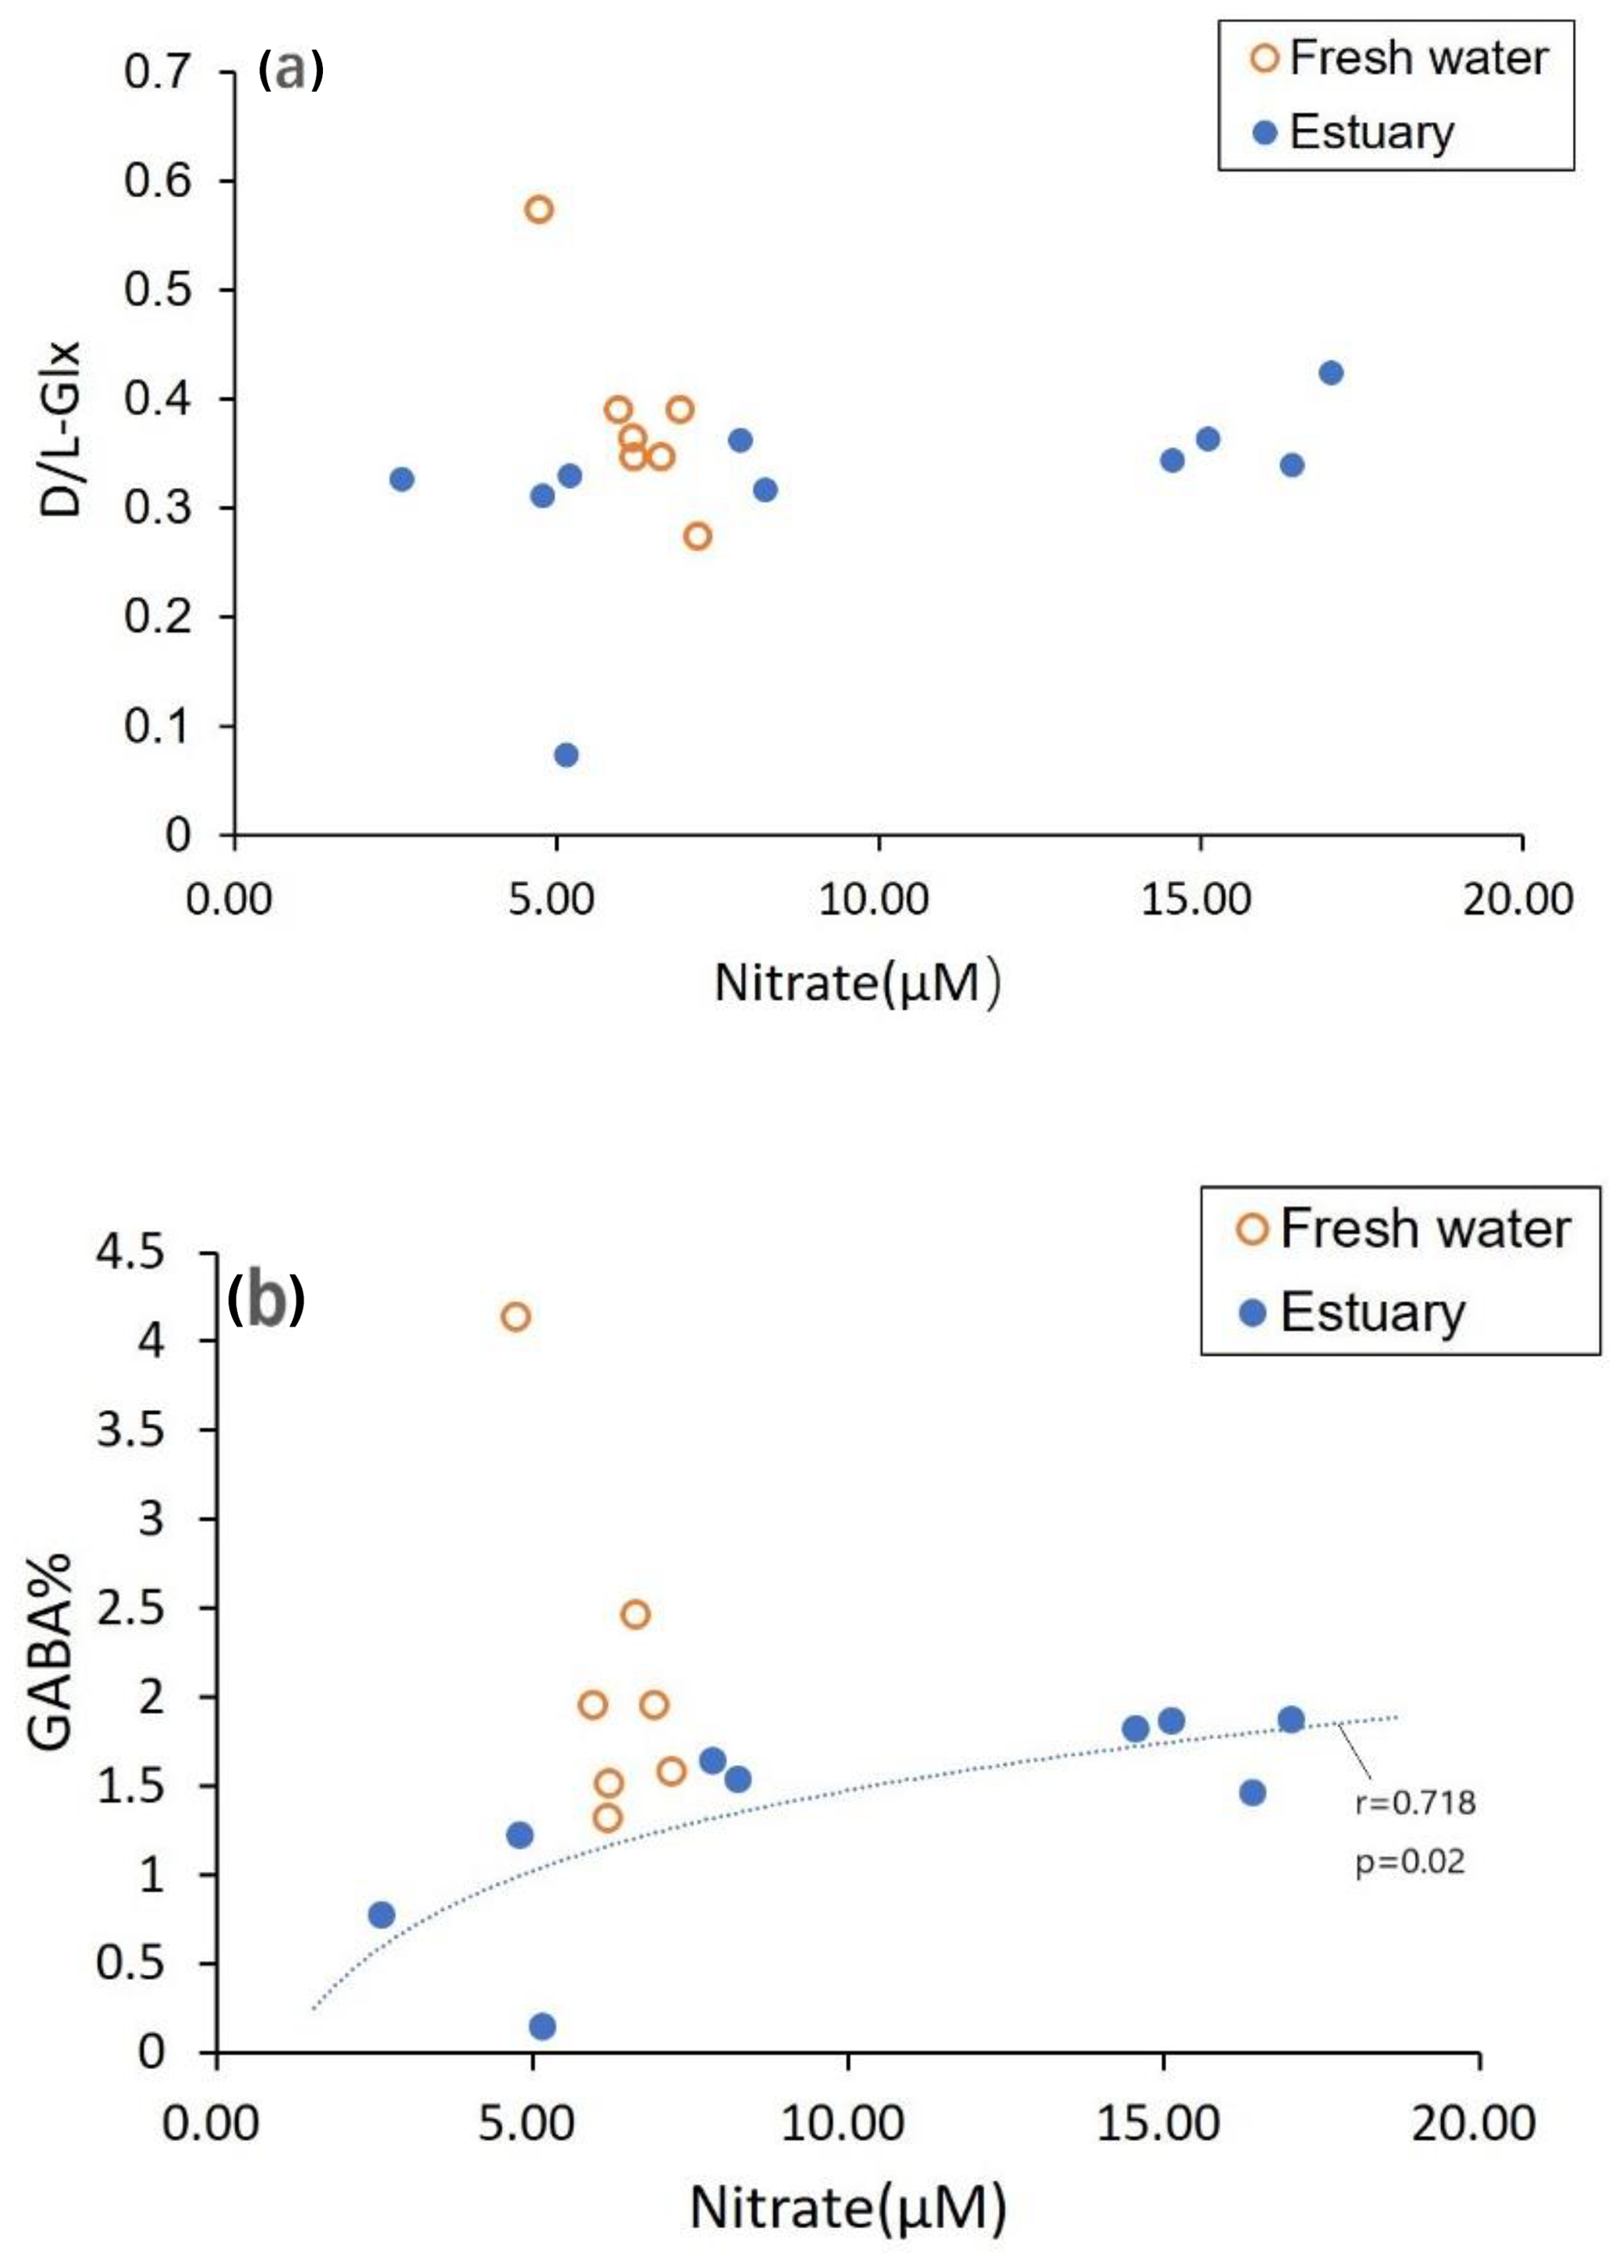
Figure 8Dissolved OM composition (a D- ∕ L-Glx, b GABA percentage) and its relationship with nitrate concentration. Nitrate concentrations are taken from Jiang et al. (2019).
In contrast to DOC, which was apparently added to the estuary, DON was removed, contributing to a remarkable increase in dissolved inorganic nitrogen in the estuary (Jiang et al., 2019). In the freshwater section, the nitrate concentration was not related to the ratio of D ∕ L dissolved AAs, nor dissolved GABA percentage (Fig. 8). However, in the estuarine section, although it was not related to D- ∕ L-AAs, nitrate concentration was related to GABA percentage (Fig. 8b). This indicates that fluvial nitrate in the freshwater section was not derived from remineralization of fluvial organic matter in the river channel but more likely from other sources (e.g., leaching of soil). In the estuarine section, some DON transformation may have occurred (Jiang et al., 2019), although leaching from soils cannot be ruled out (Fig. 8). For the particulate phase, no relationship between nitrate and particulate OM composition was detected (figure not shown).
The atomic DOC ∕ DON ratio in the Rajang averaged 50 in the river part and increased to 140 (mean value) in the estuary part (Fig. 7). Although the DOC ∕ DON ratio was much higher than in other tropical peatland river waters (around 10; Sjögersten et al., 2011), the ratio was comparable to that in other peatland-draining rivers in Sarawak like the Lupar, Saribas, and Maludam rivers (Müller et al., 2015, 2016), which all enter the South China Sea. The ratio is also within the reported C ∕ N ratio of peatland and leaves (Müller et al., 2016). For the Amazon River, the DOC to total nitrogen ratio ranges from 27 to 52 (Hedges et al., 1994), and, given that this ratio includes inorganic nitrogen, the DOC ∕ DON ratio for the Amazon River would be even higher. Under the background of such high C ∕ N ratios (e.g., 50), transformation of DON to DIN in the estuary further enhanced the high DOC ∕ DON ratio (to 140), and hence a deficiency in terrestrial organic nitrogen output is expected for the Rajang River. We noted that dissolved inorganic nitrogen concentrations in the Rajang were on the order of 10 µM, comparable to DON (Jiang et al., 2019). Terrestrial nitrogen output is an important source for coastal primary production (Jiang et al., 2019), but peatland-impacted rivers may have relatively lower nitrogen input to the South China Sea when compared with their very high river basin DOC yields (Baum et al., 2007). On the one hand, logging and secondary growth have been found to play a negative role in the nitrogen output efficiency of forest soils (Davidson et al., 2007). On the other hand, disturbed tropical peatlands could release more DOC in comparison to an undisturbed site (Moore et al., 2013) while the DOC ∕ DON ratio may also decrease along with disturbance of peatland (Kalbitz and Geyer, 2002). Given that secondary growth in the river basin and anthropogenic disturbance of peatland (e.g., drainage and conversion for oil palm) are both common (Hooijer et al., 2015), changes in DOC ∕ DON ratios in the Rajang are complex and further assessment is needed.
In August 2016 in the Rajang, we observed that dissolved OM composition (as a D- ∕ L-Glx ratio) was conservatively diluted along with increasing DOC-δ13C, indicating that the sources of dissolved OM have a very conservative impact on the OM composition. When D- ∕ L-Glx ratios were plotted against salinity, this linear conservative dilution pattern disappeared (Figs. 4a and 5a). This implies that the total addition of DOC in the estuary (peatland and mangrove) had an impact on dissolved OM composition, adding more biodegraded OM and resulting in data above the theoretical dilution line (Figs. 4a and 5a). For particulate OM, though the data were variable, the overall decreasing GABA percentage or D ∕ L ratio with increasing salinity were much clearer relative to those of dissolved OM (Figs. 4b and 5b). The particulate D- ∕ L-Glx ratio in the estuary was usually lower than in the freshwater section (Figs. 6b and c), whereas for dissolved OM, the majority of the samples in the estuary had a D- ∕ L-Glx ratio similar to those of the freshwater section (Fig. 6a). The difference in OM composition between freshwater and estuarine sections suggests that dissolved OM became more degraded while particulate OM became less degraded in the estuary.
The Rajang is characterized by DOC ∕ DON ratios of 50 in the freshwater section, and the further loss of DON in the estuary increased the ratio to 140. Peatland draining and logging and secondary growth are reported to have conflicting impacts on carbon and nitrogen cycling (Davidson et al., 2007; Moore et al., 2013), which may increase fluvial DOC and limit basin nitrogen output, resulting in even larger DOC ∕ DON ratios. Mismatch in carbon and nitrogen loss from tropical rivers due to anthropogenic activities plays a role in material cycling in both terrestrial and marine systems, enhancing the role of tropical rivers as direct sources of carbon in the atmosphere; the effect of changes in nitrogen output and its feedback on the carbon cycle need further monitoring and assessment.
Finally, this work is based on a dry-season investigation (August). Though the seasonality for Rajang OM may be moderate (Martin et al., 2018), for biomarkers like amino acid enantiomers further investigation in the wet season is needed.
The L- and D-enantiomers are not listed. Note that glycine has no enantiomer.
| Name | Abbreviation |
| Organic matter | OM |
| Dissolved organic carbon | DOC |
| Dissolved organic nitrogen | DON |
| Total suspended matter | TSM |
| Amino acid | AA |
| Total hydrolyzable dissolved amino acids | TDAA |
| Total hydrolyzable particulate amino acids | TPAA |
| Alanine | Ala |
| Arginine | Arg |
| Asparagine | Asx |
| Aspartic acid | Asx |
| Glutamine | Glx |
| Glutamic acid | Glx |
| Glycine | Gly |
| Isoleucine | Ile |
| Leucine | Leu |
| Lysine | Lys |
| Methionine | Met |
| Phenylalanine | Phe |
| Serine | Ser |
| Threonine | Thr |
| Tryptophan | Trp |
| Tyrosine | Tyr |
| Valine | Val |
| γ-aminobutyric acid | GABA |
Data concerned in this work is available at: https://doi.org/10.6084/m9.figshare.12061725.v1 (Zhu et al., 2020).
ZYZ conceived the idea, wrote the original manuscript and participated in the field sampling. JO revised the manuscript; JO and BE contributed data; YYH analyzed the data set; ESAS participated in the field sampling and contributed samples and data; SJ contributed data; ZYZ, MM and JZ provided grant support, designed the sampling strategy and participated in the field sampling.
The authors declare that they have no conflict of interest.
This article is part of the special issue “Biogeochemical processes in highly dynamic peat-draining rivers and estuaries in Borneo”. It is not associated with a conference.
We thank the captain and crew of the boat Sea Wonder and other colleagues onboard for assistance during the fieldwork. We thank colleagues and students at both Swinburne University of Technology (Sarawak Campus) and the State Key Laboratory of Estuarine and Coastal Research (SKLEC), East China Normal University (ECNU), for their help in fieldwork and/or lab work. We thank Aazani Mujahid at the University of Malaysia Sarawak for her help and hospitality during our stay in Malaysia.
This research has been supported by the National Key Research and Development Program of China (grant 25, no. 2018YFD0900702), the MOHE FRGS 15 grant (grant no. FRGS/1/2015/WAB08/SWIN/02/1), the ARC Linkage grant (grant no. LP150100519) in Australia, the SKLEC Open Research Fund (grant no. SKLEC-KF201610), and the Ministry of Education of China and State Administration of Foreign Experts Affaires of China (grant 30, no. 111 project issued to SKLEC and ECNU).
This paper was edited by Phillip Ford and reviewed by one anonymous referee.
Amon, R. M. W., Fitznar, H. P., and Benner, R.: Linkages among the bioreactivity, chemical composition, and diagenetic state of marine dissolved organic matter, Limnol. Oceanogr., 46, 287–297, 2001.
Baum, A., Rixen, T., and Samiaji, J.: Relevance of peat draining rivers in central Sumatra for the riverine input of dissolved organic carbon into the ocean, Estuar. Coast. Shelf S., 73, 563–570, 2007.
Bianchi, T. S.: The role of terrestrially derived organic carbon in the coastal ocean: A changing paradigm and the priming effect, P. Natl. Acad. Sci. USA, 108, 19473–19481, 2011.
Bianchi, T. S. and Bauer, J. E.: Particulate Organic Carbon Cycling and Transformation, in: Treatise on Estuarine and Coastal Science, edited by: Eric, W. and Donald, M., Academic Press, Waltham, 69–117, 2011.
Cifuentes, L. A., Coffin, R. B., Solorzano, L., Cardenas, W., Espinoza, J., and Twilley, R. R.: Isotopic and Elemental Variations of Carbon and Nitrogen in a Mangrove Estuary, Estuar. Coast. Shelf S., 43, 781–800, 1996.
Cloern, J. E., Foster, S. Q., and Kleckner, A. E.: Phytoplankton primary production in the world's estuarine-coastal ecosystems, Biogeosciences, 11, 2477–2501, https://doi.org/10.5194/bg-11-2477-2014, 2014.
Dauwe, B. and Middelburg, J. J.: Amino acids and hexosamines as indicators of organic matter degradation state in North Sea sediments, Limnol. Oceanogr., 43, 782–798, 1998.
Davidson, E. A., de Carvalho, C. J. R., Figueira, A. M., Ishida, F. Y., Ometto, J. P. H. B., Nardoto, G. B., Saba, R. T., Hayashi, S. N., Leal, E. C., Vieira, I. C. G., and Martinelli, L. A.: Recuperation of nitrogen cycling in Amazonian forests following agricultural abandonment, Nature, 447, 995–998, 2007.
Davis, J., Kaiser, K., and Benner, R.: Amino acid and amino sugar yields and compositions as indicators of dissolved organic matter diagenesis, Org. Geochem., 40, 343–352, 2009.
Dittmar, T., Fitznar, H. P., and Kattner, G.: Origin and biogeochemical cycling of organic nitrogen in the eastern Arctic Ocean as evident from D- and L-amino acids, Geochim. Cosmochim. Ac., 65, 4103–4114, 2001a.
Dittmar, T., Lara, R. J., and Kattner, G.: River or mangrove? Tracing major organic matter sources in tropical Brazilian coastal waters, Mar. Chem., 73, 253–271, 2001b.
Fitznar, H. P., Lobbes, J. M., and Kattner, G.: Determination of enantiomeric amino acids with high-performance liquid chromatography and pre-column derivatisation with o-phthaldialdehyde and N-isobutyrylcysteine in seawater and fossil samples (mollusks), J. Chromatogr. A, 832, 123–132, 1999.
Gandois, L., Teisserenc, R., Cobb, A. R., Chieng, H. I., Lim, L. B. L., Kamariah, A. S., Hoyt, A., and Harvey, C. F.: Origin, composition, and transformation of dissolved organic matter in tropical peatlands, Geochim. Cosmochim. Ac., 137, 35–47, 2014.
Hedges, J. I. and Man, D. C.: The characterization of plant tissues by their lignin oxidation products, Geochim. Cosmochim. Ac., 43, 1803–1807, 1979.
Hedges, J. I., Cowie, G. L., Richey, J. E., Quay, P. D., Benner, R., Mike, S., and Forsberg, B. R.: Origins and processing of organic matter in the Amazon River as indicated by carbohydrates and amino acids, Limnol. Oceanogr., 39, 743–761, 1994.
Hernes, P. J., Robinson, A. C., and Aufdenkampe, A. K.: Fractionation of lignin during leaching and sorption and implications for organic matter “freshness”, Geophys. Res. Lett., 34, L17401, https://doi.org/10.1029/2007GL031017, 2007.
Hooijer, A., Vernimmen, R., Visser, M., and Mawdsley, N.: Flooding projections from elevation and subsidence models for oil palm plantations in the Rajang delta peatlands, Sarawak, Malaysia, Deltares report 1207384, 76 pp., 2015.
Huang, T. H., Chen, C. T. A., Tseng, H. C., Lou, J. Y., Wang, S. L., Yang, L., Kandasamy, S., Gao, X., Wang, J. T., Aldrian, E., Jacinto, G. S., Anshari, G. Z., Sompongchaiyakul, P., and Wang, B. J.: Riverine carbon fluxes to the South China Sea, J. Geophys. Res.-Biogeo., 122, 1239–1259, 2017.
Jennerjahn, T. C., Ittekkot, V., Klöpper, S., Adi, S., Purwo Nugroho, S., Sudiana, N., Yusmal, A., Prihartanto, and Gaye-Haake, B.: Biogeochemistry of a tropical river affected by human activities in its catchment: Brantas River estuary and coastal waters of Madura Strait, Java, Indonesia, Estuar. Coast. Shelf S., 60, 503–514, 2004.
Jiang, S., Müller, M., Jin, J., Wu, Y., Zhu, K., Zhang, G., Mujahid, A., Rixen, T., Muhamad, M. F., Sia, E. S. A., Jang, F. H. A., and Zhang, J.: Dissolved inorganic nitrogen in a tropical estuary in Malaysia: transport and transformation, Biogeosciences, 16, 2821–2836, https://doi.org/10.5194/bg-16-2821-2019, 2019.
Kaiser, K. and Benner, R.: Hydrolysis-induced racemization of amino acids, Limnol. Oceanogr.-Meth., 3, 318–325, 2005.
Kaiser, K. and Benner, R.: Biochemical composition and size distribution of organic matter at the Pacific and Atlantic time-series stations, Mar. Chem., 113, 63–77, 2009.
Kalbitz, K. and Geyer, S.: Different effects of peat degradation on dissolved organic carbon and nitrogen, Org. Geochem., 33, 319–326, 2002.
Kimber, R. W. L., Nannipieri, P., and Ceccanti, B.: The degree of racemization of amino acids released by hydrolysis of humic-protein complexes: Implications for age assessment, Soil Biol. Biochem., 22, 181–185, 1990.
Lamade, E., Setiyo, I. E., Girard, S., and Ghashghaie, J.: Changes in 13C ∕ 12C of oil palm leaves to understand carbon use during their passage from heterotrophy to autotrophy, Rapid Commun. Mass Sp., 23, 2586–2596, 2009.
Lamb, A. L., Wilson, G. P., and Leng, M. J.: A review of coastal palaeoclimate and relative sea-level reconstructions using δ13C and C ∕ N ratios in organic material, Earth-Sci. Rev., 75, 29–57, 2006.
Martin, P., Cherukuru, N., Tan, A. S. Y., Sanwlani, N., Mujahid, A., and Müller, M.: Distribution and cycling of terrigenous dissolved organic carbon in peatland-draining rivers and coastal waters of Sarawak, Borneo, Biogeosciences, 15, 6847–6865, https://doi.org/10.5194/bg-15-6847-2018, 2018.
Mayorga, E., Aufdenkampe, A. K., Masiello, C. A., Krusche, A. V., Hedges, J. I., Quay, P. D., Richey, J. E., and Brown, T. A.: Young organic matter as a source of carbon dioxide outgassing from Amazonian rivers, Nature, 436, 538–541, 2005.
Moore, S., Evans, C. D., Page, S. E., Garnett, M. H., Jones, T. G., Freeman, C., Hooijer, A., Wiltshire, A. J., Limin, S. H., and Gauci, V.: Deep instability of deforested tropical peatlands revealed by fluvial organic carbon fluxes, Nature, 493, 660–663, https://doi.org/10.1038/nature11818, 2013.
Müller, D., Warneke, T., Rixen, T., Müller, M., Jamahari, S., Denis, N., Mujahid, A., and Notholt, J.: Lateral carbon fluxes and CO2 outgassing from a tropical peat-draining river, Biogeosciences, 12, 5967–5979, https://doi.org/10.5194/bg-12-5967-2015, 2015.
Müller, D., Warneke, T., Rixen, T., Müller, M., Mujahid, A., Bange, H. W., and Notholt, J.: Fate of terrestrial organic carbon and associated CO2 and CO emissions from two Southeast Asian estuaries, Biogeosciences, 13, 691–705, https://doi.org/10.5194/bg-13-691-2016, 2016.
Müller-Dum, D., Warneke, T., Rixen, T., Müller, M., Baum, A., Christodoulou, A., Oakes, J., Eyre, B. D., and Notholt, J.: Impact of peatlands on carbon dioxide (CO2) emissions from the Rajang River and Estuary, Malaysia, Biogeosciences, 16, 17–32, https://doi.org/10.5194/bg-16-17-2019, 2019.
Raymond, P. A. and Bauer, J. E.: Use of 14C and 13C natural abundances for evaluating riverine, estuarine, and coastal DOC and POC sources and cycling: a review and synthesis, Org. Geochem., 32, 469–485, 2001.
Schleifer, K. H. and Kandler, O.: Peptidoglycan types of bacterial cell walls and their taxonomic implications, Bacteriol. Rev., 36, 407–477, 1972.
Schroeder, R. A. and Bada, J. L.: A review of the geochemical applications of the amino acid racemization reaction, Earth-Sci. Rev., 12, 347–391, 1976.
Sjögersten, S., Cheesman, A. W., Lopez, O., and Turner, B. L.: Biogeochemical processes along a nutrient gradient in a tropical ombrotrophic peatland, Biogeochem., 104, 147–163, 2011.
Vollmer, W., Blanot, D., and de Pedro, M.: Peptidoglycan structure and architecture, FEMS Microbiol. Rev., 32, 149–167, 2008.
Wu, Y., Zhu, K., Zhang, J., Müller, M., Jiang, S., Mujahid, A., Muhamad, M. F., and Sia, E. S. A.: Distribution and degradation of terrestrial organic matter in the sediments of peat-draining rivers, Sarawak, Malaysian Borneo, Biogeosciences, 16, 4517–4533, https://doi.org/10.5194/bg-16-4517-2019, 2019.
Zhang, C. L., Dang, H. Y., Azam, F., Benner, R., Legendre, L., Passow, U., Polimene, L., Robinson, C., Suttle, C. A., and Jiao, N. Z.: Evolving paradigms in biological carbon cycling in the ocean, Nat. Sci. Rev., 5, 481–499, 2018.
Zhu, Z. Y., Zhang, J., Wu, Y., and Lin, J.: Bulk particulate organic carbon in the East China Sea: Tidal influence and bottom transport, Prog. Oceanogr., 69, 37–60, 2006.
Zhu, Z. Y., Wu, Y., Zhang, J., Dittmar, T., Li, Y., Shao, L., and Ji, Q.: Can primary production contribute non-labile organic matter in the sea: Amino acid enantiomers along the coast south of the Changjiang Estuary in May, J. Mar. Syst., 129, 343–349, 2014.
Zhu, Z. Y., Oakes, J., and Müller, M.: Bulk organic carbon and amino acids compositions in the Rajang River/Estuary, Figshare, available at: https://doi.org/10.6084/m9.figshare.12061725.v1, last access: 13 April 2020.
- Abstract
- Introduction
- Materials and methods
- Results
- Discussion
- Summary and conclusion
- Appendix A: Measured amino acids and all abbreviations in this study.
- Data availability
- Author contributions
- Competing interests
- Special issue statement
- Acknowledgements
- Financial support
- Review statement
- References