the Creative Commons Attribution 4.0 License.
the Creative Commons Attribution 4.0 License.
 | 26 Mar 2020
Carbon–nitrogen interactions in European forests and semi-natural vegetation – Part 2: Untangling climatic, edaphic, management and nitrogen deposition effects on carbon sequestration potentials
Chris R. Flechard
Marcel van Oijen
David R. Cameron
Wim de Vries
Andreas Ibrom
Nina Buchmann
Nancy B. Dise
Ivan A. Janssens
Johan Neirynck
Leonardo Montagnani
Andrej Varlagin
Denis Loustau
Arnaud Legout
Klaudia Ziemblińska
Marc Aubinet
Mika Aurela
Bogdan H. Chojnicki
Julia Drewer
Werner Eugster
André-Jean Francez
Radosław Juszczak
Barbara Kitzler
Werner L. Kutsch
Annalea Lohila
Bernard Longdoz
Giorgio Matteucci
Virginie Moreaux
Albrecht Neftel
Janusz Olejnik
Maria J. Sanz
Jan Siemens
Timo Vesala
Caroline Vincke
Eiko Nemitz
Sophie Zechmeister-Boltenstern
Klaus Butterbach-Bahl
Ute M. Skiba
Mark A. Sutton
The effects of atmospheric nitrogen deposition (Ndep) on carbon (C) sequestration in forests have often been assessed by relating differences in productivity to spatial variations of Ndep across a large geographic domain. These correlations generally suffer from covariation of other confounding variables related to climate and other growth-limiting factors, as well as large uncertainties in total (dry + wet) reactive nitrogen (Nr) deposition. We propose a methodology for untangling the effects of Ndep from those of meteorological variables, soil water retention capacity and stand age, using a mechanistic forest growth model in combination with eddy covariance CO2 exchange fluxes from a Europe-wide network of 22 forest flux towers. Total Nr deposition rates were estimated from local measurements as far as possible. The forest data were compared with data from natural or semi-natural, non-woody vegetation sites.
The response of forest net ecosystem productivity to nitrogen deposition (dNEP ∕ dNdep) was estimated after accounting for the effects on gross primary productivity (GPP) of the co-correlates by means of a meta-modelling standardization procedure, which resulted in a reduction by a factor of about 2 of the uncorrected, apparent dGPP ∕ dNdep value. This model-enhanced analysis of the C and Ndep flux observations at the scale of the European network suggests a mean overall dNEP ∕ dNdep response of forest lifetime C sequestration to Ndep of the order of 40–50 g C per g N, which is slightly larger but not significantly different from the range of estimates published in the most recent reviews. Importantly, patterns of gross primary and net ecosystem productivity versus Ndep were non-linear, with no further growth responses at high Ndep levels (Ndep > 2.5–3 g N m−2 yr−1) but accompanied by increasingly large ecosystem N losses by leaching and gaseous emissions. The reduced increase in productivity per unit N deposited at high Ndep levels implies that the forecast increased Nr emissions and increased Ndep levels in large areas of Asia may not positively impact the continent's forest CO2 sink. The large level of unexplained variability in observed carbon sequestration efficiency (CSE) across sites further adds to the uncertainty in the dC∕dN response.
- Article
(7773 KB) - Companion paper
-
Supplement
(5016 KB) - BibTeX
- EndNote


Atmospheric reactive nitrogen (Nr) deposition (Ndep) has often been suggested to be a major driver of the large forest carbon (C) sink observed in the Northern Hemisphere (Reay et al., 2008; Ciais et al., 2013), but this view has been challenged, both in temperate (Nadelhoffer et al., 1999; Lovett et al., 2013) and in boreal regions (Gundale et al., 2014). In principle, there is a general consensus that N limitation significantly reduces net primary productivity (NPP) (LeBauer and Treseder, 2008; Zaehle and Dalmonech, 2011; Finzi et al., 2007). However, the measure of carbon sequestration is not the NPP, but the long-term net ecosystem carbon balance (NECB; Chapin et al., 2006) or the net biome productivity at a large spatial scale (NBP; Schulze et al., 2010), whereby heterotrophic respiration (Rhet) and all other C losses, including exported wood products and other disturbances over a forest lifetime, reduce the fraction of photosynthesized C (gross primary production, GPP) that is actually sequestered in the ecosystem. Indeed, it is possible to view this ratio of NECB to GPP as the efficiency of the long-term retention in the system of the assimilated C, in other words a carbon sequestration efficiency (CSE = NECB/GPP) (Flechard et al., 2020).
There is considerable debate as to the magnitude of the fertilization role that atmospheric Nr deposition may play on forest carbon balance, as illustrated by the controversy over the study by Magnani et al. (2007) and subsequent comments by Högberg (2007), De Schrijver et al. (2008), Sutton et al. (2008) and others. Estimates of the dC∕dN response (mass C stored in the ecosystem per mass atmospheric N deposited) vary across these studies over an order of magnitude, from 30–70 (de Vries et al., 2008; Sutton et al., 2008; Högberg, 2012) to 121 (in a model-based analysis by Dezi et al., 2010) to 200–725 g C per g N (Magnani et al., 2007, 2008). Recent reviews have suggested mean dC∕dN responses generally well below 100 g C per g N, ranging from 61–98 for above-ground biomass increment in US forests (Thomas et al., 2010) to 35–65 for above-ground biomass and soil organic matter (Erisman et al., 2011; Butterbach-Bahl and Gundersen, 2011), 16–33 for the whole ecosystem (Liu and Greaver, 2009), 5–75 (mid-range 20–40) for the whole ecosystem in European forests and heathlands (de Vries et al., 2009), and down to 13–14 for above-ground woody biomass in temperate and boreal forests (Schulte-Uebbing and de Vries, 2018) and 10–70 for the whole ecosystem for forests globally, increasing from tropical to temperate to boreal forests (de Vries et al., 2014a; Du and de Vries, 2018).
A better understanding of processes controlling the dC∕dN response is key to predicting the magnitude of the forest C sink under global change in response to changing patterns of reactive nitrogen (Nr) emissions and deposition (Fowler et al., 2015). The questions of the allocation and fate of both the assimilated carbon (Franklin et al., 2012) and deposited nitrogen (Nadelhoffer et al., 1999; Templer et al., 2012; Du and de Vries, 2018) appear to be crucial. It has been suggested that Nr deposition plays a significant role in promoting the carbon sink strength only if N is stored in woody tissues with high C∕N ratios (> 200–500) and long turnover times, as opposed to soil organic matter (SOM) with C∕N ratios that are an order of magnitude smaller (de Vries et al., 2008). Nadelhoffer et al. (1999) argued on the basis of a review of 15N tracer experiments that soil, rather than tree biomass, was the primary sink for the added nitrogen in temperate forests. However, based on a recent synthesis of 15N tracer field experiments (only including measurements of 15N recovery after >1 year of 15N addition), Du and de Vries (2018) estimated that tree biomass was the primary sink for the added nitrogen in both boreal and temperate forests (about 70 %), with the remaining 30 % retained in soil. At sites with elevated N inputs, increasingly large fractions are lost as nitrate () leaching. Lovett et al. (2013) found in north-eastern US forests that added N increased C and N stocks and the C∕N ratio in the forest floor but did not increase woody biomass or above-ground NPP.
In fact, Aber et al. (1989) even predicted 30 years ago that the last stage of nitrogen saturation in forests, following long-term exposure to excess Nr deposition, would be characterized by reduced NPP or possibly tree death, even if during the early or intermediate stages the addition of N could boost productivity with no visible negative ecosystem impact beyond leaching. In that initial theory, Aber et al. (1989) suggested that plant uptake was the main N sink and led to increased photosynthesis and tree growth, while N was recycled through litter and humus to the available pool; this fertilization mechanism would saturate quickly, resulting in nitrate mobility. However, observations of large rates of soil nitrogen retention gradually led to the hypothesis that pools of dissolved organic carbon in soils allowed free-living microbial communities to compete with plants for N uptake. A revision of that theory by Aber et al. (1998) hypothesized the important role of mycorrhizal assimilation and root exudation as a process of N immobilization and suggested that the process of nitrogen saturation involved soil microbial communities becoming bacterial-dominated rather than fungal or mycorrhizal-dominated in pristine soils.
Atmospheric Nr deposition is rarely the dominant source of N supply for forests and semi-natural vegetation. Ecosystem internal turnover (e.g. leaf fall and subsequent decomposition of leaf litter) and mineralization of SOM provide annually larger amounts of mineral N than Ndep (although, ultimately, over pedogenic timescales much of the N contained in SOM is of atmospheric origin). In addition, resorption mechanisms help conserve within the tree the externally acquired N (and other nutrients), whereby N is re-translocated from senescing leaves to other growing parts of the tree, prior to leaf shedding, with resorption efficiencies of potentially up to 70 % and larger at N-poor sites than at N-saturated sites (Vergutz et al., 2012; Wang et al., 2013). Biological N2 fixation can also be significant in forests (Vitousek et al., 2002). Högberg (2012) showed for 11 European forest sites that Nr deposition was a relatively small fraction (13 %–14 % on average) of the total N supply, which was dominated by SOM mineralization (up to 15–20 g N m−2 yr−1). He further argued that there may be a correlation between soil fertility (of which the natural N supply by mineralization is an indicator) and Nr deposition, since historically human populations have tended to develop settlements in areas of favourable edaphic conditions, in which over time agriculture, industry and population intensified, leading to increased emissions and deposition. Thus, an apparent effect of ambient Ndep on current net ecosystem productivity (NEP) levels could also be related to the legacy of more than a century of Nr deposition on a modified internal ecosystem cycle. Importantly, unlike other ecosystem mechanisms for acquiring N from the environment (resorption from senescing leaves, biological N2 fixation, mobilization, and uptake of N from soil solution or from SOM), the nitrogen supplied from atmospheric deposition comes at little or zero energetic cost (Shi et al., 2016), especially if absorbed directly at the leaf level (Nair et al., 2016).
Some previous estimates of forest dC∕dN response obtained by meta-analyses of NEP or NECB across a geographic gradient did not account for the major drivers of plant growth apart from nitrogen (e.g. Magnani et al., 2007). These include climate (precipitation, temperature, photosynthetically active radiation), soil physical and chemical properties (e.g. soil drainage, depth, water holding capacity, nutrients and pH), site history and land use. Using univariate statistics such as simple regressions of NECB as a function of Nr deposition is flawed if Nr deposition is co-correlated with any of these other drivers (Fleischer et al., 2013), as can be the case in spatial gradient survey analyses across a wide geographic domain. This is because all of the variability in ecosystem C sequestration across the physical space is only allowed to be explained by one factor, Nr deposition. For example, Sutton et al. (2008) showed (using forest ecosystem modelling) that the apparently large dC∕dN slope in the dataset of Magnani et al. (2007) was reduced by a factor of 2–3 when accounting for climatic differences between sites, i.e. when co-varying limitations in (photosynthetic) energy and water were factored out.
Similarly, ignoring the growth stage (forest age) and the effects of management (thinning) in the analysis introduces additional uncertainty in the estimated dC∕dN response. Contrasting C-cycling patterns and different N use efficiencies are expected between young and mature forests. Nutrient demand is highest in the early stages of forest development (especially pole stage); a recently planted forest becomes a net C sink only after a few decades, while at maturity NPP and NEP may or may not decrease, depending on a shift in the balance between autotrophic and heterotrophic respiration (Raut and Rhet, respectively) and GPP (Odum, 1969; Besnard et al., 2018). Thinning can initially increase ecosystem respiration by increasing litter and SOM stocks and reducing NPP in the short term, and some biomass can be exported (tree trunks), but the ultimate effect after a year or two is to boost forest growth as thinning indirectly increases nutrient availability at the tree level by reducing plant–plant competition. Thus, the frequency and intensity of thinning will also affect long-term or lifetime NECB. Severe storms, fire outbreaks and insect infestations may have a similar effect.
Altogether, these complex interactions mean that it is far from a simple task to untangle the Nr deposition effect on ecosystem C sequestration from the impacts of climatic, edaphic and management factors, when analysing data from diverse monitoring sites situated over a large geographic area (Laubhann et al., 2009; Solberg et al., 2009; Thomas et al., 2010). This is in contrast to fertilization experiments, where the N effect can be quantified with all other variables being equal between manipulation plots (Nohrstedt, 2001; Saarsalmi and Mälkönen, 2001), although their results are only valid for the conditions at the specific location where the experiment has been performed (Schulte-Uebbing and de Vries, 2018).
There are also potentially large uncertainties in the C and N flux measurements or model estimates used to calculate a dC∕dN response. In the companion paper (Flechard et al., 2020), we presented – and discussed uncertainties in – plausible estimates of C and N budgets of 40 forests and natural or semi-natural ecosystems covering the main climatic zones of Europe (from Mediterranean to temperate to boreal, from oceanic to continental), investigated as part of the CarboEurope Integrated Project (CEIP, 2004–2008) and the parallel NitroEurope Integrated Project (NEU, 2006–2011). The NEP budgets were based on multi-annual eddy covariance (EC) datasets following well-established protocols, and in order to better constrain the N budgets, specific local measurements of dry and wet Nr deposition were made. Nitrogen losses by leaching and gaseous emissions were estimated by a combination of measurements and modelling. The data showed that observation-based GPP and NEP peaked at sites with Ndep of the order of 2–2.5 g N m−2 yr−1 but decreased above that and that increasingly large Nr losses occurred at larger Ndep levels, implying that the net dC∕dN response was likely non-linear, in line with an overview of dC∕dN response results from various approaches (De Vries et al., 2014a), possibly due to the onset of N saturation as predicted by Aber et al. (1989), and associated with enhanced acidification and increased sensitivity to drought, frost and diseases (De Vries et al., 2014b). The data also showed that, at the scale of the CEIP–NEU flux tower networks, nitrogen deposition was not independent of climate but peaked in the mid-range for both mean annual temperature and precipitation, which geographically corresponds to mid-latitude central and western Europe, where climate is most conducive to forest productivity and growth.
In the present paper, we further the analysis of the same CEIP–NEU observational datasets through forest ecosystem modelling, with the objective of isolating the Nr deposition impact on forest productivity and C sequestration potential from the parallel effects of climate, soil water retention, and forest age and management. A mechanistic modelling framework, driven by environmental forcings, inputs, growth limitations, internal cycling and losses, was required to untangle the relationships in measurement data, because the observed dependence of Nr deposition on climate, combined with the large diversity but limited number of flux observation sites, restricted the applicability and validity of multivariate statistical methods. We describe a methodology to derive, through meta-modelling, standardization factors for observation-based forest productivity metrics, in order to factor out the part of the variance that was caused by influences other than Nr deposition (climate, soil, stand age). This original meta-modelling approach involves running multiple simulations of a forest ecosystem model for each site of the flux tower network, using alternative climate input and soil parameter data taken from all other sites of the network, in addition to each site's own data. The model results are then analysed to determine whether conditions at each site are likely to be more, or less, favourable to forest growth and C sequestration, compared with other sites, from climatic, edaphic and age perspectives, but regardless of atmospheric N inputs. This allows the calculation of internal standardization factors that are subsequently applied to observational flux data within the same collection of sites, aiming to account for a natural variability that may otherwise bias the analysis of a dC∕dN response. Further, we examine patterns of C and N use efficiencies both at the decadal timescale of flux towers and over the lifetime of forests.
2.1 Carbon and nitrogen datasets from flux tower sites
Ecosystem-scale carbon fluxes and atmospheric nitrogen deposition data were estimated within the CEIP and NEU networks at 31 European forests (6 deciduous broadleaf forests, DBF; 18 coniferous evergreen needleleaf forests, ENF, of which 7 were spruce-dominated and 11 were pine-dominated; 2 mixed needleleaf–broadleaf forests, MF; 5 Mediterranean evergreen broadleaf forests, EBF) and nine short natural or semi-natural (SN) vegetation sites (wetlands, peatlands, unimproved and upland grasslands) (Table S1 in the Supplement). In the following we often adopted the terminology “observation-based” rather than simply “measured” to reflect the fact many variables such as GPP or below-ground C pools rely on various assumptions or even empirical models for their estimation on the basis of measured data (e.g. flux partitioning procedure to derive GPP from NEE; allometric relations for tree and root C stocks; spatial representativeness of soil core sampling for SOM). For convenience in this paper, we use the following sign convention for CO2 fluxes: GPP and Reco are both positive, while NEP is positive for a net sink (a C gain from an ecosystem perspective) and negative for a net source.
The general characteristics of the observation sites (coordinates, dominant vegetation, forest stand age and height, temperature and precipitation, Ndep, inter-annual mean C fluxes) are provided in Table S1 of the Supplement. The sites, measurement methods and data sources were described in more detail in the companion paper (Flechard et al., 2020); for additional information on vegetation, soils, C and N flux results and budgets, and their variability and uncertainties across the network, the reader is referred to that paper and the accompanying supplement. Briefly, the C datasets include multi-annual (on average, 5-year) mean estimates of NEP, GPP and Reco (total ecosystem respiration) based on 10–20 Hz EC measurements, post-processing, spectral and other corrections, flux partitioning, and empirical gap-filling (e.g. Lee et al., 2004; Aubinet et al., 2000; Falge et al., 2001; Reichstein et al., 2005; Lasslop et al., 2010). The fully analysed, validated, gap-filled and partitioned inter-annual mean CO2 fluxes (NEP, GPP, Reco), as well as the meteorological data used as ecosystem model inputs (Sect. 2.2), were retrieved from the European Fluxes Database Cluster (2012) and the NEU (2013) database. Dry deposition of reactive nitrogen was estimated by measuring at each site ambient concentrations of the dominant gas-phase (NH3, HNO3, NO2) and aerosol-phase (, ) Nr concentrations (data available from the NitroEurope database; NEU, 2013), and applying four different inferential models to the concentration and micro-meteorological data, as described in Flechard et al. (2011). Wet deposition was measured using bulk precipitation samplers (NEU, 2013), with additional data retrieved from national monitoring networks and from the EMEP chemical transport model (CTM; Simpson et al., 2012).
2.2 Modelling of forest carbon and nitrogen fluxes and pools
2.2.1 General description of the BASFOR ecosystem model
The BASic FORest (BASFOR) model is a process-based, deterministic forest ecosystem model, which simulates the growth and biogeochemistry (C, N and water cycles) of temperate deciduous and coniferous stands at a daily time step (van Oijen et al., 2005; Cameron et al., 2013, 2018). Model code and documentation are available on GitHub (BASFOR, 2016). Interactions with the atmospheric and soil environments are simulated in some detail, including the role of management (thinning or pruning). BASFOR is a one-dimensional model, i.e. no horizontal heterogeneity of the forest is captured, and BASFOR does not simulate some variables which are important in forest production, such as wood quality or pests and diseases.
Nine state variables for the trees describe (i) C pools – leaves, branches and stems; roots; and reserves (CL, CB and CS or collectively CLBS; CR; CRES; kg C m−2); (ii) N pool in leaves (NL; kg N m−2); and (iii) stand density (SD, trees m−2), tree phenology (only for deciduous trees), accumulated chill days (d) and accumulated thermal time (Tsum; ∘C d). Seven state variables for the soil can be divided into three categories, according to the three biogeochemical cycles being simulated: (i) C pools in litter layers of the forest floor (CLITT), soil organic matter (SOM) with fast turnover (CSOMF) and SOM with slow turnover (CSOMS) (kg C m−2); (ii) N pools as for C but also including mineral N (NLITT, NSOMF, NSOMS, NMIN; kg N m−2); and (iii) the water pool: amount of water to the depth of soil explored by the roots (WA; kg H2O m−2 = mm) (see Table 1).
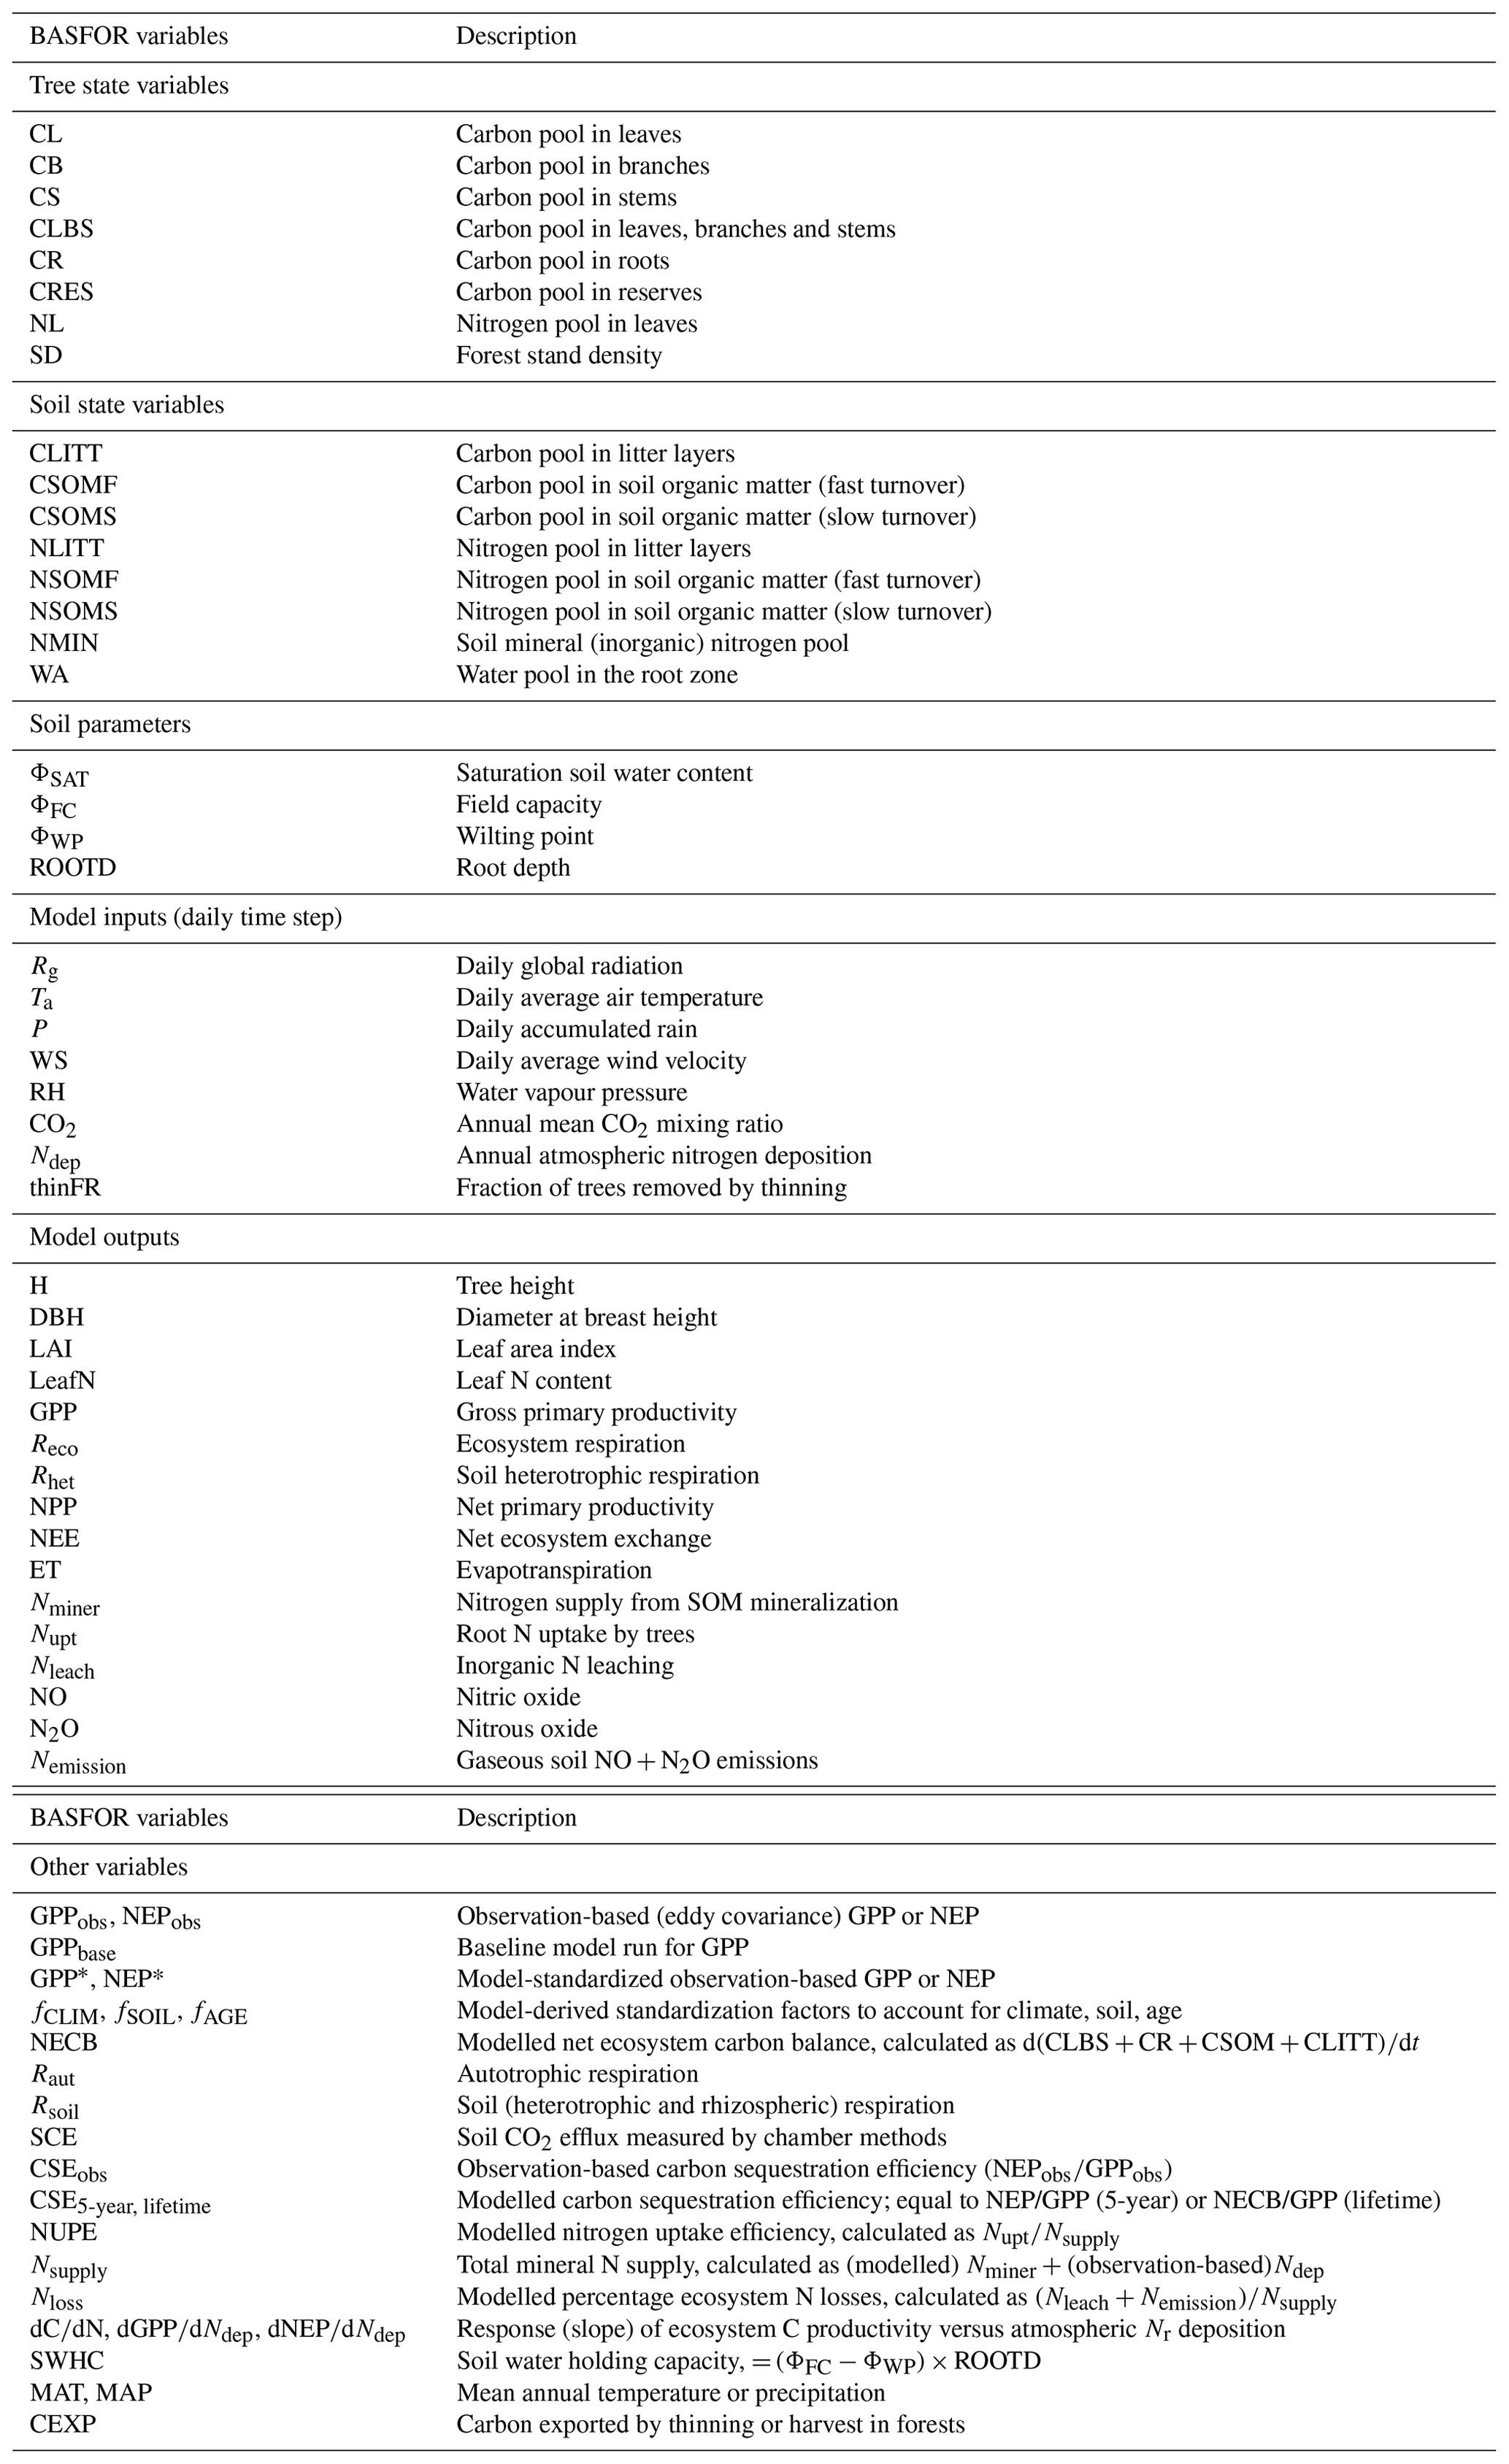
Table 1BASFOR model state variables, inputs and outputs, and other acronyms used in the study.
Carbon enters the system via photosynthesis, calculated as the product of photosynthetically active radiation (PAR) absorption by the plant canopy and light use efficiency (LUE). The leaf and branch pools are subject to senescence, causing carbon flows to litter. Roots are also subject to senescence, causing a flow to fast-decomposing soil organic matter. Litter carbon decomposes to fast-decomposing soil organic matter plus respiration. Fast-decomposing soil organic matter decomposes to slow-decomposing soil organic matter plus respiration. Finally, the slow organic carbon pool decomposes very slowly to CO2. Nitrogen enters the system in mineral form through atmospheric deposition. Nitrogen leaves the system through leaching and through emission of N2O and NO from the soil to the atmosphere. N2 losses from denitrification and biological N2 fixation are not simulated. Dissolved inorganic nitrogen (DIN) is taken up by the trees from the soil, and nitrogen returns to the soil with senescence of leaves, branches and roots, and also when trees are pruned or thinned. Part of the N from senescing leaves is reused for growth. The availability of mineral nitrogen is a Michaelis–Menten function of the mineral nitrogen pool and is proportional to root biomass. The model does not include a dissolved organic nitrogen (DON) pool and therefore does not account for the possible uptake of bioavailable DON forms (e.g. amino acids, peptides) by trees. Transformations between the four soil nitrogen pools are similar to those of the carbon pools, with mineral nitrogen as the loss term. Water is added to the soil by precipitation and lost through transpiration, evaporation and drainage. Evaporation and transpiration are calculated using the Penman equation, as functions of the radiation intercepted by the soil and vegetation layer, and atmospheric temperature, humidity and wind speed. Drainage of ground water results from water infiltration exceeding field capacity of the soil.
In BASFOR, the C and N cycles are coupled in both trees and soil. The model assumes that new growth of any organ proceeds with a prescribed N∕C ratio, which is species-specific but generally higher for leaves and roots than for stems and branches. If the nitrogen demand for growth cannot be met by supply from the soil, some of the foliar nitrogen is recycled until leaves approach a minimum N∕C ratio when leaf senescence will be accelerated. The calculation of foliar senescence accounts for a vertical profile of nitrogen content, such that the lowest leaves have the lowest N∕C ratio and senesce first. Nitrogen deficiency, as measured by foliar nitrogen content, not only increases leaf senescence, but also decreases GPP and shifts allocation from leaves to roots. Given that foliar N content is variable in BASFOR, the litter that is produced from leaf fall also has a variable N∕C ratio. When the litter decomposes and is transformed, the N∕C ratio of the new soil organic matter will therefore vary too in response to the ratio in the litter. Except for woody plant parts, the C and N couplings in BASFOR vegetation and soil are based on the same generic ecophysiological assumptions as those explained in detail for the grassland model BASGRA (Höglind et al., 2020).
The major inputs to the model are daily time series of weather variables (global radiation, air temperature, precipitation, wind speed and relative humidity). The last two of these are used in the calculation of potential rates of evaporation and transpiration. Soil properties, such as parameters of water retention (field capacity, wilting point, soil depth), are provided as constants. Further, the model requires time series indicating at which days the stand was thinned or pruned. The model outputs include, amongst others, the state variable for trees and soil as well as evapotranspiration (ET), groundwater recharge, canopy height (H), leaf area index (LAI), diameter at breast height (DBH), GPP, Reco and Rsoil, NEP, N mineralization, N leaching, and NO and N2O emissions (Table 1).
2.2.2 Model implementation and calibration
BASFOR simulations of forest growth and C, N and H2O fluxes were made for all CEIP–NEU forest sites from planting (spanning the interval 1860–2002) until the end of the NEU project (2011). At a few sites, natural regeneration occurred, but for modelling purposes a planting date was assigned based on the age of the trees. Meteorological data measured at each site over several years since the establishment of the flux towers (typically 5–10 years) were replicated backwards in time in order to generate a time series of model inputs for the whole period since planting. Assumptions were made that inter-annual meteorological variability was sufficiently covered in the span of available measurements and that the impact of climate change since planting was small and could be neglected.
The atmospheric CO2 mixing ratio was provided as an exponential function of calendar year, fitted to Mauna Loa data since the beginning of records in 1958 (NOAA, 2014) and extrapolated backwards to around 1860–1900 for the oldest forests included in this study. The global CO2 mixing ratio driving the model thus increased from around 290 ppm in 1900 to 315 ppm in 1958 to 390 ppm in 2010 (Fig. 1). Similarly, atmospheric Nr deposition was a key input to the model and was forced to vary over the lifetimes of the planted forests; Ndep was assumed to rise from pan-European levels well below 0.5 g N m−2 yr−1 at the turn of the 20th century, sharply increasing after World War II to reach an all-time peak around 1980, and decreasing subsequently from peak values by about one-third until 2005–2010, at which point the NEU Ndep estimates were obtained. We assumed that all sites of the European network followed the same relative time course of Ndep over the course of the 20th century, taken from van Oijen et al. (2008) but scaled for each site using the NEU Ndep estimates (Fig. S1 in the Supplement).
Forest management was included as an input to the model in the form of a prescribed time course of stand density and thinning from planting to the present date. Tree density was known at all sites around the time of the CEIP–NEU projects (Table S2 in Flechard et al., 2020), but information on thinning history since planting (dates and fractions removed) was much sparser. A record of the last thinning event was available at only one-third of all sites, and knowledge of the initial (planting) density and a reasonably complete record of all thinning events were available at only a few sites. For the purposes of BASFOR modelling, we attempted to recreate a plausible density and thinning history over the lifetime of the stands. The guiding principle was that after the age of 20 years one could expect a decadal thinning of the order of 20 %, following Cameron et al. (2013), while the initial reduction was 40 % during the first 20 years. In the absence of an actual record of planting density (observed range: 1400–15 000 trees ha−1), a default initial value of 4500 trees ha−1 was assumed (for around two-thirds of the sites). The general principles of this default scheme were then applied to fit the available density and thinning data for each site, preserving all actual data in the time series while filling in the gaps by plausible interpolation. The density time courses thus obtained, underlying all subsequent model runs, are shown in Fig. S2.
The model was calibrated through a multiple site Bayesian calibration (BC) procedure, applied to three groups of plant functional types (PFTs), based on flux and pool data from the CEIP–NEU databases (see Cameron et al., 2018). A total of 22 sites were calibrated, including deciduous broadleaf forests (DB1–6) and evergreen needleleaf forest ENF-spruce (EN1–7) and ENF-pine (EN8–18). The model parameters were calibrated generically within each PFT group; i.e. they were not optimized or adjusted individually for each observation site. In the companion paper (Flechard et al., 2020), baseline BASFOR runs were produced for all 31 forest sites of the network, including also those stands for which the model was not calibrated, such as Mediterranean evergreen broadleaf (EB1 through EB5) and mixed deciduous–coniferous (MF1, MF2), to test the predictive capacity of the model beyond its calibration range (see Fig. 6 in Flechard et al., 2020). However, for the analyses and scenarios presented hereafter, these seven uncalibrated sites were removed from the dataset, as were two additional sites: EN9 and EN12 – EN9 because this agrosilvopastoral ecosystem called “dehesa” has a very low tree density (70 trees ha−1; Tables S1–S2 in the Supplement to Flechard et al., 2020) and is otherwise essentially dry grassland for much of the surface area, which BASFOR cannot simulate; EN12 because this was a very young plantation at the time of the measurements, also with a very large fraction of measured NEP from non-woody biomass. All the conclusions from BASFOR meta-modelling are drawn from the remaining 22 deciduous, pine and spruce stands (sites highlighted in Table S1).
2.2.3 Modelling time frames
In the companion paper (Flechard et al., 2020), C and N budgets were estimated primarily on the basis of ecosystem measurements and for the time horizon of the CEIP and NEU projects (2004–2010). In this paper, BASFOR simulations of the C and N budgets for the 22 forest sites were considered both (i) over the most recent 5-year period (around the time of CEIP–NEU), which did not include any thinning event and started at least 3 years after the last thinning event (referred to hereafter as “5-year”); and (ii) over the whole time span since forest establishment, referred to here as “lifetime”, which ranged from 30 to 190 years across the network and reflected the age of the stand at the time of the CEIP–NEU projects. Note that the term “lifetime” in this context was not used to represent the expected age of senescence or harvest.
On the one hand, the short-term (5-year) simulations were made to evaluate cases where no disturbance by management impacted fluxes and pools over a recent period, regardless the age of the stands at the time of the C and N flux measurements (ca. 2000–2010). On the other hand, the lifetime simulations represent the time-integrated flux and pool history since planting, which reflects the long-term C sequestration (NECB) potential, controlled by the cumulative impact of management (thinning), increasing atmospheric CO2 mixing ratio, and changing Nr deposition over the last few decades. Thinning modifies the canopy structure and therefore light, water and nutrient availability for the trees, and reduces the LAI momentarily, and in theory the leftover additional organic residues (branches and leaves) could increase heterotrophic respiration and affect the NEP. However, the impact of the disturbance on NEP and Reco is expected to be small and short-lived (Granier et al., 2008), and a 3-year wait after the last thinning event appears to be reasonable for the modelling. The 5-year data should in theory reflect the C∕N flux observations, although there were a few recorded thinning events during the CEIP–NEU measurement period, and the thinning sequences used as inputs to the model were reconstructed and thus not necessarily accurate (Fig. S2).
2.2.4 Modelled carbon sequestration efficiency (CSE) and nitrogen uptake efficiency (NUPE)
For both C and N, we define modelled indicators of ecosystem retention efficiency relative to a potential input level, which corresponds to the total C or N supply, calculated over both 5-year (no thinning) and lifetime horizons to contrast short-term and long-term patterns. For C sequestration, the relevant terms are the temporal changes in carbon stocks in leaves, branches and stems (CLBS); roots (CR); soil organic matter (CSOM); litter layers (CLITT); and the C export of woody biomass (CEXP), relative to the available incoming C from gross photosynthesis (GPP). We thus define the carbon sequestration efficiency (CSE) as the ratio of either modelled 5-year NEP or modelled lifetime NECB to modelled GPP in a given environment, constrained by climate, nitrogen availability and other factors included in the BASFOR model:
with
The modelled CSE5-year can be contrasted with observation-based CSEobs () derived from flux tower data over a similar, relatively short time period compared with a forest rotation (see Flechard et al., 2020). By extension, the CSElifetime indicator quantifies the efficiency of C sequestration processes by a managed forest system, reflecting not only biological and ecophysiological mechanisms, but also the long-term impact of human management through thinning frequency and severity.
For the N budget we define, by analogy to CSE, the N uptake efficiency (NUPE) as the ratio of N immobilized in the forest system to the available mineral N, i.e. the ratio of tree N uptake (Nupt) to the total Nsupply from internal SOM mineralization and N-cycling processes (Nminer) and from external sources such as atmospheric N deposition (Ndep):
with
The fraction of Nsupply not taken up in biomass and lost to the environment (Nloss) comprises dissolved inorganic N leaching (Nleach) and gaseous NO and N2O emissions (Nemission):
Note that (i) NUPE is a different concept from the nitrogen use efficiency (NUE), often defined as the amount of biomass produced per unit of N taken up from the soil, or the ratio NPP∕Nupt (e.g. Finzi et al., 2007), and (ii) biological N2 fixation, as well as N loss by total denitrification, are not accounted for in the current BASFOR version; also, leaching of dissolved organic N and C (DON, DOC) and dissolved inorganic C (DIC) is not included either, all of which potentially impact budget calculations.
2.2.5 Meta-modelling as a tool to standardize EC-based productivity data
One purpose of BASFOR modelling in this study was to gain knowledge on patterns of C and N fluxes, pools and internal cycling that were not, or could not be, evaluated solely on the basis of the available measurements (for example, SOM mineralization and soil N transfer; retranslocation processes at the canopy level; patterns over the lifetime of a stand). The model results were used to complement the flux tower observations to better constrain elemental budgets and assess the potential and limitations of C sequestration at the European forest sites considered here. Additionally, we used meta-modelling as an alternative to multivariate statistics (e.g. stepwise multiple regression, mixed non-linear models, residual analysis) to isolate the importance of Nr deposition from other drivers of productivity. This follows from the observations by Flechard et al. (2020) that (i) Nr deposition and climate were not independent in the dataset and that (ii) due to the large diversity of sites the limited size of the dataset and incomplete information on other important drivers (e.g. stand age, soil type, management), regression analyses were unable to untangle these climatic and other inter-relationships from the influence of Nr deposition.
BASFOR (or any other mechanistic model) is useful in this context, not so much to predict absolute fluxes and stocks but to investigate the relative importance of drivers, which is done by assessing changes in simulated quantities when model inputs are modified. Meta-modelling involves building and using surrogate models that can approximate results from more complicated simulation models; in this case we derived simplified relationships linking forest productivity to the impact of major drivers, which were then used to harmonize observations from different sites. For example, running BASFOR for a given site using meteorological input data from another site, or indeed from all other sites of the network, provides insight into the impact of climate on GPP or NEP, all other factors (soil, vegetation structure and age, Nr deposition) being equal. Within the boundaries of the network of 22 selected sites, this sensitivity analysis provides relative information as to which of the 22 meteorological datasets is most, or least, favourable to growth for this particular site. This can be repeated for all sites (22×22 climate scenario simulations). It can also be done for soil physical properties that affect the soil water holding capacity (texture, porosity, rooting depth), in which case the result is a relative ranking within the network of the different soils for their capacity to sustain an adequate water supply for tree growth. The procedure for the normalization of data between sites is described hereafter.
Additional nitrogen affects C uptake primarily through releasing N limitations at the leaf level for photosynthesis (Wortman et al., 2012; Fleischer et al., 2013), which scales up to GPP at the ecosystem level. Other major factors affecting carbon uptake are related to climate (photosynthetically active radiation, temperature, precipitation), soil (for example water holding capacity) or growth stage (tree age). In the following section, we postulate that observation-based gross primary productivity (GPPobs), which represents an actuation of all limitations in the real world, can be transformed through meta-modelling into a standardized potential value (GPP*) for a given set of environmental conditions (climate, soil, age) common to all sites, thereby enabling comparisons between sites. We define GPP* as GPPobs being modulated by one or several dimensionless factors (fX):
where the standardization factors fCLIM, fSOIL and fAGE are derived from BASFOR model simulations corresponding to the CEIP–NEU time interval around 2005–2010, as described below. The factors involved in Eq. (10) address commonly considered drivers but not nitrogen, which is later assessed on the basis of GPP* rather than GPPobs. Other potentially important limitations such as non-N nutrients, soil fertility, air pollution (O3), poor ecosystem health and soil acidification are not treated in BASFOR and cannot be quantified here. Further, the broad patterns of the GPP vs. Ndep relationships reported in Flechard et al. (2020), i.e. a non-linear increase and eventual saturation of GPP as Ndep increases beyond a critical threshold, did not show any marked difference between the three forest PFTs (deciduous, pine, spruce), possibly because the datasets were not large enough and fairly heterogeneous. Thus, although PFT may be expected to influence C–N interactions, we did not seek to standardize GPP with an additional fPFT factor.
To determine the fCLIM and fSOIL factors, the model was run multiple times with all climate and soil scenarios for the n (=22) sites, a scenario being defined as using model input data or parameters from another site. Specifically, for fCLIM, the model weather inputs at each site were substituted in turn by the climate data (daily air temperature, global radiation, rainfall, wind speed and relative humidity) from all other sites; and for fSOIL, the field capacity and wilting point parameters (ΦFC, ΦWP) and soil depth that determine the soil water holding capacity at each site (SWHC = (ΦFC−ΦWP) × soil depth) were substituted in turn by parameters from all other sites. Values of fCLIM and fSOIL were calculated for each site in several steps, starting with the calculation of the ratios of modelled GPP from the scenarios to the baseline value GPPbase such that
where i(1…n) denotes the site being modelled and j(1…n) denotes the climate dataset (jCLIM) or soil parameter set (jSOIL) used in the scenario being simulated (see Table S2 for the calculation matrices). The value of the X(i,j) ratio indicates whether the jth scenario is more (>1) or less (<1) favourable to GPP for the ith forest site.
For each site, the aim of the fCLIM factor (and similar reasoning for fSOIL) (Eq. 10) is to quantify the extent to which GPP differs from a standard GPP* value that would occur if all sites were placed under the same climatic conditions. Rather than choose the climate of one particular site to normalize to, which could bias the analysis, we normalize GPP to the equivalent of a mean climate, by averaging BASFOR results over all (22) climate scenarios (Eqs. 14–15). However, since each of the scenarios has a different mean impact across all sites (, Eq. 12), we first normalize X(i,j) to the value within each jth scenario (Eq. 13):
The normalization of X(i,j) to Xnorm(i,j) ensures that the relative impacts of each scenario on all n sites can be compared between scenarios. The final step is the averaging for each site of Xnorm(i,j) values from all scenarios (either jCLIM or jSOIL) into the overall fCLIM or fSOIL values:
or
The factors fAGE were determined by first normalizing modelled GPP (base run) to the value predicted at age 80 for every year of the simulated GPP time series at those m (=12) mature sites where stand age exceeded 80. The age of 80 was chosen since this was the mean stand age of the whole network. The following ratios were thus calculated:
where k(1…m) denotes the mature forest site being modelled. A mean temporal curve for fAGE (normalized to 80 years) was calculated to be used subsequently for all sites using the following:
3.1 Short-term (5-year) versus lifetime C and N budgets from ecosystem modelling
The time course of modelled (baseline) GPP, NEP, and total leaching and gaseous N losses is shown in Fig. 1 for all forest sites over the 20th century and until 2010, forced by climate, increasing atmospheric CO2 and by the assumed time course of Nr deposition over this period (Fig. 1a). For each stand, regardless of its age and establishment date, an initial phase of around 20–25 years occurs, during which GPP increases sharply from zero to a potential value attained upon canopy closure (Fig. 1b), while NEP switches from a net C source to a net C sink after about 10 years (Fig. 1d). Initially Nr losses are very large (typically of the order of 10 g N m−2 yr−1) and then decrease rapidly to pseudo-steady-state levels when GPP and tree N uptake reach their potential.
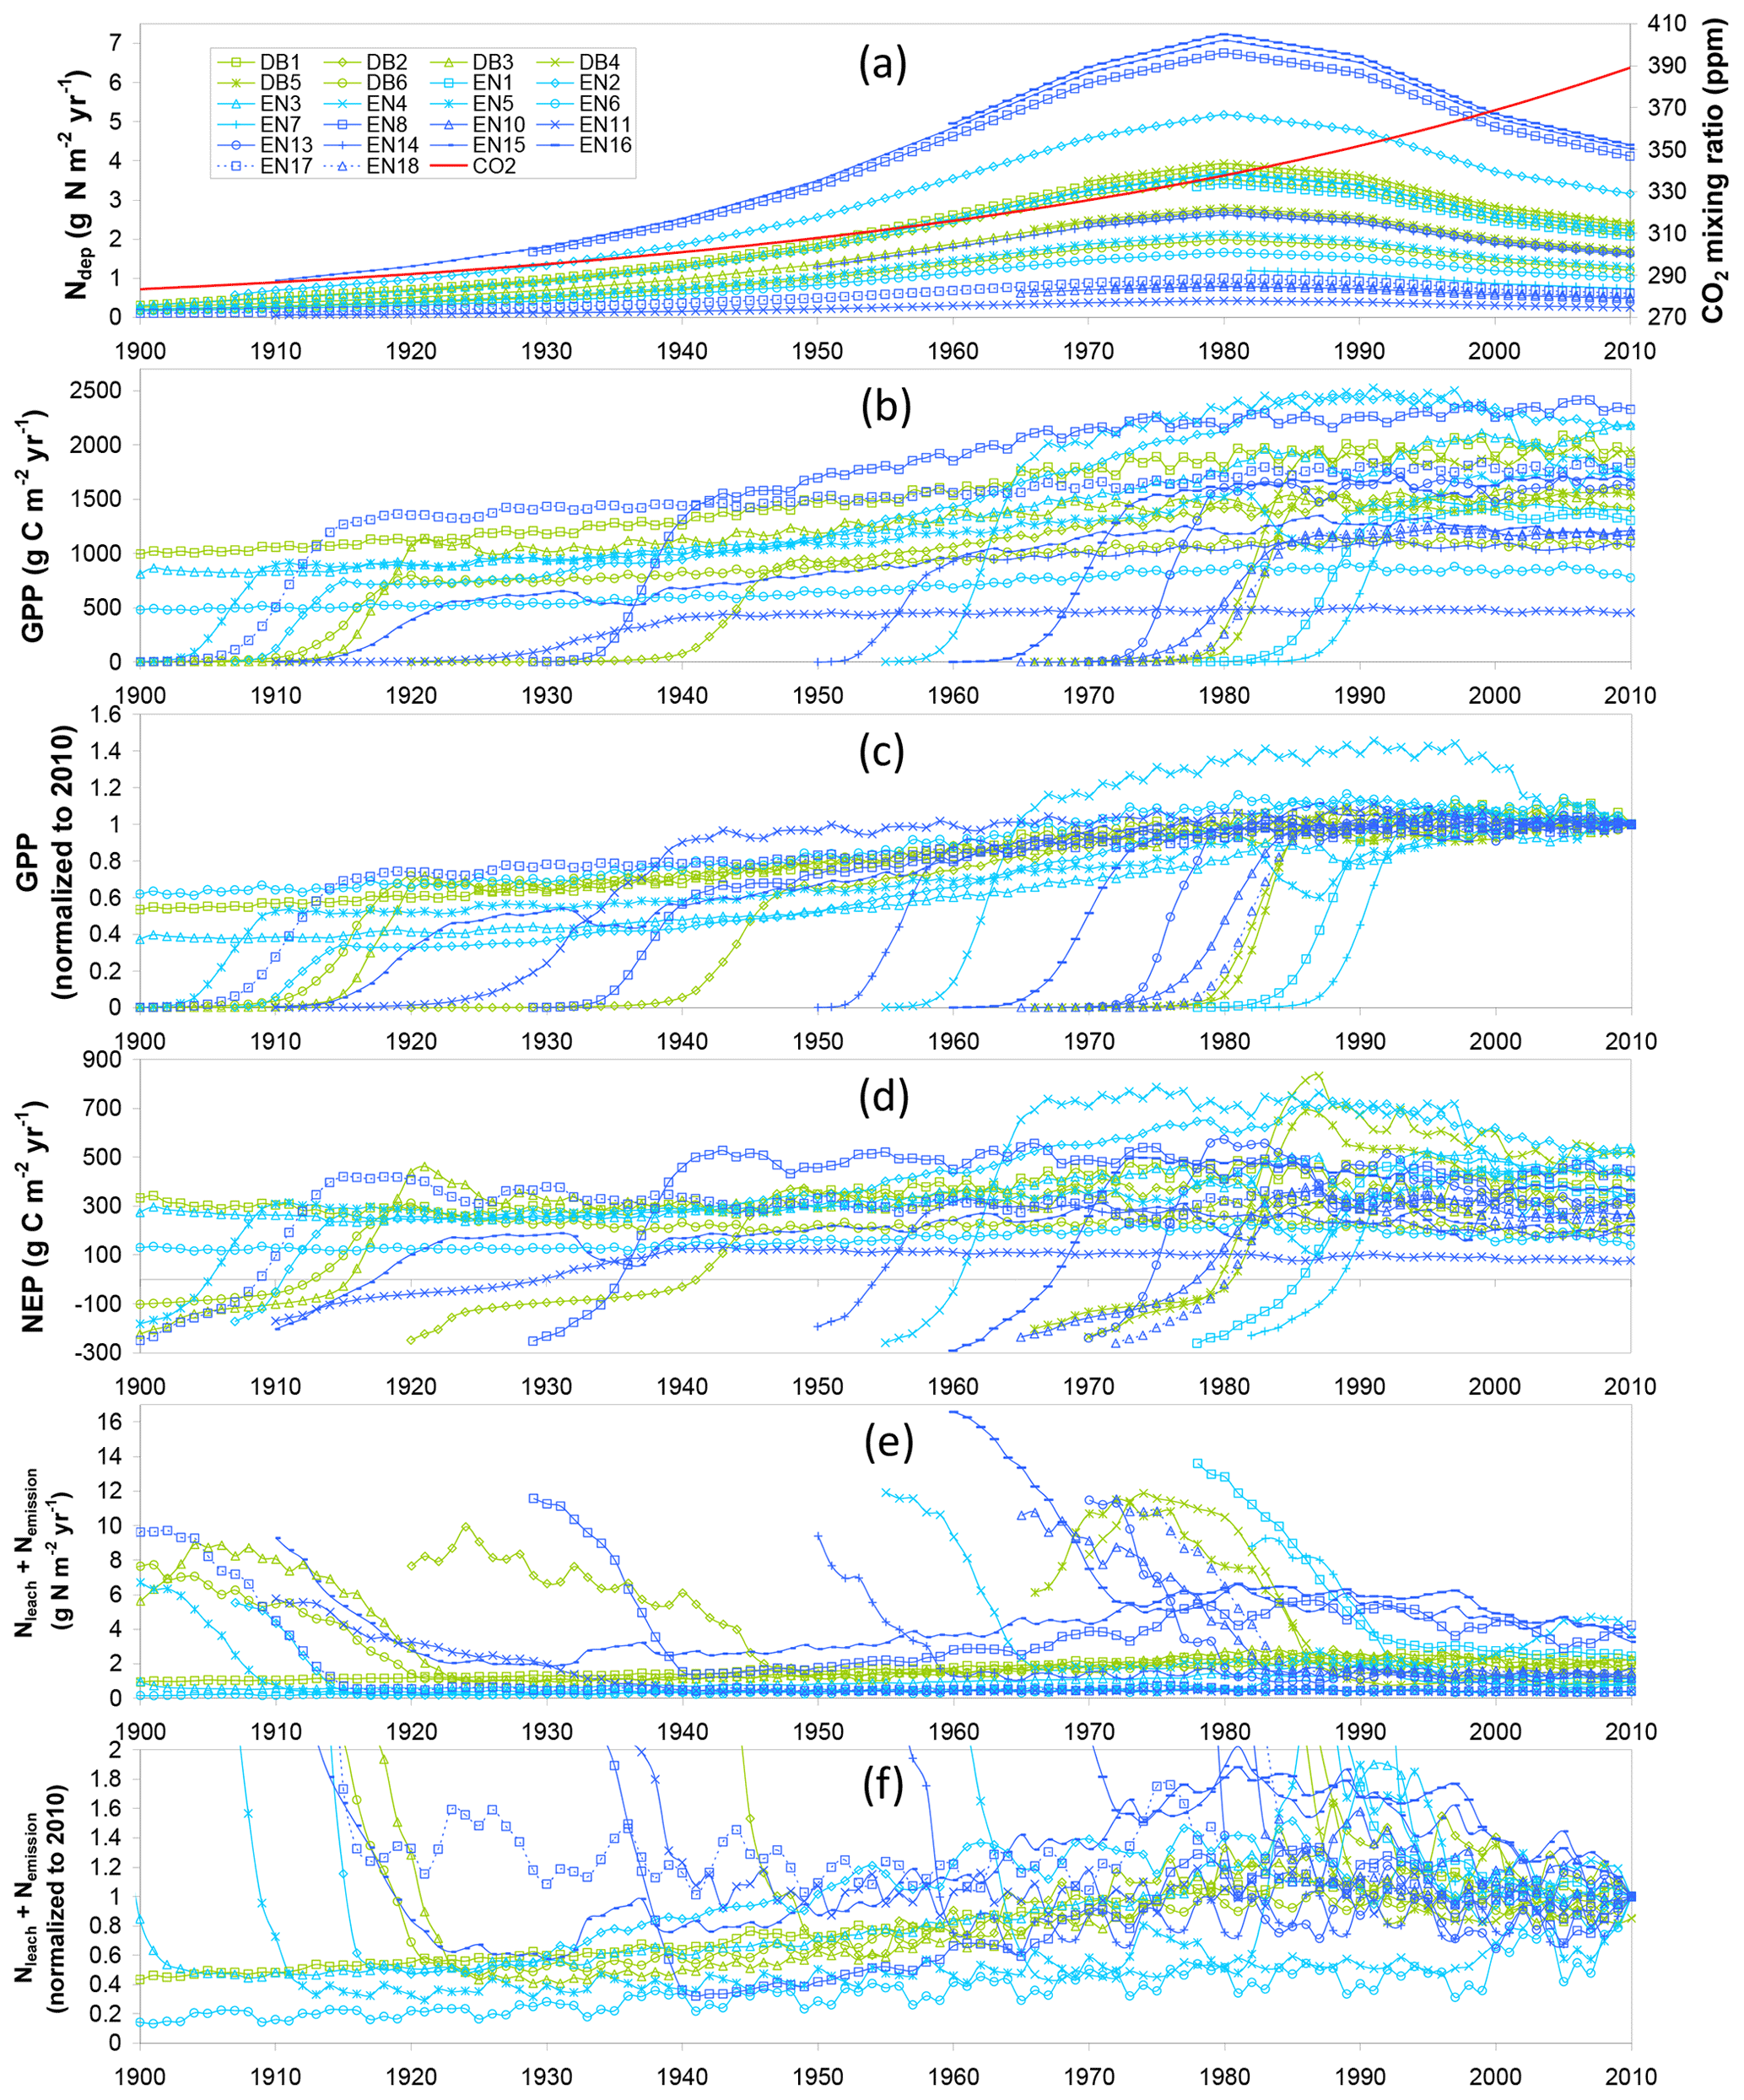
Figure 1Time courses for 22 forest study sites (DB: deciduous broadleaf; EN: evergreen needleleaf) of (a) assumed atmospheric Nr deposition (Ndep) and CO2 mixing ratio; and baseline model simulations of (b) gross primary productivity (GPP), (c) GPP normalized to the 2010 value, (d) net ecosystem productivity (NEP), (e) total N losses by leaching (Nleach) and gaseous emissions (Nemission), and (f) total N losses normalized to 2010.
After this initial phase, modelled GPP increases steadily in response to increasing Ndep and atmospheric CO2, but only for the older stands established before around 1960, i.e. those stands that reach canopy closure well before the 1980s, when Nr deposition is assumed to start declining. Thereafter, modelled GPP ceases to increase, except for the recently established stands that have not yet reached canopy closure. The stabilization of GPP for mature trees at the end of the 20th century in the model is likely a consequence of the effects of decreasing Ndep and increasing CO2 cancelling each other out to a large extent. In parallel, modelled total N losses start to decrease after the 1980s, even for sites long past canopy closure (Fig. 1e–f), but this mostly applies to stands subject to the largest Ndep levels, i.e. where the historical high Ndep values of the 1980s, added to the internal N supply, were well in excess of growth requirements in the model.
These temporal interactions of differently aged stands with changing Ndep and CO2 over their lifetimes therefore impact C- and N-budget simulations made over different time horizons. Modelled C and N budgets are represented schematically in Figs. 2 and 3, respectively, as Sankey diagrams (MATLAB drawSankey.m function; Spelling, 2009) for three example forest sites (DB5, EN3, EN16) and in Figs. S3–S8 of the Supplement for all sites of the study. Each diagram represents the input, output and internal flows in the ecosystem, with arrow width within each diagram being proportional to flow. For carbon (Figs. 2 and S3–S5), the largest (horizontal) arrows indicate exchange fluxes with the atmosphere (GPP, Reco), while the smaller (vertical) arrows indicate gains (green) or losses (red) in internal ecosystem C pools (CSOM, CBS, CR, CL, CLITT), as well as any exported wood products (CEXP, orange). NEP is the balance of the two horizontal arrows, as well as the balance of all vertical arrows.

Figure 2Modelled (BASFOR) budgets and partitioning of gross primary productivity (GPP), ecosystem respiration (Reco), net ecosystem productivity (NEP) and net ecosystem carbon balance (NECB) at three example forest sites (DB5: 45-year-old Fagus sylvatica; EN3: 120-year-old Picea abies; EN16: 51-year-old Pseudotsuga menziesii), and associated modelled changes in C pools in soil organic matter (CSOM), roots (CR), litter layers (CLITT), branches and stems (CBS), and leaves (CL) (units: g C m−2 yr−1, a–f; normalized to % lifetime GPP in g–i). Simulations were run either over the most recent 5-year period which did not include any thinning event (“5-year” in the text) or over the whole time period since the forest was established (“lifetime”). Green indicates ecosystem C gain (photosynthesis and C pool increase); red denotes ecosystem C loss (respiration and C pool decrease); the orange arrows indicate C export through thinning (CEXP). The NECB percentage value (g–i) corresponds to the lifetime carbon sequestration efficiency. The sizes of the Sankey plots are not proportional to the C fluxes of the different study sites.
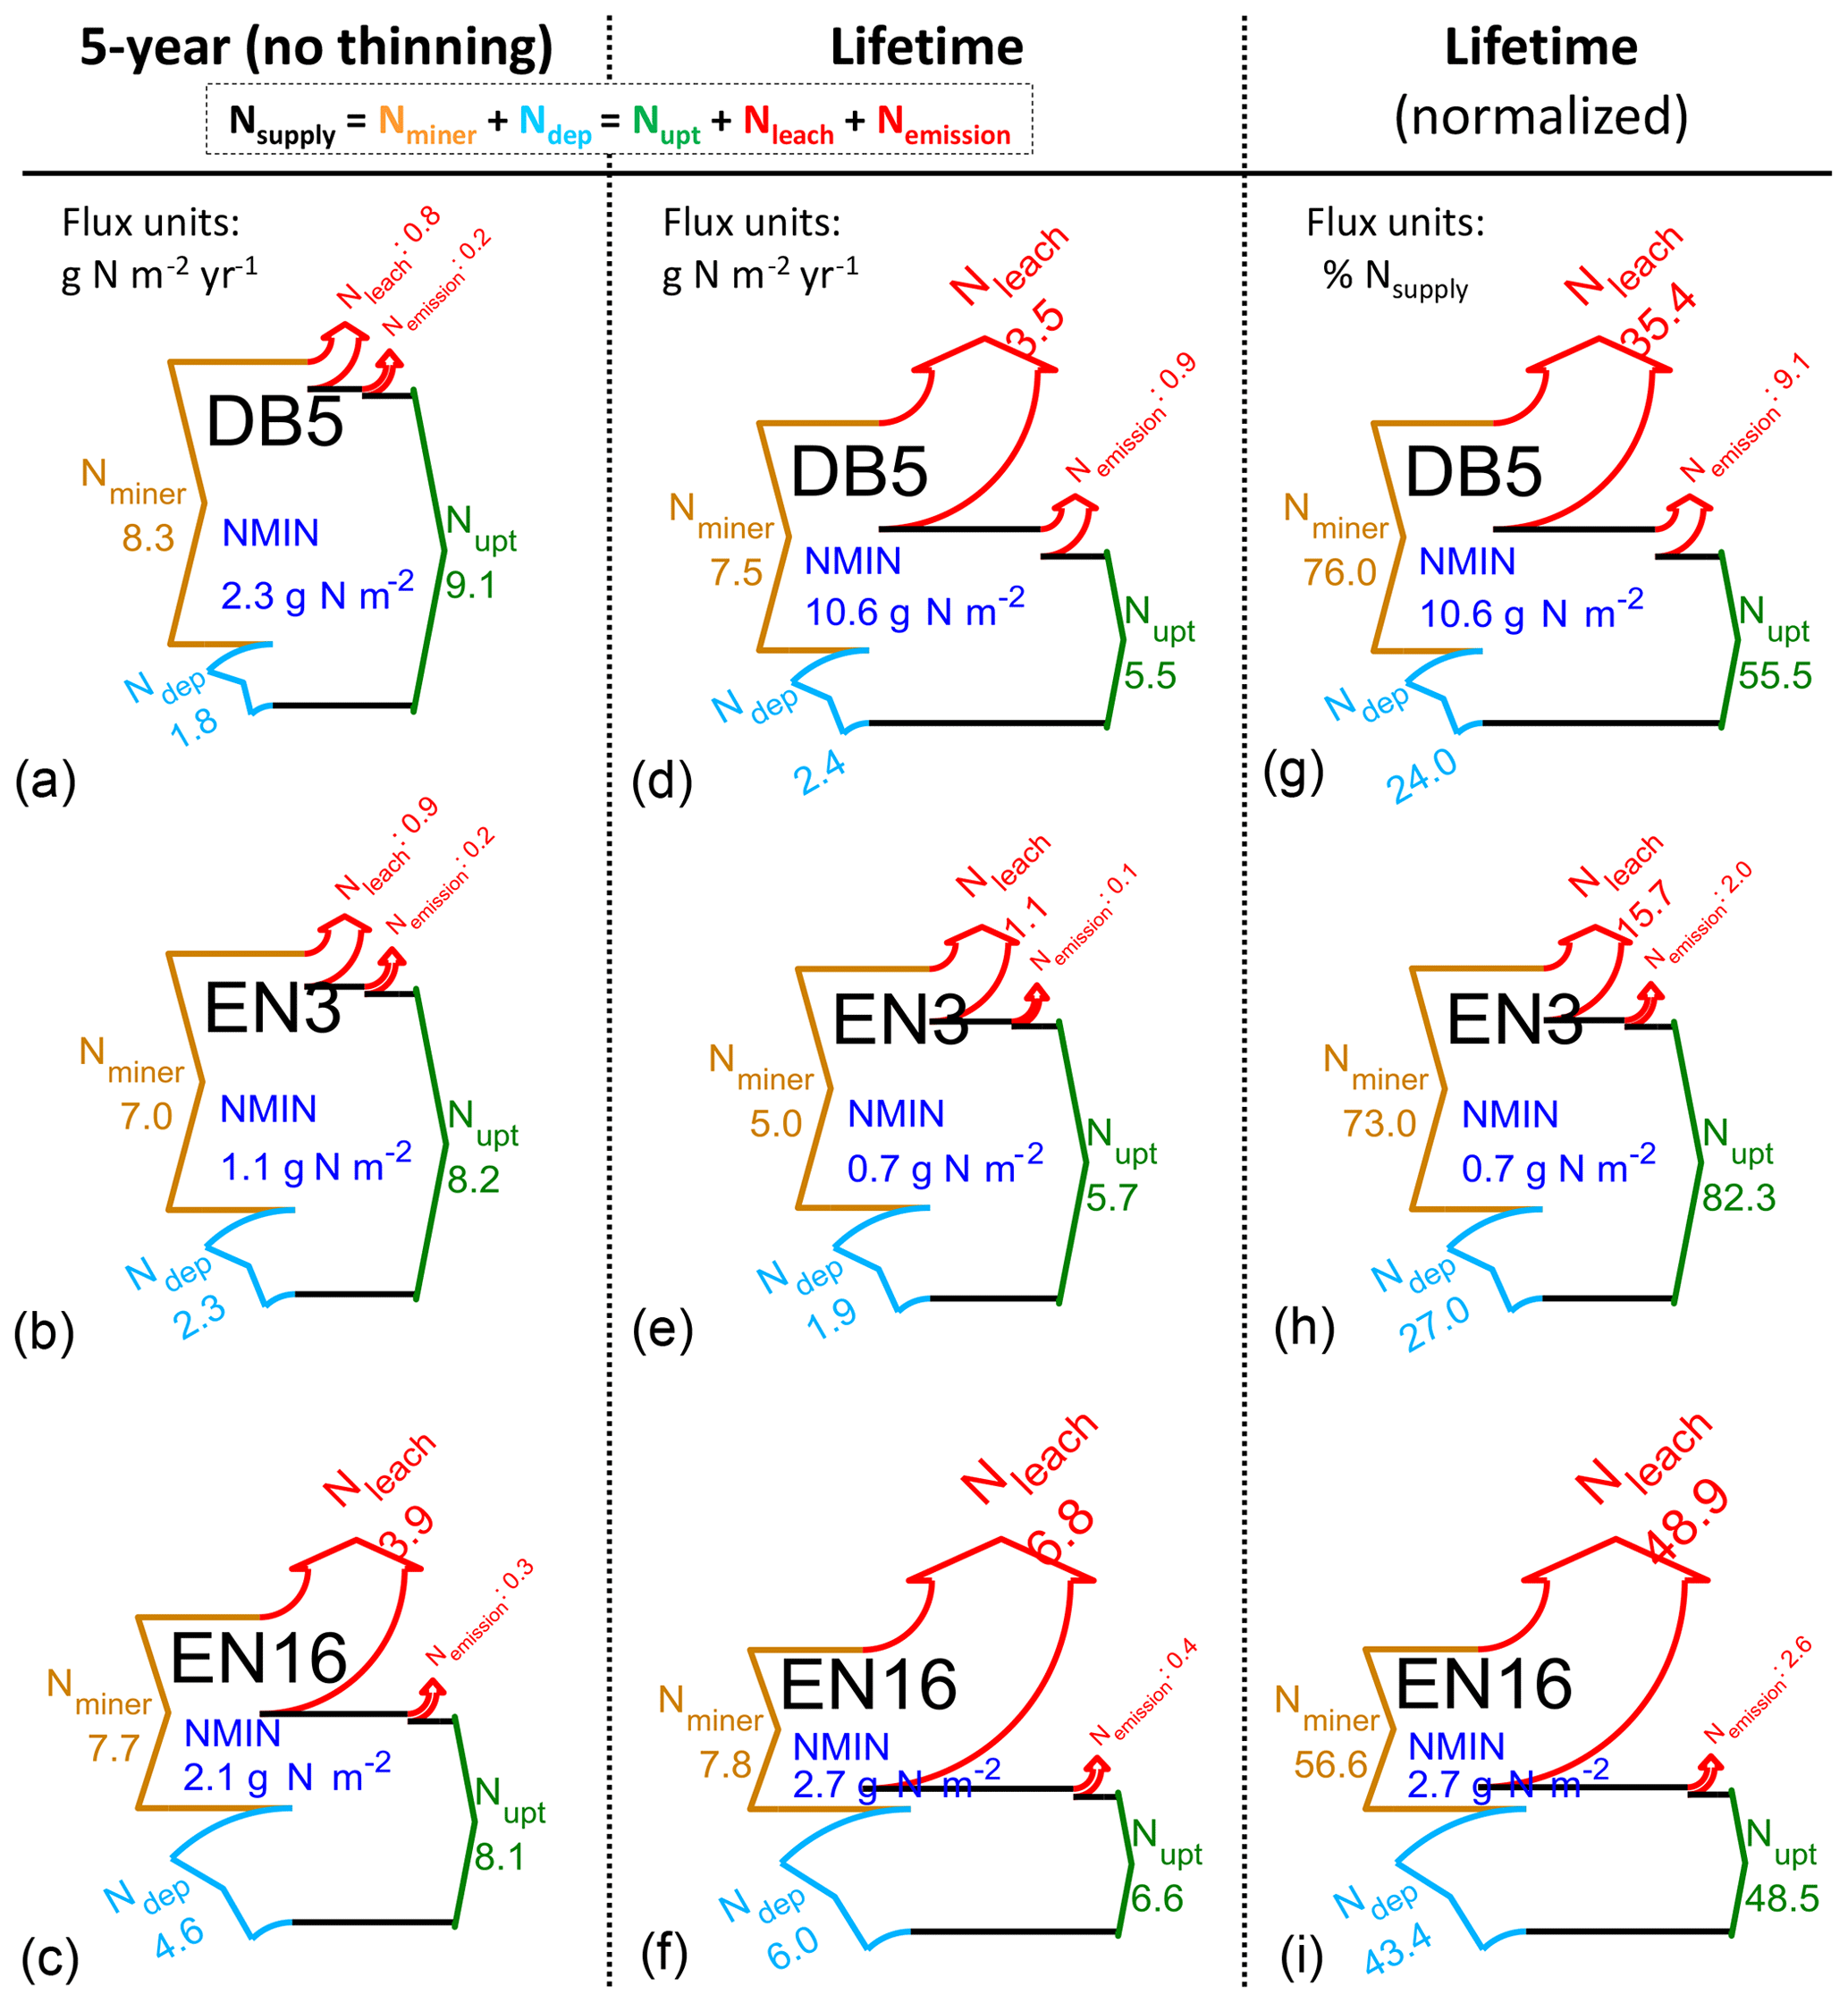
Figure 3Modelled (BASFOR) inorganic nitrogen budgets at three example forest sites (DB5: 45-year-old Fagus sylvatica; EN3: 120-year-old Picea abies; EN16: 51-year-old Pseudotsuga menziesii). Simulations were run either over the most recent 5-year period which did not include any thinning event (“5-year” in the text) or over the whole time period since the forest was established (“lifetime”). The data show ecosystem SOM mineralization (Nminer) and atmospheric Nr deposition (Ndep), balanced by vegetation uptake (Nupt) and the sum of losses as dissolved N (Nleach) and gaseous NO+N2O (Nemission) (units: g N m−2 yr−1, a–f; % of lifetime Nsupply in g–i, with Nsupply defined as Nminer+Ndep). NMIN indicates the mean size of the soil inorganic N pool (g N m−2) over the modelling period. The N uptake percentage value (g–i) corresponds to the lifetime nitrogen uptake efficiency (NUPE). The sizes of the Sankey plots are not proportional to the N fluxes of the different study sites.
In the 5-year simulations with no thinning occurring (Figs. 2a–c; S3), NEP is equal to NECB, which is the sum of ecosystem C pool changes over time (equal to C sequestration if positive). By contrast, in the lifetime (since planting) simulations (Figs. 2d–f; S4), the long-term impact of thinning is shown by the additional orange lateral arrow for C exported as woody biomass (CEXP). In this case, C sequestration or NECB no longer equals NEP, with the difference being CEXP, i.e. the C contained in exported stems from thinned trees. By contrast, in the model, upon thinning the C from leaves, branches and roots joins the litter layers or soil pools and is ultimately respired or sequestered. To compare between sites with different productivity levels, the lifetime data are also normalized as a percentage of GPP (Figs. 2g–i; S5). The clear differences between 5-year and lifetime C-budget simulations were (i) systematically larger GPP in the recent 5-year horizon (combined effects of age as well as CO2 and Ndep changes over time); (ii) C storage in branches and stems (CBS) dominated in both cases, but CBS fractions were larger in the 5-year horizon; and (iii) larger relative storage in soil organic matter (CSOM) when calculated over lifetime.
For nitrogen, in contrast to carbon, the focus of the budget diagrams is not on changes over time of the total ecosystem (tree + soil, organic + mineral) N pools. Rather, we examine in Figs. 3 and S6–S8 the extent to which Nr deposition contributes to the mineral N pool (NMIN), which in the model is considered to be the only source of N available to the trees and therefore acts as a control of C assimilation and ultimately sequestration. In these diagrams for NMIN, the largest (horizontal) arrows indicate the modelled internal ecosystem N-cycling terms (Nminer from SOM mineralization, Nupt uptake by trees), and the secondary (vertical) arrows represent external exchange (inputs and losses) fluxes as Ndep, Nleach and Nemission (unit: g N m−2 yr−1). The variable NMIN describes the transient soil inorganic N pool in the soil solution and adsorbed on the soil matrix (; units g N m−2). Since the modelled long-term (multi-annual) changes in the transient NMIN pool are negligible compared with the magnitudes of the N input and output fluxes, the dNMIN∕dt term is not represented as an arrow in the budget plots, and the total mineral Nsupply (defined as Nminer+Ndep) is basically balanced by N uptake (Nupt) and losses (Nleach+Nemission) (Eq. 8). Modelled N budgets were calculated for a 5-year time horizon (Figs. 3a–c; S6) and for the whole time period since the forest was established (lifetime, Figs. 3d–f; S7). Lifetime data were also normalized as a percentage of Nsupply (Figs. 3g–i; S8). The clear differences between 5-year and lifetime N-budget simulations are as follows: (i) Nloss and especially Nleach were significantly larger over the stand lifetime since planting, and (ii) Nupt was a larger fraction of total Nsupply over the recent 5-year period.
3.2 Contrasted efficiencies of carbon sequestration and nitrogen uptake
Collectively, the changes in the ecosystem C pools, especially the increases in stems and branches (CBS), roots (CR), and soil organic matter (CSOM), represent roughly 20 %–30 % of GPP for both 5-year and lifetime simulations (Figs. 2, S3–S5). By contrast, the analogous term for nitrogen, the Nupt fraction of total Nsupply, is a much more variable term, both between sites of the network and between the 5-year and lifetime simulations (Figs. 3, S6–S8). Modelled lifetime CSE and NUPE values are compared in Fig. 4 with the 5-year values, as a function of stand age, indicating that (i) the older forests of the network (age range ∼ 80–190 years) tend to have larger NUPE than younger or middle-aged forests (∼ 30–60 years) but that (ii) the difference in NUPE between the two age groups is much clearer if NUPE is calculated over the whole period since planting (lifetime). As shown in Fig. 1, BASFOR predicts large N losses in young stands (< 20–25 years), in which lower N demand by a smaller living biomass, combined in the early years with enhanced Nminer from higher soil temperature (canopy not yet closed) and with a larger drainage rate (smaller canopy interception of incident rainfall), all lead to larger NMIN losses. The 22 forests sites of this study were past this juvenile stage, but observation (ii) is a mathematical consequence of high N losses during the forest's early years having a larger impact on lifetime calculations in middle-aged than mature forests. NUPE tends to reach 70 %–80 % on average after 100 years and is smaller when calculated from lifetime than from a 5-year thinning-free period. For forests younger than 60 years, lifetime NUPE is only around 60 %.
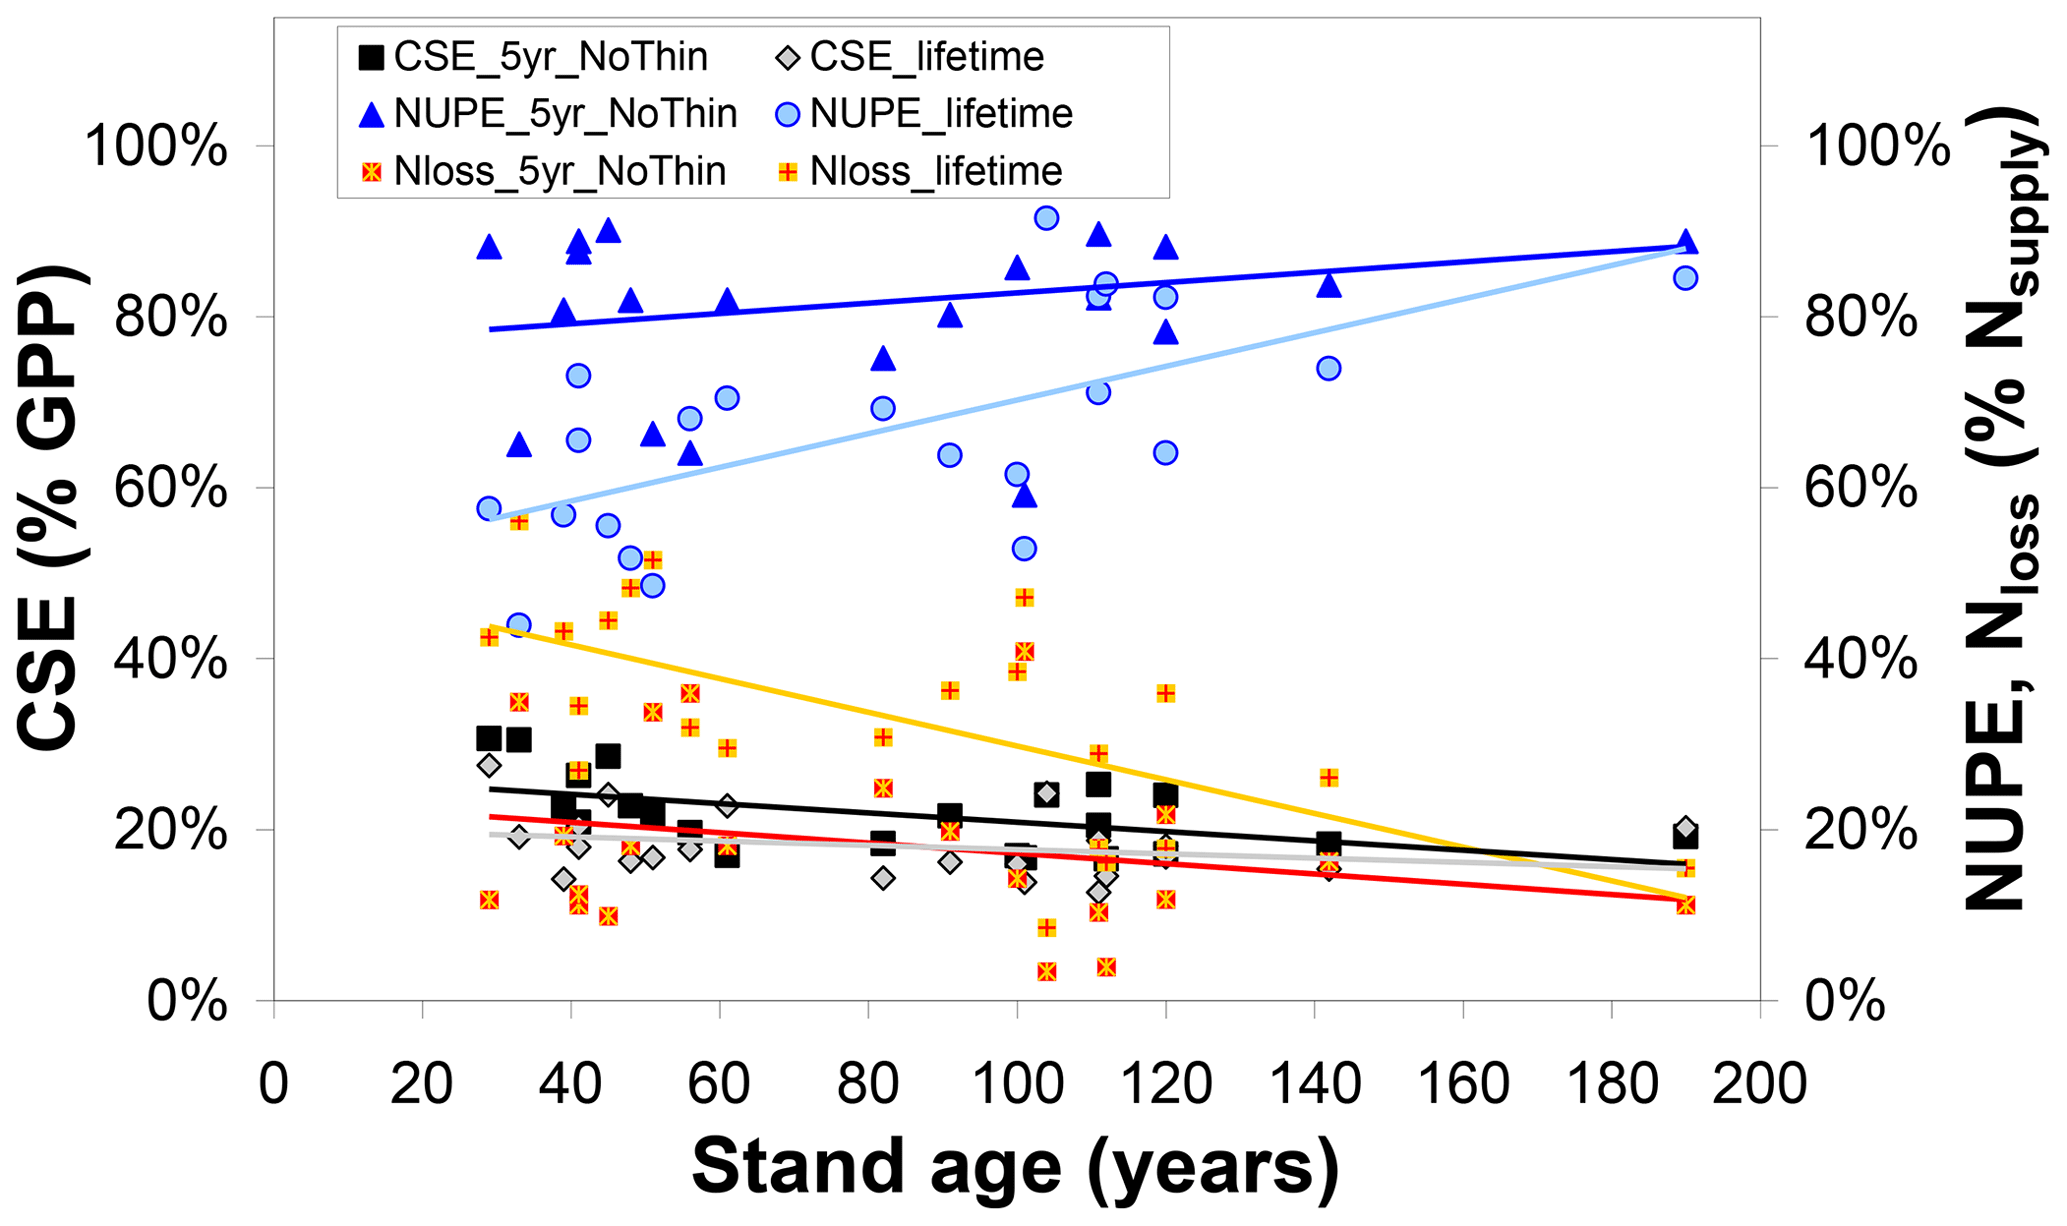
Figure 4Influence of forest stand age on modelled (BASFOR) C sequestration efficiency (CSE, expressed as % gross primary productivity GPP), N uptake efficiency (NUPE) and the Nloss fraction (expressed as % Nsupply). Each data point represents 1 of 22 modelled forest sites. CSE and NUPE values are calculated either (i) over the most recent 5-year period including no thinning event around the time frame of the CEIP–NEU integrated projects or (ii) over the whole lifetime of the stands (including all thinning events). See Eqs. (1)–(9) for definitions and calculations of the indicators.
Modelled carbon sequestration efficiency is less affected than NUPE by forest age (CSE range ∼ 15 %–30 %) (Fig. 4). There is a tendency for 5-year (thinning-free) CSE to decrease from ∼30 % to ∼20 % between the ages of 30 and 190 years. This means that, in the model, Reco in 30- to 60-year-old stands represents a smaller fraction of GPP than in mature stands. From Eq. (1) it can readily be shown that CSE = , which is roughly equivalent to , since in the model Raut is constant and approximately 0.5 for all species. By contrast, BASFOR predicts that the Rhet ∕ GPP ratio increases steadily with age at each site, after the initial establishment phase (Fig. S12a). This induces a decline in modelled CSE from 25 %–35 % in the age class 30–60 years down to around 20 %–25 % for the older forests (Fig. S12b). This also implies a non-linearity developing over time of GPP versus soil and litter layer C pools, since Rhet is assumed to be a linear function of fast and slow C pools in litter layers and SOM. Lifetime CSE values are slightly smaller than the 5-year values: the difference corresponds to cumulative CEXP over time, but the trend with age is weaker than for 5-year CSE. The relatively narrow range of modelled 5-year CSE values (20 %–30 %) is in sharp contrast to the much wider range of observation-based CSEobs values (from −9 % to 61 %), likely reflecting some limitations of the model and possibly also measurement uncertainties, as discussed in Flechard et al. (2020).
Beyond the overall capacity of the forest to retain assimilated C (as quantified by CSE), the modelled fate of sequestered C, the simulated ultimate destination of the C sink, is also a function of forest age and of the time horizon considered (Fig. 5). The fraction of NECB sequestered in above-ground biomass (CLBS) over a recent 5-year horizon is on average around 80 % (versus around 10 % each for CR and CSOM) and not clearly linked to forest age; i.e. the model does not simulate any slowing down with age of the annual growth of above-ground biomass. Calculated over lifetimes, the dominant ultimate destination of sequestered C remains CLBS. However, this fraction is smaller (50 %–60 %) in old-growth forests than in younger stands (60 %–80 %), since a larger cumulative fraction of above-ground biomass (timber) will have been removed (CEXP) by a lifetime of thinnings in a mature forest, while the cumulative gain in CSOM is not repeatedly depleted but on the contrary enhanced by thinnings (since the model assumes bole removal only, not total tree harvest). Modelled annual C storage to the rooting system clearly declines with age and is an increasingly marginal term over time (although the absolute CR stock itself keeps increasing over time, except when thinning transfers C from roots to SOM).
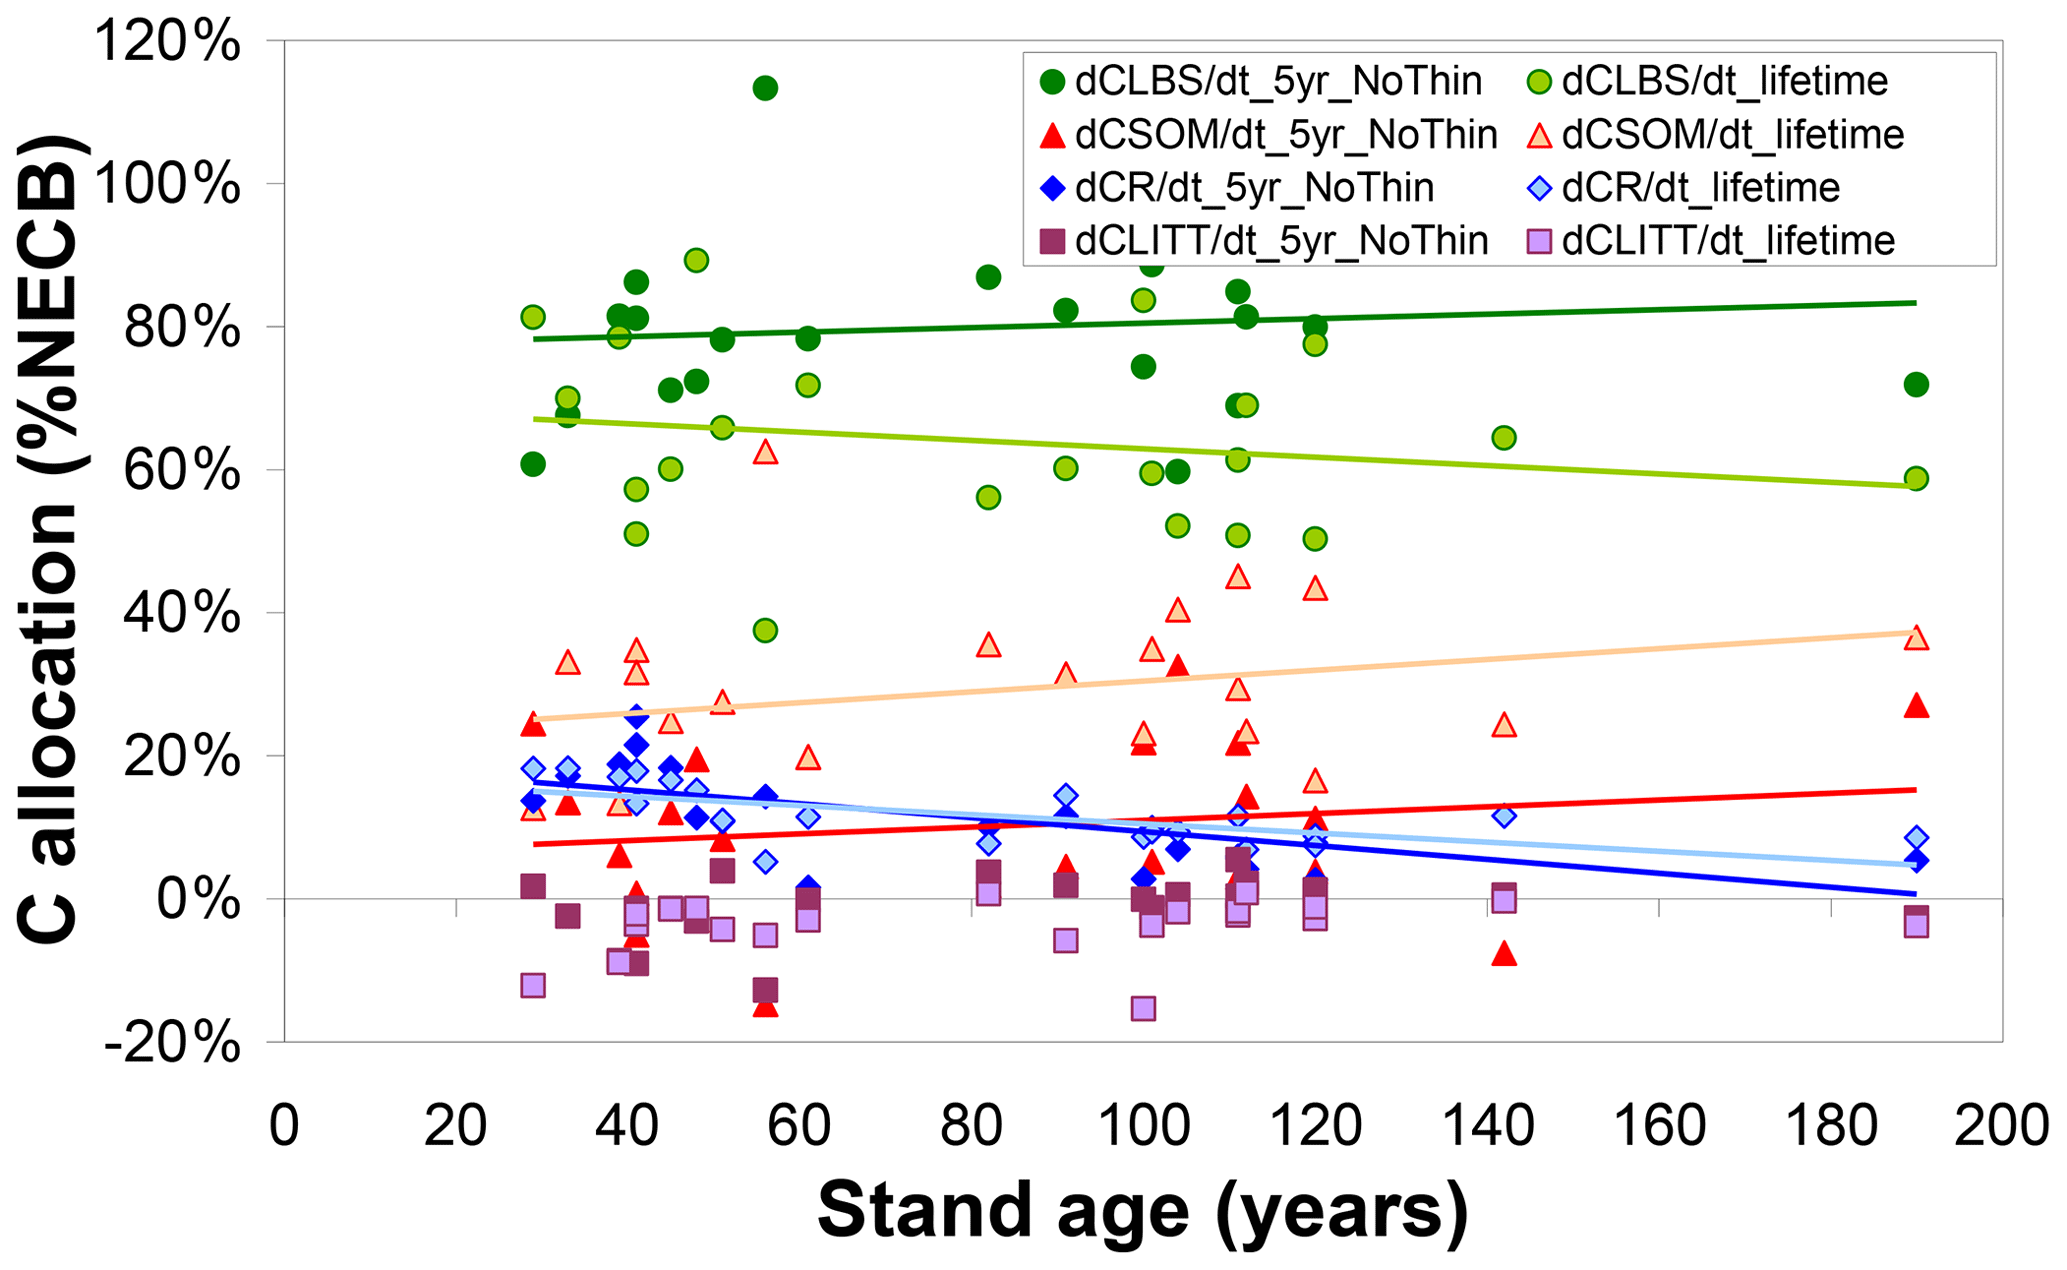
Figure 5Modelled (BASFOR) ultimate allocation of sequestered C (expressed as % net ecosystem carbon balance NECB) into ecosystem pools in soil organic matter (CSOM); roots (CR); litter layers (CLITT); and leaves, branches and stems (CLBS). Each data point represents 1 of 22 modelled forest sites, plotted as a function of stand age. At each site, the net ecosystem carbon balance equals the sum of all individual storage (or loss) terms, i.e. , shown here as fractions of the total to indicate the relative importance of the different ecosystem sinks. Values are calculated either (i) over the most recent 5-year period including no thinning event around the time frame of the CEIP–NEU integrated projects or (ii) over the whole lifetime of the stands (including all thinning events).
3.3 Standardization of observation-based GPP through meta-modelling
The purpose of meta-modelling was to standardize observation-based GPPobs into GPP* through model-derived factors that separate out the effects of climate, soil and age between monitoring sites (Eq. 10), so that the importance of Nr can be isolated. The sensitivity of modelled GPP to climate and soil physical properties was tested through various model input and parameter scenarios, allowing standardization factors fCLIM and fSOIL to be calculated as described in Sect. 2 (Eqs. 11–15) and Table S2 in the Supplement. The resulting distributions of all simulations for all sites were represented in Fig. 6 as violin plots (MATLAB distributionPlot.m function; Dorn, 2008) for the climate-only and soil-only scenarios (n2=484 simulations each), and also combined climate–soil scenarios (n3 = 10 648 simulations). For each site, the scenarios explore the modelled response of ecosystem C dynamics to a range of climate and soil forcings different from their own. The size and position of the violin distribution indicate, respectively, the degrees of sensitivity to and limitation by climate, soil or both; a site is especially limited by either factor (relative to the other sites of the network) when the baseline/default run (GPPbase) is located in the lower part of the distribution.
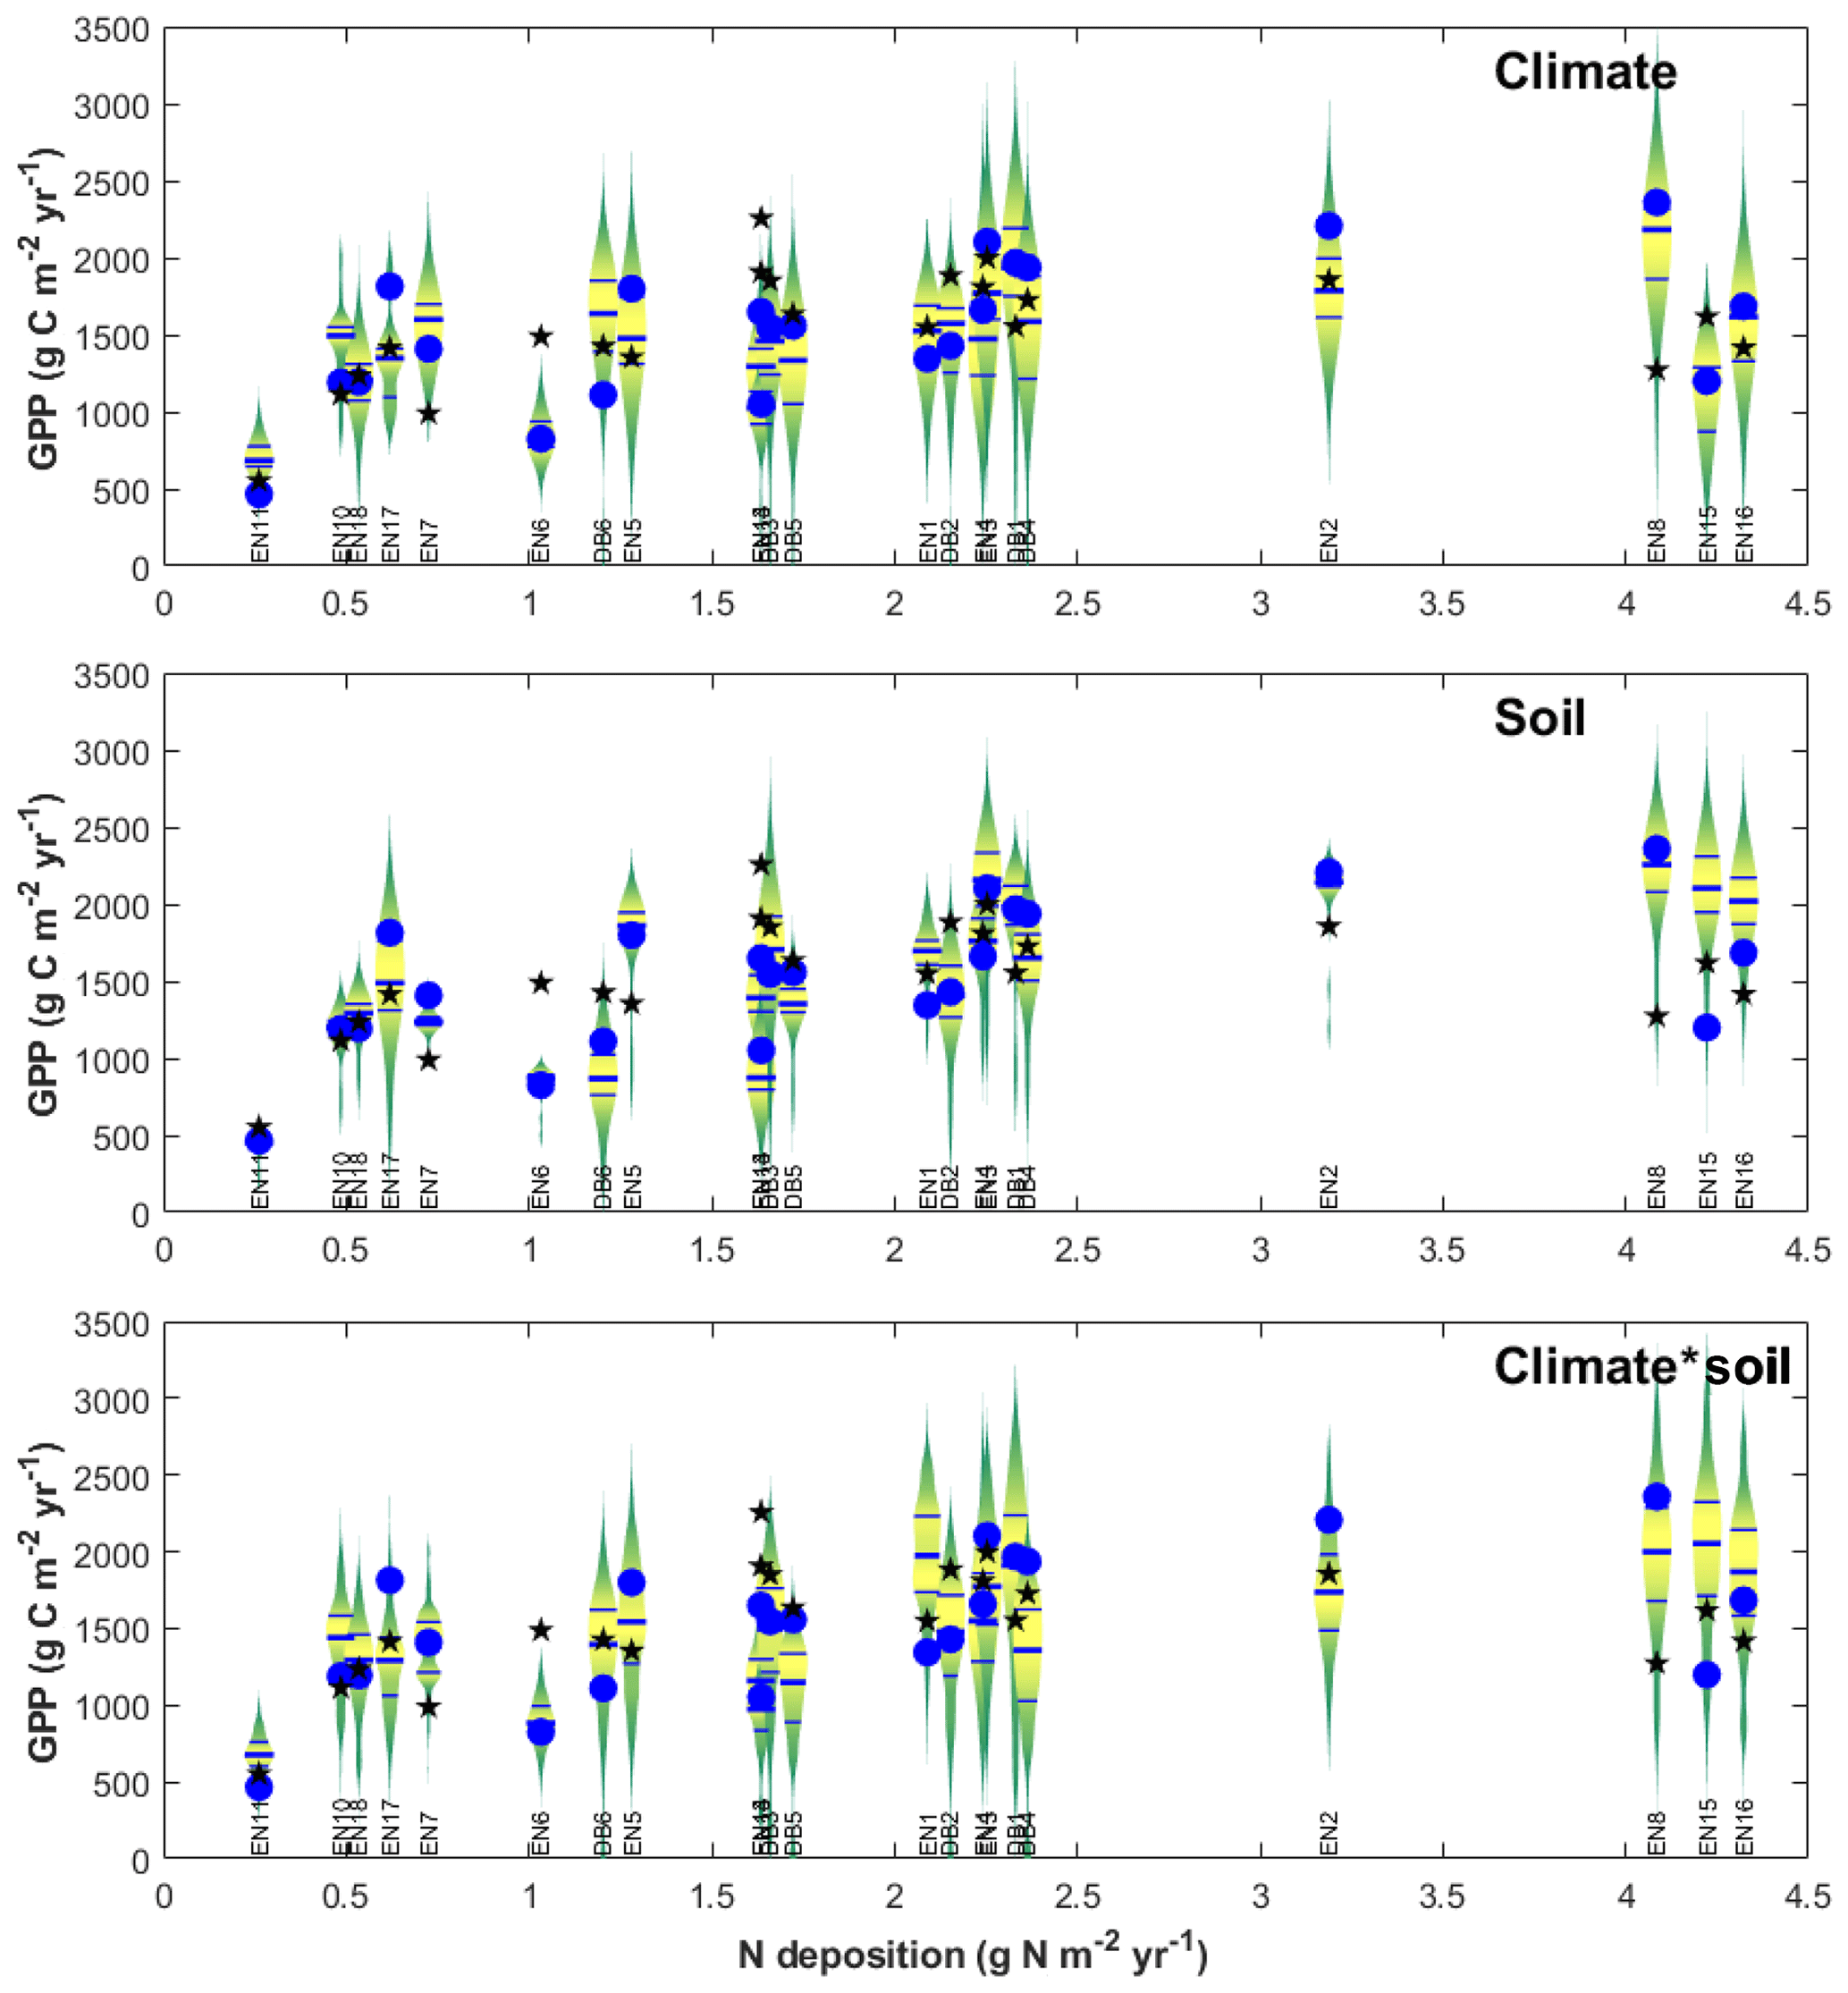
Figure 6Input sensitivity study for gross primary productivity (GPP) modelled at each forest monitoring site for different soil/climate scenarios (vertical violin plots), compared with model base runs GPPbase (blue circles) and EC-derived GPPobs (black stars). The data are displayed as a function of Nr deposition over the CEIP–NEU measurement periods, for n=22 deciduous broadleaf (DB) and coniferous evergreen needleleaf (EN) forest ecosystems. For each site, the violin plot shows the range and distribution (median, quartiles) of GPP modelled at the site using climate and/or soil input data from all 22 sites, showing the sensitivity to model inputs other than N deposition. See text for details.
Similarly, to account for the effect of tree age, the fAGE factor was calculated following Eq. (17), whereby the time series for the ratio of modelled GPPbase(yr) to GPPbase(80) (Eq. 16) followed broadly similar patterns for the different sites (Fig. 7), with values mostly in the range 0.6–0.8 at around age 40, crossing unity at 80 and levelling off around 1.2–1.4 after a century. Some of the older sites (e.g. EN2, EN6, EN15) showed a peak followed by a slight decrease in modelled GPP but not at the same age. This was due to the peak in Ndep in the early 1980s in Europe (Fig. S1), with the Ndep peak occurring at different ontogenetic stages in the differently aged stands. By calculating a mean fAGE factor across sites the peak Ndep effect was smoothed out (Fig. 7). Thus, for a younger forest, the multiplication of GPPobs by fAGE (>1) simulated the larger GPP* that one could expect for the same site at 80 years; conversely, the GPP* a mature forest (>100 years) would be reduced compared with GPPobs.
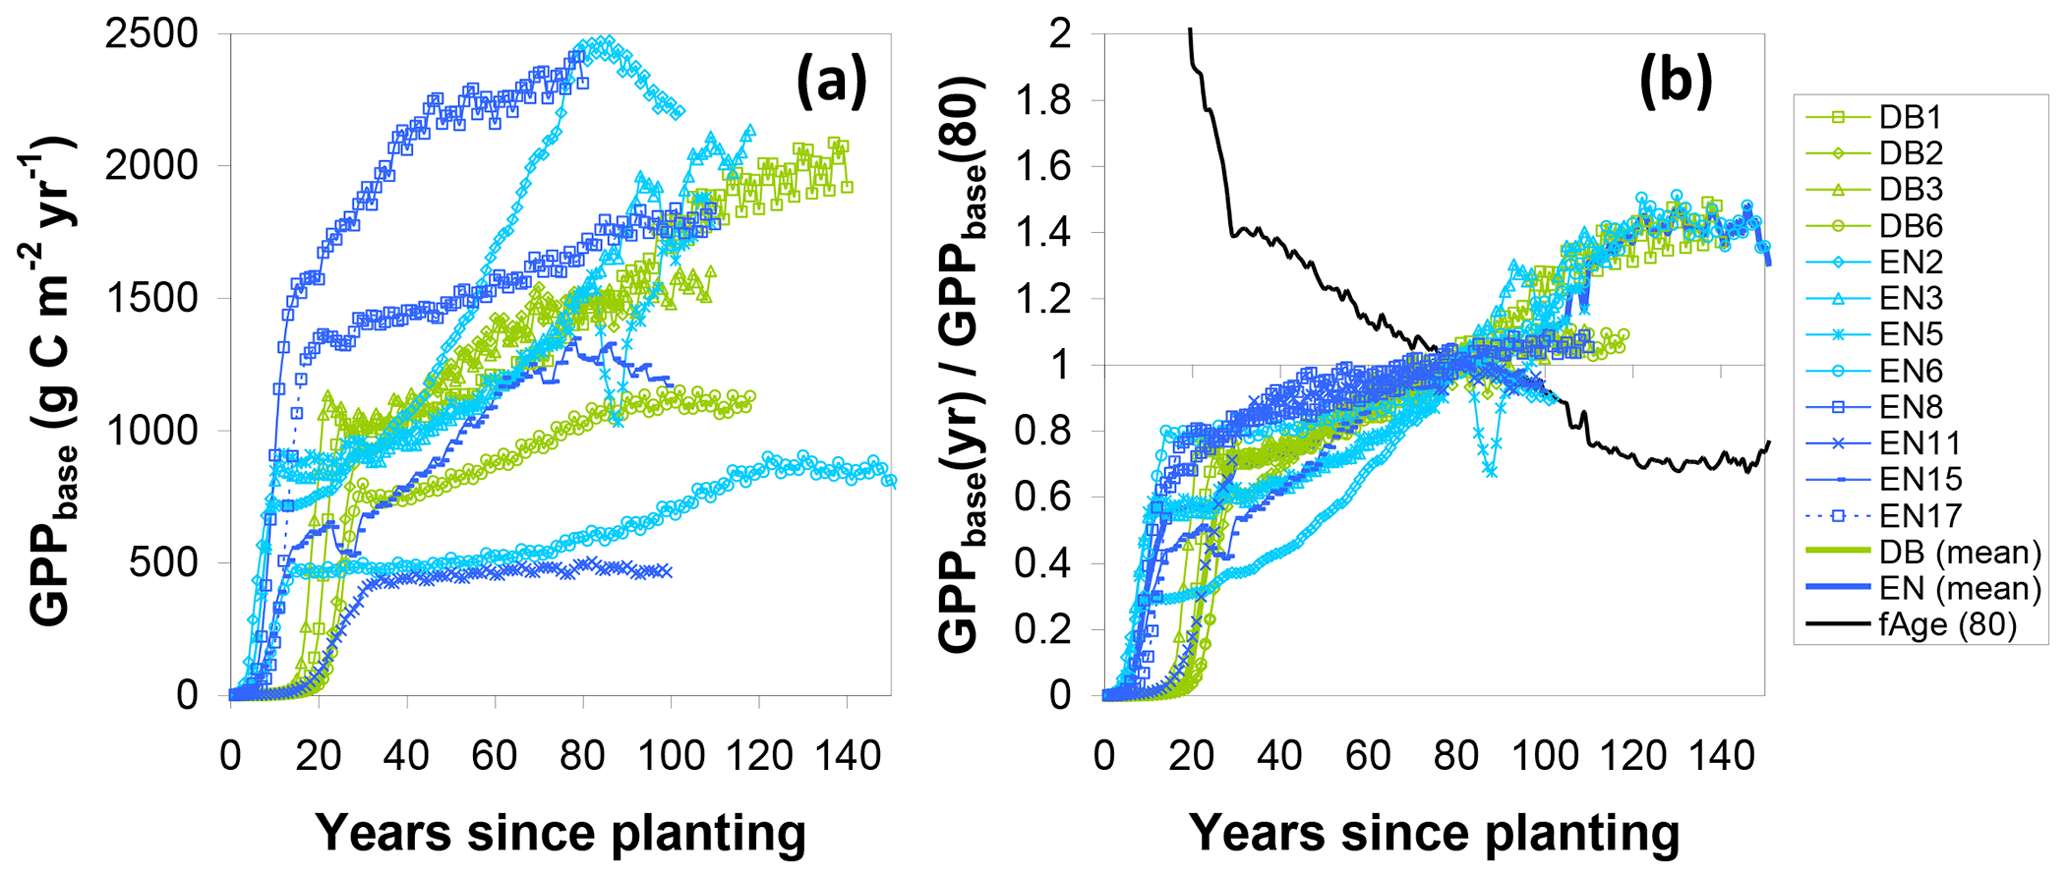
Figure 7Steps in the calculation of a normalization factor for forest age (fAGE, normalized to 80 years) from modelled BASFOR growth curves for mature forests (12 sites older than 80 years). (a) Modelled time course for baseline gross primary productivity (GPPbase); (b) each site's GPPbase curve is normalized to the value at age 80 years. A single fAGE curve is then calculated as the mean of all sites after normalization to GPPbase(80). The fAGE curve is subsequently used as a scaling function to standardize all sites' measured GPP to a notional age of 80 (see Eqs. 10, 16, 17). DB: deciduous broadleaf; EN: coniferous evergreen needleleaf.
The combined modelled effects of climate, soil, and stand age on GPP are summarized in Fig. 8. Values for both fCLIM and fSOIL are mostly in the range 0.7–1.5 and are predictably negatively correlated to mean annual temperature (MAT) and soil water holding capacity (SWHC), respectively (Fig. 8a). A value well above 1 implies that GPPobs for one site lies below the value one might have observed if climate or SWHC had been similar to the average of all other sites of the network. In other words this particular site was significantly limited by climate, SWHC or both, relative to the other sites. Conversely, a value below 1 means that GPP at the site was particularly favoured by weather and soil. Climate or soil conditions at some sites have therefore the potential to restrict GPP by around one-third, while other climates or soil conditions may enhance GPP by around one-third, compared with the average conditions of the whole network. Applying the fCLIM, fSOIL and fAGE multipliers to GPPobs (Eq. 10) provides a level playing field (GPP*) for later comparing sites with respect to Nr deposition but also increases the scatter and noise in the relationship of GPP* to Ndep, particularly with the introduction of fAGE (Fig. 8b).
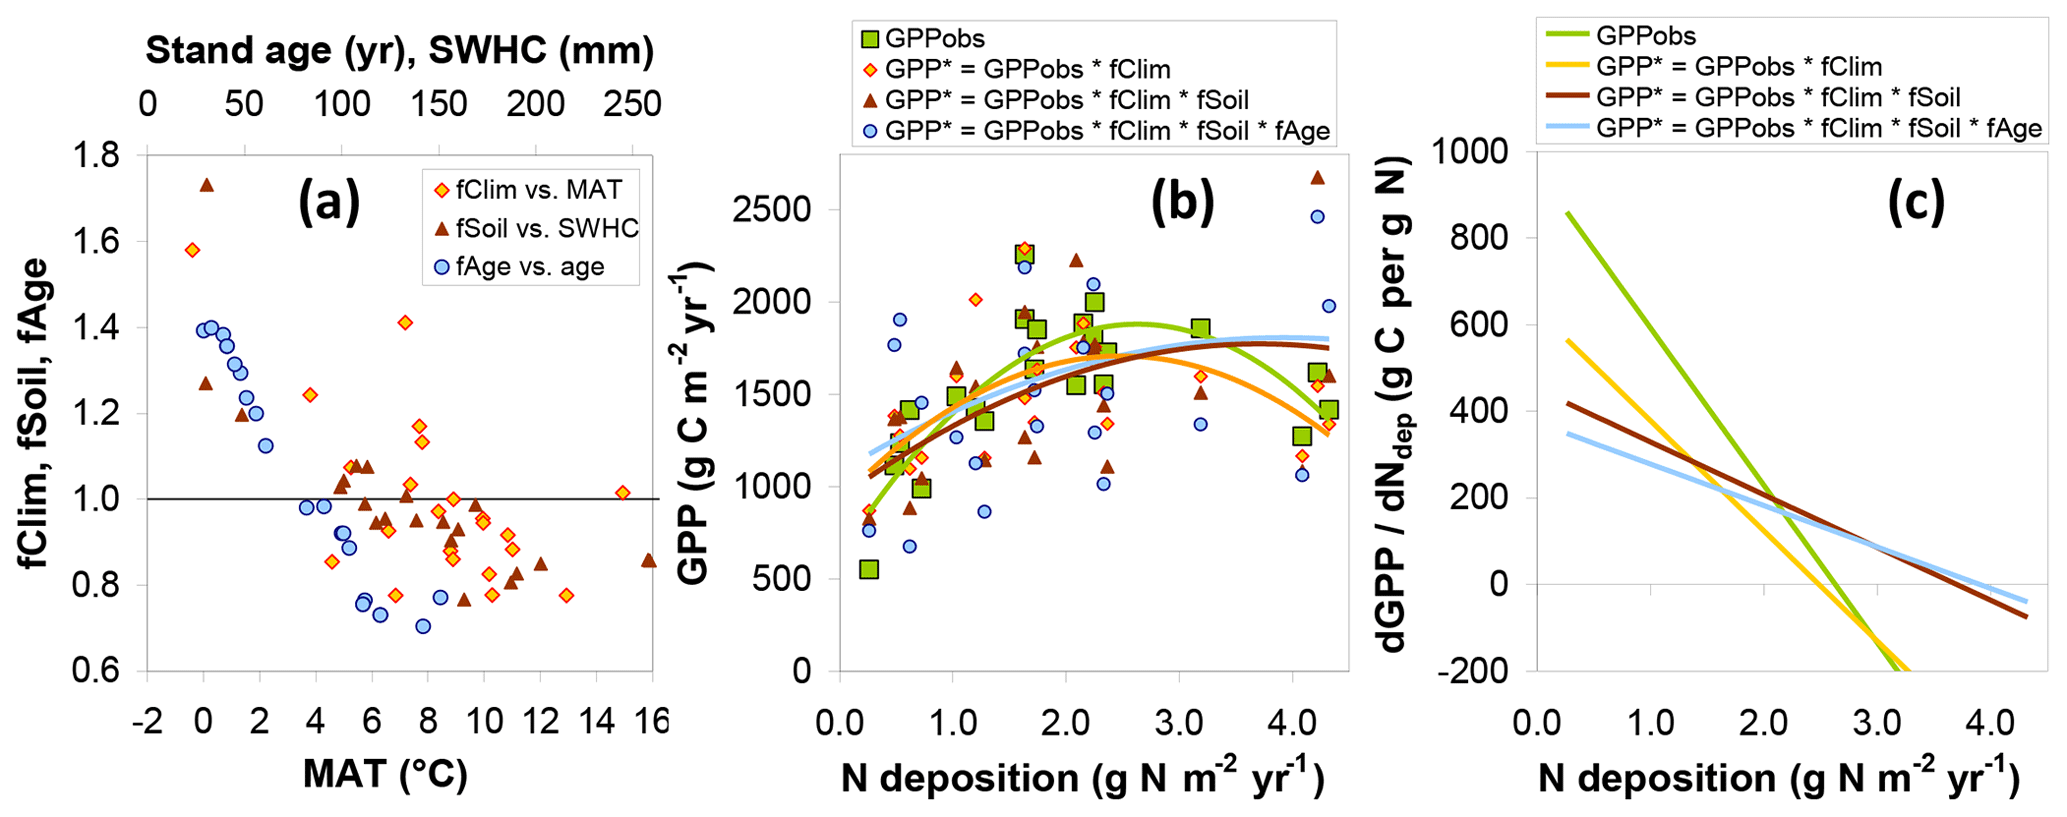
Figure 8Model-based assessment of the sensitivity of gross primary productivity (GPP) to climate, soil, age and Nr deposition. (a) GPP standardization factors for climate (fCLIM), soil (fSOIL) and age (fAGE) for observational (EC-based) data as a function of the dominant climatic and soil drivers (MAT: mean annual temperature; SWHC: soil water holding capacity; see text for details); (b) the resulting standardized GPP* compared with the original GPPobs as a function of Ndep (one data point for each of 22 sites), with second-order polynomial fits; (c) estimates of the GPP response to Ndep, calculated as the slope of the tangent line to the quadratic fits and plotted as a function of Ndep.
3.4 Response of gross primary productivity to Nr deposition
The standardized forest GPP* values, i.e. GPP*(fCLIM), and , show in the Ndep range 0–1 g N m−2 yr−1 a much less steep relationship to Ndep than the original GPPobs (Fig. 8b). This supports the hypothesis that GPP at the lower-Ndep sites is also limited by climate and/or soil water availability. In Fig. 8b, second-order polynomials are fitted to the data to reflect the strong non-linearity present in GPPobs, driven especially by the four highest Ndep sites (>2.5 g N m−2 yr−1 at EN2, EN8, EN15 and EN16). The non-linearity (magnitude of the second-order coefficient) is reduced by the introduction of fCLIM and fSOIL, while fAGE has a small residual impact on the shape of the regression. Due to this non-linear behaviour, the dGPP∕dNdep responses decrease with Ndep for the observation-based GPP but less so for the standardized GPP* estimates (Fig. 8c). Values of dGPPobs∕dNdep (calculated for each Ndep level by the slope of the tangent line to the quadratic fits of Fig. 8b) range from around 800 g C per g N at the lowest Ndep level down to negative values at the highest Ndep sites; for the standardized GPP* accounting for all climate, soil and age effects, this range is much narrower, from around 350 down to near 0 g C per g N.
Average dGPP∕dNdep figures that are representative of this set of forest sites are given in the upper part of Table 2, either calculated over the whole range of 22 sites or for a subset of 18 sites that excludes the four highest deposition sites (>2.5 g N m−2 yr−1). If all modelled sites are considered, the mean dGPP∕dNdep regression slopes are smaller (190–260 g C per g N), being influenced by the reductions in GPP at very high Ndep levels, possibly induced by the negative side effects of N saturation. If these four sites are excluded, the mean dGPP∕dNdep is larger (234–425 g C per g N), reflecting the fact that healthier, N-limited forests are more responsive to N additions. In this subset of 18 sites, the effects of climate, soil and stand age account for approximately half of the GPP (the mean dGPP∕dNdep response changes from 425 to 234 g C per g N). For comparison, Table 2 also provides the values of dGPPobs∕dNdep obtained directly through simple linear regression for all forest sites and for the semi-natural vegetation sites, with values of the same order (432 and 504 g C per g N, respectively) if the high N deposition sites (Ndep > 2.5 g N m−2 yr−1) are removed.
Table 2Estimates of ecosystem dC∕dN response for gross and net productivity, calculated under different assumptions and expressed as g C photosynthesized or sequestered per g N deposited from the atmosphere. The stepwise method described in this paper (for forests only) first calculates dGPP∕dNdep, for both raw GPPobs and GPP* standardized by meta-modelling following Eqs. (10)–(17); this is then multiplied by different estimates of CSE (from observations or from modelling) to provide an NEP (5-year) or NECB (lifetime) equivalent. Quadratic regressions (Q) are used for productivity vs. Ndep, whereby the mean tangent slope is calculated either over the whole Ndep range (0–4.3 g N m−2 yr−1) (italics) or discarding sites with Ndep larger than 2.5 g N m−2 yr−1 (bold). Uncertainty ranges are calculated from combined standard errors in dGPP∕dNdep and in CSE. For comparison purposes only, the following are also displayed: (i) simple linear regression (L) slopes of EC-based (not standardized) GPPobs and NEPobs versus Ndep for both forests and semi-natural vegetation and (ii) results of the meta-modelling standardization method applied directly to NEPobs instead of GPPobs.

GPP: gross primary productivity; NEP: net ecosystem productivity; NECB: net ecosystem carbon balance. GPPobs, NEPobs: observation-based (eddy covariance) GPP or NEP. GPP*, NEP*: GPP or NEP standardized through meta-modelling for the effects of climate (fCLIM), soil (fSOIL) and age (fAGE). CSE: carbon sequestration efficiency. (eddy covariance-based, mean value across all sites). (BASFOR-model-based over 5-year period, mean value across all sites). (BASFOR-model-based over lifetime, mean value across all sites). Q Calculated by quadratic regression. L Calculated by simple linear regression. A Calculated on the basis of all sites in the monitoring network (31 forests, 9 semi-natural sites). M Calculated on the basis of the subset of 22 forest sites included in BASFOR meta-modelling.
As a further comparison, an additional BASFOR modelling experiment is shown in Fig. 9a, in which GPP at all sites is simulated in a range of Ndep scenarios (0, 0.1, 0.2, 0.5, 1, 1.5, 2, 2.5, 3, 3.5, 4 and 4.5 g N m−2 yr−1, constant over lifetime) to substitute for the actual Ndep levels of each site. Around half the sites show a steadily increasing (modelled) GPP as Ndep increases over the whole range 0–4.5 g N m−2 yr−1, with broadly similar slopes between sites, while the other half levels off and reaches a plateau at various Ndep thresholds, indicating that beyond a certain level Ndep is no longer limiting, according to the model. For comparison with the dC∕dN responses calculated previously for GPPobs and GPP* in Fig. 8b–c and Table 2, we derive a mean modelled dGPP∕dNdep response from a linear regression of Fig. 9a data over the range 0–2.5 g N m−2 yr−1 (i.e. excluding the highest deposition levels). This yields a mean dGPP∕dNdep slope across all sites of 297 (273–322) g C per g N for the Ndep model experiment, only marginally larger than the three GPP* average slopes of Table 2. Note that in Fig. 8b the response of GPP* to Ndep is calculated between sites of the network, while in Fig. 9a the GPP to Ndep response is calculated within each site from the model scenarios and then averaged across all sites.
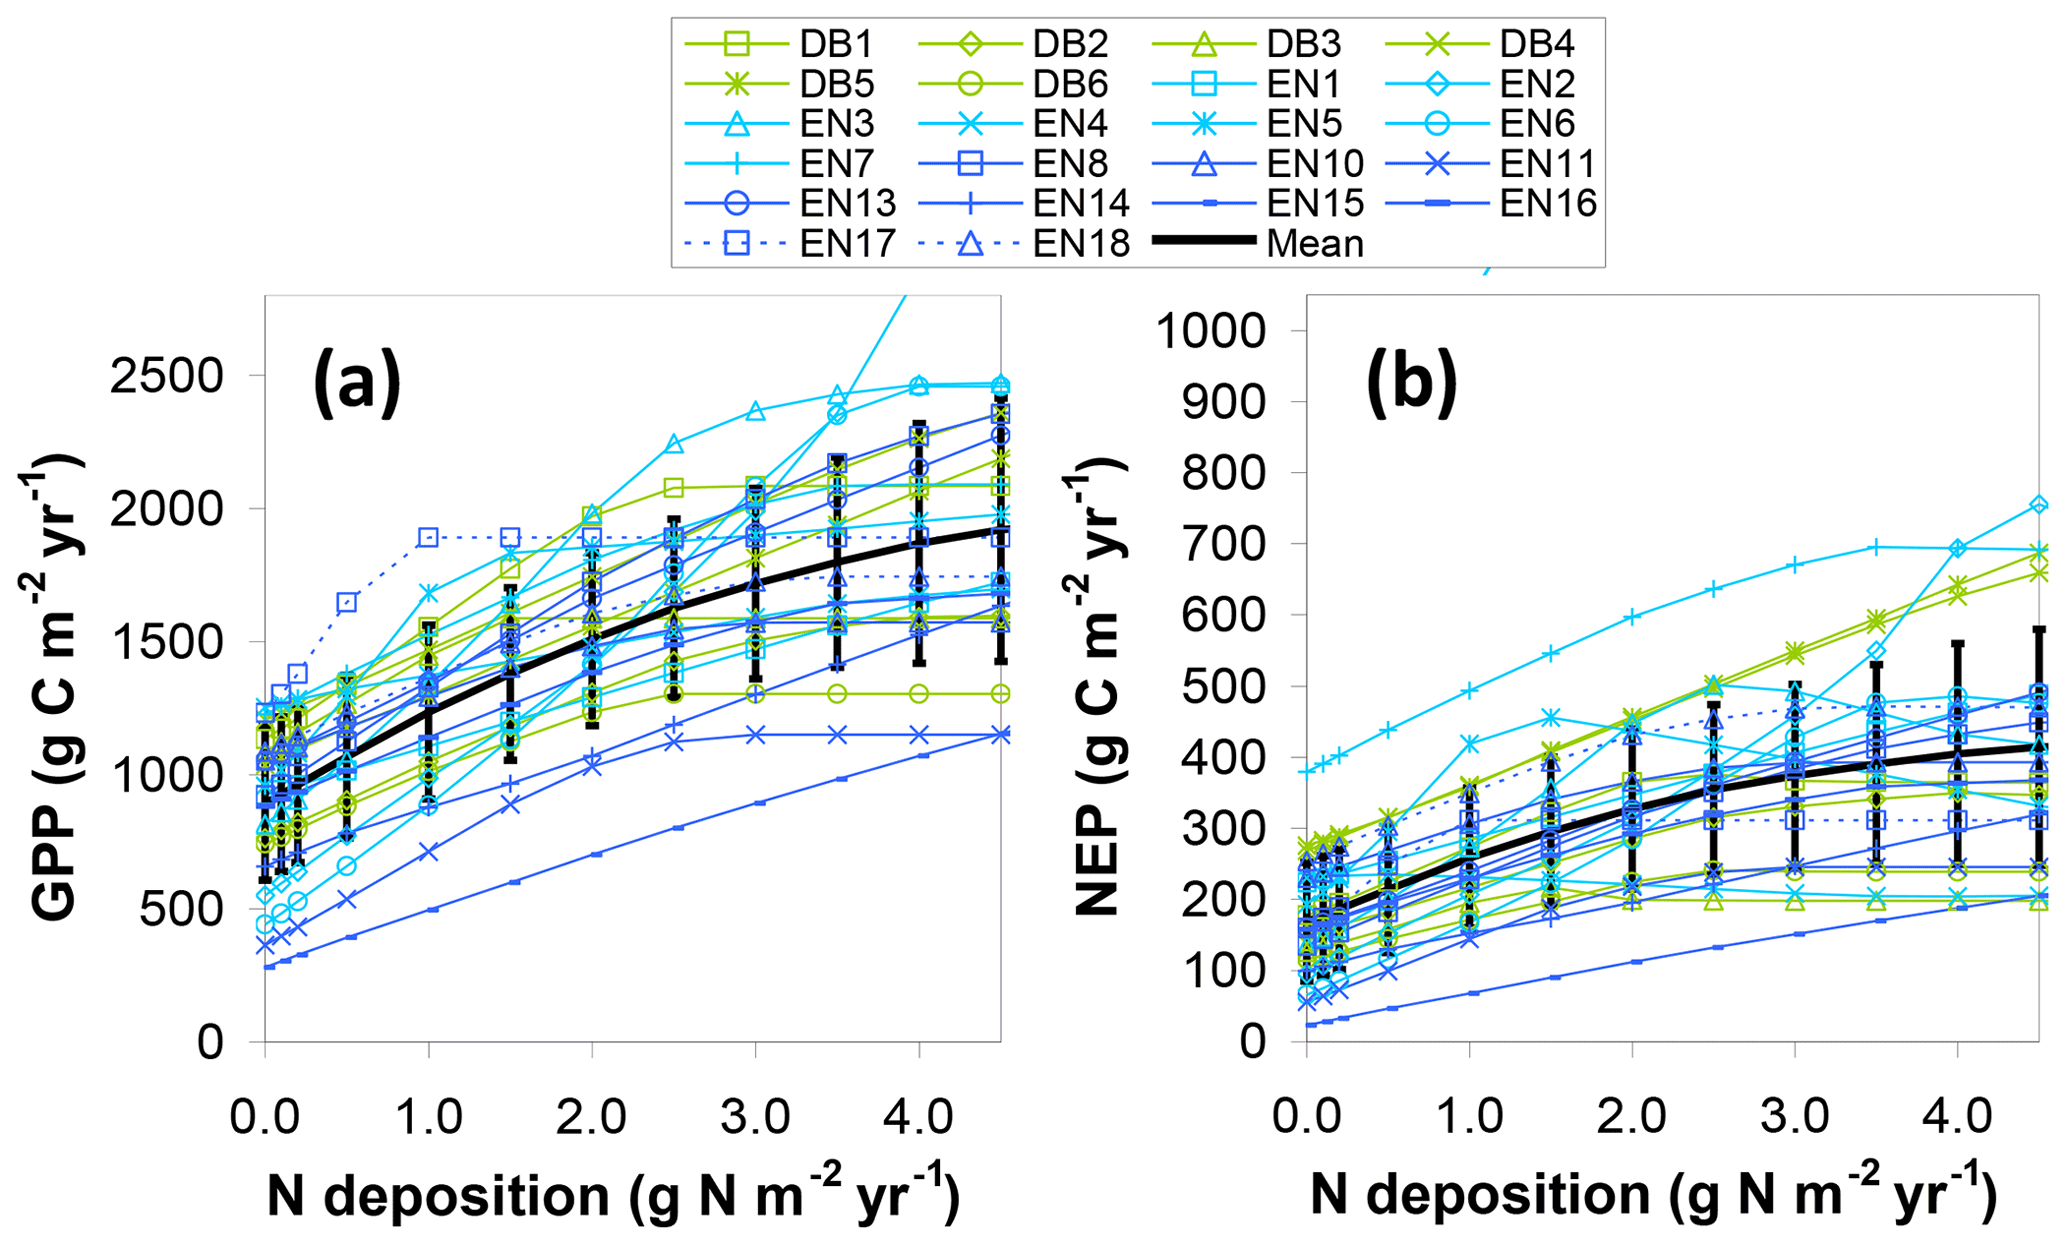
Figure 9Simulated BASFOR model sensitivity to N deposition of (a) gross primary productivity (GPP) and (b) net ecosystem productivity (NEP) for 22 forest sites (with mean ± standard deviation), derived from a purely modelled approach (not involving measured EC flux data). Each site was modelled using a range of Ndep values from 0 to 4.5 g N m−2 yr−1 (constant Ndep over the lifetime of the stands). DB: deciduous broadleaf; EN: coniferous evergreen needleleaf.
3.5 Response of net ecosystem productivity to Nr deposition
Similarly to GPP, the NEP and NECB responses to Ndep cannot be reliably inferred directly from EC flux network data given the large variability between sites in climate, soil type, age, and other constraints to photosynthesis and ecosystem respiration. However, plausible estimates can be obtained by applying a range of mean CSE indicators (as defined previously) to project the normalized GPP* responses to Ndep (Table 2). Carbon sequestration efficiencies for forests are confined to a narrow range (17 %–31 % of GPP, average μ=22 %, standard deviation σ=4 %) in model simulations over 5-year (no thinning) time horizons (Fig. 4); they vary considerably more in EC-based observations (range −9 % to 61 %, σ=17 %), but with a similar mean (μ=25 %). CSE metrics express the GPP fraction not being respired (Reco) or exported (CEXP) out of the ecosystem. Multiplied by the dGPP∕dNdep slope they provide estimates of the net ecosystem C gain per unit N deposited (Table 2).
Short-term (5-year) mean estimates for NEP responses, based on average CSE from both observations (CSEobs) and modelling (CSE5-year), and accounting for GPP climate/soil/age normalization, range from 41 to 47 g C per g N, averaged over all sites, or 51 to 57 g C per g N removing the four highest Ndep sites (middle part of Table 2). Predictably, lifetime estimates for dNECB∕dNdep responses are about 20 % smaller, on the order of 34–42 g C per g N. For comparison, the mean 5-year dNEP∕dNdep obtained directly by BASFOR modelling of Ndep scenarios for all sites (Fig. 9b) was larger (76±7 g C per g N) than the measurement-based, model-corrected estimates of Table 2.
If the forest NEP response to Ndep is calculated directly through simple linear or quadratic regression of NEPobs vs. Ndep (bottom part of Table 2), therefore not including any standardization of the data, the dC∕dN slope is much larger (178–224 g C per g N) within the Ndep range 0–2.5 g N m−2 yr−1. If all forest sites are considered (including N-saturated sites with Ndep up to 4.3 g N m−2 yr−1), the dC∕dN slope is much smaller (71–108 g C per g N), but this only reflects the reduced NEP observed at those elevated Ndep sites (see Fig. 4c in Flechard et al., 2020), with altogether very large scatter and very small R2. Equivalent figures for (not standardized) semi-natural NEP vs. Ndep appear to be significantly smaller (34–89 g C per g N) than in forests.
If the meta-modelling standardization procedure for climate, soil and age is attempted (for comparison only) directly on NEP, as opposed to the preferred procedure using GPP (Eq. 10–17), the simulated fCLIM, fSOIL and fAGE reduce the NEP response to Ndep by only 18 %, from 178 down to 146 g C per g N (bottom part of Table 2), while the equivalent reduction for GPP was 45 %. The resulting figure (112–146 g C per g N) is likely much overestimated, around a factor of 2–3 larger than those obtained through the stepwise method using . Standardization factors derived from BASFOR meta-modelling are more reliable for GPP than for NEP, since model performance is significantly better for GPP than for Reco and hence NEP (Fig. 6 in Flechard et al., 2020).
4.1 A moderate non-linear response of forest productivity to Nr deposition
The C sequestration response to Ndep in European forests was derived using a combination of flux-tower-based C and N exchange data and process-based modelling, while a number of previous studies have been based on forest inventory methods and stem growth rates (e.g. de Vries et al., 2009; Etzold et al., 2014). The main differences with previous meta-analyses that were also based on EC flux datasets (e.g. Magnani et al., 2007; Fleischer et al., 2013; Fernández-Martínez et al., 2014, 2017) were that (i) we derived total Ndep from local measurements of the wet and dry fractions as opposed to regional/global CTM outputs; (ii) we untangled the Ndep effect from climatic, soil and other influences by means of a mechanistic model, not through statistical methods; and (iii) in Flechard et al. (2020) we estimated ecosystem-level N, C and greenhouse gas (GHG) budgets calculated through a combination of local measurements, mechanistic and empirical models, and database and literature data mining.
Our most plausible estimates of the dC∕dN response of net productivity over the lifetime of a forest are of the order of 40–50 g C per g N on average over the network of sites included in the study (Table 2). Such values are broadly in line with the recent reviews by Erisman et al. (2011) and by Butterbach-Bahl et al. (2011) (range 35–65 g C per g N) but slightly larger than estimates given in a number of other studies (e.g. Liu and Greaver, 2009; de Vries et al., 2009, 2014a). Given the considerable uncertainty attached to these numbers (Table 2), they cannot be considered significantly different from any of those earlier studies. The meta-modelling-based approach we describe for normalizing forest productivity data to account for differences in climate, soil and age among sites reduces the net productivity response to Ndep by roughly 50 %, which is of the same order as the results (factor of 2–3 reduction) of a similar climate normalization exercise by Sutton et al. (2008). This means that not accounting for inter-site differences would have led to an overestimation of the dC∕dN slope by a factor of 2.
Observations and model simulations both indicate that the Nloss fraction of Nsupply increases with Ndep, consistent with widespread observations of increasing leaching above Ndep thresholds as low as 1.0 g N m−2 yr−1 in European forests (Dise and Wright, 1995; De Vries et al., 2007; Dise et al., 2009) and exacerbated by large C∕N ratios (>25) in the organic horizons (Gundersen et al., 1998; MacDonald et al., 2002). Higher thresholds for Ndep around 2.5 g N m−2 yr−1 (Dise and Wright, 1995; Van der Salm et al., 2007) typically indicate advanced saturation stages.
Thus, at many sites but especially those with Ndep > 1.5–2 g N m−2 yr−1, N availability is not limiting forest growth. In such cases it becomes meaningless to try to quantify a N fertilization effect. Indeed, despite large uncertainties in measured data and in model-derived normalization factors, the non-linear trend is robust, with dC∕dN values tending to zero in N-saturated forests (> 2.5–3 g N m−2 yr−1). In their review paper De Vries et al. (2014a) gave a range of Ndep levels varying between 1.5 and 3 g N m−2 yr−1, beyond which growth and C sequestration were not further increased or even reversed, as predicted in classical N saturation theory by Aber et al. (1989, 1998). These findings suggest that in areas of the world where Ndep levels are larger than 2.5–3 g N m−2 yr−1, which now occur increasingly in Asia, specifically in parts of China, Japan, Indonesia and India (Schwede et al., 2018), the forecast increased Nr emissions and increased Ndep levels may thus not have a positive impact on the continent's land-based CO2 sink. Data treatment and selection in our dataset (e.g. removal of N-saturated forests) strongly impacted the plausible range of dC∕dN responses (Table 2) derived from the original data. The non-linearity of ecosystem productivity relationships to Ndep (Butterbach-Bahl and Gundersen, 2011; Etzold et al., 2014) limits the usefulness and significance of simple linear approaches. These data suggest that there is no single dC∕dN figure applicable to all ecosystems and that the highly non-linear response depends on current and historical Ndep exposure levels, as well as on the degree of N saturation (Aber et al., 1989, 1998), although factors other than N, discussed later, may also be involved.
For the short semi-natural vegetation sites, included in the study as a non-fertilized, non-woody contrast to forests, the apparent impact of Ndep on GPPobs was of the same order as in forests but likely much smaller than in forests when considering NEPobs (Table 2). This is in principle consistent with the hypothesis (de Vries et al., 2009) that the ecosystem dC∕dN response may be larger in forests due to the large C∕N ratio (200–500) of above-ground biomass (stems and branches), where much of the C storage occurs (up to 60 %–80 % according to BASFOR, Fig. 5), whereas in semi-natural ecosystems C storage in SOM dominates, with a much lower C∕N ratio (10–40). However, this comparison of semi-natural versus forests is based on NEPobs that was not normalized for inter-site climatic and edaphic differences, since no single model was available to carry out a meta-modelling standardization for all the different semi-natural ecosystem types (peatland, moorland, fen, grassland), and therefore these values must be regarded as highly uncertain.
4.2 Limitations and uncertainties in the approach for quantifying the dC∕dN response
Monitoring atmospheric gas-phase and aerosol Nr contributed to reducing the large uncertainty in total Nr deposition at individual sites, because dry deposition dominates over wet deposition in most forests (Flechard et al., 2020), except at sites a long way from sources of atmospheric pollution, and because the uncertainty in dry deposition and its modelling is much larger (Flechard et al., 2011; Simpson et al., 2014). However, despite the considerable effort involved in coordinating the continental-scale measurement network (Tang et al., 2009), the number of forest sites in this study (31) was relatively small compared with other studies based on ICP (de Vries et al., 2009; ICP, 2019) or other forest growth databases, or global-scale FLUXNET data (hundreds of sites worldwide; see Burba, 2019). Thus, the gain in precision of Ndep estimates from local measurements was offset by the smaller population sample size. Nonetheless this study does show the added value of the Nr concentration monitoring exercise and the need to repeat and extend such initiatives.
Understanding, quantifying and reducing all uncertainties leading up to dC∕dN estimates are key issues to explore. Apart from measurement uncertainties in Nr deposition and losses, and in the C balance based on EC measurements, analysed in the companion paper, the major difficulties that arose when assessing the response to Ndep of forest productivity included the following:
- i.
The heterogeneity of the population of forests, climates and soils in the network, and the large number of potential drivers relative to the limited number of sites, hindered the use of a straightforward, regression-based analysis of observational data without a preliminary (model-based) harmonization.
- ii.
The model-based normalization procedure for GPP, used to factor out differences in climate, soil and age among sites, significantly amplified the noise in C–N relationships, an indication that the generalized modelled effects may not apply to all individual sites and that other important ecological determinants affecting forest productivity are missing in the BASFOR model.
- iii.
The EC measurement-based ratio of Reco to GPP () was very variable among forests (Flechard et al., 2020), and this high variability cannot be explained or simulated by the ecosystem model we used; i.e. more complex model parameterizations of Raut and Rhet may be required to better represent the diversity of situations and processes.
- iv.
Nitrogen deposition likely contributes a minor fraction (on average 20 % according to the model) of total ecosystem N supply (heavily dominated by soil organic N mineralization), except for the very high deposition sites (up to 40 %). The fraction of Ndep∕Nsupply may even be smaller considering the pool of DON (not included in BASFOR), from which bioavailable organic N forms may be taken up by trees in significant quantities in non-fertile, acidic organic soils (Jones and Kielland, 2002; Warren, 2014; Moreau et al., 2019). Thus, in many cases the Ndep fertilization effect may be marginal and difficult to detect, because it may be smaller than typical measurement uncertainties and noise in C and N budgets. Conversely, the effect may be delayed and may manifest even after Nr deposition levels have decreased, as the past N accumulation in soil may support later growth through enhanced N supply.
- v.
Non-linear biological controls that affect C–N relations but are not explicitly considered in the model. For example, BASFOR does consider that N addition can reduce below-ground C allocation (e.g. Högberg et al., 2010), resulting in decreased soil Raut and Rhet (Janssens et al., 2010), but does not account for the possible consequences of a stimulation of wood cell formation from mid-summer onwards and a delay in the cessation of tracheid production in late season (Kalliokoski et al., 2013).
A further limitation to our estimates of the dC∕dN response, based on the analysis of the spatial (inter-site) variability in C and N fluxes, is that these forests are not in steady state with respect to Nr deposition and ambient CO2. Some stands have been affected by, and may be slowly recovering from, excess Nr deposition in the second half of the 20th century, while the more remote sites may always have been N-limited. Figure 1 showed that the modelled GPP of the older forests increased through most of the 20th century but stabilized when Ndep started to decrease after the 1980s, while total N losses also declined over the last 2–3 decades. This is consistent with observations of decreasing N (nitrate) leaching at long-term study sites in the northeastern USA (Goodale et al., 2003; Bernal et al., 2012) and northern Europe (Verstraeten et al., 2012; Johnson et al., 2018; Schmitz et al., 2019).
In our model analysis, the declining trend in Nr deposition appears to be the primary driver for the modelled reduced N losses since the 1980s. This can be inferred from model input-sensitivity scenario runs shown in Figs. S9–S11 of the Supplement. In Fig. S9, a constant CO2 mixing ratio of 310 ppm (i.e. the mean value over the period 1900–2010), used instead of the exponential increase since the 19th century, does not greatly alter overall productivity patterns or the decreasing trend in N losses over the period 1980–2010 (Fig. S9e–f) compared with the baseline run (Fig. 1). By contrast, in scenarios shown in Figs. S10–S11, the assumed constant Ndep levels at all sites of 1.5 and 3.0 g N m−2 yr−1, respectively, together with the exponential CO2 increase, remove the decreasing trends in Nr losses over the period 1980–2010. Meanwhile, in constant Ndep scenarios the increase in GPP over the whole period is fairly monotonous, in response to a steadily increasing CO2 (Fig. S10b–c), without the inflexion point around 1980 simulated in the baseline run (Fig. 1b–d). In real-life stands, however, decadal decreases in N losses or exports have been observed without any significant reductions in Ndep (Goodale et al., 2003). Other potential factors such as increased denitrification, longer growing season, plant N accumulation, changes in soil hydrological properties or temperature, and historical disturbances, may also play a role (Bernal et al., 2012). Many such factors are not considered in our model, and neither is long-term climate change.
The EC-based flux data suggest that the Ndep response of forest productivity is clearer at the gross photosynthesis level, in patterns of (normalized) GPP differences among sites, than at the NEP level, where very large differences in CSE among sites lead to a decoupling of Ndep and NEP. The response of GPP to Ndep appeared to be reasonably well constrained by both EC flux measurements and BASFOR modelling, which is why we chose to normalize GPP and not NEP. The significantly better model performance obtained for GPP than for Reco and NEP (Fig. 6 in Flechard et al., 2020) likely reveals a relatively poor understanding and mathematical representation of Reco (especially for the soil heterotrophic and autotrophic components), as well as the factors controlling their variability among sites. The large unexplained variability in CSE and C sequestration potentials may also involve other limiting factors that could not be accounted for in our measurement/model analysis, since they are not treated in BASFOR. Such factors may be related to soil fertility, internal N supply, ecosystem health, tree mortality, insect or wind damages in the previous decade, and incorrect assumptions on historical forest thinning, all affecting general productivity patterns. Since the observed variability in CSE is key to understanding and quantifying the real-world NEP response to Ndep (beyond the relatively well constrained response of GPP in the model world), we explore some of the main issues in the following sections.
4.3 What drives the large variability in carbon sequestration efficiency?
Carbon sequestration efficiency metrics are directly and negatively related to the ratio of Reco to GPP, expressing the likelihood that one C atom fixed by photosynthesis will be sequestered in the ecosystem. Earlier FLUXNET-based statistical meta-analyses have demonstrated that although Reco is strongly dependent on temperature on synoptic or seasonal scales (Mahecha et al., 2010; Migliavacca et al., 2011), GPP is the key determinant of spatial variations in Reco (Janssens et al., 2001; Migliavacca et al., 2011; Chen et al., 2015) and, further, that the fraction of GPP that is respired by the ecosystem is highly variable (Fernández-Martínez et al., 2014) and more variable than in current model representations. We have used three different CSE indicators, averaged across all sites, to derive a NEP∕Ndep response from model-standardized GPP* data (Table 2). Values of CSEobs varied over a large range among sites (−9 % to 61 %, Fig. 10). Some of the variability might be due to measurement errors, but small (<10 %) or large (>40 %) CSEobs values could also genuinely reflect the influence or the absence of ecological limitations related to nutrient availability or vegetation health.

Figure 10Variability of observation-based (obs) and modelled (mod) carbon sequestration efficiency (CSE) defined as the ratio of net ecosystem productivity (NEP) to gross primary productivity (GPP), calculated over a ∼5-year measurement period. The data are plotted versus (a) topsoil organic carbon content (SOC), (b) topsoil C∕N ratio, (c) topsoil pH, (d) forest stand age and (e) nitrogen deposition (Ndep). DBF: deciduous broadleaf forests; ENF: coniferous evergreen needleleaf forests; MF: mixed needleleaf–broadleaf forests; EBF: Mediterranean evergreen broadleaf forests.
4.3.1 From nutrient limitation to nitrogen saturation
Can nutrient limitation (nitrogen or otherwise) impact ecosystem carbon sequestration efficiency? Soil fertility has been suggested to be a strong driver at least of the forest biomass production efficiency (BPE), defined by Vicca et al. (2012) as the ratio of biomass production to GPP, with BPE increasing in their global dataset of 49 forests from 42 % to 58 % in soils with low to high nutrient availability, respectively. The study by Fernández-Martínez et al. (2014) of 92 forest sites around the globe reported a large variability in CSE ( calculated from FLUXNET flux data), which they suggest is strongly driven by ecosystem nutrient availability (ENA), with CSE levels below 10 % in nutrient-poor forests and above 30 % in nutrient-rich forests. The range of CSE values derived from flux measurements in our study (CSEobs in Table 2) was similarly large, even though all of our sites were European and our dataset size was one-third of theirs (N=31, with 26 sites in common with Fernández-Martínez et al., 2014). We did not attempt in this study to characterize a general indicator of ENA beyond total Nr deposition; but if we use the high, medium or low (H, M, L) scores of ENA attributed to each site through factor analysis of nutrient indicators by Fernández-Martínez et al. (2014), we find that the H group (7 sites) has a mean CSEobs of 32 % (range 16 %–48 %), the M group is slightly higher (7 sites, mean 39 %, range 21 %–61 %) and the L group has indeed a significantly smaller mean CSEobs of 14 % (12 sites, range −9 % to 38 %). Interestingly, the mean Ndep levels for each group are H = 1.5 g N m−2 yr−1 (range 0.5–2.3 g N m−2 yr−1), M = 2.1 g N m−2 yr−1 (range 1.1–4.2 g N m−2 yr−1) and L = 1.3 g N m−2 yr−1 (range 0.3–4.1 g N m−2 yr−1); i.e. the highest mean CSEobs of the three groups is found in the group with the highest mean Ndep (M).
The nutrients and other indicators of fertility considered by Fernández-Martínez et al. (2014) included, in addition to N, P, soil pH, C∕N ratios and cation exchange capacity, as well as soil texture and soil type. However, very few sites were fully documented (see their Supplement Table S1), data were often qualitative and other key nutrients were not included in the analysis (K, Mg and other cations; S also has been suggested to have become a limiting factor for forest growth following emission reductions; see Fernández-Martínez et al., 2017). The extent to which the overall fertility indicator quantified by ENA was driven by nitrogen in the Fernández-Martínez et al. (2014) factor analysis is not evident. At sites where other nutrients are limiting, the response to N additions would be small or negligible regardless of whether N itself is limiting. This places severe constraints on the interpretation of productivity data in response to Ndep, since most current models, which do not account for other nutrient limitations, cannot be called upon to normalize for differences between sites.
The impact of the fertility classification on CSE of the sites included in Fernández-Martínez et al. (2014) was questioned by Kutsch and Kolari (2015) on the basis of unequal quality of the EC flux datasets found in FLUXNET and other databases. By excluding complex terrain sites (and young forests) from the Fernández-Martínez et al. (2014) dataset, Kutsch and Kolari (2015) calculated a much reduced variability in CSE, with a reasonable mean value of 15 % (range 0 %–30 %), suggesting a much lower influence of nutrient status than claimed by Fernández-Martínez et al. (2014). In their reply, Fernández-Martínez et al. (2015) reanalysed the same subset of sites selected by Kutsch and Kolari (2015) but using the same generalized linear model as used in their original analysis of the whole dataset as opposed to the linear model used by Kutsch and Kolari (2015). Fernández-Martínez et al. (2015) then maintained that the findings of the original study were still valid for the restricted dataset, i.e. that the nutrient status had a significant influence on CSE.
The smaller European dataset of our study poses a similar dilemma. The much wider variation in CSEobs than modelled CSE5-year may both point to possible measurement issues if CSEobs values (especially the larger ones) are considered ecologically implausible and/or inform on important ecological processes that are not accounted for in the model. Among the forests in our study that seemed particularly inefficient (CSEobs<10 %) at retaining photosynthesized carbon (EN4, EN6, EN8, EN11, EN17, EB5), all were classified as L (low ENA) in Fernández-Martínez et al. (2014) and two (EN6, EN11) were even net C sources (Reco>GPP). The EN4, EN6, EN17 sites had the three largest soil organic contents (SOCs, Fig. 10a), which may either have induced larger rates of heterotrophic respiration or may instead indicate low-fertility wet soils where both assimilation and respiration are suppressed. However, EN4 has also been reported as having unrealistically large ecosystem respiration rates (Anthoni et al., 2004). The EN8 site (mature pine-dominated forest in Belgium) was very unlikely to be N- or S-limited, having been under the high-deposition footprint of the Antwerp petrochemical harbour and local intensive agriculture for decades, even if emissions have declined over the last 20 years (Neirynck et al., 2007, 2011). However, the comparatively low LAI, GPP and CSE (Fig. 4 in Flechard et al., 2020) at this site are likely not independent of the historical N- and S-induced soil acidification, which has worsened the already low P and Mg availabilities (Janssens et al., 1999) and from which the forest is only slowly recovering (Neirynck et al., 2002; Holmberg et al., 2018). This site is actually an excellent example to illustrate the complex web of biogeochemical and ecological interactions, which further complicate the quantification of the (single-factor) Ndep impact on C fluxes. By not accounting for the low Mg and P availabilities and the poor ecosystem health, the BASFOR model massively overestimated GPP, Reco and NEP at EN8 (Fig. 6 in Flechard et al., 2020). In fact, based on prior knowledge of this site's acidification history, and since such mechanisms and impacts are not mathematically represented in BASFOR, EN8 was from the start discarded from the calibration dataset for the Bayesian procedure (Cameron et al., 2018). The four lowest CSEobs values were found at sites with topsoil pH < 4 (Fig. 10c), although other forests growing on acidic soils had reasonably large CSEobs ratios.
The large variability in CSEobs cannot be explained by any single edaphic factor (Fig. 10a–c), more likely by a combination of many factors that may include Ndep (Fig. 10e). As noted previously, C flux measurements at all four forest sites with Ndep>2.5 g N m−2 yr−1 (EN2, EN8, EN15, EN16) indicated lower productivity estimates than those in the intermediate Ndep range, or at least smaller than might have been expected from a linear N fertilization effect (Fig. 4 in Flechard et al., 2020). EN2 (spruce forest in southern Germany) is also well-documented as an N-saturated spruce forest with large total N losses (∼3 g N m−2 yr−1) as NO, N2O and (Kreutzer et al., 2009), but its productivity and CSE are not affected to the same extent as EN8. Not all the difference is necessarily attributable to the deleterious impacts of excess Nr deposition, as suggested by the GPP normalization exercise (Fig. 8). For example, EN15 and EN16, planted on sandy soils, appear from meta-modelling to suffer from water stress comparatively more than the average of all sites (Fig. 6-Soil), if indicators of soil water retention based on estimates of soil depth, field capacity and wilting point can be considered reliable.
4.3.2 Forest age
Forest age is expected to affect photosynthesis (GPP), growth (NPP), carbon sequestration (NEP) and CSE for many reasons. A traditional view of the effect of stand age on forest NPP (Odum, 1969) postulated that Raut increases with age and eventually nearly balances a stabilized GPP, such that NPP approaches zero upon reaching a dynamic steady state. Revisiting the paradigm, Tang et al. (2014) found that NPP did decrease with age (>100 years) in boreal and temperate forests, but the reason was that both GPP and Raut declined, with the reduction in forest growth being primarily driven by GPP, which decreased more rapidly with age than Raut after 100 years. However, the ratio NPP∕GPP remained approximately constant within each biome.
The effect of age on NEP and CSE is even more complex since this involves not only changing successional patterns of GPP and Raut, but also those of Rhet over a stand rotation of typically one century or more, which is much longer than the longest available flux datasets. Therefore age effects are often studied by comparing differently aged forest sites across the world, which introduces many additional factors of variation, including differences in water availability; soil fertility; or even tree species, genera, or PFTs. Forest and tree ages should in theory be normalized to account for species-specific ontogeny patterns; i.e. the age of 80 years may be relatively young for some species and quite old for others, and therefore population dynamics may be very different for the same age. Nevertheless, forest age has been suggested to be a dominant factor controlling the spatial and temporal variability in forest NEP at the global scale, compared with abiotic factors such as climate, soil characteristics and nutrient availability (Besnard et al., 2018). In that study, the multivariate statistical model of NEP, using data from 126 forest eddy-covariance flux sites worldwide, postulated a non-linear empirical relationship of NEP to age, adapted from Amiro et al. (2010), whereby NEP was negative (a net C source) for only a few years after forest establishment and then increased sharply above 0 (a net C sink), stabilized after around 30 years and remained at that level thereafter for mature forests (>100 years). This model, therefore, did not assume any significant reduction in forest net productivity after maturity, up to 300 years, consistent with several synthesis studies that have reported significant NEP of centuries-old forest stands (Buchmann and Schulze, 1999; Kolari et al., 2004; Luyssaert et al., 2008).
By analogy, our approach for accounting for the age effect was based on the modelled time course of GPP (Eqs. 16–17), which in the BASFOR model tended to stabilize after 100 years, and subsequently used a mean CSE that did not depend on stand age. However, the variability in CSEobs appeared to be much larger in mature forests (>80 years) than in the younger stands (Fig. 10d). For the younger forests (<60 years, all sites probably still in an aggrading phase), the CSEobs values were in a narrow band of 15 %–30 % and were well represented by model simulations, with the exceptions of EN1 and EB3 at around 50 % and of EN4 being near 0 % (with all three locations being high-elevation sites with complex terrain and potential EC measurement issues; see Flechard et al., 2020). By contrast, values for mature forests were either below 15 % or above 30 %. For some cold sites such as EN6 and EN11, growing in low-nutrient environments (e.g. peat at EN6) with high SOC (Fig. 10a) and/or high soil C∕N ratio (Fig. 10b) and low soil pH (Fig. 10c), or for the N-saturated and acidified EN8 site, the low CSE is not necessarily linked to age. Ageing, senescence and acidification may at some point curb sequestration efficiency in older forests, but even excluding the complex terrain sites, there remain a good number of productive mature sites with CSEobs in the range 30 %–40 %, which questions the Odum (1969) paradigm of declining net productivity and C equilibrium in old forests.
4.3.3 Does nitrogen deposition impact soil respiration?
The overall net effect of Nr deposition on carbon sequestration must include not only productivity gains, but also indirect, positive or negative impacts on soil C losses, which all affect CSE. Carbon sequestration efficiency reflects the combined magnitudes of soil heterotrophic (Rhet) and autotrophic (Raut, both below- and above-ground) respiration components, relative to GPP. We postulated that the primary effect of Ndep and Nsupply is on GPP, but potential side effects of Ndep or N additions on ecosystem and soil carbon cycling have been postulated. The traditional theory of the role of N on microbial decomposition of SOM was that, above a certain C∕N threshold value, the lack of N inhibits microbial activity compared with lower C∕N ratios (Alexander, 1977). However, reviews by Fog (1988) and Berg and Matzner (1997) found that microbial activity was often unaffected, or even negatively affected, by the addition of N to low-N decomposing organic material. The negative effects were mostly found for recalcitrant organic matter (high lignin content) with a high C∕N ratio (e.g. wood or straw), while N addition to easily degradable organic matter with a low C∕N ratio (e.g. leaf litter with low lignin content) actually boosted microbial activity. The meta-analysis by Janssens et al. (2010) of N manipulation experiments in forests suggests that excess Nr deposition reduces soil – especially heterotrophic – respiration in many temperate forests. They argue that the mechanisms include (i) a decrease in below-ground C allocation and the resulting root respiration, permitted by a lesser need to develop the rooting system when more N is available (see also Alberti et al., 2015); (ii) a reduction in the activity, diversity and biomass of rhizospheric mycorrhizal communities (see also Treseder, 2008); (iii) a reduction in the priming effect, the stimulation of SOM decomposition by saprotrophic organisms through root and mycorrhizal release of energy-rich organic compounds; (iv) N-induced shifts in saprotrophic microbial communities, leading to reduced saprotrophic respiration; and (v) increased chemical stabilization of SOM into more recalcitrant compounds. The authors point out that in N-saturated forests different processes and adverse effects are at play (e.g. base cation leaching and soil acidification). Of the five aforementioned mechanisms potentially involved in the suppression of soil respiration by N addition, only the first one (control by N availability of the root/shoot allocation ratio) is functional in BASFOR, and therefore our simulations do not include the other inhibitory effects of excess N on mycorrhizal, fungal and bacterial respiration.
An important implication of the negative impact of Nr on soil respiration is that the nitrogen fertilization effect on gross photosynthesis would be roughly doubled, in terms of C sequestration, by the concomitant decrease in soil respiration. In their meta-analyses of N addition experiments in forests and comparison of sites exposed to low vs. elevated Ndep, Janssens et al. (2010) show that both Rhet and soil carbon efflux (SCE), a proxy for total Rsoil (), tend to decline with N addition, be it through fertilization or atmospheric deposition, although the effect is far from universal. The negative Ndep response of Rhet was much more pronounced for SOM than for leaf litter and stronger at highly productive sites than at less productive sites. The negative impact on SCE was mostly found at sites where N was not limiting for photosynthesis. When N is strongly limiting, and in young forests, Nr deposition may well favour SOM decomposition.
To examine the potential impact of Ndep on Rsoil, we compiled the soil respiration data available from the literature and databases for the collection of forest sites in our study, which covers the whole N limitation to N saturation spectrum. Sites ranged from highly N limited boreal systems, where an N addition might trigger enhanced tree growth, increased microbial biomass and heterotrophic respiration, to N-saturated, acidified systems (EN2, EN8, possibly also EN15, EN16), in which poor ecosystem and soil health may lead to different ecological responses than those of the below-ground carbon-cycling scheme in Janssens et al. (2010).
Since the below-ground autotrophic (root and rhizosphere) respiration component is regulated to a large extent by photosynthetic activity (Collalti and Prentice, 2019), as well as seasonality in below-ground C allocation (Högberg et al., 2010), and contributes a large part of Rsoil on an annual basis (Korhonen et al., 2009), the relationship of Rsoil to Ndep is examined by first normalizing to GPP (Fig. 11a), yielding a soil respiration metric that is comparable between sites (for Rsoil data, see Table S7 in the Supplement to Flechard et al., 2020). Similarly, the ratio Rsoil∕Reco shows the relative contribution of below-ground to total (ecosystem) respiration (Fig. 11c). Note that caution is needed when considering both Rsoil∕GPP and Rsoil∕Reco ratios, since significant uncertainty may arise from (i) methodological flaws in comparing chamber versus eddy covariance measurements (e.g. considerations over tower footprint, spatial heterogeneity and representativeness of soil collars), (ii) uncertainty in deriving GPP and Reco estimates from EC-NEE measurements, and (iii) different time spans for the EC and soil chamber measurements, affected by inter-annual flux variability. Thus, values of Rsoil∕Reco above unity (Fig. 11c), although physically nonsensical, do not necessarily imply large measurement errors but possibly also that there may be no spatial or temporal coherence in EC and chamber data (Luyssaert et al., 2009).

Figure 11Variability of normalized soil respiration metrics as a function of nitrogen deposition (a, c, e) and soil organic carbon (b, d, f). In all plots, the colour scale indicates mean annual temperature (MAT), and the symbol size is proportional to mean annual precipitation (MAP). Rsoil: total soil respiration; Reco: total ecosystem respiration; Rhet: heterotrophic component of Rsoil; GPP: gross primary productivity. DB: deciduous broadleaf; EN: coniferous evergreen needleleaf; EB: Mediterranean evergreen broadleaf; MF: mixed needleleaf–broadleaf forests.
Either ignoring such outliers or judging that a measurement bias by soil chambers affects all sites the same way (e.g. systematic overestimation of soil respiration in low-turbulence conditions when using static chambers, Brændholt et al., 2017), we may argue that the apparent decrease in both chamber ∕ EC ratios Rsoil ∕ GPP and Rsoil ∕ Reco with Ndep (Fig. 11a, c) has some reality, even if their absolute values are biased. Soil CO2 efflux tends to be a larger fraction of GPP (>0.5) at the smaller Ndep rates (<1.5 g N m−2 yr−1) than at sites with larger Ndep, where this fraction is more often in the range 0.4–0.5. It is also noteworthy that the largest Rsoil ∕ GPP ratios (EN5, EN17) are found at sites with relatively large SOC and topsoil C∕N ratio compared with the other sites (Figs. 10a and 11b). The Rhet ∕ Rsoil ratio also tends to decrease with Ndep (Fig. 11e), and although measured by different methods at the different sites, this is arguably a more robust metric than chamber ∕ EC respiration ratios, because the differential respiration measurements on control and treatment plots (root exclusion, trenching, girdling) are made on the same spatial and temporal scales.
Many other factors that impact soil respiration (age, soil pH, microbial abundance and diversity, etc.) are not considered here and are beyond the scope of this paper. In view of these uncertainties, if the assessment within this restricted dataset does not provide full and incontrovertible proof of the negative impact of Nr deposition on soil respiration, it at least is not in open contradiction to the prevailing paradigm that both below-ground autotrophic and heterotrophic respiration are expected to decrease as Nr deposition increases. However, the decreasing trends observed in Fig. 11a, c and e are largely driven by these few high-Ndep sites (>3 g N m−2 yr−1) in which the negative effects of N saturation and acidification very likely outweigh the benefits of reduced soil respiration in terms of C sequestration.
The magnitude of the mean Nr deposition-induced fertilization effect on forest C sequestration, derived here from eddy covariance flux data from a diverse range of European forest sites, is of the order of 40–50 g C per g N and comparable with current estimates obtained from inventory data and deposition rates from continental-scale deposition modelling used in the most recent studies and reviews. The range of dC∕dN values is a consequence of where in the ecosystem the Nr-induced carbon sequestration takes place, whether there are Nr losses and how other environmental conditions affect growth. However, this mean dC∕dN response should be taken with caution for several reasons. First, uncertainties in our dC∕dN estimates are large, partly because of the relatively small number of sites (31) and their large diversity in terms of age, species, climate, soils, and possibly fertility and nutrient availability. Second, adopting a mean overall dC∕dN response universally and regardless of the context may be misleading due to the clear non-linearity in the relationship between forest productivity and the level of Nr deposition; i.e. the magnitude of the response changes with the N status of the ecosystem. Beyond a Nr deposition threshold of 1–2 g N m−2 yr−1 the productivity gain per unit Nr deposited from the atmosphere starts to decrease significantly. Above 2.5 g N m−2 yr−1, productivity actually decreases with further Nr deposition additions, and this is accompanied by increasingly large ecosystem Nr losses, especially as leaching. Further sources of uncertainty in our forest ecosystem model involve missing – but possibly large – terms of the N cycle, such as N2 fixation, N2 loss by denitrification, DON uptake by trees and DON leaching.
Ecosystem meta-modelling was required to factor out the effects of climate, soil water retention and age on forest productivity, a necessary step before estimating a generalized response of C storage to Nr deposition. Neglecting these effects would lead to a large overestimation (factor of 2) of the dC∕dN effect in this European dataset and possibly also in other datasets worldwide. After factoring out the effects of climate, soil water retention and forest age in the present dataset, only part of the non-linearity was removed and there was still a decline in the dC∕dN response with increasing Ndep. One possible interpretation is that the remaining non-linearity may be regarded as an indicator of the impact of increasing severity of N saturation on ecosystem functioning and forest growth. However, the results also show that the large inter-site variability in carbon sequestration efficiency, here defined at the ecosystem scale and observed in flux data, cannot be entirely explained by the processes represented in model we used. This is likely due in part to an incomplete understanding and oversimplified model representation of plant carbon relations, soil heterotrophic and autotrophic respiration, the response to nitrogen deposition of physiological processes such as stomatal conductance and water-use efficiency, and possibly also because other nutrient limitations were insufficiently documented at the monitoring sites and not accounted for in the model.
The data used in this study are publicly available from online databases and from the literature as described in the “Materials and methods” section.
The codes of models and other software used in this study are publicly available online as described in the “Materials and methods” section.
The supplement related to this article is available online at: https://doi.org/10.5194/bg-17-1621-2020-supplement.
CRF, MvO, DRC, WdV, MAS and AI conceived the paper; CRF performed the data analyses, ran model simulations and wrote the text; MvO and DRC wrote and provided the BASFOR model code and performed the Bayesian calibration; MAS, EN, UMS, KBB, and WdV conceived or designed the NEU study; AI, NB, IAJ, JN, LM, AV, DL, ArL, KZ, MaA, MiA, BHC, JD, WE, RJ, WLK, AnL, BL, GM, VM, JO, MJS, TV, CV, KBB and UMS provided eddy covariance and/or other field data, or contributed to data collection from external databases and literature; MvO, DRC, WdV, AI, MAS, NB, NBD, IAJ, JN, LM, AV, DL, ArL, KZ, AJF, RJ, AN, EN and UMS contributed substantially to discussions and revisions.
The authors declare that they have no conflict of interest.
The authors gratefully acknowledge financial support by the European Commission through the two FP6 integrated projects CarboEurope-IP (project no. GOCE-CT-2003-505572) and NitroEurope Integrated Project (project no. 017841), the FP7 ECLAIRE project (grant agreement no. 282910), and the ABBA COST Action ES0804. We are also thankful for funding from the French GIP-ECOFOR consortium under the F-ORE-T forest observation and experimentation network, as well as from the MDM-2017-0714 Spanish grant. We are grateful to Janne Korhonen, Mari Pihlatie and Dave Simpson for their comments on the paper. Finalization of the paper was supported by the UK Natural Environment Research Council award number NE/R016429/1 as part of the UK-SCAPE programme delivering national capability. We also wish to thank two anonymous referees for their constructive criticism of the paper.
This research has been supported by the European Commission's Sixth Framework Programme (grant nos. 017841 and GOCE-CT-2003-505572) and European Commission's Seventh Framework Programme (ECLAIRE, grant no. 282910).
This paper was edited by Sönke Zaehle and reviewed by two anonymous referees.
Aber, J. D., Nadelhoffer, K. J., Steudler, P., and Melillo, J. M.: Nitrogen Saturation in Northern Forest Ecosystems: Excess nitrogen from fossil fuel combustion may stress the biosphere, BioScience, 39, 378–386, https://doi.org/10.2307/1311067, 1989.
Aber, J., McDowell, W., Nadelhoffer, K., Magill, A., Berntson, G., Kamakea, M., McNulty, S., Currie, W., Rustad, L., and Fernandez, I.: Nitrogen Saturation in Temperate Forest Ecosystems, BioScience, 48, 921–934, https://doi.org/10.2307/1313296, 1998.
Alberti, G., Vicca, S., Inglima, I., Belelli-Marchesini, L., Genesio, L., Miglietta, F., Marjanovic, H., Martinez, C., Matteucci, G., D'Andrea, E., Peressotti, A., Petrella, F., Rodeghiero, M., and Cotrufo, M. F.: Soil C : N stoichiometry controls carbon sink partitioning between above-ground tree biomass and soil organic matter in high fertility forests, iForest, 8, 195–206, https://doi.org/10.3832/ifor1196-008, 2015.
Alexander, M.: Introduction to soil microbiology, 2nd Edn., John Wiley and Sons, London, 467 pp., 1977.
Amiro, B. D., Barr, A. G., Barr, J. G., Black, T. A., Bracho, R., Brown, M., Chen, J., Clark, K. L., Davis, K. J., Desai, A. R., Dore, S., Engel, V., Fuentes, J. D., Goldstein, A. H., Goulden, M. L., Kolb, T. E., Lavigne, M. B., Law, B. E., Margolis, H. A., Martin, T., McCaughey, J. H., Misson, L., Montes-Helu, M., Noormets, A., Randerson, J. T., Starr, G., and Xiao, J.: Ecosystem carbon dioxide fluxes after disturbance in forests of North America, J. Geophys. Res., 115, G00K02, https://doi.org/10.1029/2010JG001390, 2010.
Anthoni, P. M., Knohl, A., Rebmann, C., Freibauer, A., Mund, M., Ziegler, W., Kolle, O., and Schulze, E. D.: Forest and agricultural land-use-dependent CO2 exchange in Thuringia, Germany, Glob. Change Biol., 10, 2005–2019, https://doi.org/10.1111/j.1365-2486.2004.00863.x, 2004.
Aubinet, M. A., Grelle, A., Ibrom, A., Rannik, Ü., Moncrieff, J., Foken, T., Kowalski, T. A. S., Martin, P. H., Berbigier, P., Bernhofer, C., Clement, R., Elbers, J., Granier, A., Grünwald, T., Morgenstern, K., Pilegaard, K., Rebmann, C., Snijders, W., Valentini, R., and Vesala, T.: Estimates of the annual net carbon and water exchange of forests: The EUROFLUX methodology, Adv. Ecol. Res., 30, 113–175, https://doi.org/10.1016/S0065-2504(08)60018-5, 2000.
BASFOR (BASic FORest ecosystem model): available at: https://github.com/MarcelVanOijen/BASFOR (last access: 22 August 2019), 2016.
Berg, B. and Matzner, E.: Effect of N deposition on decomposition of plant litter and soil organic matter in forest systems, Environ. Rev., 5, 1–25, https://doi.org/10.1139/a96-017, 1997.
Bernal, S., Hedin, L. O., Likens, G. E., Gerber, S., and Buso, D. C.: Complex response of the forest nitrogen cycle to climate change, P. Natl. Acad. Sci. USA, 109, 3406–3411, https://doi.org/10.1073/pnas.1121448109, 2012.
Besnard, S., Carvalhais, N., Arain, A., Black, A., de Bruin, S., Buchmann, N., Cescatti, A., Chen, J., Clevers, J. G. P. W., Desai, A. R., Gough, C. M., Havrankova, K., Herold, M., Hörtnagl, L., Jung, M., Knohl, A., Kruijt, B., Krupkova, L., Law, B. E., Lindroth, A., Noormets, A., Roupsard, O., Steinbrecher, R., Varlagin, A., Vincke, C., and Reichstein, M.: Quantifying the effect of forest age in annual net forest carbon balance, Environ. Res. Lett., 13, 124018, https://doi.org/10.1088/1748-9326/aaeaeb, 2018.
Brændholt, A., Steenberg Larsen, K., Ibrom, A., and Pilegaard, K.: Overestimation of closed-chamber soil CO2 effluxes at low atmospheric turbulence, Biogeosciences, 14, 1603–1616, https://doi.org/10.5194/bg-14-1603-2017, 2017.
Buchmann, N. and Schulze, E.-D.: Net CO2 and H2O fluxes of terrestrial ecosystems, Global Biogeochem. Cy., 13, 751–760, https://doi.org/10.1029/1999GB900016, 1999.
Burba, G.: Illustrative Maps of Past and Present Eddy Covariance Measurement Locations: II. High-Resolution Images, https://www.researchgate.net/publication/335004533_Illustrative_Maps_of_Past_and_Present_Eddy_Covariance_Measurement_Locations_II_High-Resolution_Images, last access: 22 August 2019.
Butterbach-Bahl, K. and Gundersen, P.: Nitrogen processes in terrestrial ecosystems, in: The European Nitrogen Assessment, edited by: Sutton, M., Howard, C. M., Erisman, J. W., Billen, G., Bleeker, A., Grennfelt, P., van Grinsven, H., and Grizzetti, B., Cambridge University Press, Cambridge, UK, 99–125, available at: http://www.nine-esf.org/files/ena_doc/ENA_pdfs/ENA_c6.pdf (last access: 22 August 2019), 2011.
Cameron, D. R., Van Oijen, M., Werner, C., Butterbach-Bahl, K., Grote, R., Haas, E., Heuvelink, G. B. M., Kiese, R., Kros, J., Kuhnert, M., Leip, A., Reinds, G. J., Reuter, H. I., Schelhaas, M. J., De Vries, W., and Yeluripati, J.: Environmental change impacts on the C- and N-cycle of European forests: a model comparison study, Biogeosciences, 10, 1751–1773, https://doi.org/10.5194/bg-10-1751-2013, 2013.
Cameron, D., Flechard, C., and Van Oijen, M.: Calibrating a process-based forest model with a rich observational dataset at 22 European forest sites, Biogeosciences Discuss., https://doi.org/10.5194/bg-2018-156, 2018.
Chapin, F. S., Woodwell, G. M., Randerson, J. T., Rastetter, E. B., Lovett, G. M., Baldocchi, D. D., Clark, D. A., Harmon, M. E., Schimel, D. S., Valentini, R., Wirth, C., Aber, J. D., Cole, J. J., Goulden, M. L., Harden, J. W., Heimann, M., Howarth, R. W., Matson, P. A., McGuire, A. D., Melillo, J. M., Mooney, H. A., Neff, J. C., Houghton, R. A., Pace, M. L., Ryan, M. G., Running, S. W., Sala, O. E., Schlesinger, W. H., and Schulze, E.-D.: Reconciling carbon-cycle concepts, terminology, and methods, Ecosystems, 9, 1041–1050, https://doi.org/10.1007/s10021-005-0105-7, 2006.
Chen, Z., Yu, G., Zhu, X., Wang, Q., Niu, S., and Hu, Z.: Covariation between gross primary production and ecosystem respiration across space and the underlying mechanisms: a global synthesis, Agr. Forest Meteorol., 203, 180–190, 2015.
Ciais, P., Sabine, C., Bala, G., Bopp, L., Brovkin, V., Canadell, J., Chhabra, A., DeFries, R., Galloway, J., Heimann, M., Jones, C., Le Quéré, C., Myneni, R. B., Piao, S., and Thornton, P.: Carbon and Other Biogeochemical Cycles, in: Climate Change 2013: The Physical Science Basis. Contribution of Working Group I to the Fifth Assessment Report of the Intergovernmental Panel on Climate Change, edited by: Stocker, T. F., Qin, D., Plattner, G.-K., Tignor, M., Allen, S. K., Boschung, J., Nauels, A., Xia, Y., Bex, V., and Midgley, P. M., Cambridge University Press, Cambridge, UK and New York, NY, USA, 465–570, available at: https://www.ipcc.ch/report/ar5/wg1/carbon-and-other-biogeochemical-cycles/ (last access: 22 August 2019), 2013.
Collalti, A. and Prentice, I. C.: Is NPP proportional to GPP? Waring's hypothesis 20 years on, Tree Physiol., 39, 1473–1483, https://doi.org/10.1093/treephys/tpz034, 2019.
De Schrijver, A., Verheyen, K., Mertens, J., Staelens, J., Wuyts, K., and Muys, B.: Nitrogen saturation and net ecosystem production, Nature, 451, E1, https://doi.org/10.1038/nature06578, 2008.
De Vries, W., van der Salm, C., Reinds, G. J., and Erisman, J. W.: Element fluxes through European forest ecosystems and 1205 their relationships with stand and site characteristics, Environ. Pollut., 148, 501–513, https://doi.org/10.1016/j.envpol.2006.12.001, 2007.
De Vries, W., Solberg, S., Dobbertin, M., Sterba, H., Laubhann, D., Reinds, G. J., Nabuurs, G. J., Gundersen, P., and Sutton, M. A.: Ecologically implausible carbon response?, Nature, 451, E1–E3, https://doi.org/10.1038/nature06579, 2008.
De Vries, W., Solberg, S., Dobbertin, M., Sterba, H., Laubhann, D., van Oijen, M., Evans, C., Gundersen, P., Kros, J., Wamelink, G. W. W., Reinds, G. J., and Sutton, M. A.: The impact of nitrogen deposition on carbon sequestration by European forests and heathlands, Forest Ecol. Manag., 258, 1814–1823, https://doi.org/10.1016/j.foreco.2009.02.034, 2009.
De Vries, W., Du, E., and Butterbach-Bahl, K.: Short and long-term impacts of nitrogen deposition on carbon sequestration by forest ecosystems, Curr. Opin. Env. Sust., 9–10, 90–104, https://doi.org/10.1016/j.cosust.2014.09.001, 2014a.
De Vries, W., Dobbertin, M. H., Solberg, S., van Dobben, H., and Schaub, M.: Impacts of acid deposition, ozone exposure and weather conditions on forest ecosystems in Europe: an overview, Plant Soil, 380, 1–45, https://doi.org/10.1007/s11104-014-2056-2, 2014b.
Dezi, S., Medlyn, B. E., Tonon, G., and Magnani, F.: The effect of nitrogen deposition on forest carbon sequestration: a model-based analysis, Glob. Change Biol., 16, 1470–1486, https://doi.org/10.1111/j.1365-2486.2009.02102.x, 2010.
Dise, N. B. and Wright, R. F.: Nitrogen leaching from European forests in relation to nitrogen deposition, Forest Ecol. Manag., 71, 153–161, https://doi.org/10.1016/0378-1127(94)06092-W, 1995.
Dise, N. B., Rothwell, J. J., Gauci, V., van der Salm, C., and de Vries, W.: Predicting dissolved inorganic nitrogen leaching in European forests using two independent databases, Sci. Total Environ., 1225, 1798–1808, https://doi.org/10.1016/j.scitotenv.2008.11.003, 2009.
Dorn, J.: Matlab “distributionPlot.m” function, available at: https://fr.mathworks.com/matlabcentral/fileexchange/23661-violin-plots-for-plotting-multiple-distributions-distributionplot-m?s_tid=prof_contriblnk (last access: 22 August 2019), 2008.
Du, E. and de Vries, W.: Nitrogen-induced new net primary production and carbon sequestration in global forests, Environ. Pollut., 242, 1476–1487, https://doi.org/10.1016/j.envpol.2018.08.041, 2018.
Erisman, J. W., Galloway, J., Seitzinger, S., Bleeker, A., and Butterbach-Bahl, K.: Reactive nitrogen in the environment and its effect on climate change, Curr. Opin. Env. Sust., 3, 281–290, https://doi.org/10.1016/j.cosust.2011.08.012, 2011.
Etzold, S., Waldner, P., Thimonier, A., Schmitt, M., and Dobbertin, M.: Tree growth in Swiss forests between 1995 and 2010 in relation to climate and stand conditions: recent disturbances matter, Forest Ecol. Manag., 311, 41–55, https://doi.org/10.1016/j.foreco.2013.05.040, 2014.
European Fluxes Database Cluster: available at: http://www.europe-fluxdata.eu/ (last access: 22 August 2019), 2012.
Falge, E., Baldocchi, D., Olson, R., Anthoni, P., Aubinet, M., Bernhofer, C., Burba, G., Ceulemans, R., Clement, R., Dolman, H., Granier, A., Gross, P., Grunwald, T., Hollinger, D., Jensen, N.O., Katul, G., Keronen, P., Kowalski, A., Lai, C. T., Law, B. E., Meyers, T., Moncrieff, H., Moors, E., Munger, J. W., Pilegaard, K., Rannik, U., Rebmann, C., Suyker, A., Tenhunen, J., Tu, K., Verma, S., Vesala, T., Wilson, K., and Wofsy, S.: Gap filling strategies for defensible annual sums of net ecosystem exchange, Agr. Forest Meteorol., 107, 43–69, https://doi.org/10.1016/S0168-1923(00)00225-2, 2001.
Fernández-Martínez, M., Vicca, S., Janssens, I. A., Sardans, J., Luyssaert, S., Campioli, M., Chapin, F. S., Ciais, P., Malhi, Y., Obersteiner, M., Papale, D., Piao, S. L., Reichstein, M., Rodà, F., and Peñuelas, J.: Nutrient availability as the key regulator of global forest carbon balance, Nat. Clim. Change, 4, 471–476, https://doi.org/10.1038/nclimate2177, 2014.
Fernández-Martínez, M., Vicca, S., Janssens, I. A., Sardans, J., Luyssaert, S., Campioli, M., Chapin, F. S., Ciais, P., Malhi, Y., Obersteiner, M., Papale, D., Piao, S. L., Reichstein, M., Rodà, F., and Peñuelas, J.: Reply to “Uncertain effects of nutrient availability on global forest carbon balance” and “Data quality and the role of nutrients in forest carbon-use efficiency”, Nat. Clim. Change, 5, 960–961, https://doi.org/10.1038/nclimate2794, 2015.
Fernández-Martínez, M., Vicca, S., Janssens, I. A., Ciais, P., Obersteiner, M., Bartrons, M., Sardans, J., Verger, A., Canadell, J. G., Chevallier, F., Wang, X., Bernhofer, C., Curtis, P. S., Gianelle, D., Gruwald, T., Heinesch, B., Ibrom, A., Knohl, A., Laurila, T., Law, B. E., Limousin, J. M., Longdoz, B., Loustau, D., Mammarella, I., Matteucci, G., Monson, R. K., Montagnani, L., Moors, E. J., Munger, J. W., Papale, D., Piao, S. L., and Penuelas, J.: Atmospheric deposition, CO2, and change in the land carbon sink, Sci. Rep.-UK, 7, 9632, https://doi.org/10.1038/s41598-017-08755-8, 2017.
Finzi, A. C., Norby, R. J., Calfapietra, C., Gallet-Budynek, A., Gielen, B., Holmes, W. E., Hoosbeek, M. R., Iversen, C. M., Jackson, R. B., Kubiske, M. E., Ledford, J., Liberloo, M., Oren, R., Polle, A., Pritchard, S., Zak, D. R., Schlesinger, W. H., and Ceulemans, R.: Increases in nitrogen uptake rather than nitrogen-use efficiency support higher rates of temperate forest productivity under elevated CO2, P. Natl. Acad. Sci. USA, 104, 14014–14019, https://doi.org/10.1073/pnas.0706518104, 2007.
Flechard, C. R., Nemitz, E., Smith, R. I., Fowler, D., Vermeulen, A. T., Bleeker, A., Erisman, J. W., Simpson, D., Zhang, L., Tang, Y. S., and Sutton, M. A.: Dry deposition of reactive nitrogen to European ecosystems: a comparison of inferential models across the NitroEurope network, Atmos. Chem. Phys., 11, 2703–2728, https://doi.org/10.5194/acp-11-2703-2011, 2011.
Flechard, C. R., Ibrom, A., Skiba, U. M., de Vries, W., van Oijen, M., Cameron, D. R., Dise, N. B., Korhonen, J. F. J., Buchmann, N., Legout, A., Simpson, D., Sanz, M. J., Aubinet, M., Loustau, D., Montagnani, L., Neirynck, J., Janssens, I. A., Pihlatie, M., Kiese, R., Siemens, J., Francez, A.-J., Augustin, J., Varlagin, A., Olejnik, J., Juszczak, R., Aurela, M., Berveiller, D., Chojnicki, B. H., Dämmgen, U., Delpierre, N., Djuricic, V., Drewer, J., Dufrêne, E., Eugster, W., Fauvel, Y., Fowler, D., Frumau, A., Granier, A., Gross, P., Hamon, Y., Helfter, C., Hensen, A., Horváth, L., Kitzler, B., Kruijt, B., Kutsch, W. L., Lobo-do-Vale, R., Lohila, A., Longdoz, B., Marek, M. V., Matteucci, G., Mitosinkova, M., Moreaux, V., Neftel, A., Ourcival, J.-M., Pilegaard, K., Pita, G., Sanz, F., Schjoerring, J. K., Sebastià, M.-T., Sim Tang, Y., Uggerud, H., Urbaniak, M., van Dijk, N., Vesala, T., Vidic, S., Vincke, C., Weidinger, T., Zechmeister-Boltenstern, S., Butterbach-Bahl, K., Nemitz, E., and Sutton, M. A.:Carbon–nitrogen interactions in European forests and semi-natural vegetation – Part 1: Fluxes and budgets of carbon, nitrogen and greenhouse gases from ecosystem monitoring and modelling, Biogeosciences, 17, 1583–1620, https://doi.org/10.5194/bg-17-1583-2020, 2020.
Fleischer, K., Rebel, K. T., Van Der Molen, M. K., Erisman, J. W., Wassen, M. J., van Loon, E. E., Montagnani, L., Gough, C. M., Herbst, M., Janssens, I. A., Gianelle, D., and Dolman, A. J.: The contribution of nitrogen deposition to the photosynthetic capacity of forests, Global Biogeochem. Cy., 27, 187–199, https://doi.org/10.1002/gbc.20026, 2013.
Fog, K.: The effect of added nitrogen on the rate of decomposition of organic matter, Biol. Rev., 63, 433–462, https://doi.org/10.1111/j.1469-185X.1988.tb00725.x, 1988.
Fowler, D., Steadman, C. E., Stevenson, D., Coyle, M., Rees, R. M., Skiba, U. M., Sutton, M. A., Cape, J. N., Dore, A. J., Vieno, M., Simpson, D., Zaehle, S., Stocker, B. D., Rinaldi, M., Facchini, M. C., Flechard, C. R., Nemitz, E., Twigg, M., Erisman, J. W., Butterbach-Bahl, K., and Galloway, J. N.: Effects of global change during the 21st century on the nitrogen cycle, Atmos. Chem. Phys., 15, 13849–13893, https://doi.org/10.5194/acp-15-13849-2015, 2015.
Franklin, O., Johansson, J., Dewar, R. C., Dieckmann, U., McMurtrie, R. E., Brännström, Å., and Dybzinski, R.: Modeling carbon allocation in trees: a search for principles, Tree Physiol., 32, 648–666, https://doi.org/10.1093/treephys/tpr138, 2012.
Goodale, C. L., Aber, J. D., and Vitousek, P. M.: An unexpected nitrate decline in New Hampshire streams, Ecosystems, 6, 75–86, https://doi.org/10.1007/s10021-002-0219-0, 2003.
Granier, A., Breda, N., Longdoz, B., Gross, P., and Ngao, J.: Ten years of fluxes and stand growth in a young beech forest at Hesse, North-eastern France, Ann. For. Sci., 64, 704, https://doi.org/10.1051/forest:2008052, 2008.
Gundale, M. J., From, F., Back-Holmen, L., and Nordin, A.: Nitrogen deposition in boreal forests has a minor impact on the global carbon cycle, Glob. Change Biol., 20, 276–286, https://doi.org/10.1111/gcb.12422, 2014.
Gundersen, P., Callesen, I., and de Vries, W.: Nitrate leaching in forest soils is related to forest floor C∕N ratios, Environ. Pollut., 102, 403–407, https://doi.org/10.1016/B978-0-08-043201-4.50058-7, 1998.
Högberg, P.: Nitrogen impacts on forest carbon, Nature, 447, 781–782, https://doi.org/10.1038/447781a, 2007.
Högberg, P.: What is the quantitative relation between nitrogen deposition and forest carbon sequestration?, Glob. Change Biol., 18, 1–2, https://doi.org/10.1111/j.1365-2486.2011.02553.x, 2012.
Högberg, M. N., Briones, M. J. I., Keel, S. G., Metcalfe, D. B., Campbell, C., Midwood, A. J., Thornton, B., Hurry, V., Linder, S., Näsholm, T., and Högberg, P.: Quantification of effects of season and nitrogen supply on tree below-ground carbon transfer to ectomycorrhizal fungi and other soil organisms in a boreal pine forest, New Phytol., 187, 485–493, https://doi.org/10.1111/j.1469-8137.2010.03274.x, 2010.
Höglind, M., Cameron, D., Persson, T., Huang, X., and Van Oijen, M.: BASGRA_N: a model for grassland productivity, quality and greenhouse gas balance, Ecol. Model., 417, 108925, https://doi.org/10.1016/j.ecolmodel.2019.108925, 2020.
Holmberg, M., Aherne, J., Austnes, K., Beloica, J., De Marco, A., Dirnböck, T., Fornasier, M. F., Goergen, K., Futter, M., Lindroos, A.-J., Krám, P., Neirynck, J., Nieminen, T. M., Pecka, T., Posch, M., Pröll, G., Rowe, E. C., Scheuschner, T., Schlutow, A., Valinia, S., and Forsius, M.: Modelling study of soil C, N and pH response to air pollution and climate change using European LTER site observations, Sci. Total Environ., 640–641, 387–399, https://doi.org/10.1016/j.scitotenv.2018.05.299, 2018.
ICP (International Co-operative Programme on Assessment and Monitoring of Air Pollution Effects on Forests): available at: http://icp-forests.net/, last access: 22 August 2019.
Janssens, I. A., Sampson, D. A., Cermak, J., Meiresonne, L., Riguzzi, F., Overloop, S., and Ceulemans, C.: Above-and belowground phytomass and carbon storage in a Belgian Scots pine stand, Ann. For. Sci., 56, 81–90, https://doi.org/10.1051/forest:19990201, 1999.
Janssens, I. A., Lankreijer, H., Matteucci, G., Kowalski, A. S., Buchmann, N., Epron, D., Pilegaard, K., Kutsch, W., Longdoz, B., Grünwald, T., Montagnani, L., Dore, S., Rebmann, C., Moors, E. J., Grelle, A., Rannik, Ü., Morgenstern, K., Oltchev, S., Clement, R., Guðmundsson, J., Minerbi, S., Berbigier, P., Ibrom, A., Moncrieff, J., Aubinet, M., Bernhofer, C., Jensen, N. O., Vesala, T., Granier, A., Schulze, E.-D., Lindroth, A., Dolman, A. J., Jarvis, P. G., Ceulemans, R., and Valentini, R.: Productivity overshadows temperature in determining soil and ecosystem respiration across European forests, Glob. Change Biol., 7, 269–278, https://doi.org/10.1046/j.1365-2486.2001.00412.x, 2001.
Janssens, I. A., Dieleman, W., Luyssaert, S., Subke, J., Reichstein, M., Ceulemans, R., Ciais, P., Dolman, A. J., Grace, J., Matteucci, G., Papale, D., Piao, S. L., Schulze, E.-D., Tang, J., and Law, B. E.: Reduction of forest soil respiration in response to nitrogen deposition, Nat. Geosci., 3, 315–322, https://doi.org/10.1038/ngeo844, 2010.
Johnson, J., Graf Pannatier, E., Carnicelli, S., Cecchini, G., Clarke, N., Cools, N., Hansen, K., Meesenburg, H., Nieminen, T. M., Pihl-Karlsson, G., Titeux, H., Vanguelova, E., Verstraeten, A., Vesterdal, L., Waldner, P., and Jonard, M.: The response of soil solution chemistry in European forests to decreasing acid deposition, Glob. Change Biol., 24, 3603–3619, https://doi.org/10.1111/gcb.14156, 2018.
Jones, D. L. and Kielland, K.: Soil amino acid turnover dominates the nitrogen flux in permafrost-dominated taiga forest soils, Soil Biol. Biochem., 34, 209–219, https://doi.org/10.1016/S0038-0717(01)00175-4, 2002.
Kalliokoski, T., Mäkinen, H., Jyske, T., Nöjd, P., and Linder, S.: Effects of nutrient optimization on intra-annual wood formation in Norway spruce, Tree Physiol., 33, 1145–1155, https://doi.org/10.1093/treephys/tpt078, 2013.
Kolari, P., Pumpanen, J., Rannik, Ü., Ilvesniemi, H., Hari, P., and Berninger, F.: Carbon balance of different aged Scots pine forests in Southern Finland, Glob. Change Biol., 10, 1106–1119, https://doi.org/10.1111/j.1529-8817.2003.00797.x, 2004.
Korhonen, J. F. J., Pumpanen, J., Kolari, P., Juurola, E., and Nikinmaa, E.: Contribution of root and rhizosphere respiration to the annual variation of carbon balance of a boreal Scots pine forest, Biogeosciences Discuss., 6, 6179–6203, https://doi.org/10.5194/bgd-6-6179-2009, 2009.
Kreutzer, K., Butterbach-Bahl, K., Rennenberg, H., and Papen, H.: The complete nitrogen cycle of an N-saturated spruce forest ecosystem, Plant Biol., 11, 643–649, https://doi.org/10.1111/j.1438-8677.2009.00236.x, 2009.
Kutsch, W. L. and Kolari, P.: Data quality and the role of nutrients in forest carbon-use efficiency, Nat. Clim. Change, 5, 959–960, https://doi.org/10.1038/nclimate2793, 2015.
Lasslop, G., Reichstein, M., Papale, D., Richardson, A. D., Arneth, A., Barr, A., Stoy, P., and Wohlfahrt, G.: Separation of net ecosystem exchange into assimilation and respiration using a light response curve approach: critical issues and global evaluation, Glob. Change Biol., 16, 187–208, https://doi.org/10.1111/j.1365-2486.2009.02041.x, 2010.
Laubhann, D., Sterba, H., Reinds, G. J., and de Vries, W.: The impact of atmospheric deposition and climate on forest growth in European monitoring plots: An empirical tree growth model, Forest Ecol. Manag., 258, 1751–1761, https://doi.org/10.1016/j.foreco.2008.09.050, 2009.
LeBauer, D. S. and Treseder, K. K.: Nitrogen limitation of net primary productivity in terrestrial ecosystems is globally distributed, Ecology, 89, 371–379, https://doi.org/10.1890/06-2057.1, 2008.
Lee, X., Massman, W., and Law, B. (Eds.): Handbook of micrometeorology. A guide for surface flux measurement and analysis, Atmos. Ocean. Sci. Lib., 29, ISBN 1-4020-2264-6, Kluwer Academic Publishers, Dordrecht, 250 pp., 2004.
Liu, L. and Greaver, T. L.: A review of nitrogen enrichment effects on three biogenic GHGs: the CO2 sink may be largely offset by stimulated N2O and CH4 emission, Ecol. Lett., 12, 1103–1117, https://doi.org/10.1111/j.1461-0248.2009.01351.x, 2009.
Luyssaert, S., Schulze, E.-D., Börner, A., Knohl, A., Hessenmöller, D., Law, B. E., Ciais, P., and Grace, J.: Old-growth forests as global carbon sinks, Nature, 455, 213–215, https://doi.org/10.1038/nature07276, 2008.
Luyssaert, S., Reichstein, M., Schulze, E-D., Janssens, I. A., Law, B. E., Papale, D., Dragoni, D., Goulden, M. L., Granier, A., Kutsch, W. L., Linder, S., Matteucci, G., Moors, E., Munger, J. W., Pilegaard, K., Saunders, M., and Falge, E. M.: Toward a consistency crosscheck of eddy covariance flux-based and biometric estimates of ecosystem carbon balance, Global Biogeochem. Cy., 23, GB3009, https://doi.org/10.1029/2008GB003377, 2009.
Lovett, G. M., Arthur, M. A., Weathers, K. C., Fitzhugh, R. D., and Templer, P. H.: Nitrogen addition increases carbon storage in soils, but not in trees, in an Eastern U.S. deciduous forest, Ecosystems, 16, 980–1001, https://doi.org/10.1007/s10021-013-9662-3, 2013.
MacDonald, J. A., Dise, N. B., Matzner, E., Armbruster, M., Gundersen, P., and Forsuis, M.: Nitrogen input together with ecosystem nitrogen enrichment predict nitrate leaching from European forests, Glob. Change Biol., 8, 1028–1033, https://doi.org/10.1046/j.1365-2486.2002.00532.x, 2002.
Magnani, F., Mencuccini, M., Borghetti, M., Berbigier, P., Berninger, F., Delzon, S., Grelle, A., Hari, P., Jarvis, P. G., Kolari, P., Kowalski, A. S., Lankreijer, H., Law, B. E., Lindroth, A., Loustau, D., Manca, G., Moncrieff, J. B., Rayment, M., Tedeschi, V., Valentini, R., and Grace, J.: The human footprint in the carbon cycle of temperate and boreal forests, Nature, 447, 848–850, https://doi.org/10.1038/nature05847, 2007.
Magnani, F., Mencuccini, M., Borghetti, M., Berninger, F., Delzon, S., Grelle, A., Hari, P., Jarvis, P. G., Kolari, P., Kowalski, A. S., Lankreijer, H., Law, B. E., Lindroth, A., Loustau, D., Manca, G., Moncrieff, J. B., Tedeschi, V., Valentini, R., and Grace, J.: Reply to A. De Schrijver et al. (2008) and W. de Vries et al. (2008), Nature, 451, E3–E4, https://doi.org/10.1038/nature06580, 2008.
Mahecha, M. D., Reichstein, M., Carvalhais, N., Lasslop, G., Lange, H., Seneviratne, S. I., Vargas, R., Ammann, C., Arain, M. A., Cescatti, A., Janssens, I. A., Migliavacca, M., Montagnani, L., and Richardson, A. D.: Global convergence in the temperature sensitivity of respiration at ecosystem level, Science, 329, 838–840, https://doi.org/10.1126/science.1189587, 2010.
Migliavacca, M., Reichstein, M., Richardson, A. M., Colombo, R., Sutton, M. A., Lasslop, G., Tomelleri, E., Wohlfahrt, G., Carvalhais, N., Cescatti, A., Mahecha, M. D., Montagnani, L., Papale, D., Zaehle, S., Arain, A., Arneth, A., Black, T. A., Carrara, A., Dore, S., Gianelle, D., Helfter, C., Hollinger, D., Kutsch, W. L., Lafleur, P. M., Nouvellon, Y., Rebmann, C., Da Rocha, H. R., Rodeghiero, M., Roupsard, O., Sebastià, M. T., Seufert, G., Soussana, J.-F., and Van Der Molen, M. K.: Semiempirical modeling of abiotic and biotic factors controlling ecosystem respiration across eddy covariance sites, Glob. Change Biol., 17, 390–409, https://doi.org/10.1111/j.1365-2486.2010.02243.x, 2011.
Moreau, D., Bardgett, R. D., Finlay, R. D., Jones, D. L., and Philippot, L.: A plant perspective on nitrogen cycling in the rhizosphere, Funct. Ecol., 33, 540–552, https://doi.org/10.1111/1365-2435.13303, 2019.
Nadelhoffer, K. J., Emmett, B. A., Gundersen, P., Kjønaas, O. J., Koopmansk, C. J., Schleppi, P., Tietemak, A., and Wright, R. F.: Nitrogen deposition makes a minor contribution to carbon sequestration in temperate forests, Nature, 398, 145–148, https://doi.org/10.1038/18205, 1999.
Nair, R. K. F., Perks, M. P., Weatherall, A., Baggs, E. M., and Mencuccini, M.: Does canopy nitrogen uptake enhance carbon sequestration by trees?, Glob. Change Biol., 22, 875–888, https://doi.org/10.1111/gcb.13096, 2016.
Neirynck, J., Van Ranst, E., Roskams, P., and Lust, N.: Impact of declining throughfall depositions on soil solution chemistry at coniferous forests in northern Belgium, Forest Ecol. Manag., 160, 127–142, https://doi.org/10.1016/S0378-1127(01)00476-5, 2002.
Neirynck, J., Kowalski, A. S., Carrara, A., Genouw, G., Berghmans, P., and Ceulemans, R.: Fluxes of oxidised and reduced nitrogen above a mixed coniferous forest exposed to various nitrogen emission sources, Environ. Pollut., 149, 31–43, https://doi.org/10.1016/j.envpol.2006.12.029, 2007.
Neirynck, J., Flechard, C. R., and Fowler, D.: Long-term (13 years) measurements of SO2 fluxes over a forest and their control by surface chemistry, Agr. Forest Meteorol., 151, 1768–1780, https://doi.org/10.1016/j.agrformet.2011.07.013, 2011.
NEU (NitroEurope Integrated Project): available at: http://www.nitroeurope.ceh.ac.uk (last access: 22 August 2019), 2013.
NOAA (National Oceanic and Atmospheric Administration): available at: https://www.esrl.noaa.gov/gmd/ccgg/trends/full.html (last access: 22 August 2019), 2014.
Nohrstedt, H.-Ö.: Response of coniferous forest ecosystems on mineral soils to nutrient additions: a review of Swedish experiences, Scand. J. Forest Res., 16, 555–573, https://doi.org/10.1080/02827580152699385, 2001.
Odum, E. P.: The strategy of ecosystem development, Science, 164, 262–270, https://doi.org/10.1126/science.164.3877.262, 1969.
Reay, D. S., Dentener, F., Smith, P., Grace, J., and Feely, R. A.: Global nitrogen deposition and carbon sinks, Nat. Geosci., 1, 430–437, https://doi.org/10.1038/ngeo230, 2008.
Reichstein, M., Falge, E., Baldocchi, D., Papale, D., Aubinet, M., Berbigier, P., Bernhofer, C., Buchmann, N., Gilmanov, T., Granier, A., Grünwald, T., Havránková, K., Ilvesniemi, H., Janous, D., Knohl, A., Laurila, T., Lohila, A., Loustau, D., Matteucci, G., Meyers, T., Miglietta, F., Ourcival, J.-M., Pumpanen, J., Rambal, S., Rotenberg, E., Sanz, M., Tenhunen, J., Seufert, G., Vaccari, F., Vesala, T., Yakir, D., and Valentini, R.: On the separation of net ecosystem exchange into assimilation and ecosystem respiration: review and improved algorithm, Glob. Change Biol., 11, 1424–1439, https://doi.org/10.1111/j.1365-2486.2005.001002.x, 2005.
Saarsalmi, A. and Mälkönen, E.: Forest fertilization research in Finland: a literature review, Scand. J. Forest Res., 16, 514–535, https://doi.org/10.1080/02827580152699358, 2001.
Schmitz, A., Sanders, T. G. M., Bolte, A., Bussotti, F., Dirnböck, T., Johnson, J., Peñuelas, J., Pollastrini, M., Prescher, A.-K., Sardans, J., Verstraeten, A., and de Vries, W.: Responses of forest ecosystems in Europe to decreasing nitrogen deposition, Environ. Pollut., 244, 980–994, https://doi.org/10.1016/j.envpol.2018.09.101, 2019.
Schulte-Uebbing, L. and de Vries, W.: Global-scale impacts of nitrogen deposition on tree carbon sequestration in tropical, temperate and boreal forests: A meta-analysis, Glob. Change Biol., 24, 416–431, https://doi.org/10.1111/gcb.13862, 2018.
Schulze, E.-D., Ciais, P., Luyssaert, S., Schrumpf, M., Janssens, I. A., Thiruchittampalam, B., Theloke, J., Saurat, M., Bringezu, S., Lelieveld, J., Lohila, A., Rebmann, C., Jung, M., Bastviken, D., Abril, G., Grassi, G., Leip, A., Freibauer, A., Kutsch, W., Don, A., Nieschulze, J., Börner, A., Gash, J. H., and Dolman, A. J.: The European carbon balance. Part 4: integration of carbon and other trace-gas fluxes, Glob. Change Biol., 16, 1451–1469, https://doi.org/10.1111/j.1365-2486.2010.02215.x, 2010.
Schwede, D. B., Simpson, D., Tan, J., Fu, J. S., Dentener, F., Du, E., and de Vries, W.: Spatial variation of modelled total, dry and wet nitrogen deposition to forests at global scale, Environ. Pollut., 243, 1287–1301, https://doi.org/10.1016/j.envpol.2018.09.084, 2018.
Shi, M., Fisher, J. B., Brzostek, E. R., and Phillips, R. P.: Carbon cost of plant nitrogen acquisition: global carbon cycle impact from an improved plant nitrogen cycle in the Community Land Model, Glob. Change Biol., 22, 1299–1314, https://doi.org/10.1111/gcb.13131, 2016.
Simpson, D., Benedictow, A., Berge, H., Bergström, R., Emberson, L. D., Fagerli, H., Flechard, C. R., Hayman, G. D., Gauss, M., Jonson, J. E., Jenkin, M. E., Nyíri, A., Richter, C., Semeena, V. S., Tsyro, S., Tuovinen, J.-P., Valdebenito, Á., and Wind, P.: The EMEP MSC-W chemical transport model – technical description, Atmos. Chem. Phys., 12, 7825–7865, https://doi.org/10.5194/acp-12-7825-2012, 2012.
Simpson, D., Andersson, C., Christensen, J. H., Engardt, M., Geels, C., Nyiri, A., Posch, M., Soares, J., Sofiev, M., Wind, P., and Langner, J.: Impacts of climate and emission changes on nitrogen deposition in Europe: a multi-model study, Atmos. Chem. Phys., 14, 6995–7017, https://doi.org/10.5194/acp-14-6995-2014, 2014.
Solberg, S., Dobbertin, M., Reinds, G. J., Andreassen, K., Lange, H., Garcia Fernandez, P., Hildingsson, A., and de Vries, W.: Analyses of the impact of changes in atmospheric deposition and climate on forest growth in European monitoring plots: A stand growth approach, Forest Ecol. Manag., 258, 1735–1750, https://doi.org/10.1016/j.foreco.2008.09.057, 2009.
Spelling, J.: Matlab “drawSankey.m” function, available at: http://www.sourcecodeonline.com/author/james_spelling.html (last access: 22 August 2019), KTH, Sweden, 2009.
Sutton, M. A., Simpson, D., Levy, P. E., Smith, R. I., Reis, S., van Oijen, M., and de Vries, W.: Uncertainties in the relationship between atmospheric nitrogen deposition and forest carbon sequestration, Glob. Change Biol., 14, 2057–2063, https://doi.org/10.1111/j.1365-2486.2008.01636.x, 2008.
Tang, J., Luyssaert, S., Richardson, A. D., Kutsch, W., and Janssens, I. A.: Steeper declines in forest photosynthesis than respiration explain age-driven decreases in forest growth, P. Natl. Acad. Sci. USA, 111, 8856–8860, https://doi.org/10.1073/pnas.1320761111, 2014.
Tang, Y. S., Simmons, I., van Dijk, N., Di Marco, C., Nemitz, E., Dämmgen, U., Gilke, K., Djuricic, V., Vidic, S., Gliha, Z., Borovecki, D., Mitosinkova, M., Hanssen, J. E., Uggerud, T. H., Sanz, M. J., Sanz, P., Chorda, J. V., Flechard, C. R., Fauvel, Y., Ferm, M., Perrino, C., and Sutton, M. A.: European scale application of atmospheric reactive nitrogen measurements in a low-cost approach to infer dry deposition fluxes, Agr. Ecosyst. Environ., 133, 183–195, https://doi.org/10.1016/j.agee.2009.04.027, 2009.
Templer, P. H., Mack, M. C., Chapin III, F. S., Christenson, L. M., Compton, J. E., Crook, H. D., Currie, W. S., Curtis, C. J., Dail, D. B., D'Antonio, C. M., Emmett, B. A., Epstein, H. E., Goodale, C. L., Gundersen, P., Hobbie, S. E., Holland, K., Hooper, D. U., Hungate, B. A., Lamontagne, S., Nadelhoffer, K. J., Osenberg, C. W., Perakis, S. S., Schleppi, P., Schimel, J., Schmidt, I. K., Sommerkorn, M., Spoelstra, J., Tietema, A., Wessel, W. W., and Zak, D. R.: Sinks for nitrogen inputs in terrestrial ecosystems: A meta-analysis of 15N tracer field studies, Ecology, 93, 1816–829, https://doi.org/10.1890/11-1146.1, 2012.
Thomas, R. Q., Canham, C. D., Weathers, K. C., and Goodale, C. L.: Increased tree carbon storage in response to nitrogen deposition in the US, Nat. Geosci., 3, 13–17, https://doi.org/10.1038/ngeo721, 2010.
Treseder, K. K.: Nitrogen additions and microbial biomass: a meta-analysis of ecosystem studies, Ecol. Lett., 11, 1111–1120, https://doi.org/10.1111/j.1461-0248.2008.01230.x, 2008.
Van der Salm, C., de Vries, W., Reinds, G. J., and Dise, N. B.: N leaching across European forests: Derivation and validation of empirical relationships using data from intensive monitoring plots, Forest Ecol. Manag., 238, 81–91, https://doi.org/10.1016/j.foreco.2006.09.092, 2007.
van Oijen, M., Rougier, J., and Smith, R.: Bayesian calibration of process-based forest models: bridging the gap between models and data, Tree Physiol., 25, 915–927, https://doi.org/10.1093/treephys/25.7.915, 2005.
Van Oijen, M., Ågren, G. I., Chertov, O., Kellomäki, S., Komarov, A., Mobbs, D. C., and Murray, M. B.: Methodology for the application of process-based models to analyse changes in European forest growth, Chap. 3.2, in: Causes and Consequences of Forest Growth Trends in Europe – Results of the RECOGNITION Project, edited by: Kahle, H. P., Karjalainen, T., Schuck, A., Ågren, G. I., Kellomäki, S., Mellert, K., Prietzel, J., Rehfuess, K. E., and Spiecker, H., European Forest Institute Research Report 21, Brill, Leiden, 67–80, 2008.
Vergutz, L., Manzoni, S., Porporato, A., Ferreira Novais, R., and Jackson, R. B.: Global resorption efficiencies and concentrations of carbon and nutrients in leaves of terrestrial plants, Ecol. Monogr., 82, 205–220, https://doi.org/10.1890/11-0416.1, 2012.
Verstraeten, A., Neirynck, J., Genouw, G., Cools, N., Roskams, P., and Hens, M.: Impact of declining atmospheric deposition on forest soil solution chemistry in Flanders, Belgium, Atmos. Environ., 62, 50–63, https://doi.org/10.1016/j.atmosenv.2012.08.017, 2012.
Vicca, S., Luyssaert, S., Peňuelas, J., Campioli, M., Chapin, F. S., Ciais, P., Heinemeyer, A., Högberg, P., Kutsch, W. L., Law, B. E., Malhi, Y., Papale, D., Piao, S. L., Reichstein, M., Schulze, E. D., and Janssens, I. A.: Fertile forests produce biomass more efficiently, Ecol. Lett., 15, 520–526, https://doi.org/10.1111/j.1461-0248.2012.01775.x, 2012.
Vitousek, P. M., Cassman, K., Cleveland, C., Crews, T., Field, C. B., Grimm, N. B., Horwarth, R. W., Marino, R., Martinelli, L., Rastetter, E. B., and Sprent, J.: Towards an ecological understanding of biological nitrogen fixation, Biogeochemistry, 57, 1–45, https://doi.org/10.1023/A:1015798428743, 2002.
Wang, L., Ibrom, A., Korhonen, J. F. J., Arnoud Frumau, K. F., Wu, J., Pihlatie, M., and Schjoerring, J. K.: Interactions between leaf nitrogen status and longevity in relation to N cycling in three contrasting European forest canopies, Biogeosciences, 10, 999–1011, https://doi.org/10.5194/bg-10-999-2013, 2013.
Warren, C. R.: Organic N molecules in the soil solution: What is known, what is unknown and the path forwards, Plant Soil, 375, 1–19, https://doi.org/10.1007/s11104-013-1939-y, 2014.
Wortman, E., Tomaszewski, T., Waldner, P., Schleppi, P., Thimonier, A., Eugster, W., Buchmann, N., and Sievering, H.: Atmospheric nitrogen deposition and canopy retention influences on photosynthetic performance at two high nitrogen deposition Swiss forests, Tellus B, 64, 17216, https://doi.org/10.3402/tellusb.v64i0.17216, 2012.
Zaehle, S. and Dalmonech, D.: Carbon–nitrogen interactions on land at global scales: current understanding in modelling climate biosphere feedbacks, Curr. Opin. Env. Sust., 3, 311–320, https://doi.org/10.1016/j.cosust.2011.08.008, 2011.