the Creative Commons Attribution 4.0 License.
the Creative Commons Attribution 4.0 License.
 | 13 Dec 2019
Nitrogen use efficiency and N2O and NH3 losses attributed to three fertiliser types applied to an intensively managed silage crop
Nicholas Cowan
Peter Levy
Andrea Moring
Ivan Simmons
Colin Bache
Amy Stephens
Joana Marinheiro
Jocelyn Brichet
Ling Song
Amy Pickard
Connie McNeill
Roseanne McDonald
Juliette Maire
Benjamin Loubet
Polina Voylokov
Mark Sutton
Ute Skiba
Three different nitrogen (N) fertiliser types, ammonium nitrate, urea and urea coated with a urease inhibitor (Agrotain®), were applied at standard rates (70 kg N ha−1) to experimental plots in a typical and intensively managed grassland area at the Easter Bush Farm Estate (Scotland). The nitrogen use efficiency of the fertilisers was investigated as well as nitrogen losses in the form of nitrous oxide fluxes (N2O) and ammonia (NH3) during fertilisation events in the 2016 and 2017 growing seasons. Nitrous oxide was measured by the standard static chamber technique and analysed using Bayesian statistics. Ammonia was measured using passive samplers combined with the Flux Interpretation by Dispersion and Exchange over Short Range (FIDES) inverse dispersion model. On average, fertilisation with ammonium nitrate supported the largest yields and had the highest nitrogen use efficiency, but as large spatial and seasonal variation persisted across the plots, yield differences between the three fertiliser types and zero N control were not consistent. Overall, ammonium nitrate treatment was found to increase yields significantly (p value < 0.05) when compared to the urea fertilisers used in this study. Ammonium nitrate was the largest emitter of N2O (0.76 % of applied N), and the urea was the largest emitter of NH3 (16.5 % of applied N). Urea coated with a urease inhibitor did not significantly increase yields when compared to uncoated urea; however, ammonia emissions were only 10 % of the magnitude measured for the uncoated urea, and N2O emissions were only 47 % of the magnitude of those measured for ammonium nitrate fertiliser. This study suggests that urea coated with a urease inhibitor is environmentally the best choice in regards to nitrogen pollution, but because of its larger cost and lack of agronomic benefits, it is not economically attractive when compared to ammonium nitrate.


Due to a large and rapidly expanding global population, modern-day agriculture requires regular inputs of industrially produced reactive nitrogen fertilisers (Nr) (i.e. nitrogen compounds that plant life can consume through root systems such as ammonium nitrate and urea) in order to keep up with increasing food demand (Lassaletta et al., 2014). This wide-scale intensive application of Nr has resulted in significant anthropogenic alterations of virtually every process in the natural global nitrogen cycle (Fowler et al., 2013; Vitousek et al., 1997). Typically, more than half of the applied Nr is lost to the environment through various biological pathways and chemical processes (Lassaletta et al., 2014; Raun and Johnson, 1999), such as nitrate () run-off into streams and waterways (Lu and Tian, 2017) as well as gaseous losses in the form of ammonia (NH3) (Bouwman et al., 1997), nitrous oxide (N2O) (Reay et al., 2012) and nitrogen oxides (NOx) (Bertram et al., 2005). This relatively low nitrogen use efficiency (NUE) results in significant environmental damage at a global scale.
After fertiliser application, the resulting volatilisation of NH3, especially from urea, will often contaminate the surrounding environment with deposition of Nr, in some cases causing significant damage to fragile biodiversities by increasing nitrogen loading (Phoenix et al., 2006). Fluxes of NH3 also contribute to an increase of particulate matter (PM2.5) in the atmosphere which has negative implications for human health (Paulot and Jacob, 2014). Agricultural sources contribute an estimated 60 % of global anthropogenic N2O emissions (Syakila and Kroeze, 2011), primarily due to increasing the quantity of Nr in soils and aquatic systems in which N2O is released as a byproduct of the microbial processes of nitrification and denitrification (Davidson et al., 2000). N2O is a potent greenhouse gas as well as the most significant contributor to global stratospheric ozone depletion (Ravishankara et al., 2009), which doubly increases the incentive to mitigate these emissions.
Current projections predict that global rates of Nr fertiliser will continue to rise over the next century in order to cope with a growing population and an increase in meat production (FAO, 2017), and therefore it has become increasingly urgent to address the issue of nitrogen pollution from agriculture sources. However, food supply is a sensitive issue both politically and economically, with limited options available to governments or environmental regulators that may attempt to mitigate the damage caused by agricultural nitrogen pollution. One favourable option which potentially benefits all parties is to attempt to increase the NUE of Nr applied to crops, therefore maintaining high yields while reducing Nr lost to the environment in its various damaging forms. Typically, when fertiliser is applied, the water-soluble nitrogen compounds permeate into the rhizosphere allowing plant roots to absorb the nitrogen and the microbial community to convert Nr through the processes of nitrification and denitrification into gaseous compounds (N2O, NOx and N2) which may then be lost to the atmosphere (Davidson et al., 2000). In theory, by slowing the release of the Nr, plants can outcompete the microbial populations and less N escapes into air and ground waters as leachate. This can result in increased NUE, decreased environmental impact, improved crop yields and reduced fertiliser costs for farmers, making these efforts an attractive prospect for combatting global nitrogen pollution.
Several methods have been tested to slow down the release of Nr from synthetic fertilisers. In its simplest form, this can be achieved by increasing the particle size of the applied fertiliser pellets (Azeem et al., 2014; Shamsudin et al., 2014). More complicated methods of Nr inhibition come in the form of microbial inhibitors which directly target and slow a specific biological pathway (Abalos et al., 2014; Modolo et al., 2015). Synthetic fertilisers (typically urea) coated with chemical inhibitors that target urease hydrolysis and microbial nitrification are already commercially available.
Microbial inhibitors have been shown to reduce Nr losses for both N2O and NH3 under laboratory conditions and in field trails, but with varying success (Sanz-Cobena et al., 2014; Ni et al., 2014; Singh et al., 2013; Rose et al., 2017; Ruser and Schulz, 2015). Although there are positive studies which promote the pollution-reducing capabilities of these chemicals (Misselbrook et al., 2014), some questions remain over the overall effectiveness of the inhibitors which face claims that reduction of one form of Nr pollution may increase another. This is most commonly observed for nitrification inhibitors in which the slowing on the conversion of to in soils results in a decrease in N2O at the expense of an increase in NH3 volatilisation (Lam et al., 2017; Zaman et al., 2009). In theory, the use of a urease inhibitor should reduce the emission of NH3 by reducing the rate at which urea is converted to in soils, thus limiting available nitrogen in all forms. This may however, limit the rate at which crops also receive Nr and reduce yields. The use of inhibitors in farming remains uncommon, mostly due to a reluctance to change to an uncertain practice, compounded by the drawback that treated fertilisers are typically more expensive than traditionally used products. Further work using specific products in different environments is needed to supply evidence that will provide the agricultural community with the confidence to make the changes required to meet future NUE demands globally.
This study aims to specifically investigate the effect of the Agrotain® urease inhibitor (Koch, KS, USA) on a typical grassland silage crop in Scotland, comparing it with the two most commonly used synthetic nitrogen fertilisers: Ammonium nitrate (Nitram®) and urea. Grasslands account for approximately 60 % of agricultural land use in the UK (approximately 74 000 km2), to which an estimated 120 kt of ammonium nitrate and 26 kt of urea are applied annually (BSFP, 2017). The results presented in this study are intended to represent to some extent this large coverage of agricultural land in the UK to which urease inhibitors may be applied in the future.
In this study we aim to
-
compare the nitrogen use efficiency of equivalent applications of pellet fertilisers in the form of ammonium nitrate (Nitram), urea and urea with a urease inhibitor (the percentage of applied nitrogen fertiliser that is converted into plant matter as a result of increased crop growth);
-
investigate differences in crop quality and yield as a result of the fertilisers applied; and
-
quantify gaseous losses of nitrogen from the fertiliser types in the form of NH3 and N2O.
2.1 Experimental design
Fieldwork was carried out between May 2016 and September 2017. During this time, five applications of three different nitrogen fertiliser types were added to a grid of experimental plots (including a control) in intensively managed silage grassland fields (Lolium perenne L.) at Easter Bush Farm (Midlothian, UK; 55∘51′57.4′′ N, 3∘12′29.3′′ W). The three fertiliser types used in the experiment were ammonium nitrate pellets (Nitram, ), urea pellets, and urea pellets with a coating of powdered urease inhibitor (N-(n-butyl)thiophosphoric acid triamide; Agrotain®). In 2016, fertiliser was applied twice to experimental plots known as the Engineer's Field (also known as the South Field in Cowan et al., 2016). In 2017, fertiliser was applied three times to experimental plots in an adjacent similarly managed field (known as the Upper Joiner Field).
Table 1Management of experimental plots over five fertilisation events at Easter Bush Farm, 2016 and 2017. A total of 70 kg N ha−1 was applied each time.
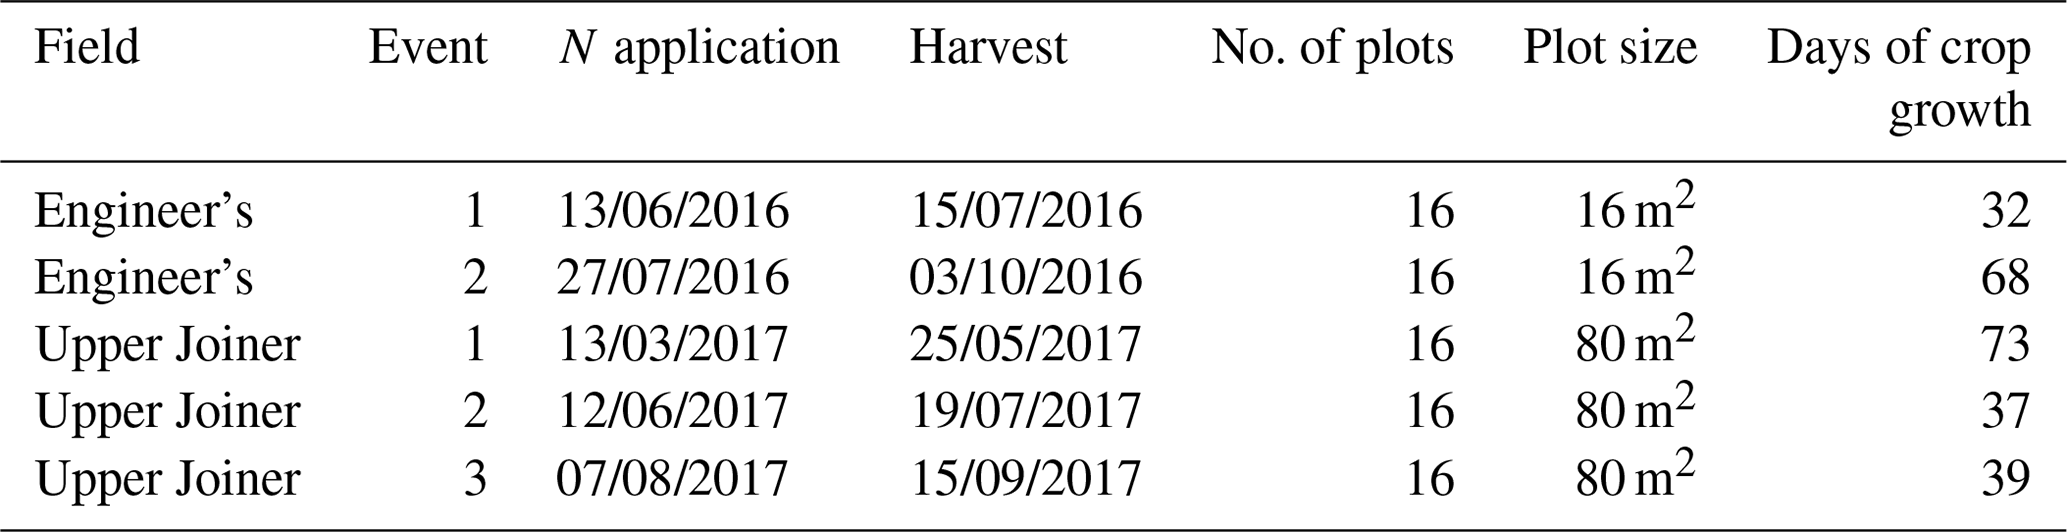
The soil in both fields is classified as a clay loam for the top 30 cm in fields, with a pH (in H2O) of 6.5 and 6.1 for the Engineer's and Upper Joiner fields, respectively. They are classed as an imperfectly drained Macmerry soil of the Rowanhill association (Eutric Cambisol, FAO classification). All fertiliser applications were of 70 kg N ha−1 (Table 1), which was consistent with the typical management regime of the fields. Both fields are used as grazing pastures for mainly sheep at high stocking densities of approximately 20 ewes per hectare. The sheep were vacated before and throughout the duration of the experiment, and instead the grass was grown for silage. While sheep were vacated from the 2016 field a month prior to the experiment, the 2017 plots had not been grazed for more than 6 months before the experiment.
For each of the five fertiliser events there were a total of 16 plots: four treatments (including the control) replicated four times. The layout of the experimental plots varied in the two different fields. In 2016 the 16 (Engineer's Field) plots were separated into strips of 2 m by 8 m (with a 0.5 m spacing between them). The treatments were assigned a random plot position in order to capture the spatial variability across the experimental area during measurements. In contrast, in 2017 the (Upper Joiner Field) plots were arranged in a square grid, each measuring 20 m by 20 m with no spacing between them. The treatments were also assigned at random across the grid in 2017 to capture spatial variability. For each fertiliser event the grass was allowed to grow for as long as the farm manager recommended for a full harvest (weather dependent), and then all plots were harvested on the same day (see Table 1).
2.2 Crop yield and quality measurements
Each of the plots was harvested and above-ground biomass was dried at 60 ∘C for 24 h, and both wet and dry weights were recorded. For the smaller 2016 plots, a 1 m2 section of each plot was harvested manually using sheers (i.e. one sample per plot). For the larger 2017 plots, a small harvester with onboard weighing capabilities (Haldrup F-55) was able to harvest an area of 30 m2 from which yield data were obtained. After wet yield was recorded, subsamples were taken from each of the individual plots for further analysis (at SRUC Analytical Services, Midlothian, UK). The dry matter content, metabolisable energy (ME), crude protein, modified acid detergent (MAD), decimal reduction time (D value), total carbon and total nitrogen contents were all analysed from the subsamples.
The nitrogen use efficiency (NUE) reported in this study refers to the crop uptake efficiency of the total nitrogen fertiliser applied. This was calculated by subtracting the mean total nitrogen content of the harvested grass from the control plots from the mean of the treatment plots for each individual event. The NUE for each treatment was then calculated by dividing this difference by the input of N fertiliser for a known area, thus providing the overall impact of the fertiliser on crop growth. Uncertainties in these values are represented by the 95 % confidence interval of the mean, calculated by multiplying the standard deviation by 1.96. The least squares method is used to combine uncertainties when subtraction or addition is used.
2.3 N2O flux measurements
Measurements of N2O fluxes were taken for both 2016 and 2017 experiments using the static chamber approach. The chambers consisted of a cylindrical polyvinyl chloride (PVC) plastic pipe of 38 cm inner diameter (ID) and 22 cm height fitted with a sealed lid and a flange at the base. The chambers were placed onto a plastic flanged collar that had been inserted several centimetres into the soil (on average 5 cm) to form a seal in the soil. A layer of draught sealant material held in place by four strong gripping clips formed an airtight seal between the chamber and the collar for the duration of the flux measurement. Chambers were closed for 60 min, during which time four gas samples were collected via a syringe and a three-way tap fitted to the lid, at t=0, 20, 40 and 60 min. Gas samples were stored in 20 mL glass vials which were flushed with 100 mL of air from the syringe using a double needle. Samples were analysed using gas chromatography (7890B GC system fitted with an electron capture detector, Agilent Technologies, UK), with a limit of detection of 7 ppb (Drewer et al., 2017). Measurements were carried out daily for 2 weeks after fertilisation and then every second day for a further 2 to 4 weeks. Measurements were made only on working days (Monday to Friday) between 09:00 and 15:00 GMT.
Fluxes were calculated as
where F is the gas flux from the soil (nmol m−2 s−1), dC/dt is the rate of change in the concentration in time in nanomoles per mole per second (nmol mol−1 s−1) estimated by linear regression, ρ is the density of air in moles per cubic metre (mol m−3), V is the volume of the chamber in cubic metres and A is the ground area enclosed by the chamber in square metres.
Cumulative fluxes over the experimental periods (30 d) were calculated using a Bayesian approach, taking into account the log-normal distribution of spatial samples and the log-normal peak-and-decay pattern in time (Levy et al., 2017). Based on the assumption that, at a given time, N2O fluxes, F, are typically log-normally distributed in space, the probability density is given by
where μlog and σlog are the location and scale parameters, equivalent to the mean and standard deviation of the log-transformed variate.
Following a fertilisation event, the time course of N2O flux is expected to rise to a peak and then decay exponentially, and this basic pattern is reproduced by all process-based models (i.e. Li et al., 1992; Del Grosso et al., 2006) and is also well described by the log-normal equation:
where μt is the spatial mean of the N2O flux at time t, Δ and k are analogues for the location and scale parameters, and with the additional term Nin is the fertiliser nitrogen input and Ω is the fraction of this which is emitted as N2O as t tends toward infinity. Δ can be interpreted as the natural logarithm of the delay between fertiliser application and peak flux; k is a decay rate term. So, at time t following fertilisation, the mean flux is given by
The parameters μ, μlog and σlog were estimated using the Markov chain Monte Carlo (MCMC) method with Gibbs sampling (Gelman, 2013). This was implemented using the freely available JAGS software (Plummer, 2016). The prior distribution for Ω was based on the data collated by Stehfest and Bouwman (2006). The prior distributions for Δ and k were based on the dynamics of the DeNitrification-DeComposition (DNDC) model (Li et al., 1992, as described in Levy et al., 2017). To obtain the cumulative flux at time t, we use the standard log-normal cumulative distribution function:
where Φ is the cumulative distribution function of the standard normal distribution.
To account for background fluxes (fluxes of N2O expected in the absence of any applied nitrogen), a cumulative background flux was estimated using the mean of the fluxes measured from the control plots during each event. This cumulative background estimate was then subtracted from the cumulative fluxes estimated for each treatment. The reported EFs in this study take background fluxes into account when reporting final values.
2.4 NH3 flux measurements
During the 2016 measurements we were unable to obtain wind tunnels to measure NH3 flux as originally planned. Therefore, in 2017 fluxes of NH3 were derived using the Flux Interpretation by Dispersion and Exchange over Short Range (FIDES) inverse dispersion model as described in detail in Loubet et al. (2010, 2018). This approach requires relatively large plots (20 m2), and according to the farmers requirements needed to be set up in the Upper Joiner Field, diagonally opposite from the Engineer's Field. The basis of the model is the solution of the advection–diffusion equation by (Philip, 1959), assuming power law profiles for the wind speed (U(z)) and the vertical diffusivity (Kz(z)). The model assumes that the atmospheric NH3 concentration (χ in µg NH3 m−3) at a given point is the sum of the background concentration (χbgd in µg NH3 m−3) unaffected by the sources and the influence of the sources (Eq. 6). The latter is equal to all the source strengths per unit surface area (S in µg NH3 m−2 s−1) at locations (xs, ys, zs) multiplied by the dispersion function ( in s m−1), which expresses the contribution of each source to each receptor point at which the concentration is considered. The meaning of can be viewed simply as the concentration at location for a source of unit strength at location (Loubet et al., 2010, 2018).
In order to calculate S, D was computed by the model, and both χ and χbgd were measured. To calculate D, the description of Philip (1959) was followed as shown in Eqs. (7)–(10). Here, the values of a, b, p and n are derived from a linear regression between ln (U), ln (Kz) and ln (z), over the height range 2×z0 to 20 m, using U(z) and Kz(z) estimated based on the Monin–Obukhov similarity theory (e.g. Kaimal and Finnigan, 1994), where z0 denotes the roughness length. In Eq. (9), , and , where WD is the wind direction; , , and I−ν is the modified Bessel function of the first kind of order −ν. Finally, in Eq. (10) Cy and m are parameters taken from Sutton (1932).
Wind data were recorded by two sonic anemometers (IRGASON, Campbell Scientific, UT, USA) which were positioned at the north-east and south-west sides of the plots, 30 m from the borders of the plots in alignment with the two predominant wind directions. The anemometers measured 3-D wind components at 10 Hz. Following Loubet and Cellier (2001), the source height was tuned to , where d is the displacement height, in order to insure best comparison with Lagrangian stochastic models and experiments (see also Loubet at al., 2010). The dispersion model embedded in FIDES is essentially similar to the Kormann and Meixner (2001) footprint model, except for the retrieval of the a, b, p, n parameters which are here inferred by fitting the wind speed and diffusivity profiles over a height range 0.2–20 m, while in Foken and Meixner (2001) it was computed by forcing the profiles at a reference height. The FIDES model was shown to behave similarly to a Lagrangian stochastic model in Loubet et al. (2018).
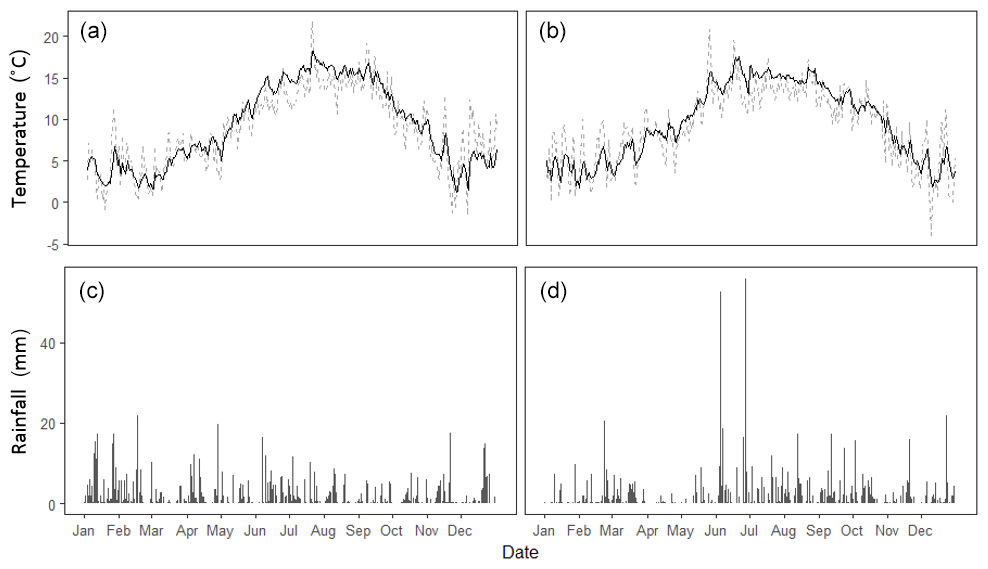
Figure 1Meteorological data recorded at Easter Bush Farm over 2016 (a, c) and 2017 (b, d). Daily mean soil temperature (black) and air temperature (grey) as well as daily cumulative rainfall are presented.
For the concentration measurements, Alpha passive air samplers (Tang et al., 2001) were used. These samplers are small hollow plastic tubes (27 mm ID) with a PTFE membrane which allows air to pass through. Inside there is a layer of filter paper coated with citric acid which traps atmospheric NH3 and holds it in place within the sampler. This method enabled us to measure cumulative NH3 concentrations at a fixed point, integrated over a certain period of time (t) of several hours or days. To observe χmeas, duplicate samplers were positioned at the centre of the 16 treatment plots (20 by 20 m) at heights of 30 and 50 cm. In order to measure χbgd, samplers were installed in triplicate at the four edges of the experimental grid, 30 m away from the plots. Samplers were placed immediately before fertilisation and removed/replaced 0.25, 1, 2, 3, 7 and 14 d after fertilisation. Samplers were stored at 4 ∘C after collection before extraction by deionised water and analysis using ammonia flow injection analysis (AMFIA, CEH Edinburgh, UK). Due to logistical constraints, we were limited in the number of measurements we could make using the FIDES method. Based on the extensive experience of the researchers in the field of NH3 flux measurements, and numerous studies of NH3 emissions (e.g. Gericke et al., 2011; Sanz-Cobena et al., 2011; Suter et al., 2013), we decided to measure for a period of 2 weeks, which would allow us to capture the vast majority of any cumulative emissions associated with the fertiliser event, which typically last only several days.
2.5 Soil measurements
Soil cores were sampled from a distance of approximately 2 m from the static chambers (within the appropriate experimental plot) each time N2O flux measurements were made. Cores were 3 cm in diameter and 10 cm in depth. Samples were frozen immediately after collection and stored at −18 ∘C until further processing up to 3 months later. A potassium chloride (KCl) solution (50 mL, 1 mol L−1) was used to extract Nr (in the form of and ) from the samples (15 g, wet soil). Having added the 1 M KCl solution to the samples, they were subsequently mixed on an orbital shaker for 60 min before the solution was filtered using 2.5 µm filter paper (Fisherbrand, US) and stored at −18 ∘C for analysis up to 3 months later. A further 10 g of mixed soil was dried to provide the dry soil ratio of each soil sample.
Concentrations of and in the soil extracts were measured using a SEAL AQ2 discrete analyser (SEAL Analytical, US) fitted with a cadmium coil. The widely used phenol-hypochlorite (for ) and sulfanilamide ( and after cadmium coil reduction) methods were used to provide the relevant colorimetry reactions. Concentrations of and in soil were then calculated based on the mass of dry soil in the initial KCl extraction.
2.6 Meteorological data
Long-term meteorological and soil measurements were recorded at the permanent Easter Bush measurement station, which was situated at the edge of the Engineer's Field. This station provided measurements of air temperature (1.8 m), soil temperature (0.3 m depth) and rainfall (tipping bucket) at 30 min intervals throughout the measurement campaigns (Fig. 1).
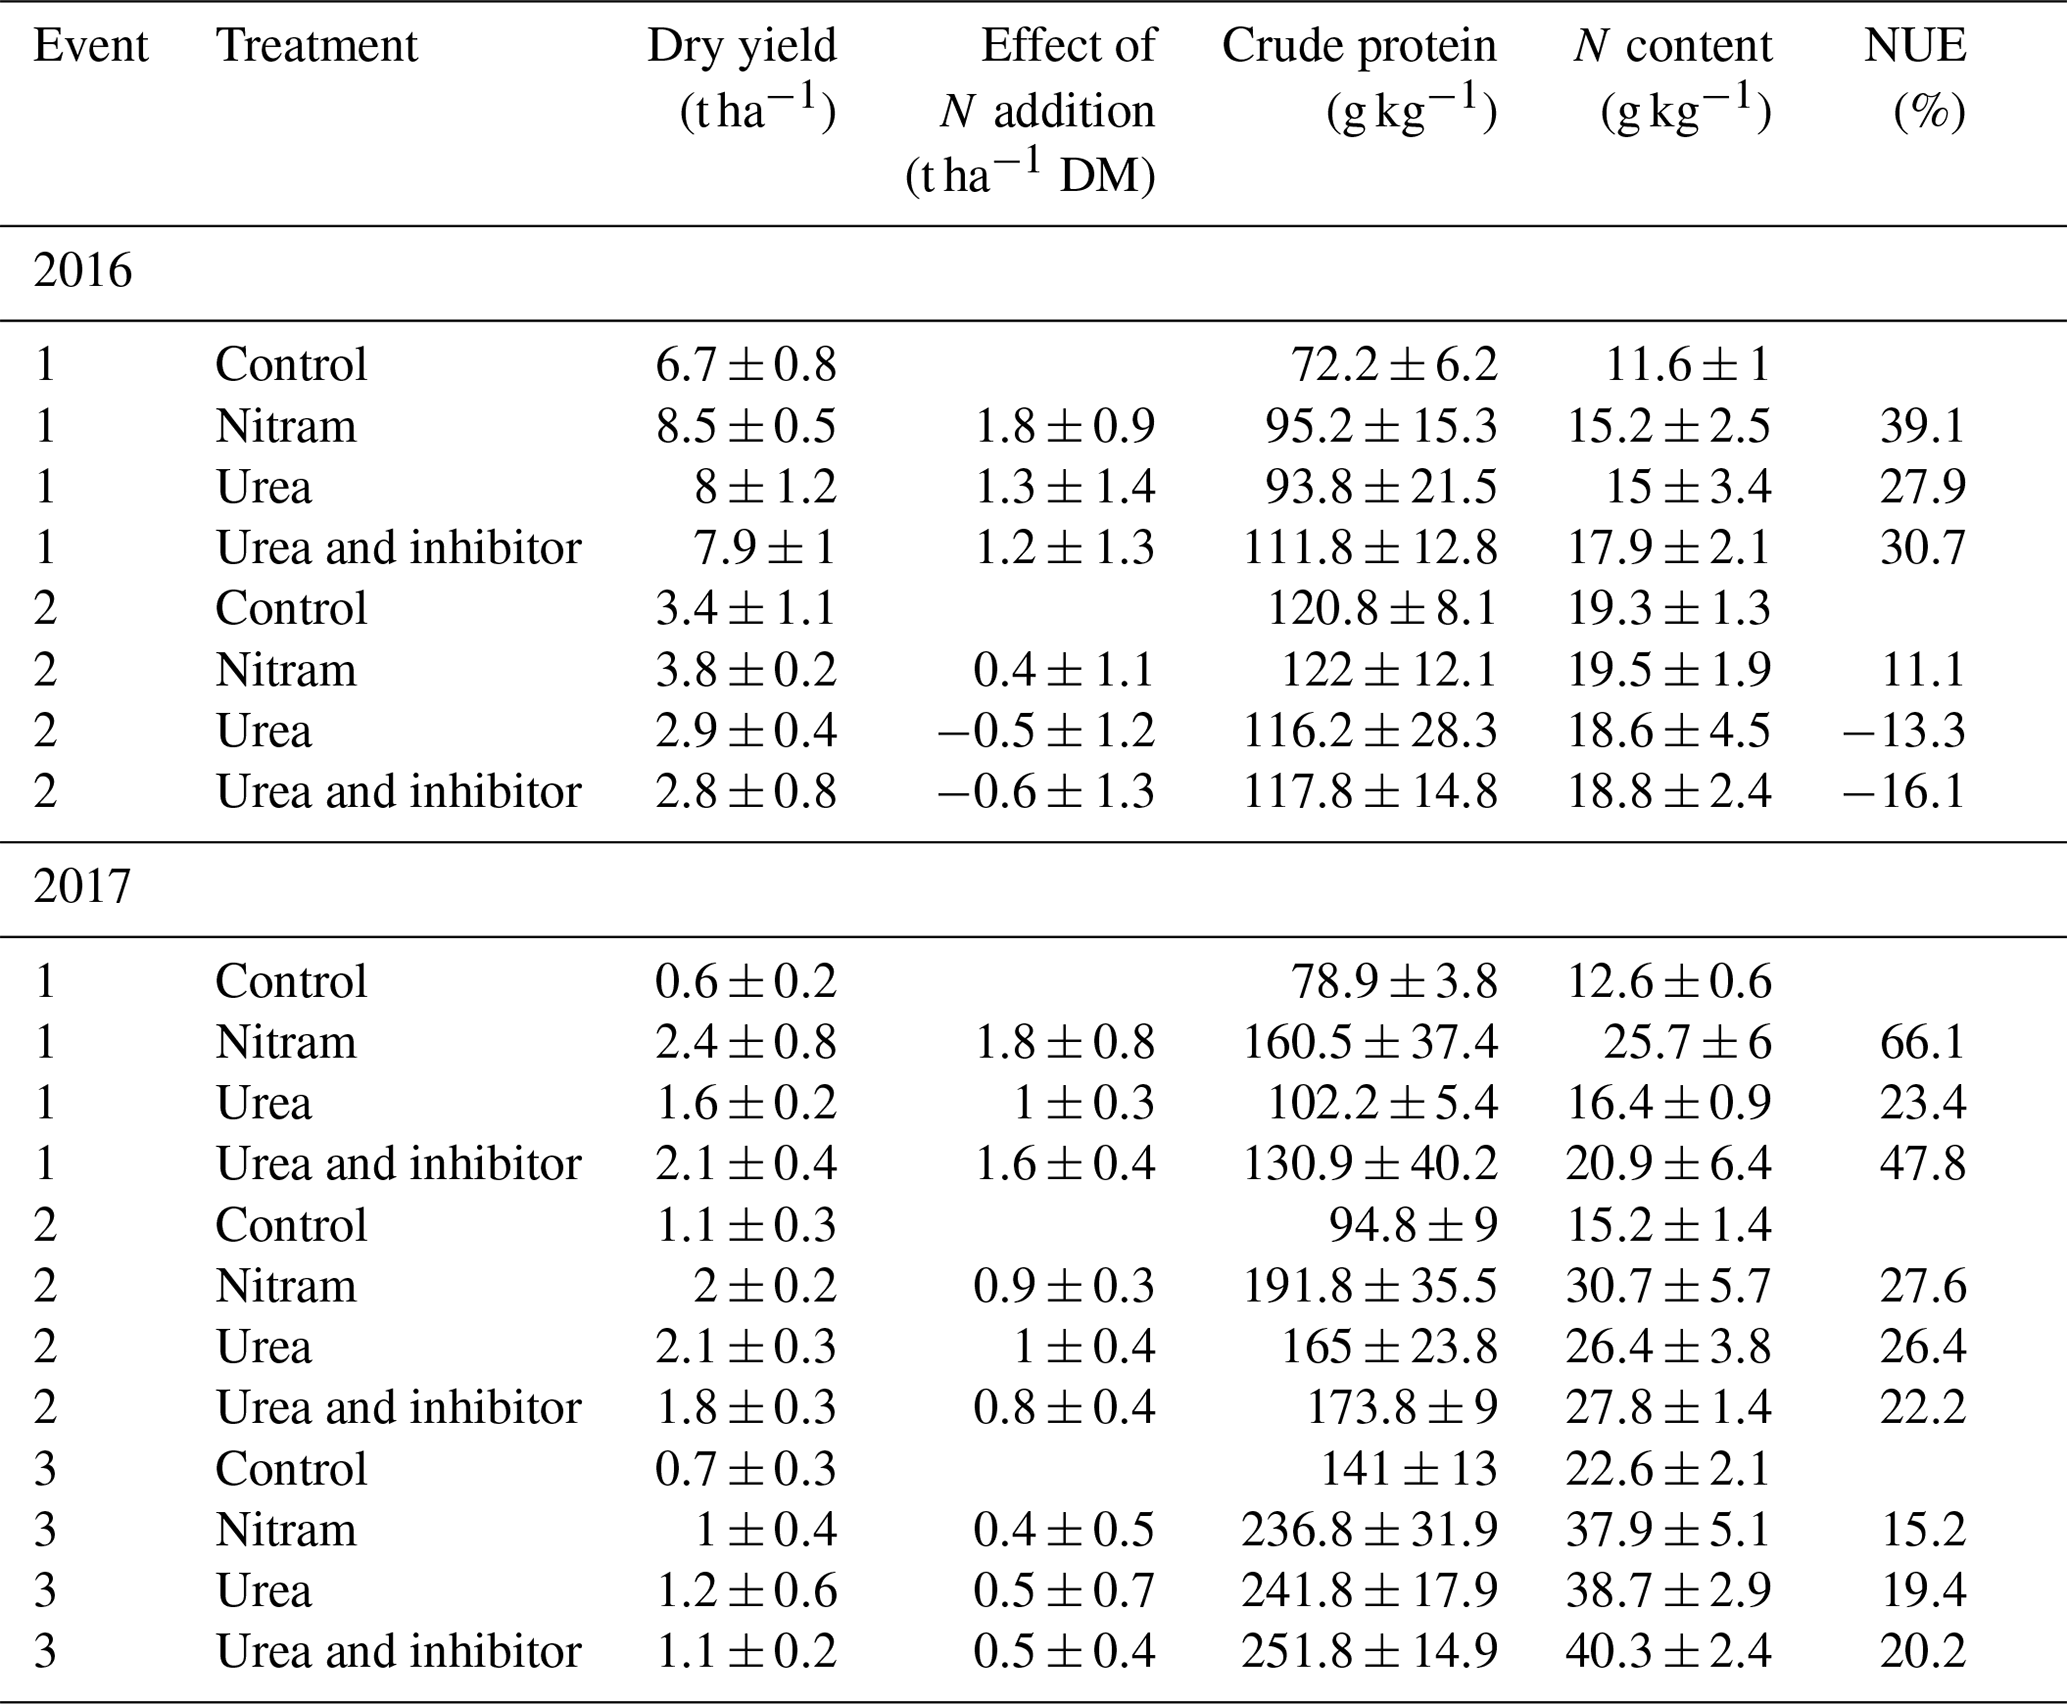
Table 2Crop quality measurements of subsamples taken from harvests of all experimental treatment plots. Mean values and standard deviation of samples are provided (n=4 replicates). Effect of N addition is reported as the additional dry matter (DM) harvested compared to the control plots. The total N content of the dry matter and NUE for each event are presented.
3.1 Crop yield, NUE and quality
Although rainfall and temperature was similar during both years of measurement, crop yields for all treatments were substantially larger in the 2016 field plots (5.5 t ha−1) than the 2017 field plots (1.48 t ha−1) (Table 2), indicating that the Engineer's Field was the more productive of the two experimental areas regardless of fertiliser application or meteorological conditions. There was reasonably large variation in yield measurements from the harvests in both fields, and in some cases (October 2016) the effect of the addition of fertiliser (i.e. dry control yields subtracted from dry yields of fertilised plots) appeared to have a negative effect on yield (although these values fall well within the large uncertainty range around zero). Overall the most efficient fertiliser overall was ammonium nitrate (Nitram), increasing yields (after subtraction of the control) on average by 1.05±0.61 t ha−1, with a mean NUE of 35.5 %. Urea and inhibitor-coated urea increased yields by an average of 0.66±0.62 and 0.69±0.73 t ha−1, respectively. Nitram treatment was found to increase yields significantly (p value < 0.05) when compared to the urea fertilisers. The treated urea had a slightly higher average NUE than the untreated urea (24.6 % and 20.7 %, respectively), but this difference was not statistically significant (p value =0.91).
In terms of yield response to the fertilisers, large differences were observed between the two adjacent experimental fields, even though historical management practices were largely similar. In the Engineer's Field plots (2016), the response to the fertiliser was muted, with relatively large variation between the plots. Yield response (and standard deviation) of the plots (treated minus control) was largest for the Nitram treatments at 19 (±10) %, while the urea and inhibitor-treated urea had little impact on crop yield, with only a 2.0 (±23) % and 0.7 (±26) % larger harvest when compared to the control plots, respectively. In the Upper Joiner Field (2017), the yield response was much higher at 150 (±144) %, 113 (±69) % and 136 (±107) % for the Nitram, urea and treated urea treatments.
Crude protein (and therefore nitrogen) content of the fertilised plots (154 g kg−1) was typically higher than that of the control plots (102 g kg−1) for all fertiliser treatments; however, there were no outstanding differences between the treatment types. Differences in metabolisable energy (grass ME), modified acid detergent (MAD) and decimal reduction time (D value) between the fertiliser treatments were also small and varied more between the two field sites than the type 2 fertilisers. These indicators of digestibility and energy content are commonly used to indicate the quality of the silage grass for animal feed and our study suggests that there were no significant differences between the feedstock grown using the different fertilisers.
3.2 N2O fluxes
N2O fluxes from the chambers ranged from −0.39 to 24.47 nmol m−2 s−1 and showed a log-normal spatial distribution. The majority of flux measurements were close to zero, with 81 % below 1 nmol m−2 s−1 in magnitude (Fig. 2). Observed fluxes increased in magnitude from the plots treated with Nitram immediately after fertilisation, typically peaking within a week of the Nr application. Fluxes also increased after the urea and inhibitor-coated urea applications, although the timing of the peaks in these emissions was more variable than that observed from the Nitram plots.
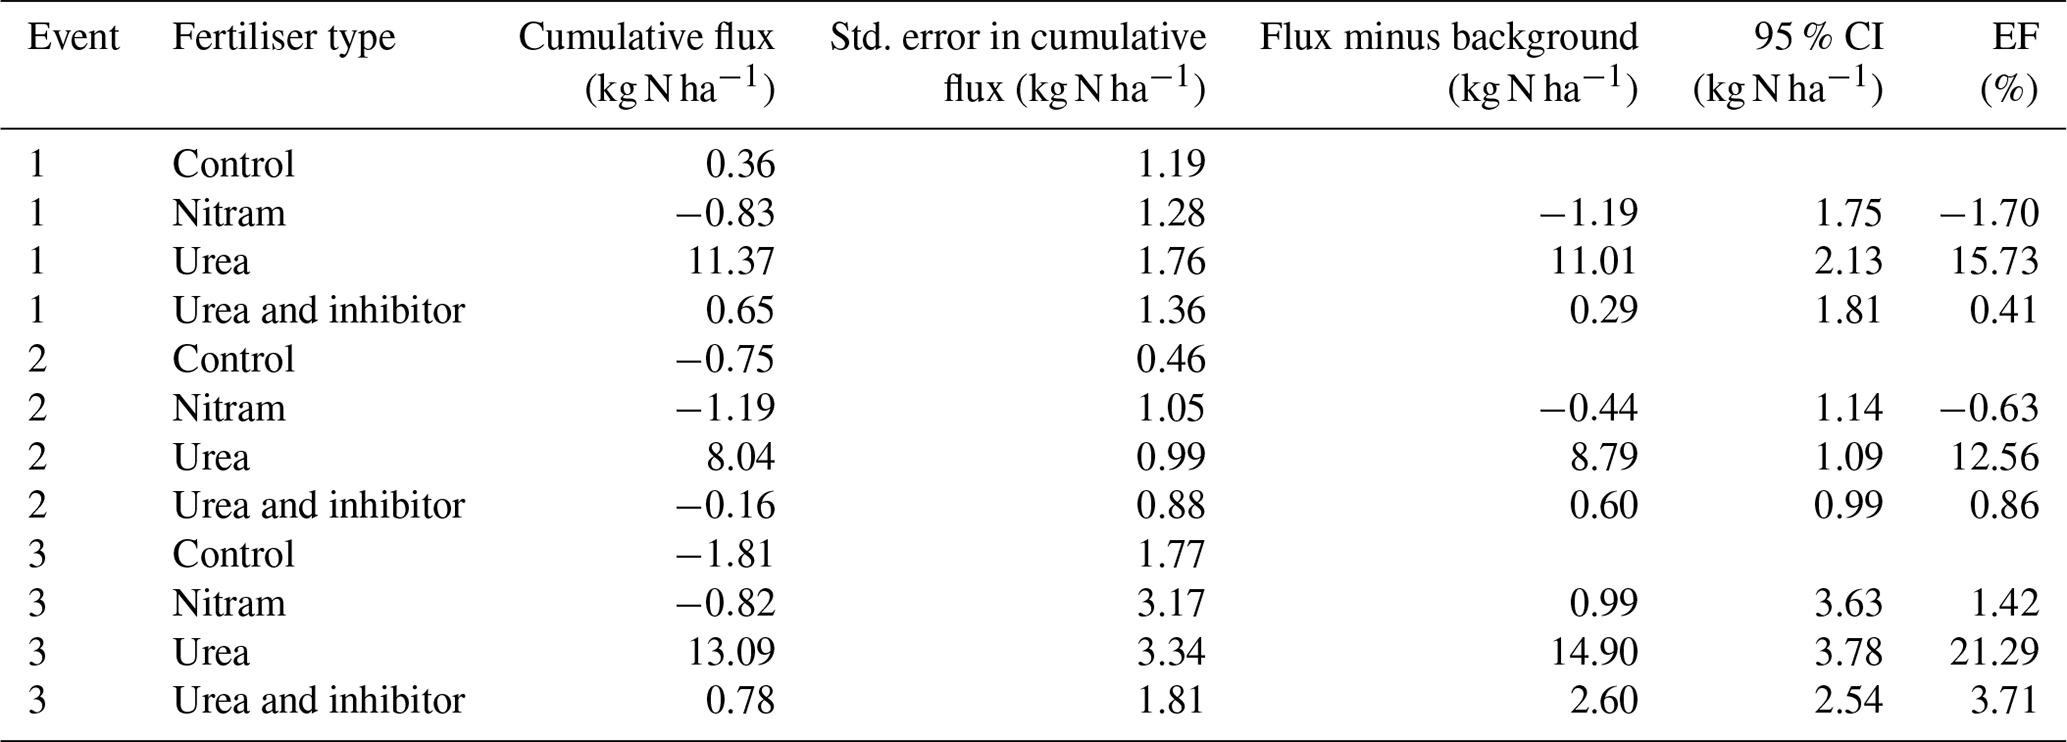
Table 3Cumulative N2O fluxes estimated using the Bayesian interpolation method over a 30 d period after fertiliser applications (70 kg N ha−1) at two intensively managed grassland sites. Values presented represent four plots (n=4) per event at each field site. Emission factors (EFs) account for the effect of N application after the measured background flux has been deducted from cumulative totals. CI denotes the confidence interval.
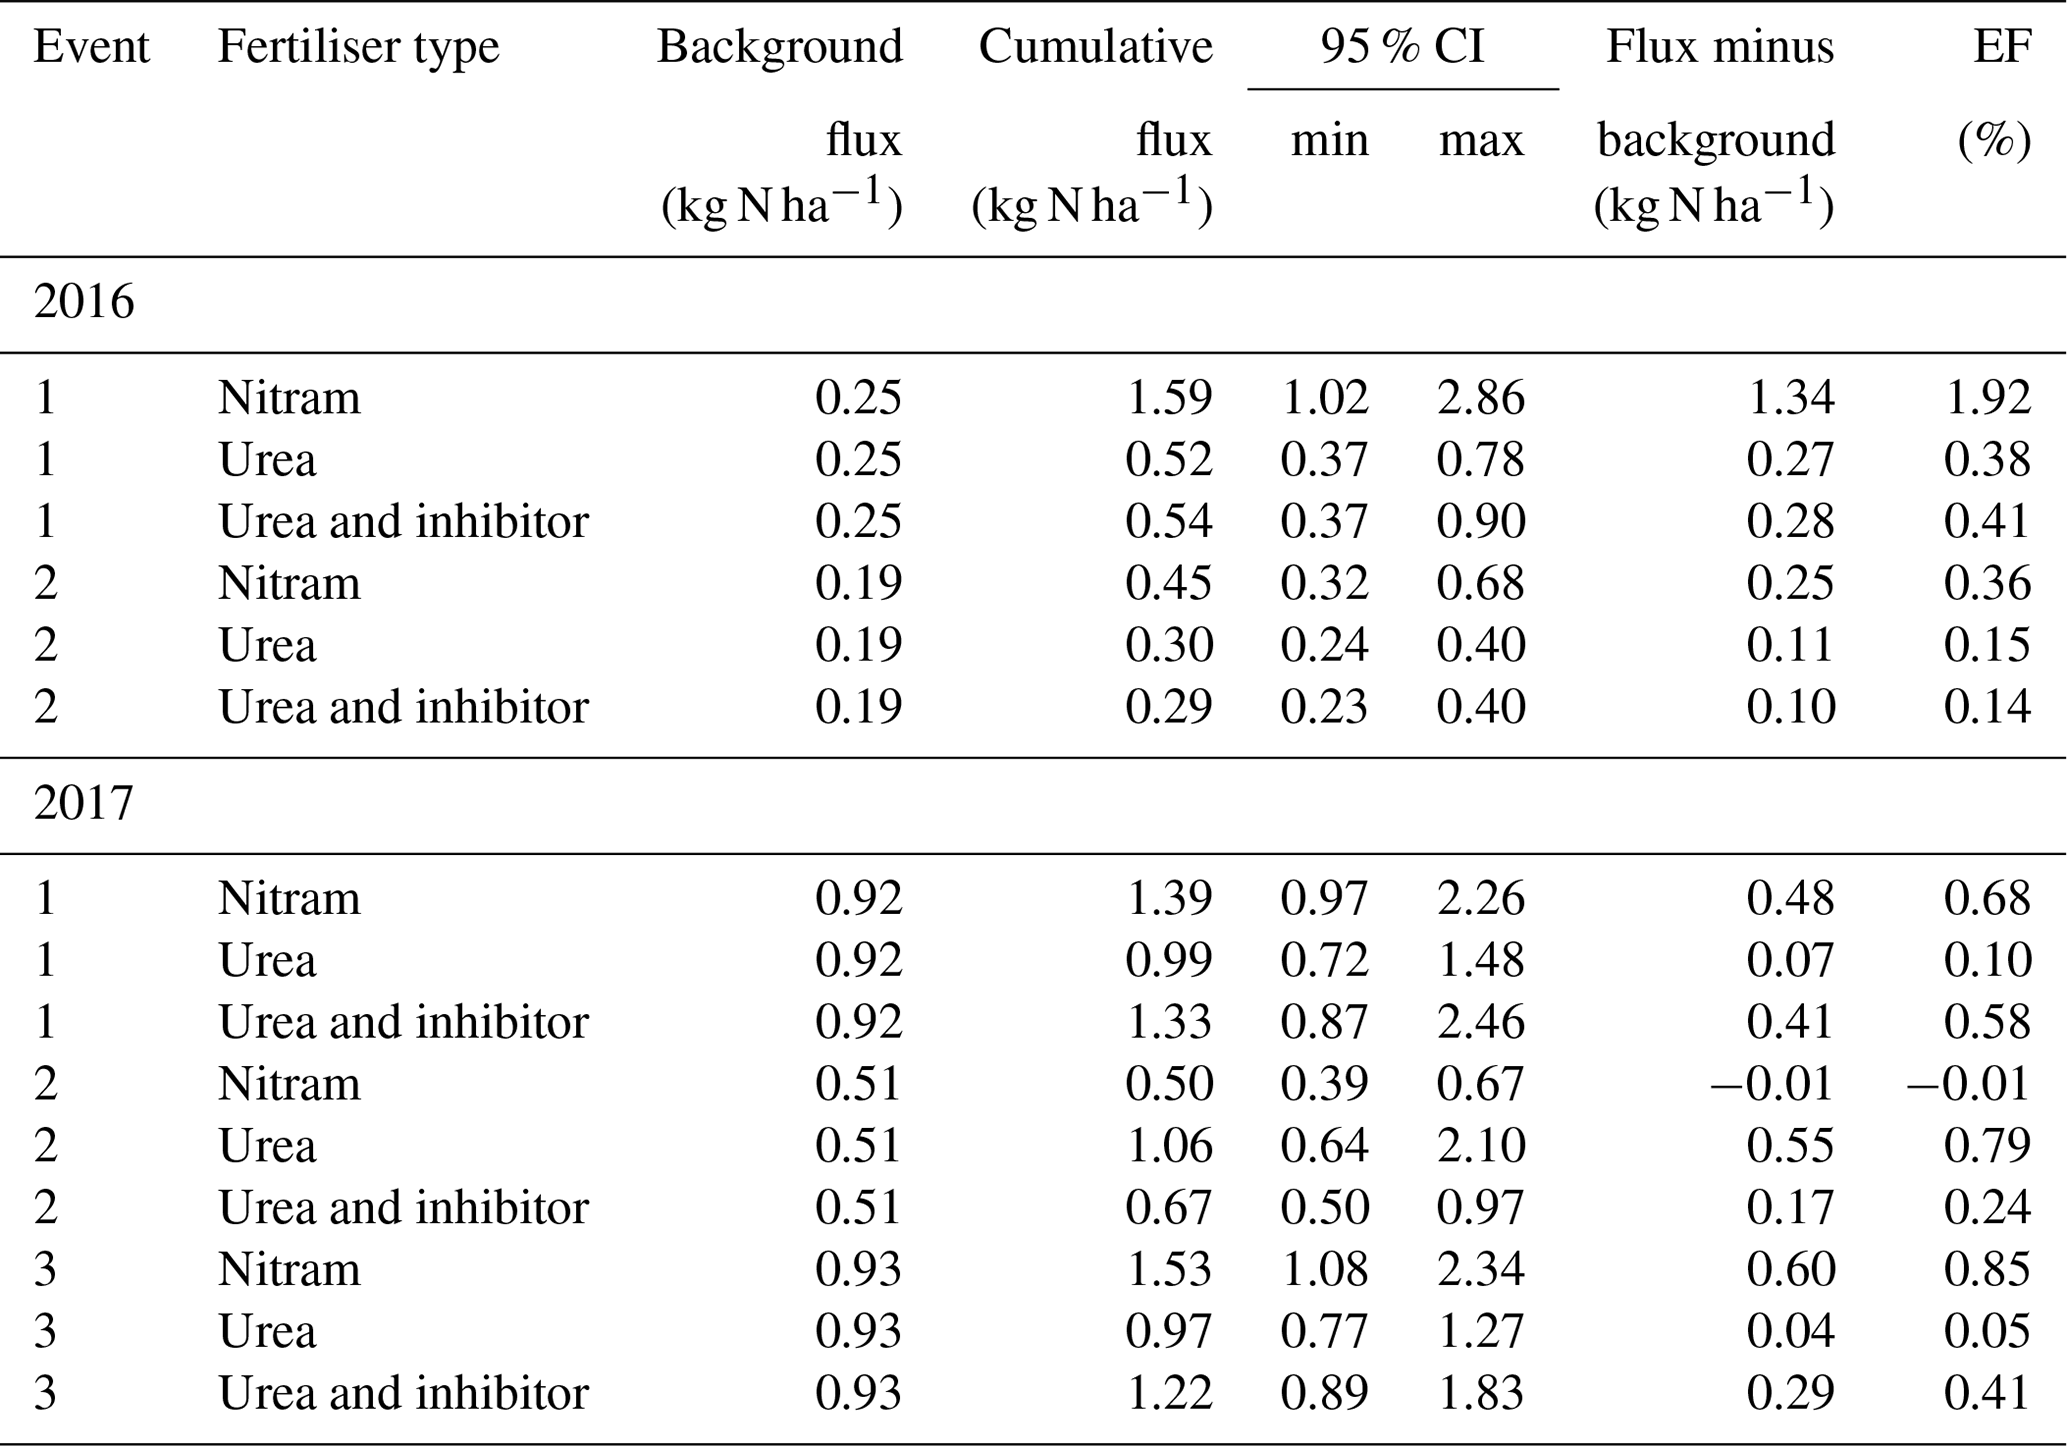
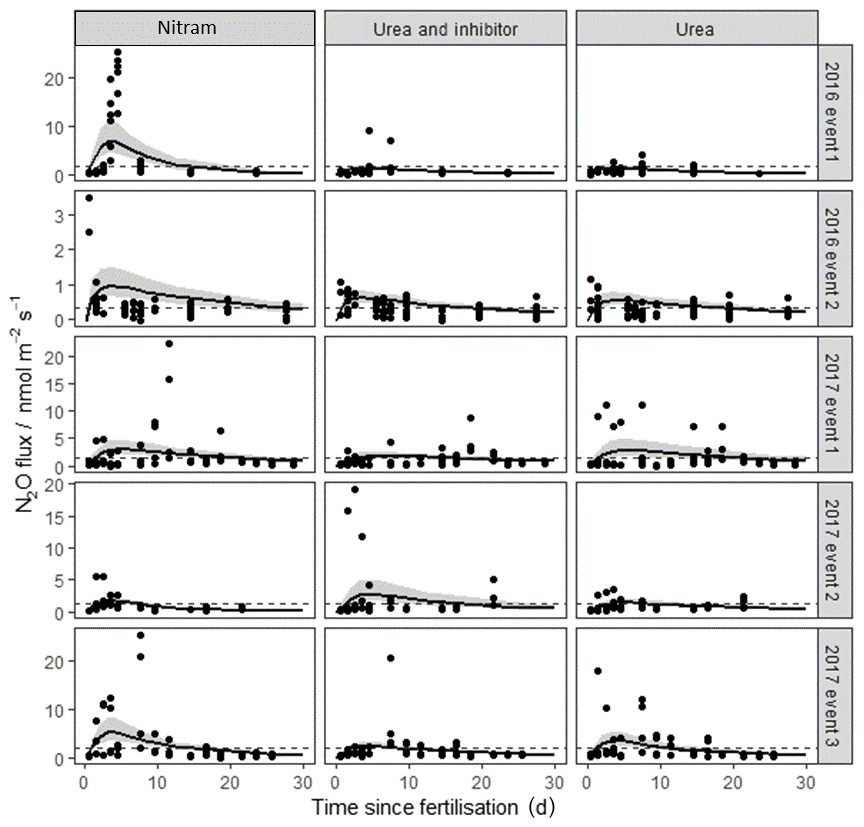
Figure 2N2O fluxes following fertilisation of the Engineer's Field in 2016 and Upper Joiner Field in 2017. Fertiliser was applied at t=0 d, and the measurements lasted up to 30 d for each event. The log-normal model was used to estimate cumulative N2O fluxes. The 95 % credible intervals of the posterior predictions are shown as the shaded area. Mean background fluxes from control plots are included for each event (dashed line).
Cumulative flux estimations of N2O from the individual fertilisation events have a typical large relative uncertainty, due to the difficulty in extrapolating measurement data both spatially and temporally from small data sets. In this study we have chosen to calculate cumulative fluxes using the Bayesian model outlined in Eqs. (2)–(5) rather than the trapezoidal method (linear interpolation between mean values) in order to better represent this uncertainty (Levy et al., 2017). Regardless of the large associated uncertainties in cumulative flux estimates, our measurements show that the Nitram fertiliser results in significantly larger N2O emissions when compared to the urea and inhibitor-coated urea applications of the same quantity of Nr (p value < 0.05) (Table 3). In four of the five events, Nitram was the highest N2O-emitting fertiliser of the treatments after 30 d (minus background from control plots) with a mean EF between replicates of 0.76±0.63 % (Table 3). Emissions from the urea and the inhibitor-treated urea were comparable in magnitude, 0.29±0.27 % and 0.36±0.15 % of the applied Nr, respectively.
Table 4Cumulative fluxes of NH3 estimated the FIDES method over a 14 d period after fertiliser applications (70 kg N ha−1) at the Upper Joiner grassland. Values presented represent four plots (n=4) per event at each field site. Emission factors account for the effect of N application after the measured background flux has been deducted from cumulative totals. The 95 % CI is calculated using the least squares method to combine the standard error between the replicates for each treatment.
3.3 NH3 fluxes
Ammonia fluxes were only measured during the three fertilisation events in 2017. The majority of the NH3 emissions occurred between 0 and 5 d after fertiliser was applied, and emissions beyond 7 d after fertiliser application were largely negligible. Emissions of NH3 from the plots varied widely with cumulative flux values from individual plots ranging from −1.8 to 13.1 kg N ha−1 at the end of the 14 d measurement period (Fig. 3 and Table 4). Emissions from the plots treated with urea fertiliser were consistently higher than those of the other treatments after fertiliser applications. Mean cumulative emissions for each of the fertiliser types after all three fertilisation events (n=12) were −0.74, −0.95, 10.83 and 0.42 kg N ha−1 for the control, Nitram, urea and inhibitor-treated urea, respectively.
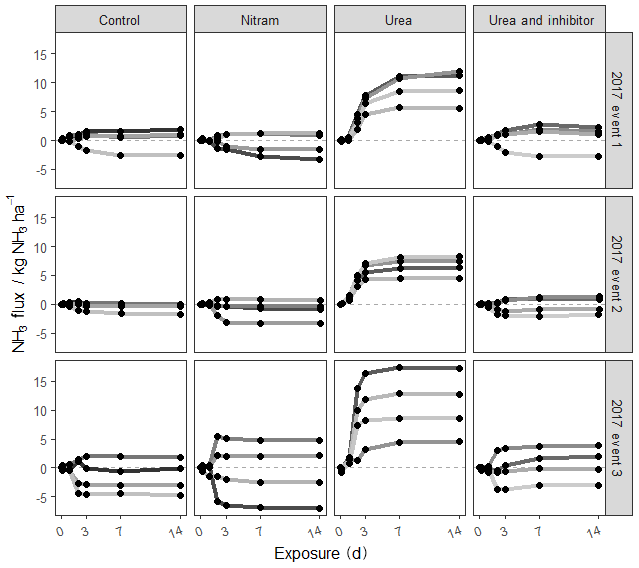
Figure 3Cumulative fluxes from each of the experimental plots during three fertilisation events measured using the FIDES method (2017). Each shaded line represents one of the four plots replicated for each treatment.
Differences in NH3 from individual plots were typically larger than an order of magnitude of the mean value of the grouped treatments. As the control plots represent a near-zero-influence situation, the mean flux observed from the control plots for each event were subtracted from the fluxes associated from the treatment measurements. Based on this, emissions from the urea-treated plots (mean of 16.5±5.0 % of applied N) were considerably higher than each of the other treatments ( % and 1.66±2.0 % for Nitram and the inhibitor-coated urea, respectively). Fluxes measured from the Nitram plots were not significantly different to those from the control plots (p value =0.42), but emissions from the inhibitor-coated urea were (p value < 0.1).
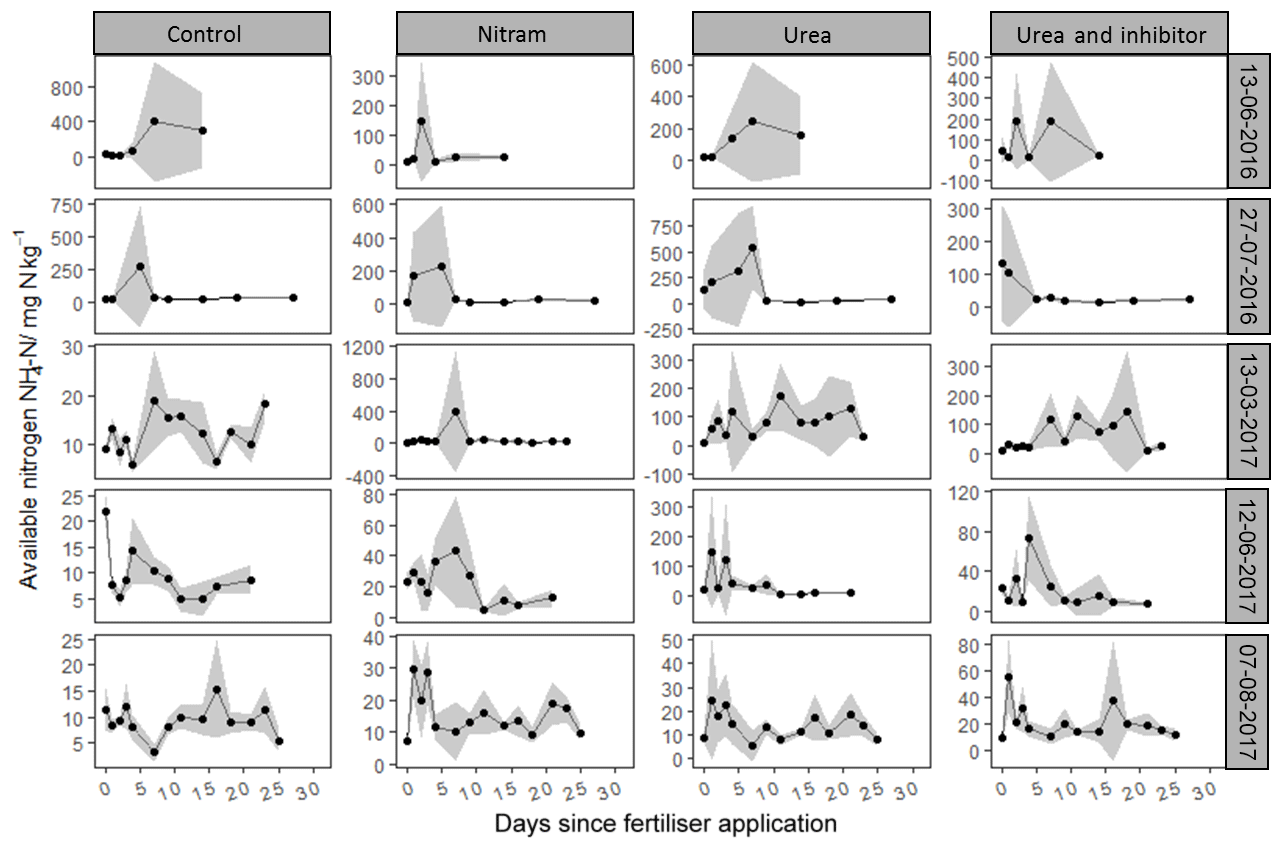
Figure 4Mean ammonium concentrations from soil samples (n=4) measured in tandem with N2O chamber measurements after fertilisation events. Standard deviation is included (grey ribbon).
3.4 Soil chemistry
As shown in Fig. 4, concentrations of varied by several orders of magnitude, with individual measurements ranging from 1.3 to 1525 mg of nitrogen per kilogram of soil sampled (mg kg−1). Concentrations of were consistently low in the experimental plots before fertiliser application, with the exception of the first fertiliser event in 2016, where elevated Nr was observed in the control plots, possibly due to residues from sheep grazing in the field close to 1 month before the experiment began. Concentrations of typically rose in magnitude for several days after fertiliser application before returning to pre-fertiliser magnitudes by the end of the measurement period. Concentrations of in soils treated with urea and inhibitor-coated urea were typically higher than those that received Nitram fertiliser. During the third fertiliser event (13 March 2017) there was a clear delay in the rate at which urea was hydrolysed into in the soil (Fig. 4). This phenomenon was not observed during the other events.
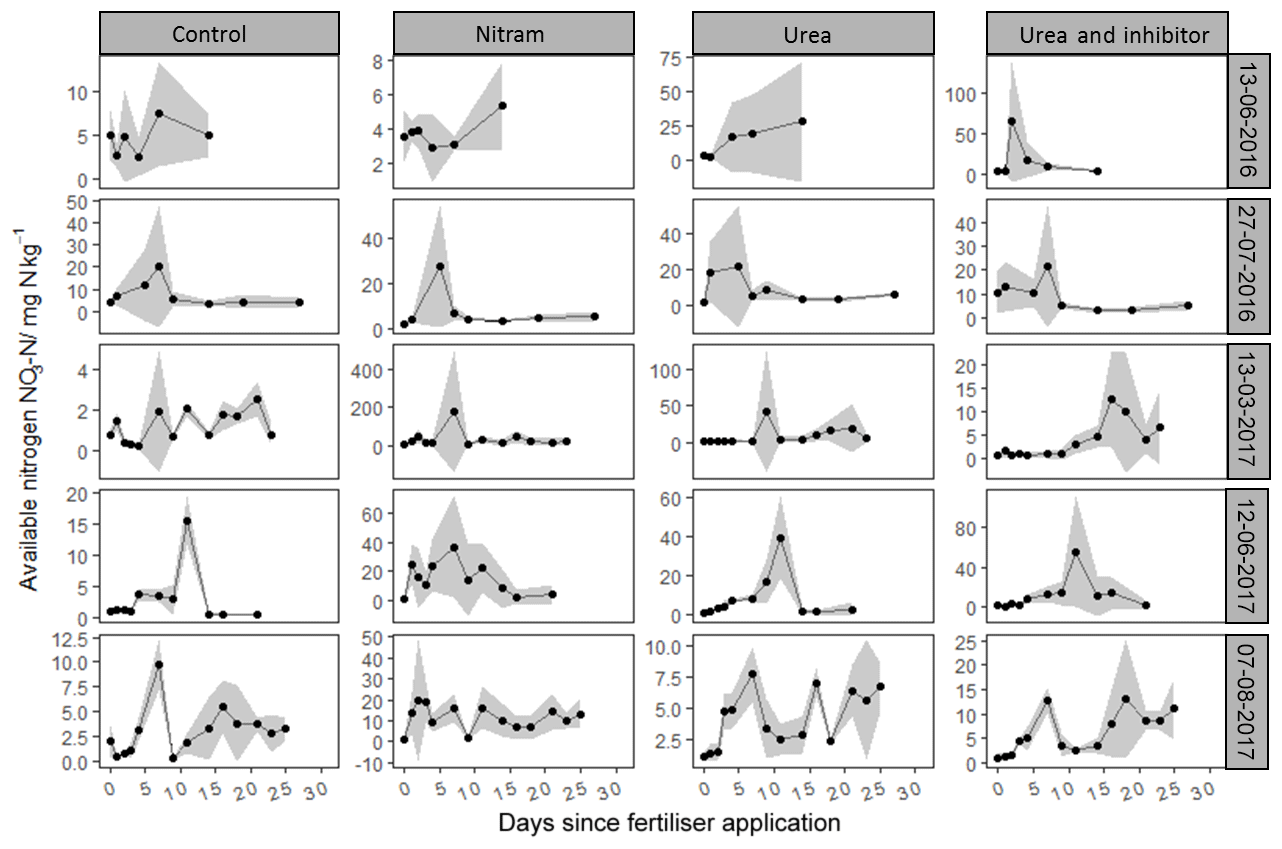
Figure 5Mean nitrate concentrations from soil samples (n=4) measured in tandem with N2O chamber measurements after fertilisation events. Standard deviation is included (grey ribbon).
Concentrations of followed a log-normal distribution in a similar fashion to the concentrations (Fig. 5). Nr in the form of was typically lower than that of with measured values ranging from 0.05 to 165 mg kg−1. As with , concentrations in the experimental plots were near zero before fertiliser application, with the exception of the first event. After Nitram application, concentrations typically rose and then decreased in concentration with time.
The yield and nitrogen uptake of the silage crop varied widely across the plots and seasons during the experiment. The quantity of the applied fertiliser that was consumed by the crops ranged from a maximum of 66 % to a negative value of −16 % compared with the adjacent control plots. As there were only small differences between the total N content of the crop for the three different fertiliser types, the percentage of applied N that was present in the harvest from the plots scales closely with the overall dry yield. In this respect, the Nitram-treated plots have the highest NUE of the three treatments, with a mean NUE of 35±19 % when compared to urea (21±15 %) and the inhibitor-treated urea (24±20 %).
The perceived negative effect of fertiliser application during the 2016 trials may have been influenced by a considerably large amount of clover that had begun to grow in the plots by late spring. The nitrogen-fixing properties of the clover may have had some impact on the results of the experiment, although not atypical of grazed grasslands (Marriott, 1988). We speculate that the prior grazing of the sheep is also likely to have resulted in the residues of animal waste in the 2016 plots, which would explain the higher-than-expected yields and Nr in the soil measurements in these plots (Cowan et al., 2015). Although unintentional, the presence of these two factors sheds some light into the importance of N fixation and animal waste in grazed fields which often receive similar applications of N fertiliser to arable crops. The 2016 plots in our study show that when there is a large amount of Nr already present in the soils, the application of further Nr can have a negligible effect on yield response while still contributing to N pollution. The reason for such high individual concentration measurements of available Nr measured sporadically throughout the experiment are unclear and may arise as a result of a cluster of fertiliser pellets dissolving in close proximity, or due to outside influences such as urine patches from rabbits or other wild animals. Similar spatial variability in available nitrogen is observed at the field scale in local studies (Cowan et al., 2015, 2017). The observed ineffectiveness of additional Nr applied to crops in these conditions highlights the future potential of precision farming methods which could take into account the spatial variability of Nr already present in the field and attempt to improve NUE by better managing where fertiliser is required and where it is not (Auernhammer, 2001; Kindred et al., 2017).
The 2017 plots did not appear to be influenced by clover growth or residues of animal waste after visual inspection, and subsequently the observed NUE was more comparable to values considered typical under the conditions (Raun and Johnson, 1999). Overall, the Nitram application resulted in the highest average yield, but there was little difference in yield observed between the urea and inhibitor-coated urea in this study. The crude protein content of the silage harvests varied largely between events, but the treatment effect was small and inconsistent. Differences in metabolisable energy (grass ME), modified acid detergent (MAD) and decimal reduction time (D value) between the fertiliser treatments were also small, with little variation observed between the events and the treatment types.
Emissions of N2O were higher from the plots treated with Nitram fertiliser than from the other treatments. This observation is consistent with previous research which has identified Nitram as a higher emitter than the urea fertiliser (DEFRA, 2006; Harty et al., 2016). Previous studies highlight a potential for pollution swapping with nitrification-inhibitor-treated urea (typically dicyandiamide, also known as DCD), suggesting that by reducing the rate of conversion of to in soils the NH3 emissions are increased (Lam et al., 2017; Zaman et al., 2009). Elevated N2O and NH3 emissions have been observed on occasion after the use of nitrification inhibitors (Scheer et al., 2017; Zaman et al., 2009); however, reductions in both have also been observed (Di and Cameron, 2006; Misselbrook et al., 2014). This should not be the case for urease inhibitors as it slows the release of Nr from the applied fertiliser, thus reducing the potential of N2O and NH3 emissions. Previous studies have shown that the use of urease inhibitors can significantly reduce N2O emissions (Singh et al., 2013; Zaman et al., 2009). In this study, emissions from the inhibitor-treated urea were slightly larger overall compared to the urea; however, the treatments behaved similarly throughout the experiment and the differences observed in this study were not statistically significant (p value =0.42). The emissions of N2O were not found to correlate well with any of the measured environmental variables such as rainfall or temperature, which is not uncommon. The wide variety of complex interacting conditions that influence microbial processes often prevent predictive modelling and correlation with environmental variables (Butterbach-Bahl et al., 2013).
Emissions of NH3 calculated using the FIDES method were consistently largest from the plots treated with urea fertiliser (mean EF of 16.5 % of applied Nr). The emissions from the Nitram plots were not significantly different from the control plots, suggesting that emissions were negligible from this treatment. These observations agree with previous studies in that urea treatments are expected to lose a large fraction of Nr as NH3 emissions (Sommer et al., 2004) while Nitram treatments do not (DEFRA, 2005). The urease inhibitor appears to have significantly reduced NH3 losses from the inhibitor-coated urea plots, reducing emissions of NH3 by approximately 90 % when compared to the untreated urea. This effect has been observed in other similar studies when applying a urease inhibitor to the urea fertiliser (Li et al., 2015; Rawluk et al., 2001). The large reduction in NH3 volatilisation and lack of yield response does raise the question of the fate of the Nr in the urease-treated urea plots.
After the N content of the crop, the N content of the soil and emissions of N2O and NH3 are taken into account, and the majority (> 55 %) of applied Nr in the experiments remains unaccounted for by the time of harvest. Typically, Nr in the form of and in the top 10 cm of soil has returned to concentrations on par with the control plots by harvest. When compared to the control plots, the remaining extractable Nr in the top 10 cm of the fertiliser-treated plots at the time of harvest accounted for less than 1 % of the applied nitrogen in all cases in this study. Other known pathways for large losses of Nr from agricultural soils include the leaching of into deeper soils and water systems, uptake of Nr into root systems, and microbial nitrification and denitrification which produces nitric oxide (NO) and gaseous nitrogen (N2). Leaching can account for 2 %–33 % of applied Nr (Riley et al., 2001; Sebilo et al., 2013; Skinner et al., 1997), root systems may consume Nr in the same order of magnitude as the harvested shoots (Watson, 1987), and microbial emissions of NO and N2 can account for Nr losses of an order of magnitude higher than N2O when water-filled pore space (WFPS) is particularly low (< 40 %) or high (> 80 %) (Davidson, 1993; Weier, 1993). All of these potential processes may account for a significant fraction of the unaccounted-for Nr applied to the plots in this experiment, and measurements should be included in future studies when logistically possible.
Large variations in crop yield measurements show that none of the fertiliser types used in this study consistently outperforms the others in terms of NUE. However, of the three fertilisers used, Nitram performed better on average than the urea compounds in this experiment with an average NUE of 35 % when compared to urea (21 %) and the inhibitor-treated urea (24 %). This study supports previous research which suggests that Nitram is the largest emitter of N2O (0.76 % of applied Nr) and that urea fertiliser is the largest emitter of NH3 (16.5 % of applied Nr) when the mineral fertilisers are compared. The use of the urease inhibitor resulted in a considerably large reduction in NH3 losses from the urea fertiliser (decrease of 90 %) without significantly increasing emissions of N2O; however, yields were statistically the same. The results of this study suggest that urease inhibitors, such as Agrotain®, can play an important role in mitigating Nr-related air pollution. However, the agronomic benefits to the farmer appear to be negligible. With the higher costs of urea coated with urease inhibitors, there is no incentive for farmers to switch to these more environmentally friendly compounds. Our experiments are short term only. There certainly is a need for more long-term studies covering different climate zones, crop types, and soil properties to investigate the economic and environmental benefits of switching from the preferred ammonium nitrate fertilisers in the UK to urea treated with urease inhibitors, or even double inhibition using nitrification and urease inhibitors.
Data will be published in full in the Environmental Information Data Centre (EIDC) for full public access upon the completion of the CINAg project in 2020.
NC managed the fieldwork, carried out the data analysis and wrote the manuscript. PL contributed to the Bayesian statistics and was involved in the writing of the manuscript. AM, BL and PV worked on the data analysis and the FIDES method. IS, CB, AS, JM, JB, LS, AP, CM, RM and JM were involved in the fieldwork and laboratory analysis stages of the research. MS provided guidance on the measurement aspects of ammonia and helped develop the data analysis. US is the primary investigator of the CINAg project at CEH Edinburgh, managing the project overall and contributing to all aspects of the research and the writing of the manuscript.
The authors declare that they have no conflict of interest.
This work was supported by the UK-China Virtual Joint Centre for Improved Nitrogen Agronomy (CINAg, BB/N013468/1), which is jointly supported by the Newton Fund, via UK BBSRC and NERC, and the Chinese Ministry of Science and Technology. We also gratefully acknowledge the NitroPortugal, H2020-456 383 TWINN-2015, EU coordination and support action 692331 for funding. We gratefully acknowledge Koch Fertilizer LLC, who supplied the urea with Agrotain®, as well as the invaluable help of farm manager Wim Bosma (Edinburgh University) and trails team manager Alistair Drysdale (SRUC) and colleagues for their flexibility in the timing of fertiliser application and harvesting the plots.
This research has been supported by the BBSRC (grant no. BB/N013468/1).
This paper was edited by Andreas Richter and reviewed by two anonymous referees.
Abalos, D., Jeffery, S., Sanz-Cobena, A., Guardia, G., and Vallejo, A.: Meta-analysis of the effect of urease and nitrification inhibitors on crop productivity and nitrogen use efficiency, Agriculture, Ecosystems & Environment, 189, 136–144, https://doi.org/10.1016/j.agee.2014.03.036, 2014.
Auernhammer, H.: Precision farming – the environmental challenge, Comput. Electron. Agr., 30, 31–43, https://doi.org/10.1016/S0168-1699(00)00153-8, 2001.
Azeem, B., KuShaari, K., Man, Z. B., Basit, A., and Thanh, T. H.: Review on materials & methods to produce controlled release coated urea fertilizer, J. Control. Release, 181, 11–21, https://doi.org/10.1016/j.jconrel.2014.02.020, 2014.
Bertram, T. H., Heckel, A., Richter, A., Burrows, J. P., and Cohen, R. C.: Satellite measurements of daily variations in soil NOx emissions, Geophys. Res. Lett., 32, https://doi.org/10.1029/2005GL024640, 2005.
Bouwman, A. F., Lee, D. S., Asman, W. A. H., Dentener, F. J., Van Der Hoek, K. W., and Olivier, J. G. J.: A global high-resolution emission inventory for ammonia, Global Biogeochem. Cy., 11, 561–587, https://doi.org/10.1029/97GB02266, 1997.
BSFP: The British Survey of Fertiliser Practice, Fertiliser use on farm crops for crop year 2016, Defra, London, 99 pp., 2017.
Butterbach-Bahl, K., Baggs, E. M., Dannenmann, M., Kiese, R., and Zechmeister-Boltenstern, S.: Nitrous oxide emissions from soils: how well do we understand the processes and their controls?, Philos. T. Roy. Soc. B, 368, 20130122–20130122, https://doi.org/10.1098/rstb.2013.0122, 2013.
Cowan, N. J., Norman, P., Famulari, D., Levy, P. E., Reay, D. S., and Skiba, U. M.: Spatial variability and hotspots of soil N2O fluxes from intensively grazed grassland, Biogeosciences, 12, 1585–1596, https://doi.org/10.5194/bg-12-1585-2015, 2015.
Cowan, N. J., Levy, P. E., Famulari, D., Anderson, M., Drewer, J., Carozzi, M., Reay, D. S., and Skiba, U. M.: The influence of tillage on N2O fluxes from an intensively managed grazed grassland in Scotland, Biogeosciences, 13, 4811–4821, https://doi.org/10.5194/bg-13-4811-2016, 2016.
Cowan, N. J., Levy, P. E., Famulari, D., Anderson, M., Reay, D. S. and Skiba, U. M.: Nitrous oxide emission sources from a mixed livestock farm, Agriculture, Ecosystems & Environment, 243, 92–102, https://doi.org/10.1016/j.agee.2017.04.014, 2017.
Davidson, E. A.: Soil Water Content and the Ratio of Nitrous Oxide to Nitric Oxide Emitted from Soil, in: Biogeochemistry of Global Change, edited by: Oremland, R. S., 369–386, Springer US, Boston, MA, 1993.
Davidson, E. A., Keller, M., Erickson, H. E., Verchot, L. V., and Veldkamp, E.: Testing a Conceptual Model of Soil Emissions of Nitrous and Nitric Oxides, BioScience, 50, 667, https://doi.org/10.1641/0006-3568(2000)050[0667:TACMOS]2.0.CO;2, 2000.
DEFRA: Component report for Defra Project NT2605 (CSA 6579) WP1b Ammonia emissions and crop N use efficiency, available at: http://randd.defra.gov.uk/Document.aspx?Document=NT2605_4060_FRP.doc (last access: 12 March 2019), 2005.
DEFRA: Component report for Defra Project NT2605 (CSA 6579) WP2, The effect of N fertiliser forms on nitrous oxide emissions, available at: http://randd.defra.gov.uk/Document.aspx?Document=NT2605_4062_FRP.doc (last access: 12 March 2019), 2006.
Del Grosso, S. J., Parton, W. J., Mosier, A. R., Walsh, M. K., Ojima, D. S., and Thornton, P. E.: DAYCENT National-Scale Simulations of Nitrous Oxide Emissions from Cropped Soils in the United States, Journal of Environment Quality, 35, 1451, https://doi.org/10.2134/jeq2005.0160, 2006.
Di, H. J. and Cameron, K. C.: The use of a nitrification inhibitor, dicyandiamide (DCD), to decrease nitrate leaching and nitrous oxide emissions in a simulated grazed and irrigated grassland, Soil Use Manage., 18, 395–403, https://doi.org/10.1111/j.1475-2743.2002.tb00258.x, 2006.
Drewer, J., Yamulki, S., Leeson, S. R., Anderson, M., Perks, M. P., Skiba, U. M., and McNamara, N. P.: Difference in Soil Methane (CH4) and Nitrous Oxide (N2O) Fluxes from Bioenergy Crops SRC Willow and SRF Scots Pine Compared with Adjacent Arable and Fallow in a Temperate Climate, BioEnerg. Res., 10, 575–582, https://doi.org/10.1007/s12155-017-9824-9, 2017.
Fowler, D., Coyle, M., Skiba, U., Sutton, M. A., Cape, J. N., Reis, S., Sheppard, L. J., Jenkins, A., Grizzetti, B., Galloway, J. N., Vitousek, P., Leach, A., Bouwman, A. F., Butterbach-Bahl, K., Dentener, F., Stevenson, D., Amann, M., and Voss, M.: The global nitrogen cycle in the twenty-first century, Philos. T. Roy. Soc. B, 368, 20130164–20130164, https://doi.org/10.1098/rstb.2013.0164, 2013.
Food and Agriculture Organization of the United Nations (FAO): World fertilizer trends and outlook to 2020, Summary Report Rome 2017, I6895EN/1/03.17, 2017.
Gelman, A.: Bayesian Data analysis, 3rd edn., CRC Press, New York, 2013.
Gericke, D., Pacholski, A., and Kage, H.: Measurement of ammonia emissions in multi-plot field experiments, Biosyst. Eng., 108, 164–173, https://doi.org/10.1016/j.biosystemseng.2010.11.009, 2011.
Harty, M. A., Forrestal, P. J., Watson, C. J., McGeough, K. L., Carolan, R., Elliot, C., Krol, D., Laughlin, R. J., Richards, K. G., and Lanigan, G. J.: Reducing nitrous oxide emissions by changing N fertiliser use from calcium ammonium nitrate (CAN) to urea based formulations, Sci. Total Environ., 563–564, 576–586, https://doi.org/10.1016/j.scitotenv.2016.04.120, 2016.
Kindred, D. R., Sylvester-Bradley, R., Milne, A. E., Marchant, B., Hatley, D., Kendall, S. L., Clarke, S., Storer, K., and Berry, P. M.: Spatial variation in Nitrogen requirements of cereals, and their interpretation, Advances in Animal Biosciences, 8, 303–307, https://doi.org/10.1017/S2040470017001327, 2017.
Kormann, R. and Meixner, F. X.: An Analytical Footprint Model For Non-Neutral Stratification, Bound.-Lay. Meteorol., 99, 207–224, https://doi.org/10.1023/A:1018991015119, 2001.
Lam, S. K., Suter, H., Mosier, A. R., and Chen, D.: Using nitrification inhibitors to mitigate agricultural N2O emission: a double-edged sword?, Glob. Change Biol., 23, 485–489, https://doi.org/10.1111/gcb.13338, 2017.
Lassaletta, L., Billen, G., Grizzetti, B., Anglade, J., and Garnier, J.: 50 year trends in nitrogen use efficiency of world cropping systems: the relationship between yield and nitrogen input to cropland, Environ. Res. Lett., 9, 105011, https://doi.org/10.1088/1748-9326/9/10/105011, 2014.
Levy, P. E., Cowan, N., van Oijen, M., Famulari, D., Drewer, J., and Skiba, U.: Estimation of cumulative fluxes of nitrous oxide: uncertainty in temporal upscaling and emission factors: Estimation of cumulative fluxes of nitrous oxide, Eur. J. Soil Sci., 68, 400–411, https://doi.org/10.1111/ejss.12432, 2017.
Li, Q., Yang, A., Wang, Z., Roelcke, M., Chen, X., Zhang, F., Pasda, G., Zerulla, W., Wissemeier, A. H., and Liu, X.: Effect of a new urease inhibitor on ammonia volatilization and nitrogen utilization in wheat in north and northwest China, Field Crop. Res., 175, 96–105, https://doi.org/10.1016/j.fcr.2015.02.005, 2015.
Loubet, B. and Cellier, P.: Experimental Assessment of Atmospheric Ammonia Dispersion and Short Range Dry Deposition in a Maize Canopy, Water Air Soil Poll., 1, 157–166, https://doi.org/10.1023/A:1013190618592, 2001.
Loubet, B., Génermont, S., Ferrara, R., Bedos, C., Decuq, C., Personne, E., Fanucci, O., Durand, B., Rana, G., and Cellier, P.: An inverse model to estimate ammonia emissions from fields, Eur. J. Soil Sci., 61, 793–805, https://doi.org/10.1111/j.1365-2389.2010.01268.x, 2010.
Loubet, B., Carozzi, M., Voylokov, P., Cohan, J.-P., Trochard, R., and Génermont, S.: Evaluation of a new inference method for estimating ammonia volatilisation from multiple agronomic plots, Biogeosciences, 15, 3439–3460, https://doi.org/10.5194/bg-15-3439-2018, 2018.
Lu, C. and Tian, H.: Global nitrogen and phosphorus fertilizer use for agriculture production in the past half century: shifted hot spots and nutrient imbalance, Earth Syst. Sci. Data, 9, 181–192, https://doi.org/10.5194/essd-9-181-2017, 2017.
Marriott, C. A.: Seasonal variation in white clover content and nitrogen fixing (acetylene reducing) activity in a cut upland sward, Grass Forage Sci., 43, 253–262, https://doi.org/10.1111/j.1365-2494.1988.tb02150.x, 1988.
Misselbrook, T. H., Cardenas, L. M., Camp, V., Thorman, R. E., Williams, J. R., Rollett, A. J., and Chambers, B. J.: An assessment of nitrification inhibitors to reduce nitrous oxide emissions from UK agriculture, Environ. Res. Lett., 9, 115006, https://doi.org/10.1088/1748-9326/9/11/115006, 2014.
Modolo, L. V., de Souza, A. X., Horta, L. P., Araujo, D. P., and de Fátima, Â., An overview on the potential of natural products as ureases inhibitors: A review, J. Adv. Res., 6, 35–44, https://doi.org/10.1016/j.jare.2014.09.001, 2015.
Ni, K., Pacholski, A., and Kage, H.: Ammonia volatilization after application of urea to winter wheat over 3 years affected by novel urease and nitrification inhibitors, Agriculture, Ecosystems & Environment, 197, 184–194, https://doi.org/10.1016/j.agee.2014.08.007, 2014.
Paulot, F. and Jacob, D. J.: Hidden Cost of U.S. Agricultural Exports: Particulate Matter from Ammonia Emissions, Environ. Sci. Technol., 48, 903–908, https://doi.org/10.1021/es4034793, 2014.
Philip, J. R.: The Theory Of Local Advection: I, J. Meteorol., 16, 535–547, https://doi.org/10.1175/1520-0469(1959)016<0535:TTOLAI>2.0.CO;2, 1959.
Phoenix, G. K., Hicks, W. K., Cinderby, S., Kuylenstierna, J. C. I., Stock, W. D., Dentener, F. J., Giller, K. E., Austin, A. T., Lefroy, R. D. B., Gimeno, B. S., Ashmore, M. R., and Ineson, P.: Atmospheric nitrogen deposition in world biodiversity hotspots: the need for a greater global perspective in assessing N deposition impacts, Glob. Change Biol., 12, 470–476, https://doi.org/10.1111/j.1365-2486.2006.01104.x, 2006.
Plummer, M.: Rjags: Bayesian Graphical Models Using MCMC, R Package Version 4–6, available at: https://CRAN.R-project.org/package=rjags (last access: 12 November 2018), 2016.
Raun, W. R. and Johnson, G. V.: Improving Nitrogen Use Efficiency for Cereal Production, Agron. J., 91, 357, https://doi.org/10.2134/agronj1999.00021962009100030001x, 1999.
Ravishankara, A. R., Daniel, J. S., and Portmann, R. W.: Nitrous Oxide (N2O): The Dominant Ozone-Depleting Substance Emitted in the 21st Century, Science, 326, 123–125, https://doi.org/10.1126/science.1176985, 2009.
Rawluk, C. D. L., Grant, C. A., and Racz, G. J.: Ammonia volatilization from soils fertilized with urea and varying rates of urease inhibitor NBPT, Can. J. Soil Sci., 81, 239–246, https://doi.org/10.4141/S00-052, 2001.
Reay, D. S., Davidson, E. A., Smith, K. A., Smith, P., Melillo, J. M., Dentener, F., and Crutzen, P. J.: Global agriculture and nitrous oxide emissions, Nat. Clim. Change, 2, 410–416, https://doi.org/10.1038/nclimate1458, 2012.
Riley, W. J., Ortiz-Monasterio, I., and Matson, P. A.: Nitrogen leaching and soil nitrate, nitrite, and ammonium levels under irrigated wheat in Northern Mexico, Nutr. Cycl. Agroecosys., 61, 223–236, https://doi.org/10.1023/A:1013758116346, 2001.
Rose, T. J., Morris, S. G., Quin, P., Kearney, L. J., Kimber, S., and Van Zwieten, L.: The nitrification inhibitor DMPP applied to subtropical rice has an inconsistent effect on nitrous oxide emissions, Soil Res., 55, 547, https://doi.org/10.1071/SR17022, 2017.
Ruser, R. and Schulz, R.: The effect of nitrification inhibitors on the nitrous oxide (N2O) release from agricultural soils-a review, J. Plant Nutr. Soil Sci., 178, 171–188, https://doi.org/10.1002/jpln.201400251, 2015.
Sanz-Cobena, A., Misselbrook, T., Camp, V., and Vallejo, A.: Effect of water addition and the urease inhibitor NBPT on the abatement of ammonia emission from surface applied urea, Atmos. Environ., 45, 1517–1524, https://doi.org/10.1016/j.atmosenv.2010.12.051, 2011.
Sanz-Cobena, A., Abalos, D., Meijide, A., Sanchez-Martin, L., and Vallejo, A.: Soil moisture determines the effectiveness of two urease inhibitors to decrease N2O emission, Mitig. Adapt. Strat. Gl., https://doi.org/10.1007/s11027-014-9548-5, 2014.
Sebilo, M., Mayer, B., Nicolardot, B., Pinay, G., and Mariotti, A.: Long-term fate of nitrate fertilizer in agricultural soils, P. Natl. Acad. Sci. USA, 110, 18185–18189, https://doi.org/10.1073/pnas.1305372110, 2013.
Shamsudin, I. S., Anuar, M. S., Yusof, Y. A., Hanif, A. H. M., and Tahir, S. M.: Effect of Particle Size on Direct Compaction of Urea Fertilizer, Particul. Sci. Technol., 32, 544–553, https://doi.org/10.1080/02726351.2014.930942, 2014.
Singh, J., Kunhikrishnan, A., Bolan, N. S., and Saggar, S.: Impact of urease inhibitor on ammonia and nitrous oxide emissions from temperate pasture soil cores receiving urea fertilizer and cattle urine, Sci. Total Environ., 465, 56–63, https://doi.org/10.1016/j.scitotenv.2013.02.018, 2013.
Skinner, J. A., Lewis, K. A., Bardon, K. S., Tucker, P., Catt, J. A., and Chambers, B. J.: An Overview of the Environmental Impact of Agriculture in the U.K., J. Environ. Manage., 50, 111–128, https://doi.org/10.1006/jema.1996.0103, 1997.
Suter, H., Sultana, H., Turner, D., Davies, R., Walker, C., and Chen, D.: Influence of urea fertiliser formulation, urease inhibitor and season on ammonia loss from ryegrass, Nutr. Cycl. Agroecosys., 95, 175–185, https://doi.org/10.1007/s10705-013-9556-y, 2013.
Sommer, S. G., Schjoerring, J. K., and Denmead, O. T.: Ammonia Emission from Mineral Fertilizers and Fertilized Crops, in: Advances in Agronomy, 82, 557–622, Elsevier, 2004.
Sutton, O. G.: A Theory of Eddy Diffusion in the Atmosphere, P. Roy. Soc. A, 135, 143–165, https://doi.org/10.1098/rspa.1932.0025, 1932.
Syakila, A. and Kroeze, C.: The global nitrous oxide budget revisited, Greenhouse Gas Measurement and Management, 1, 17–26, https://doi.org/10.3763/ghgmm.2010.0007, 2011.
Tang, Y. S., Cape, J. N., and Sutton, M. A.: Development and Types of Passive Samplers for Monitoring Atmospheric NO2 and NH3 Concentrations, Sci. World J., 1, 513–529, https://doi.org/10.1100/tsw.2001.82, 2001.
Vitousek, P. M., Aber, J. D., Howarth, R. W., Likens, G. E., Matson, P. A., Schindler, D. W., Schlesinger, W. H., and Tilman, D. G.: Human Alteration Of The Global Nitrogen Cycle: Sources And Consequences, Ecol. Appl., 7, 737–750, https://doi.org/10.1890/1051-0761(1997)007[0737:HAOTGN]2.0.CO;2, 1997.
Watson, C. J.: The comparative effects of ammonium nitrate, urea or a combined ammonium nitrate/urea granular fertilizer on the efficiency of nitrogen recovery by perennial ryegrass, Fert. Res., 11, 69–78, https://doi.org/10.1007/BF01049565, 1987.
Weier, K. L., Doran, J. W., Power, J. F., and Walters, D. T.: Denitrification and the Dinitrogen/Nitrous Oxide Ratio as Affected by Soil Water, Available Carbon, and Nitrate, Soil Sci. Soc. Am. J., 57, 66, https://doi.org/10.2136/sssaj1993.03615995005700010013x, 1993.
Zaman, M., Saggar, S., Blennerhassett, J. D., and Singh, J.: Effect of urease and nitrification inhibitors on N transformation, gaseous emissions of ammonia and nitrous oxide, pasture yield and N uptake in grazed pasture system, Soil Biol. Biochem., 41, 1270–1280, https://doi.org/10.1016/j.soilbio.2009.03.011, 2009.