the Creative Commons Attribution 4.0 License.
the Creative Commons Attribution 4.0 License.
 | 27 Nov 2019
Nitric oxide (NO) in the Bohai Sea and the Yellow Sea
Ye Tian
Chao Xue
Chun-Ying Liu
Pei-Feng Li
Wei-Hua Feng
Hermann W. Bange
Nitric oxide (NO) is a short-lived compound of the marine nitrogen cycle; however, our knowledge about its oceanic distribution and turnover is rudimentary. Here we present the measurements of dissolved NO in the surface and bottom layers at 75 stations in the Bohai Sea (BS) and the Yellow Sea (YS) in June 2011. Moreover, NO photoproduction rates were determined at 27 stations in both seas. The NO concentrations in the surface and bottom layers were highly variable and ranged from below the limit of detection (i.e., 32 pmol L−1) to 616 pmol L−1 in the surface layer and 482 pmol L−1 in the bottom layer. There was no significant difference (p>0.05) between the mean NO concentrations in the surface (186±108 pmol L−1) and bottom (174±123 pmol L−1) layers. A decreasing trend of NO in bottom-layer concentrations with salinity indicates a NO input by submarine groundwater discharge. NO in the surface layer was supersaturated at all stations during both day and night and therefore the BS and YS were a persistent source of NO to the atmosphere at the time of our measurements. The average flux was about mol cm−2 s−1 and the flux showed significant positive relationship with the wind speed. The accumulation of NO during daytime was a result of photochemical production, and photoproduction rates were correlated to illuminance. The persistent nighttime NO supersaturation pointed to an unidentified NO dark production. NO sea-to-air flux densities were much lower than the NO photoproduction rates. Therefore, we conclude that the bulk of the NO produced in the mixed layer was rapidly consumed before its release to the atmosphere.


Nitric oxide (NO) is a short-lived intermediate of the oceanic nitrogen cycle (Bange, 2008). It received limited attention so far because its determination in seawater is challenging (Zafiriou and McFarland, 1980; Lutterbeck and Bange, 2015; Liu et al., 2017). NO in surface seawater can be produced via the photolysis of nitrite () (Zafiriou and McFarland, 1981; Olasehinde et al., 2009, 2010; Liu et al., 2017):
This reaction may account for 10 % of nitrite loss in surface waters of the central equatorial Pacific (Zafiriou et al., 1980). Zafiriou and McFarland (1981) suggested that photochemically produced NO is a potential source of atmospheric NO during daylight, which could further lead to ozone hole, acid precipitation, and photochemical smog. Apart from the photochemical production, various microbial pathways of NO have been identified, including denitrification, nitrification, and anammox (Schreiber et al., 2014; Martens-Habbena et al., 2015; Caranto and Lancaster, 2017; Kuypers et al., 2018). Additionally, NO is a messenger molecule in marine organisms: phytoplankton not only responds to exogenous NO (Zhang et al., 2005) but also produces NO during their growth (Zhang et al., 2006a, b; Kim et al., 2006, 2008). Chen et al. (2015) reported that calmodulin (a messenger protein expressed in eukaryotic cells) of the tropical sea cucumber participates in the production of NO during immune response. Morrall et al. (1998, 2000) characterized the NO synthase activity in the tropical sea anemone Aiptasia pallida, suggesting that NO and NO synthase can act as ecotoxicological biomarkers in the tropical marine environment. Moreover, the characterization of NO synthase gene in the intertidal copepod Tigriopus japonicas has been found, and the intracellular production of NO in shrimp haemocytes has been observed (Xian et al., 2013; Jeong et al., 2016). Thus, NO seems to be widespread, with different functions in marine organisms.
The current understanding of the oceanic NO distribution is mainly limited to the ocean surface (Zafiriou and McFarland, 1981; Olasehinde at al., 2009, 2010; Liu et al., 2017) and oxygen minimum zones (OMZs; Ward and Zafiriou, 1988; Lutterbeck et al., 2018). Only recently have the distribution of NO as well as its seasonal variation in the Jiaozhou Bay and adjacent waters been studied (Feng et al., 2011; Xue et al., 2012; Tian et al., 2016).
In this study, we present the first measurements of dissolved NO in the Yellow Sea (YS) and the Bohai Sea (BS). The overarching objective of our study was to decipher the biogeochemical fluxes of NO in the BS and YS. The specific objectives were (i) to determine the spatial variation in dissolved NO concentrations in the water column, (ii) to determine NO photoproduction rates, and (iii) to estimate the sea-to-air gas exchange fluxes of NO.
2.1 Study area
The BS and the YS are marginal seas of the western Pacific Ocean. The BS is a shallow and almost enclosed sea with a surface area of 77×103 km2 and a volume of 1.39×10³ km3. Its maximum depth is 83 m, with an average depth of only 18 m. The Yellow River is a major source of freshwater to the BS whereas the YS is the source of salt for the BS through water exchange via the Bohai Strait. The YS has a surface area of 380×103 km2 and total volume of 16.7×10³ km3. Maximum depth is 140 m with an average depth of 44 m, and like the BS, it is a continental shelf sea. The Yangtze River at the southwest corner of the YS is the major source of freshwater for the southern Yellow Sea (SYS) and the East China Sea. The hydrographic properties of this region are mainly influenced by the Yellow Sea Cold Water Mass (YSCWM) on the shelf (Lü et al., 2010; Li et al., 2016) and the Yellow Sea Coastal Currents on the western side of the basin (Su, 1998; Lee et al., 2002; Zhang et al., 2004). The BS and the YS are regions surrounded by areas of high population growth and economic development in China and Korea (Zhan et al., 2010; Jiang et al., 2014).
2.2 Sampling
Samples were collected from 13 to 28 June 2011 on board the R/V Dong Fang Hong 2 in the BS and the YS. Sampling for NO from both the surface (at 1 m) and the bottom layer (=1 m above the ocean bottom) were performed at 75 sampling stations (including one 24 h anchor station: B65) shown in Fig. 1 and listed in Table 1 (Tian, 2019). Water samples were collected using 8 L Niskin bottles equipped with silicon O-rings and Teflon-coated springs and mounted on a Sea-Bird CTD (conductivity, temperature, depth) instrument (Sea-Bird Electronics, Inc., USA). A 500 mL Wheaton glass serum bottle was rinsed with in situ seawater three times and was then filled with seawater quickly through a siphon. When the overflowed sample reached the half volume of the bottle, the siphon was withdrawn rapidly, 0.5 mL saturated HgCl2(aq) solution was added, and the bottle was sealed quickly. The surface water samples were immediately analyzed after collection, and samples from other depths were temporarily placed in the dark in a water bath with a surface seawater circulation system and analyzed within 1 h (Liu et al., 2017). Samples for the analysis of -N, -N, and -N were immediately filtered through 0.45 µm Millipore membrane (pre-ignited at 450 ∘C for 6 h). The filtrates were stored in polyethylene bottles (pre-marinated with 1:10 HCl for 24 h) at −20 ∘C. Photoproduction rates were determined in surface water samples from 22 stations in the YS and 4 stations in the BS (shown in Fig. 1), respectively.
Table 1Description of sampling stations and seawater temperature (T), salinity (S), Chl a concentrations, DO, illuminance (I), and NO concentrations in the BS and the YS.

NA: not available. < LOD: below the limit of detection.
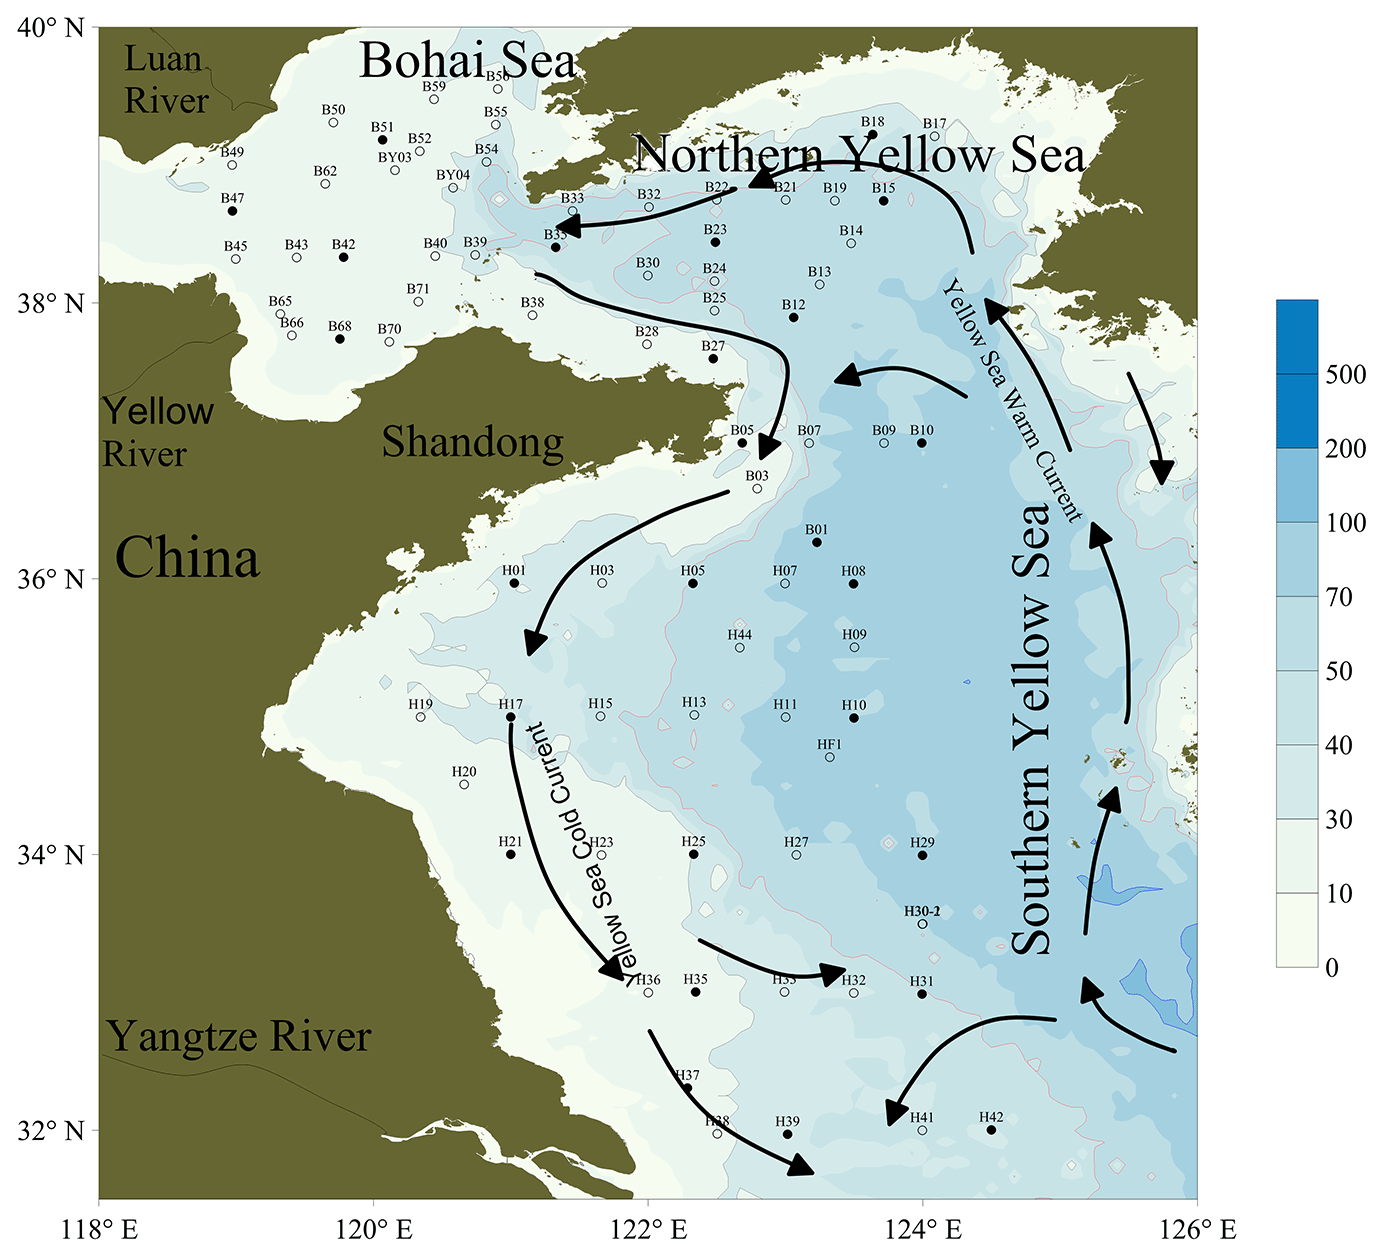
Figure 1Locations of the sampling stations in the BS and the YS during summer. Solid dots (•) represent the stations for incubation experiments.
2.3 Analytical procedures
Analysis for dissolved NO was conducted with the improved method of Liu et al. (2017) by a combined purge-and-trap and fluorometric detection method. The precision of the analytical method was better than ±7 %, and the limit of detection (LOD) was 32 pmol L−1 in the field experiment (Liu et al., 2017).
The photolysis experiments were conducted under natural light conditions on deck. Surface water samples were filtered with 0.45 µm Millipore membrane and transferred into 10 mL cleaned quartz vials wrapped with aluminum foil with no headspace. Then 200 µL NaN3 solutions were added to remove the microbial influence. After adding 10 µL of mol L−1 2, 3-diaminonaphthalene (DAN, a NO probe) solution and gentle mixing, the fluorescence of the mixed solution was measured before irradiation (Liu et al., 2017). Then the duplicate sample made without the addition of DAN was capped with a Teflon-lined silicone septum and without aluminum foil; following this, the vial was placed in a shallow circulating seawater bath. After 0.5 h irradiation time, 10 µL of mol L−1 DAN was added into the duplicate sample without addition of DAN before and the fluorescence of the solution was analyzed. The NO concentrations were measured with the method described in Liu et al. (2017). The NO apparent photolysis production rates were computed based on the time-dependent difference between the NO concentrations before and after irradiation. For dark controls, vials were wrapped in aluminum foil. The quartz vials and syringe used in the experiment were soaked in a 10 % (v∕v) HCl bath for 24 h, rinsed with Milli-Q water, and baked at 500 ∘C for 4 h.
Chlorophyll a (Chl a) was fluorometrically measured by an F-4500 fluorescence spectrophotometer after filtration of 200 mL seawater through a Whatman glass fiber filter and extraction in 90 % acetone according to Strickland and Parsons (1968). The wind speeds were measured at a height of 10 m above the sea surface using a Model 27600-4X shipborne weather instrument (Young, USA). Illuminance was measured by a digital illuminometer (TES-1330A, Shenzhen, China). Dissolved oxygen (DO) was measured in discrete water samples by the Winkler method (Grasshoff et al., 2009). The concentrations of dissolved inorganic nitrogen (nitrate, nitrite, and ammonium) were analyzed using a nutrient automatic analyzer (Auto Analyzer 3, SEAL Analytical, USA) in the laboratory. The limits of the detection were 0.14 µmol L−1 for nitrate, nitrite, and ammonium, with the precision of the method found to be better than 3 % (Liu et al., 2005).
2.4 Calculation of NO flux and NO saturation
Fluxes of NO across the sea-to-air interface were estimated following the approach of McGillis et al. (2000) for a sparingly soluble gas that is also moderately reactive in the atmosphere:
where F is the flux density (mass area−1 time−1) across the air–sea interface, ksea is the gas transfer velocity (length per time), and csea is the measured concentration of NO in the surface seawater (mol per volume). The partial pressure of the atmospheric NO (pNOair) was calculated as follows:
where x′NOair is the mole fraction of atmosphere NO (dimensionless). We used the value of 2.13 ppb for x′NOair, which is the average atmospheric NO mole fraction over the YS (Hu Min, Peking University, personal communication, 2018). pss is the barometric pressure at sea surface, which was set to 101.325 kPa as the average pressure, and pw is the water vapor pressure at sea surface, which was calculated following Weiss and Price (1980):
Hcp is the Henry's law constant, which is calculated as follows:
where . HΘ and −ΔsolH∕R are tabulated following Sander (2015).
ksea was calculated as follows:
where kw is the water side air–sea gas transfer coefficient for sparingly soluble gases (length per time) calculated according to Wanninkhof (2014), γa is the fraction of the entire gas concentration gradient across the air side boundary layer, as a fraction of the entire gradient from the bulk water to the bulk air (dimensionless) (McGillis et al., 2000), ka is the air side air–sea gas transfer coefficient (length per time) according to McGillis et al. (2000), Hcc is the Henry coefficient (dimensionless) (Sander, 2015), MNO and are the relative molecular mass of NO and H2O (dimensionless), and u is the wind speed at 10 m height under neutral boundary conditions (length per time).
The Schmidt number (Sc) is the kinematic viscosity of water divided by the molecular diffusion coefficient of the gas in (sea)water (Jähne et al., 1987; Wanninkhof, 2014). Seawater dynamic viscosity (μsw) is a function of temperature (T) and salinity (S) and was estimated using the following equations (Sharqawy et al., 2010):
Seawater density was estimated using Millero's empirical equation (Millero et al., 1976), and NO diffusion coefficient DL ( cm2 s−1) in water was calculated according to Wise and Houghton (1968):
The saturation factor (α) is defined as , α>1 represents that NO was supersaturated and that the flux was from sea to air.
3.1 NO in the surface and bottom layers
The NO concentrations from the surface and bottom layers of the BS and the YS, as well as the local sampling time, bottom depth (D), temperature (T), salinity (S), Chl a, wind speed (u), and DO are listed in Table 1. In the study area, temperature varied from 8.8 to 21.7 ∘C and salinity varied from 29.57 to 32.73 ‰ in the surface water. DO fluctuated from 178 to 271 µmol L−1. The average concentrations of -N, -N, and -N were 2.11, 0.20, and 2.59 µmol L−1, respectively. While in the bottom layer, temperature varied from 3.8 to 21.6 ∘C, salinity varied from 30.00 to 33.71 ‰, and DO varied from 147 to 266 µmol L−1.
The surface concentrations of NO ranged from below the LOD to 616 pmol L−1, with an overall average of 186±108 pmol L−1, and exhibited a considerable spatial variability (Fig. 2a). The mean NO surface concentrations in the BS (203±107 pmol L−1) and northern YS (NYS) (212±130 pmol L−1) were higher than the mean NO concentration in the SYS (159±84 pmol L−1). The NO concentrations in the bottom layer ranged from below the LOD to 482 pmol L−1, with an overall average of 174±123 pmol L−1. The mean concentrations of NO in the bottom layers of the BS and NYS were 228±116 and 210±138, respectively, and were higher than the mean (127±98 pmol L−1) for the SYS. The maximum NO surface and bottom concentrations were measured at stations B21 and B28 in the NYS, respectively (Fig. 2b), whereas the lowest NO surface and bottom concentrations were measured in the center of the SYS (Table 1). Overall, there were no statistically significant differences (p>0.05) between the mean NO concentrations in the surface and bottom layers.
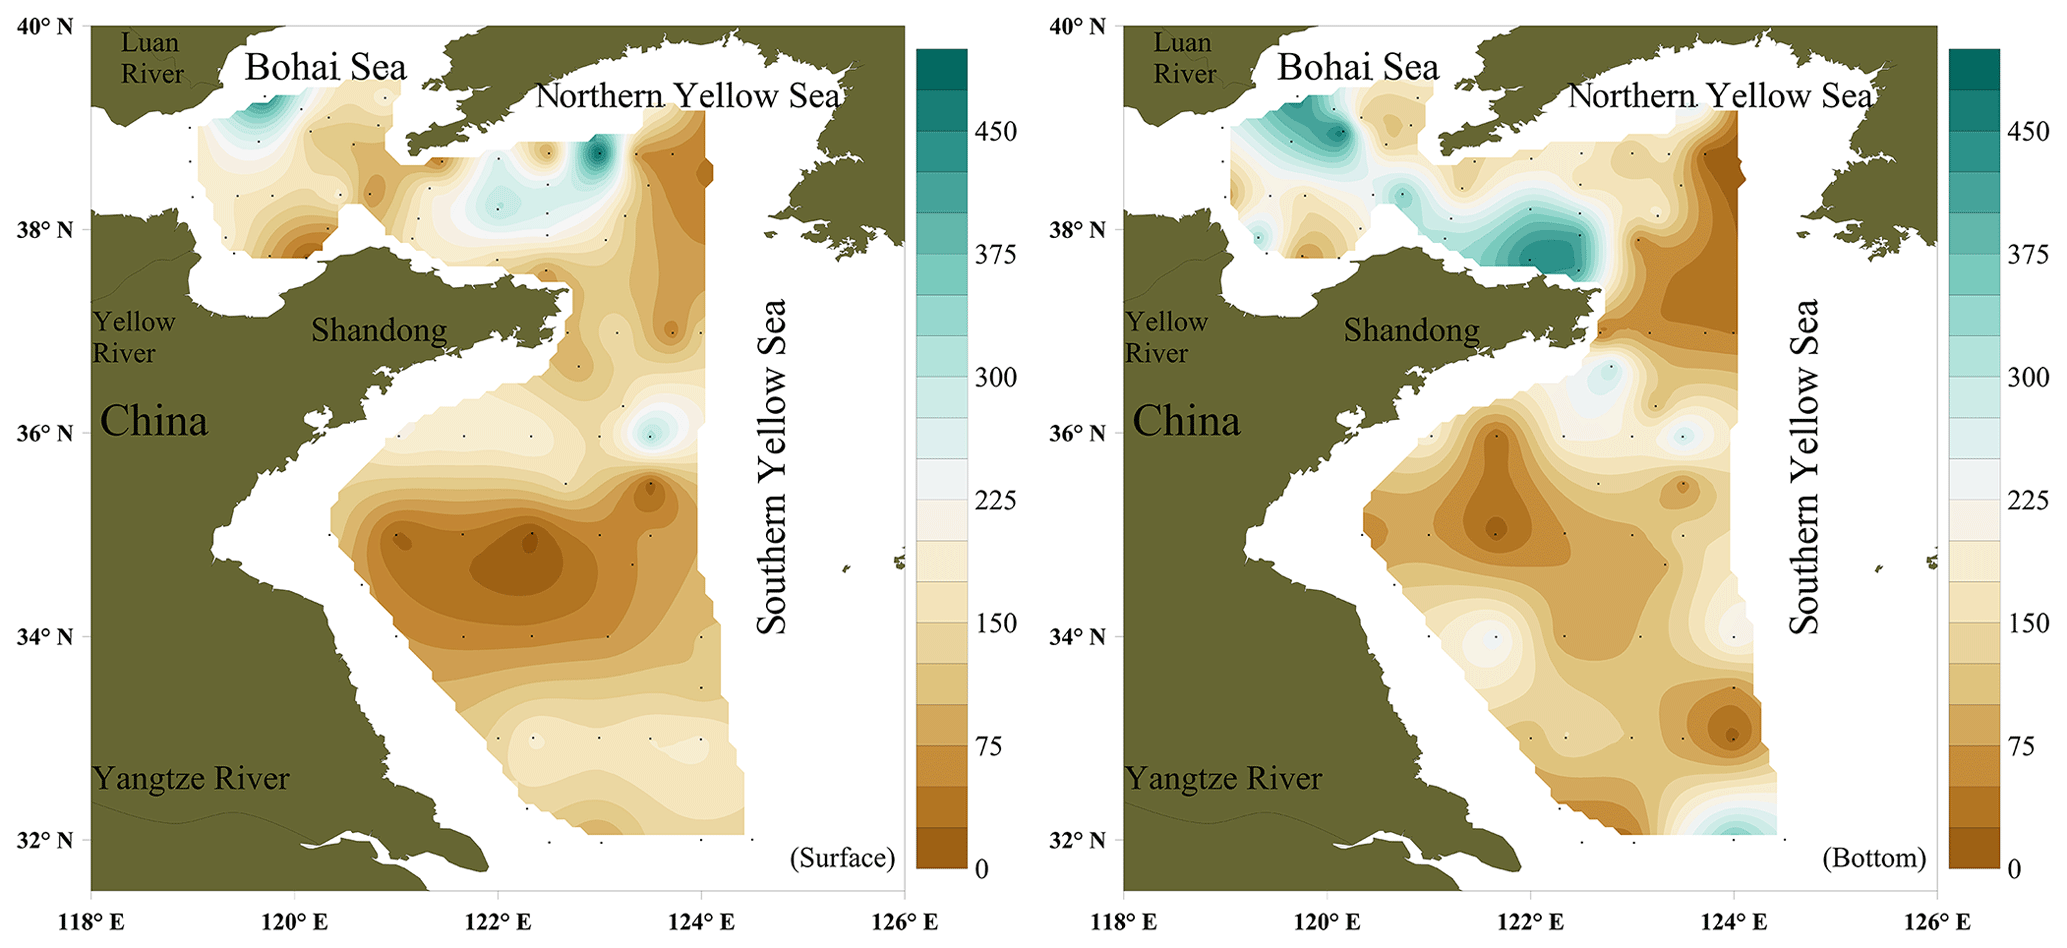
Figure 2Horizontal distributions of NO (pmol L−1) in the surface water and bottom water.
NO surface concentrations did not show any statistically significant relationship (p>0.05) with sea surface temperature, salinity, DO, Chl a, and illuminance. Trends of NO concentrations with salinity and DIN were only found for the stations affected by the outflow of the Yellow River in the southern BS (Fig. 3), where we found an inverse relationship between salinity and NO surface concentrations. Here high NO concentrations were associated with high DIN concentrations (data not shown; see Liu et al., 2015; Yang et al., 2015) indicating that DIN, especially , was a prerequisite for enhanced NO concentrations.

Figure 3Variations in salinity, NO surface concentrations, and concentrations from station B65 to station B70.
The water columns of the BS and YS were well-oxygenated during our study, and thus no suboxic or anoxic conditions were detected. Therefore, we did not find any enhancement of NO concentrations in the bottom layers with low DO or concentrations as observed in the OMZ of the eastern tropical South Pacific Ocean off Peru (Lutterbeck et al., 2018). However, NO concentrations in the bottom layer showed negative correlations with salinity (p<0.05, , n=60) and bottom depth (p<0.05, , n=61) indicating a decrease in NO concentrations from the coast toward offshore waters. It is known that both the BS and the YS are affected by submarine ground water discharge (Kim et al., 2005; Taniguchi et al., 2008; Liu et al., 2017a, b). Moreover, NO has been detected in groundwater and aquifers (Smith et al., 2004; Smith and Yoshinari, 2008). Therefore, we suggest that input of NO from submarine groundwater discharge contributed to the distribution of NO bottom concentrations as well.
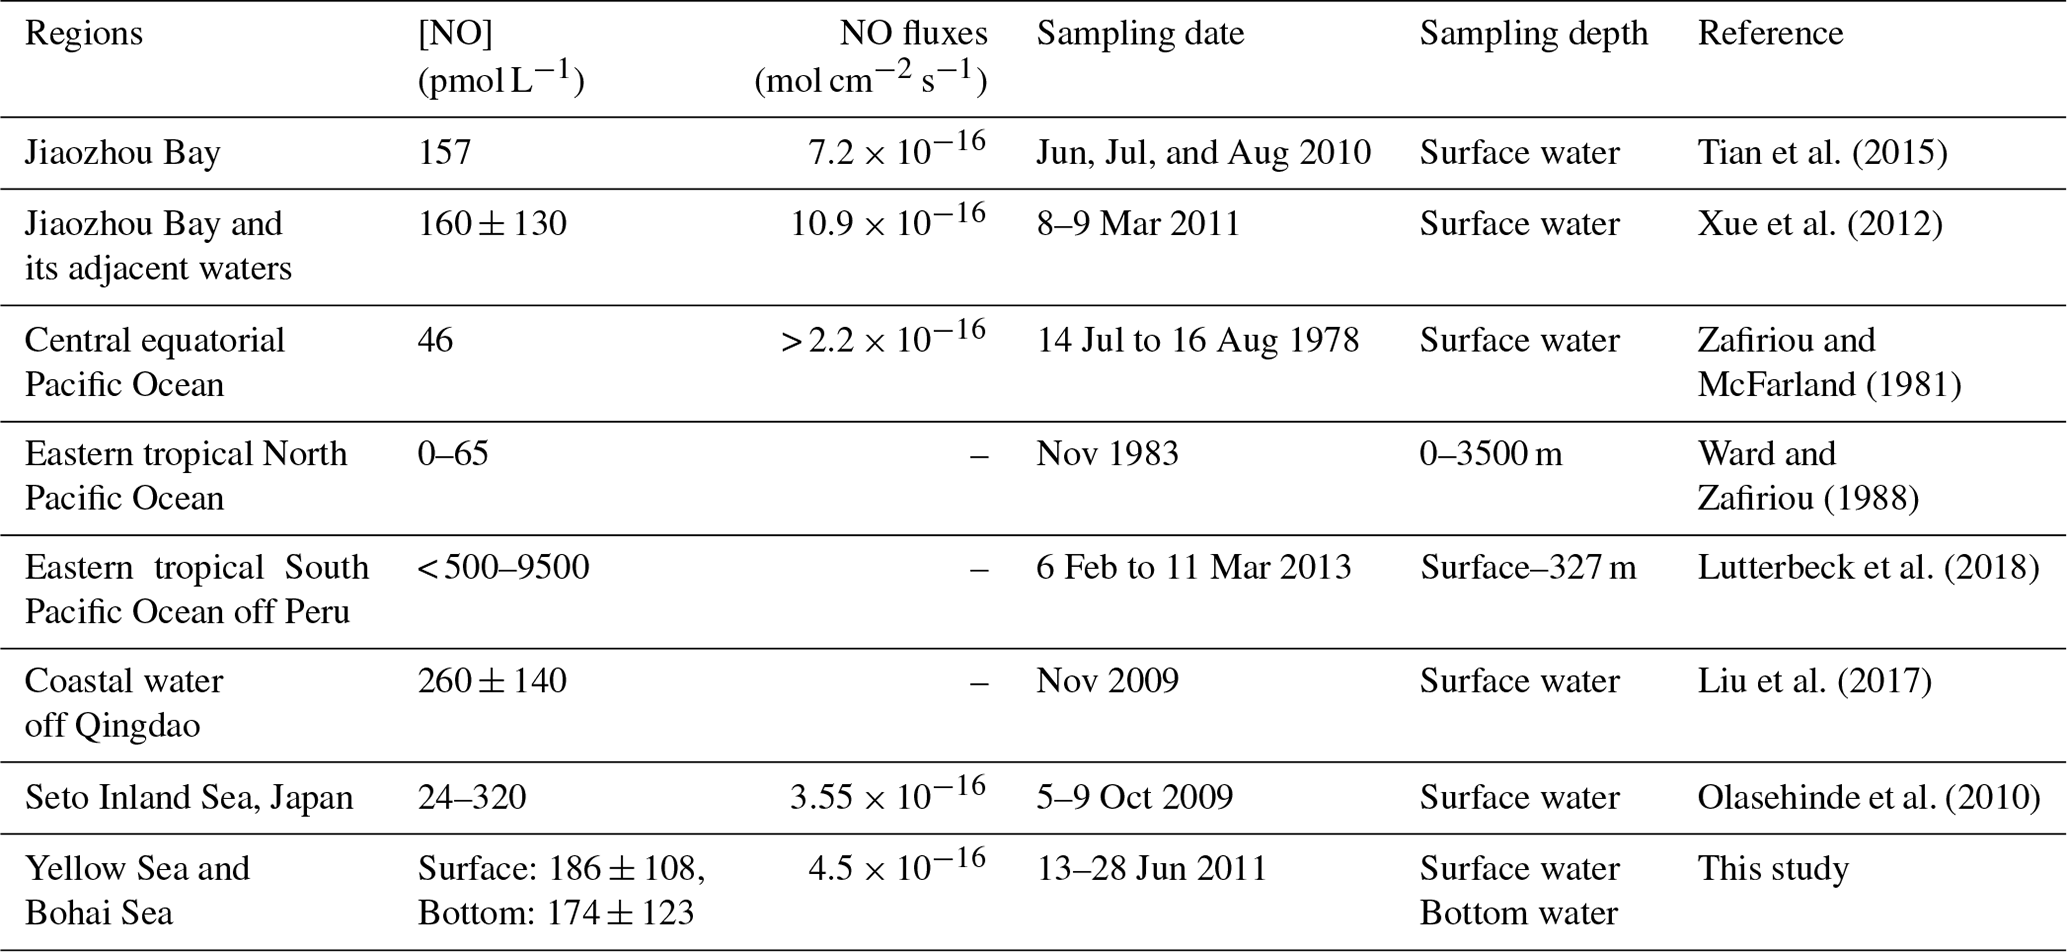
An overview of published NO surface concentrations is given Table 3. The average NO surface and bottom concentrations from this study are comparable to the concentrations measured in the Jiaozhou Bay, in the waters off Qingdao, and in the Seto Inland Sea. However, our mean concentrations are considerably higher than the NO concentrations reported from the central equatorial Pacific and the eastern tropical North Pacific Ocean. The maximum concentration reported here is at the lower end of the NO concentrations recently reported from the anoxic OMZ off Peru. Overall, NO surface concentrations seem to be generally higher in coastal waters compared to those found in offshore waters.
3.2 Diurnal variability
The diurnal variability of surface NO concentrations, illuminance, DO, and Chl a were investigated at anchor station B65 (Fig. 4). NO concentrations varied from 64 to 424 pmol L−1, exhibiting a significant diurnal variation with the maximum concentration 8-fold higher than the minimum concentration. The NO concentrations reached the maximum concentration in the early afternoon (about 13:00 LT) and then decreased to the minimum concentration at 22:00 LT. A less pronounced second maximum (209 pmol L−1) was reached at 04:00 LT. DO showed a similar diurnal cycle but shifted by 3 h with maxima at 16:00 LT and 07:00 LT. Chl a concentrations peaked at 19:00 LT and 07:00 LT. The illuminance had its maximum at 13:00 LT, coinciding with the NO maximum indicating that the first NO maximum was indeed resulting from a photochemical production during daytime (Zafiriou and McFarland, 1981). However, the second maximum of NO at 04:00 LT, when it was still dark, must have resulted from an alternative chemical and/or biological production.
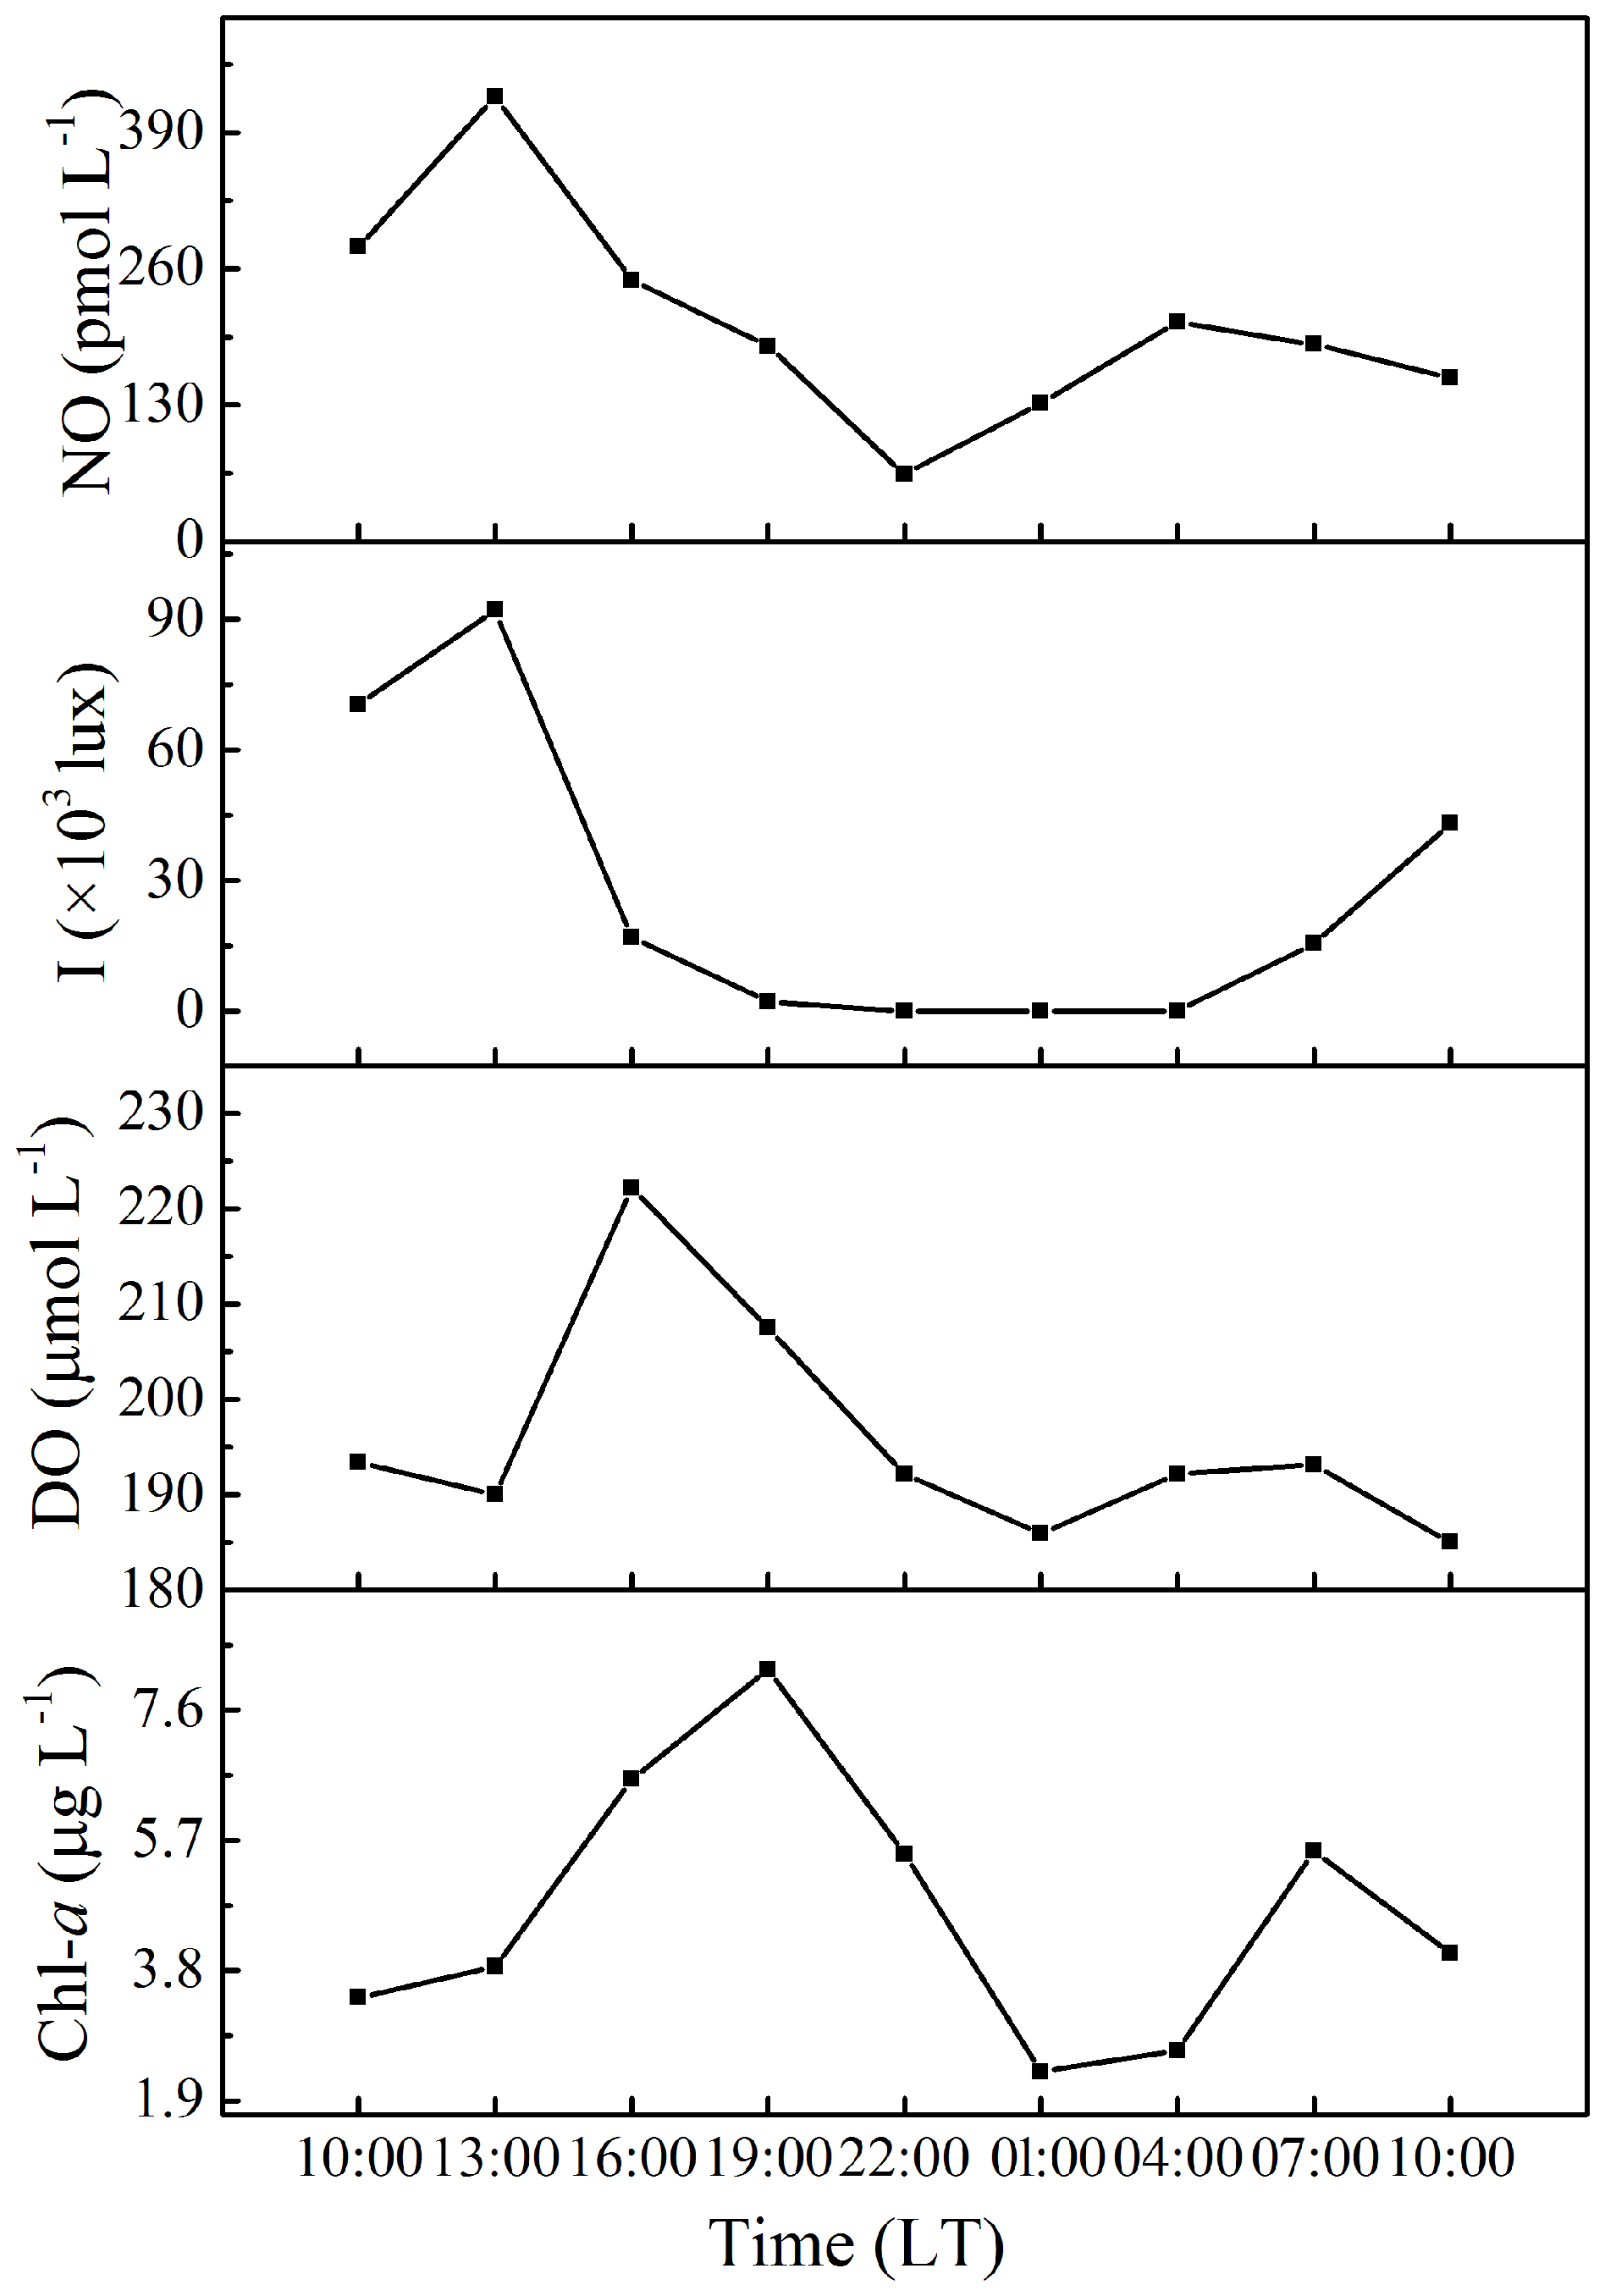
Figure 4Diurnal variations in NO concentrations, illuminance (I), DO, and Chl a concentrations in the surface water at anchor station B65.
3.3 Photoproduction rates
The results of the NO photoproduction experiments are listed in Table 2. The photoproduction rates of NO in the BS, the NYS, and the SYS varied from not detectable to , 0.09 to , and 0.32 to mol L−1 s−1, respectively. The average photoproduction rate of the whole study area was mol L−1 s−1. The photoproduction rates from the BS and YS are in good agreement with the rates reported from the Seto Inland Sea (Olasehinde et al., 2009, 2010). However, the mean NO photoproduction rates are higher than those from the central equatorial Pacific Ocean (Zafiriou and McFarland, 1981) and lower than those from Kurose River, Japan (Olasehinde et al., 2009) (Table 2), which mirrors the available concentrations that are low in the open ocean and but high in a river.
Table 2Description of sampling stations and their seawater temperature (T), illuminance (I), mean surface downward UV radiation flux (UV), and photoproduction rates in the BS and the YS.
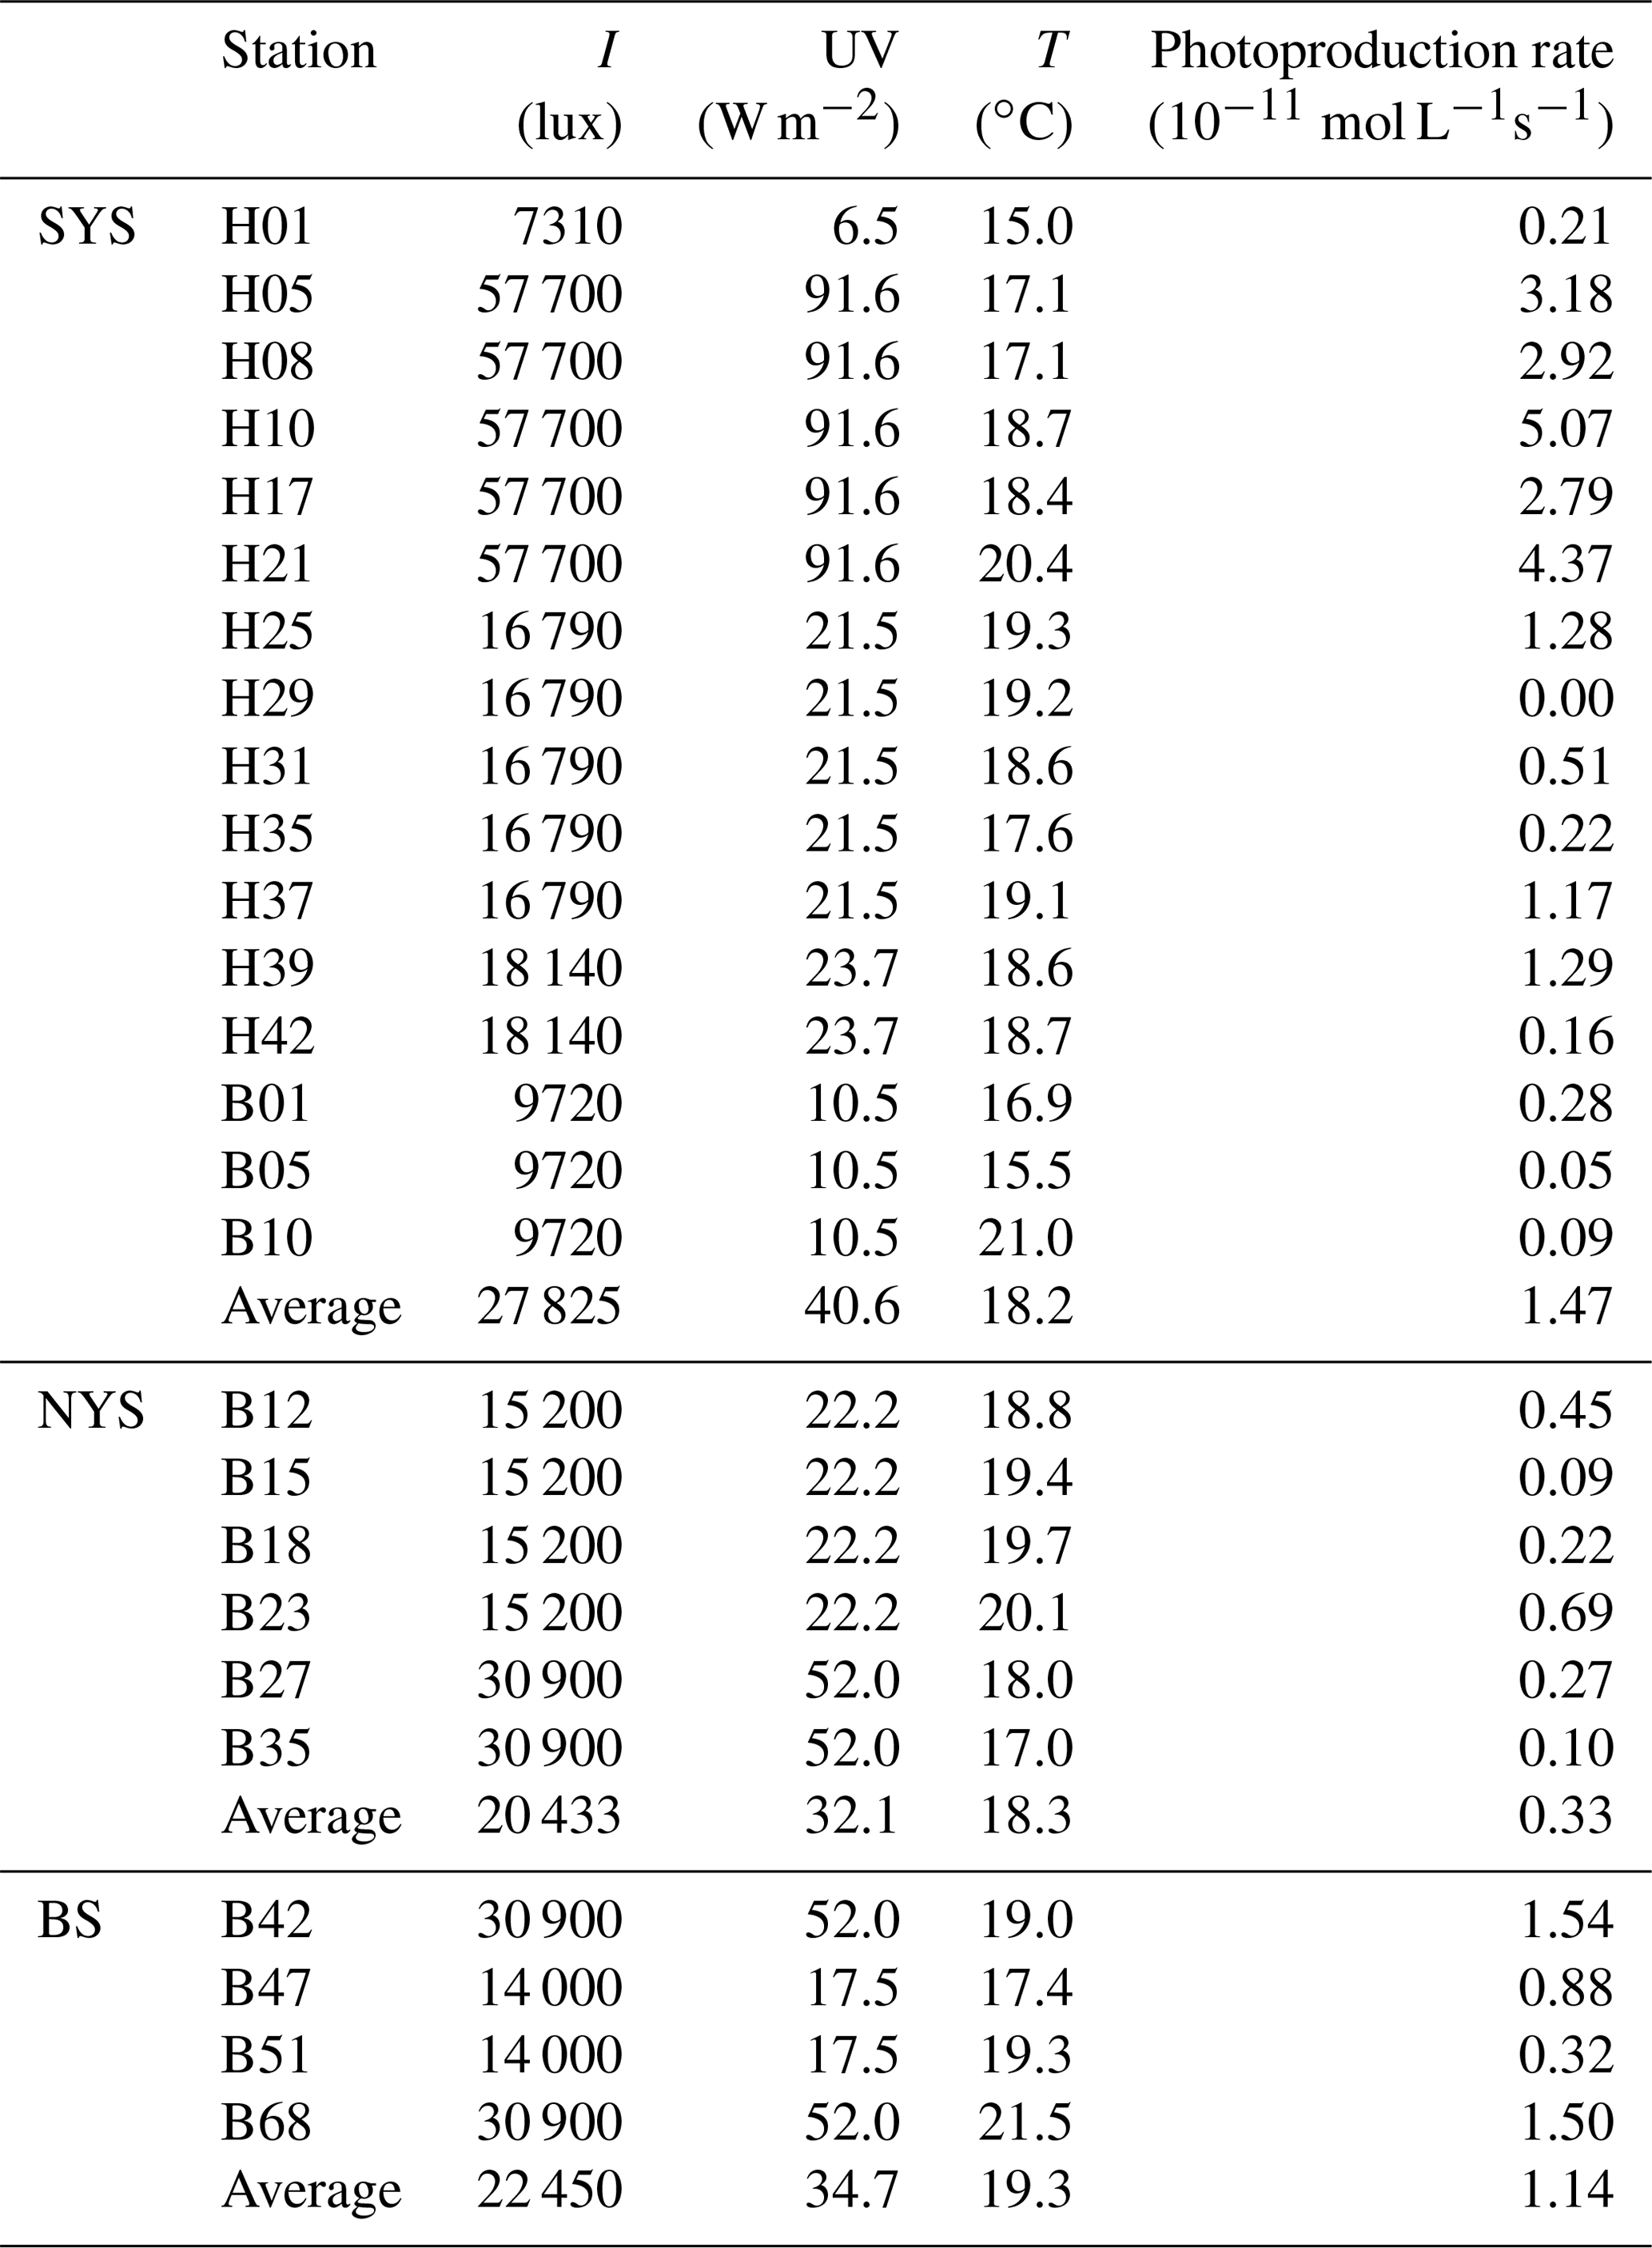
Table 3NO concentrations and flux densities from different regions.
The average photoproduction rate in the NYS was obviously lower than those in the BS and the SYS, consistent with illuminances of 22 450, 20 433, 27 852 lux and mean surface downward UV radiation flux 34.7, 32.1, 40.6 W m−2 (European Centre for Medium-Range Weather Forecasts (ECMWF), reanalysis data) for the BS, the NYS, and the SYS, respectively. Enhanced photoproduction rates ( mol L−1 s−1) occurred in the SYS, especially in the central part of the SYS and stations influenced by the Yellow Sea Cold Current (see Fig. 1). This is apparently in contrast to the distribution of NO, which showed the lowest concentrations in the central SYS (see above). The high illumination observed in the SYS (Table 2) not only leads to enhanced NO photoproduction (see Table 2) but also generates reactive oxygen species like , ROO•, and other OH-derived radicals, which in turn would efficiently scavenge NO (Olasehinde et al., 2010). Overall, the NO photoproduction rates showed a positive relationship between illuminance (p<0.01, r=0.884, n=26) and the mean surface downward UV radiation flux (p<0.01, r=0.865, n=26), indicating that the NO concentrations in the surface layer during daylight were dominated by photochemical production. However, we did not find a significant difference between the mean NO concentrations sampled during the day (179±80 pmol L−1) and at night (195±140 pmol L−1). This suggests that there was also a non-photochemical NO dark production in the surface layer, such as the nitrification process, or other chemical process, such as the process of ammonium () oxidation into and (Joussotdubien and Kadiri, 1970). Caranto and Lancaster (2017) found that NO is an obligate bacterial nitrification intermediate produced by hydroxylamine oxidoreductase; Ward and Zafiriou (1988) also found that NO might be an intermediate for soluble byproducts of nitrification such as hydroxylamine.
Besides, Olasehinde et al. (2010) found that filtered and unfiltered seawater samples collected from the Seto Inland Sea showed no significant difference in NO photoformation rates, which suggested a negligible contribution of NO produced by photobiological processes from particle matter in seawater. However, Liu et al. (2017) reported that the rate difference between filtered (0.45 µm, mol L−1 s−1) and unfiltered ( mol L−1 s−1) seawater samples from coastal waters of the YS indicated that particles in seawater could increase the NO production rate. The difference might be due to the composition of sample, filter membrane, etc. Thus, further research is needed.
3.4 Sea-to-air fluxes of NO
In the present study, the NO supersaturation was ubiquitous at all investigated sites. The supersaturation factors varied from 8 to 154, with an average of 47. Together with the fact that NO was supersaturated during daytime and nighttime at the 24 h station B65, which indicates that the BS and YS were a source of NO to the atmosphere. The sea-to-air flux densities ranged from to mol cm−2 s−1, with an average value of mol cm−2 s−1 (Fig. 5). The comparison of wind speeds and flux densities reveal that the flux densities are mainly driven by the wind speed (Fig. 5) and that they showed significant positive relationship (p<0.01, r=0.938, n=20). Anifowose and Sakugawa (2017) also found that wind speed was an important factor governing NO flux at the air–sea interface. Our flux densities from the BS and YS were similar to those computed for the central equatorial Pacific Ocean and the Seto Inland Sea, while they are slightly lower than those computed for of Jiaozhou Bay waters (Table 2). Based on the YS area of 380×103 km2 and the BS area of 77×103 km2, the emission of NO to the atmosphere was estimated to be 9.0×10⁸ g N yr−1 or 7.6×10⁷ g N month−1. Ding et al. (2018) reported a satellite-derived average NOx emission estimate for June over the BS and the YS in the period from 2007 to 2016 of about 1.3×10¹⁰ g N month−1. The obvious very large discrepancy between the satellite-derived emission estimate and the one presented here results from the fact that Ding et al.'s (2018) estimate is dominated by the NOx emissions from ships' diesel engines. This indicates that oceanic NO emissions to the atmosphere only account for a negligible fraction (∼0.6 %) of the NOx emissions observed over the BS and YS.

3.5 NO mixed-layer budget
In order to estimate the contribution of different sources and sinks of NO in the surface layer of the BS and YS, we applied a simple box model. We assume that the surface layer is represented by the mixed layer, with a mean water depth of 15 m (Qiao et al., 2004). At steady state the loss of NO by air–sea exchange (Fase) must be equal to the sum of the photoproduction rate (Fpp) in the mixed layer, the input from below into the mixed layer by diapycnal diffusion (Fdia) and other production or consumption pathways (Fpoc), and advection into or out of the BS and YS mixed layer (Fadv). To this end, Fase is given by
The mean Fase was mol cm−2 s−1 (see above). We assume that the NO photoproduction decreases linearly from the average rate of mol L−1 s−1 at the surface (see above) to 0 at 15 m. The mean Fpp was calculated to be mol cm−2 s−1 in mixed layer. Since the mean surface NO concentration in the surface layer was statistically not different from the mean NO concentration in the bottom layer (see above), it is reasonable to assume that Fdia=0. Moreover, it seems reasonable to assume that advection of NO into or out of the BS and YS surface layer is zero. Since Fase < Fpp, we conclude that Fpoc should be negative, indicating that the bulk of the produced NO was rapidly consumed in the surface layer before its release to the atmosphere. Please note that we have some indications that there is also a dark production of NO (see above), meaning that the “true” NO surface production might be even higher. Chemical reactions with DO, OH, or ROO• etc. are potential sinks for NO in the surface layer of the BS and YS (Ford et al., 1993; Olasehinde et al., 2010; Carpenter and Nightingale, 2015).
This study reports the distribution and photoproduction rates of dissolved NO measured during a cruise in June 2011 in the Bohai and Yellow seas. The NO concentration distribution in both the surface and bottom layers were highly variable; however, there was no significant difference between the mean NO concentrations in the surface and bottom layers. NO concentrations in the bottom layer showed a significant decrease with salinity, which indicates NO input by submarine groundwater discharge. NO in the surface layer was supersaturated at all stations during day and night. The accumulation of NO during daytime was a result of photoproduction, and the measured NO photoproduction rates were correlated to illuminance. The persistent nighttime NO supersaturation pointed to a non-photochemical (so far unidentified chemical and/or biological) NO dark production. On the basis of a simple box model calculation, we conclude that the bulk of the NO produced in the surface layer was rapidly consumed before its release to the atmosphere. Overall, the BS and YS were a persistent source of NO to the atmosphere at the time of our measurements. However, the oceanic NO emissions were negligible compared to the NOx emissions from ships' diesel engines.
The data can be accessed by email request to the corresponding authors and have been submitted to the open-access database PANGAEA (https://doi.org/10.1594/PANGAEA.907361, Tian, 2019).
YT, CX, CYL, GPY, PFL, and WHF designed the experiments and prepared the original manuscript. HWB made many modifications and gave a lot of suggestions on the design of the figures and the computing method. All authors contributed to the analysis of the data and discussed the results.
The authors declare that they have no conflict of interest.
We thank the captain and crew of the R/V Dong Fang Hong 2 for their support and help during the cruise. This is MCTL contribution No. 221. We thank the editor and two reviewers for their thoughtful feedback on the manuscript.
This research has been supported by the National Natural Science Foundation of China (grant nos. 41676065 and 40706040), the National Key Research and Development Program of China (grant no. 2016YFA0601301), and the Fundamental Research Funds for the Central Universities (grant no. 201762032).
This paper was edited by S. Wajih A. Naqvi and reviewed by Carolin Löscher and one anonymous referee.
Anifowose, A. J. and Sakugawa, H.: Determination of daytime flux of nitric oxide radical (NO•) at an inland sea–atmospheric boundary in japan, J. Aquat. Pollut. Toxicol., 1, 1–6, 2017.
Bange, H. W.: Chapter 2 – Gaseous nitrogen compounds (NO, N2O, N2, NH3) in the ocean, Nitrogen in the marine environment, 2nd Edn., Elsevier, Amsterdam, the Netherlands, 51–94, 2008.
Caranto, J. D. and Lancaster, K. M.: Nitric oxide is an obligate bacterial nitrification intermediate produced by hydroxylamine oxidoreductase, P. Natl. Acad. Sci. USA, 114, 8217, https://doi.org/10.1073/pnas.1704504114, 2017.
Carpenter, L. J. and Nightingale, P. D.: Chemistry and release of gases from the surface ocean, Chem. Rev., 115, 4015–4034, https://doi.org/10.1021/cr5007123, 2015.
Chen, T., Ren, C., Li, W., Jiang, X., Xia, J., Wong, N. K., and Hu, C.: Calmodulin of the tropical sea cucumber: gene structure, inducible expression and contribution to nitric oxide production and pathogen clearance during immune response, Fish Shellfish Immunol., 45, 231–238, https://doi.org/10.1016/j.fsi.2015.04.013, 2015.
Ding, J. R., Ronald, V. D. A., Mijling, B., Jalkanen, J. P., Johansson, L., and Levelt, P. F.: Maritime NOx emissions over Chinese seas derived from satellite observations, Geophys. Res. Lett., 45, 2031–2037, https://doi.org/10.1002/2017gl076788, 2018.
Feng, W. H., Liu, C. Y., Yang, G. P., Li, P. F., and Xue, C.: Chemiluminescene detection of nitric oxide in seawater, Acta Oceanol. Sin., 33, 93–98, 2011 (in Chinese with English abstract).
Ford, P. C., Wink, D. A., and Stanbury, D. M.: Autoxidation kinetics of aqueous nitric oxide, Febs Lett., 326, 1–3, https://doi.org/10.1016/0014-5793(93)81748-o, 1993,
Grasshoff, K., Kremling, K., and Ehrhardt, M.: Methods of seawater analysis, John Wiley & Sons, New York, American, 317 pp., 2009.
Jähne, B., Heinz, G., and Dietrich, W.: Measurement of the diffusion coefficients of sparingly soluble gases in water, J. Geophys. Res.-Ocean., 92, 10767–10776, https://doi.org/10.1029/jc092ic10p10767, 1987.
Jeong, C. B., Kang, H. M., Seo, J. S., Park, H. G., Rhee, J. S., and Lee, J. S.: Identification and molecular characterization of nitric oxide synthase (NOS) gene in the intertidal copepod Tigriopus japonicas, Gene, 577, 47–54, https://doi.org/10.1016/j.gene.2015.11.019, 2016.
Jiang, X., Teng, A., Xu, W., and Liu, X.: Distribution and pollution assessment of heavy metals in surface sediments in the Yellow Sea, Mar. Pollut. Bull., 83, 366–375, https://doi.org/10.1016/j.marpolbul.2014.03.020, 2014.
Joussotdubien, J. and Kadiri, A.: Photosensitized Oxidation of Ammonia by Singlet Oxygen in Aqueous Solution and in Seawater, Nature, 227, 700–701, https://doi.org/10.1038/227700b0, 1970.
Kim, D., Yamaguchi, K., and Oda, T.: Nitric oxide synthase-like enzyme mediated nitric oxide generation by harmful red tide phytoplankton, J. Plank. Res., 28, 613–620, https://doi.org/10.1093/plankt/fbi145, 2006.
Kim, D., Yang, S. K., Lee, Y., Yamaguchi, K., Matsuoka, K., Lee, K. W., Choi, K. S., and Oda, T.: Detection of nitric oxide (NO) in marine phytoplankters, J. Biosci. Bioeng., 105, 414–417, https://doi.org/10.1263/jbb.105.414, 2008.
Kim, G., Ryu, J. W., Yang, H. S., and Yun, S. T.: Submarine groundwater discharge (SGD) into the Yellow Sea revealed by 228Ra and 226Ra isotopes: Implications for global silicate fluxes, Earth Planet, Sci. Lett., 237, 156–166, https://doi.org/10.1016/j.epsl.2005.06.011, 2005.
Kuypers, M. M. M., Marchant, H. K., and Kartal, B.: The microbial nitrogen-cycling network, Nat. Rev. Microbiol., 16, 263–276, https://doi.org/10.1038/nrmicro.2018.9, 2018.
Lee, H. J., Jung, K. T., So, J. K., and Chung, J. Y.: A three-dimensional mixed finite-difference Galerkin function model for the oceanic circulation in the Yellow Sea and the East China Sea in the presence of M2 tide, Cont. Shelf Res., 22, 67–91, https://doi.org/10.1016/s0278-4343(01)00068-1, 2002.
Li, J., Li, G., Xu, J., Dong, P., Qiao, L., Liu, S., Sun, P., and Fan, Z.: Seasonal evolution of the Yellow Sea Cold Water Mass and its interactions with ambient hydrodynamic system, J. Geophys. Res., 121, 6779–6792, https://doi.org/10.1002/2016jc012186, 2016.
Liu, C.-Y., Feng, W.-H., Tian, Y., Yang, G.-P., Li, P.-F., and Bange, H. W.: Determination of dissolved nitric oxide in coastal waters of the Yellow Sea off Qingdao, Ocean Sci., 13, 623–632, https://doi.org/10.5194/os-13-623-2017, 2017.
Liu, J., Du, J., and Yi, L.: Ra tracer-based study of submarine groundwater discharge and associated nutrient fluxes into the Bohai Sea, China: A Highly Human-Affected Marginal Sea, J. Geophys. Res., 122, 139–152, https://doi.org/10.1002/2017JC013095, 2017a.
Liu, J. A., Su, N., Wang, X., and Du, J.: Submarine groundwater discharge and associated nutrient fluxes into the Southern Yellow Sea: A case study for semi-enclosed and oligotrophic seas-implication for green tide bloom, J. Geophys. Res.-Ocean., 122, 8646–8660, https://doi.org/10.1002/2017jc013095, 2017b.
Liu, S. M., Zhang, J., Chen, H. T., and Zhang, G. S.: Factors influencing nutrient dynamics in the eutrophic Jiaozhou Bay, North China, Prog. Oceanogr., 66, 66–85, https://doi.org/10.1016/j.pocean.2005.03.009, 2005.
Liu, S. M.: Response of nutrient transports to water-sediment regulation events in the Huanghe basin and its impact on the biogeochemistry of the Bohai, J Marine Syst., 141, 59–70, https://doi.org/10.1002/2016jc012282, 2015.
Lü, X., Qiao, F., Xia, C., Wang, G., and Yuan, Y.: Upwelling and surface cold patches in the Yellow Sea in summer: Effects of tidal mixing on the vertical circulation, Cont. Shelf Res., 30, 620–632, https://doi.org/10.1016/j.csr.2009.09.002, 2010.
Lutterbeck, H. E. and Bange, H. W.: An improved method for the determination of dissolved nitric oxide (NO) in seawater samples, Ocean Sci., 11, 959–981, https://doi.org/10.5194/osd-12-959-2015, 2015.
Lutterbeck, H. E., Arévalo-Martínez, D. L., Löscher, C. R., and Bange, H. W.: Nitric oxide (NO) in the oxygen minimum zone off Peru, Deep-Sea Res. Pt. II, 156, 148–154, https://doi.org/10.1016/j.dsr2.2017.12.023, 2018.
Martens-Habbena, W., Qin, W., Horak, R. E., Urakawa, H., Schauer, A. J., Moffett, J. W., Armbrust, E. V., Ingalls, A. E., Devol, A. H., and Stahl, D. A.: The production of nitric oxide by marine ammonia-oxidizing archaea and inhibition of archaeal ammonia oxidation by a nitric oxide scavenger, Environ. Microbiol., 17, 2261–2274, https://doi.org/10.1111/1462-2920.12677, 2015.
McGillis, W. R., Dacey, J. W. H., Frew, N. M., Bock, E. J., and Nelson, R. K.: Water-air flux of dimethylsulfide, J. Geophys. Res., 105, 1187–1193, https://doi.org/10.1029/1999JC900243, 2000.
Millero, F. J., Gonzalez, A., and Ward, G. K.: Density of seawater solutions at one atmosphere as a function of temperature and salinity, J. Mar. Res., 34, 61–93, 1976.
Morrall, C. E., Trapido-Rosenthal, H. G., Knap, A. H., and Depledge, M. H.: Development of nitric oxide and nitric oxide synthase as ecotoxicological biomarkers in the tropical marine environment, Mar. Environ. Res., 46, 429–432, https://doi.org/10.1016/s0141-1136(97)00080-9, 1998.
Morrall, C. E. and Galloway, T. S., Trapidorosenthal, H. G., and Depledge, M. H.: Characterisation of nitric oxide synthase activity in the tropical sea anemone Aiptasia pallida, Comp. Biochem. Physiol. Pt. B, 125, 483–491, https://doi.org/10.1016/s0305-0491(00)00157-7, 2000.
Olasehinde, E. F., Takeda, K., and Sakugawa, H.: Development of an analytical method for nitric oxide radical determination in natural waters, Anal. Chem., 81, 6843–6850, https://doi.org/10.1021/ac901128y, 2009.
Olasehinde, E. F., Takeda, K., and Sakugawa, H.: Photochemical production and consumption mechanisms of nitric oxide in seawater, Environ. Sci. Technol., 44, 8403–8408, https://doi.org/10.1021/es101426x, 2010.
Qiao, F. L., Xia C. S., and Shi J. W.: Seasonal variability of thermocline in the Yellow Sea, Chin. J. Oceanol. Limnol., 22, 299–305, https://doi.org/10.1007/BF02842563, 2004.
Sander, R.: Compilation of Henry's law constants (version 4.0) for water as solvent, Atmos. Chem. Phys., 15, 4399–4981, https://doi.org/10.5194/acp-15-4399-2015, 2015.
Schreiber, F., Stief, P., Kuypers, M. M. M., and De Beer, D.: Nitric oxide turnover in permeable river sediment, Limnol. Oceanogr., 59, 1310–1320, https://doi.org/10.4319/lo.2014.59.4.1310, 2014.
Sharqawy, M. H., Lienhard, J. H., and Zubair, S. M.: Thermophysical properties of seawater: a review of existing correlations and data, Desalin. Water Treat., 16, 354–380, https://doi.org/10.5004/dwt.2010.1079, 2010.
Smith, R. L., Böhlke, J. K., Garabedian, S. P., Revesz, K. M., and Yoshinari, T.: Assessing denitrification in groundwater using natural gradient tracer tests with 15N: In situ measurement of a sequential multistep reaction, Water Resour. Res., 40, 1–17, https://doi.org/10.1029/2003wr002919, 2004.
Smith, R. L. and Yoshinari, T.: Occurrence and turnover of nitric oxide in a nitrogen-impacted sand and gravel aquifer, Environ. Sci. Technol., 42, 8245, https://doi.org/10.1021/es801290v, 2008.
Strickland, J. D. H. and Parsons T. R.: A practical handbook of seawater analysis, Fisheries Research Board of Canada, Ottowa, 131 pp., 1968.
Su, J.: Circulation dynamics of the China seas: north of 18∘ N, The Sea, 11, 483–505, 1998.
Taniguchi, M., Ishitobi, T., Chen, J., Onodera, S. I., Miyaoka, K., Burnett, W. C., Peterson, R., Liu, G., and Fukushima, Y.: Submarine groundwater discharge from the Yellow River Delta to the Bohai Sea, China, J. Geophys. Res.-Ocean., 113, C06025, https://doi.org/10.1029/2007jc004498, 2008.
Tian, Y., Xue, C., Liu, C. Y., and Li, P. F.: Distribution and influencing factors of nitric oxide in the surface water of Jiaozhou Bay, Res. Environ. Sci., 29, 1451–1458, 2016 (in Chinese with English abstract).
Tian, Y.: Nitric oxide (NO) concentration in the Bohai and Yellow Seas during June 2011, with a set up combined with purge-and-trap setup and a fluorometric detection of NO, PANGAEA, https://doi.org/10.1594/PANGAEA.907361, 2019.
Wanninkhof, R.: Relationship between wind speed and gas exchange over the ocean revisited, Limnol. Oceanogr., 12, 351–362, https://doi.org/10.4319/lom.2014.12.351, 2014.
Ward, B. B. and Zafiriou, O. C.: Nitrification and nitric oxide in the oxygen minimum of the eastern tropical North Pacific, Deep-Sea Res. Pt. I, 35, 1127–1142, https://doi.org/10.1016/0198-0149(88)90005-2, 1988.
Weiss, R. F. and. Price, B. A.: Nitrous oxide solubility in water and seawater, Mar. Chem., 8, 347–359, https://doi.org/10.1016/0304-4203(80)90024-9, 1980.
Wise, D. L. and Houghton, G.: Diffusion coefficients of neon, krypton, xenon, carbon monoxide and nitric oxide in water at 10–60 ∘C, Chem. Eng. Sci., 23, 1211–1216, https://doi.org/10.1016/0009-2509(68)89029-3, 1968.
Xian, J. A., Guo, H., Li, B., Miao, Y. T., Ye, J. M., Zhang, S. P., Pan, X. B., Ye, C. X., Wang, A. L., and Hao, X. M.: Measurement of intracellular nitric oxide (NO) production in shrimp haemocytes by flow cytometry, Fish Shellfish Immunol., 35, 2032–2039, https://doi.org/10.1016/j.fsi.2013.10.014, 2013.
Xue, C., Liu, C. Y., Yang G. P., Zhu, C. J., Chen, J., and Zhang, H. H.: Distribution and controlling factors of nitric oxide concentrations in surface seawater of Jiaozhou Bay and adjacent waters, Chin. J. Environ. Sci., 33, 1086–1090, 2012 (in Chinese with English abstract).
Yang, J., Yang G. P., Zhang, H. H., and Zhang, S. H.: Spatial distribution of dimethylsulfide and dimethyl-sulfoniopropionate in the Yellow Sea and Bohai Sea during summer, Chin. J. Oceanol. Limnol., 33, 1020–1038, https://doi.org/10.1007/s00343-015-4188-5, 2015.
Zafiriou, O. C. and Mcfarland, M.: Nitric oxide from nitrite photolysis in the central equatorial Pacific, J. Geophys. Res.-Atmos., 86, 3173–3182, https://doi.org/10.1029/jc086ic04p03173, 1981.
Zafiriou, O. C., Mcfarland, M., and Bromund, R. H.: Nitric oxide in seawater, Science, 207, 637–639, https://doi.org/10.1126/science.207.4431.637, 1980.
Zhan, S., Peng, S., Liu, C., Chang, Q., and Jian, X.: spatial and temporal variations of heavy metals in surface sediments in Bohai Bay, North China, Bull. Environ. Contam. Toxicol., 84, 482–487, https://doi.org/10.1007/s00128-010-9971-6, 2010.
Zhang, J., Yu, Z. G., Raabe, T., Liu, S. M., Starke, A., Zou, L., Gao, H. W. and Brockmann, U.: Dynamics of inorganic nutrient species in the Bohai seawaters, J. Mar. Syst., 44, 189–212, https://doi.org/10.1016/j.jmarsys.2003.09.010, 2004.
Zhang, Z. B., Lin, C., Liu, C., and Lei, X.: Study on patterns and chemical features of NO effect on marine phytoplankton growth, Sci. China, 48, 376–384, https://doi.org/10.1360/03yb0166, 2005.
Zhang, Z. B., Xing, L., Wu, Z. Z., Liu, C. Y., Lin, C., and Liu, L. S.: Discovery of nitric oxide in marine ecological system and the chemical characteristics of nitric oxide, Sci. China, 49, 475–480, https://doi.org/10.1007/s11426-006-2017-6, 2006a.
Zhang, Z. B., Liu, C. Y., Wu, Z. Z., Xing, L., and Li, P. F.: Detection of nitric oxide in culture media and studies on nitric oxide formation by marine microalgae, Med. Sci. Monit., 12, 75–85, https://doi.org/10.12659/MSM.914621, 2006b.