the Creative Commons Attribution 4.0 License.
the Creative Commons Attribution 4.0 License.
 | 20 Nov 2019
Net heterotrophy and carbonate dissolution in two subtropical seagrass meadows
Bryce R. Van Dam
Christian Lopes
Christopher L. Osburn
James W. Fourqurean
The net ecosystem productivity (NEP) of two seagrass meadows within one of the largest seagrass ecosystems in the world, Florida Bay, was assessed using direct measurements over consecutive diel cycles during a short study in the fall of 2018. We report significant differences between NEP determined by dissolved inorganic carbon (NEPDIC) and by dissolved oxygen (NEPDO), likely driven by differences in air–water gas exchange and contrasting responses to variations in light intensity. We also acknowledge the impact of advective exchange on metabolic calculations of NEP and net ecosystem calcification (NEC) using the “open-water” approach and attempt to quantify this effect. In this first direct determination of NEPDIC in seagrass, we found that both seagrass ecosystems were net heterotrophic, on average, despite large differences in seagrass net above-ground primary productivity. NEC was also negative, indicating that both sites were net dissolving carbonate minerals. We suggest that a combination of carbonate dissolution and respiration in sediments exceeded seagrass primary production and calcification, supporting our negative NEP and NEC measurements. However, given the limited spatial (two sites) and temporal (8 d) extent of this study, our results may not be representative of Florida Bay as a whole and may be season-specific. The results of this study highlight the need for better temporal resolution, accurate carbonate chemistry accounting, and an improved understanding of physical mixing processes in future seagrass metabolism studies.
- Article
(3328 KB) -
Supplement
(135 KB) - BibTeX
- EndNote


Seagrass ecosystems are often net autotrophic, producing more organic matter (OM) than they consume (Duarte et al., 2005, 2010; Barrón et al., 2006; Unsworth et al., 2012; Long et al., 2015a; Ganguly et al., 2017; Perez et al., 2018). In terrestrial ecosystems, CO2 uptake by photoautotrophs necessarily leads to an exchange of carbon from the atmosphere to the biosphere. However, such a net uptake of CO2 by submerged seagrass is attenuated as carbon produced or consumed by net ecosystem productivity (NEP) interacts with the carbonate buffering system and the processes of calcification and carbonate dissolution in the water, submerged sediments, and calcifying organisms. The impact of seagrass carbonate chemistry on measurements of NEP is further obscured by physical processes at the air–water interface, which may cause temporal lags between NEP and air–water CO2 exchange.
Calcification is an important process in many tropical and subtropical seagrass ecosystems (Mazarrasa et al., 2015) and has the net effect of consuming total alkalinity (TA) in excess of dissolved inorganic carbon (DIC), thereby decreasing pH and generating CO2. Florida Bay is a well-studied seagrass-dominated ecosystem and is assumed to be net calcifying given the vast autochthonous sedimentary deposits of CaCO3 that have accumulated in the bay in the last 3 millennia (Stockman et al., 1967; Bosence et al., 1985). While much of this CaCO3 was produced by other photoautotrophic or non-photoautotrophic calcifiers (Frankovich and Zieman, 1994), it is likely that some unknown fraction was also derived from calcification driven directly by the seagrass (Enríquez and Schubert, 2014), although the extent to which internal CaCO3 formation occurs remains a debated topic. Existing measurements from Florida Bay show that net ecosystem calcification (NEC) can vary from positive to negative over diel cycles (Turk et al., 2015) and across gradients of seagrass productivity and substrate type (Yates and Halley, 2006). The relative magnitudes of NEC and NEP in the context of the overall seagrass ecosystem carbon budget is unclear, and it is still uncertain which component of the ecosystem dominates net calcification (seagrass, benthic invertebrates, macroalgae, etc.). Early assessments of seagrass NEC in Florida Bay relied on species-specific calcification rates that were upscaled to the community or ecosystem level. These studies indicate that epiphytic calcification can dominate NEC (Frankovich and Zieman, 1994) and that the physical transport of carbonate mud within the bay is likely significant (Bosence, 1989). The physical transport of carbonate mud is important because it can allow CaCO3 formation and destruction to become spatially decoupled such that regions of net dissolution may exist within the larger context of the net calcification of Florida Bay. More recently, results from in situ chambers have indicated that seagrass primary production can dominate short-term carbonate chemistry dynamics (Hendriks et al., 2014; Turk et al., 2015; Camp et al., 2016).
This biological CO2 addition or removal causes non-linear changes in the marine carbonate system, further challenging direct measurements of seagrass ecosystem NEP. Hence, prior assessments of seagrass NEP were often made using dissolved oxygen (DO) production as a proxy for CO2 fixation, necessitating the assumption of a photosynthetic quotient (PQ) relating CO2 fixation to DO production. The assumption of a PQ value is made problematic by the carbonate system reactions discussed earlier, which affect CO2 but not DO. While it is often assumed that PQ is approximately 1 (e.g., Duarte et al., 2010), prior measurements of ΔCO2∕ΔDO in seagrass ecosystems show a wide range of values, from 0.3 to 6.8 (Ziegler and Benner, 1998; Barrón et al., 2006; Turk et al., 2015). As a result, potential exists for a general disagreement between NEP assessed using measurements of carbon and those using its O2 proxy (NEPDO). Hence, we identify a need for simultaneous measurements of pH, O2, pCO2, TA, and dissolved inorganic carbon (DIC) when assessing seagrass ecosystem NEP and NEC, which may explain the divergence between CO2- and O2-based methods.
In addition to the importance of primary production in seagrass meadows as a source of energy to fuel coastal ecosystems, the net uptake or production of CO2 could have other important impacts on the carbonate chemistry of overlying seawater. High primary production drives large diel variations in pH within seagrass meadows (e.g. Hendriks et al., 2014; Turk et al., 2015; Camp et al., 2016; Challener et al., 2016), and it has been suggested that seagrass NEP may partially buffer coastal ocean acidification (OA) by consuming CO2, thereby creating refugia for calcifying organisms (Manzello et al., 2012; Unsworth et al., 2012; Hendriks et al., 2014; Koweek et al., 2018; Pacella et al., 2018). Seagrass may also help to buffer local changes in pH by attenuating mangrove-derived fluxes of DIC (Buillon et al., 2007). However, it remains unclear how NEP and NEC might interactively affect carbonate system buffering in regions where primary producers of biomass and NEP are limited by the availability of nutrients, like in the severely phosphorus-limited regions of Florida Bay (Fourqurean et al., 1992).
Prior studies of NEPDO in Florida Bay have suggested net autotrophy (Long et al., 2015a), yet others were unable to infer long-term NEPDO balance (Turk et al., 2015). Both of these estimates of NEPDO necessarily ignore any anaerobic catabolic biogeochemical processes that may cause NEPDIC to decrease but do not affect NEPDO. Rates of denitrification (Eyre and Ferguson, 2002) and sulfate reduction (Smith et al., 2004; Ruiz-Halpern et al., 2008) can be significant in seagrass soils, although rates may depend on specific seagrass morphology and physiological traits (Holmer et al., 2001). Additionally, despite the inferred net ecosystem autotrophy of seagrass, pCO2 is often found above (Millero et al., 2001) or near (Yates et al., 2007) equilibrium with the atmosphere throughout most of Florida Bay, suggesting the important role of NEC or anaerobic catabolic processes in generating excess CO2.
In this study, we describe our direct measurements of NEPDIC, NEPDO, and NEC in two Florida Bay seagrass sites. We investigate variations in NEP and NEC across a seagrass productivity gradient, discuss differences between NEPDIC and NEPDO, and suggest possible drivers of NEP and NEC.
2.1 Study site
This study took place in one of the largest seagrass ecosystems in the world, Florida Bay (Fig. 1), where we occupied two primary study sites which experience similar hydrologic and climatologic conditions yet differ substantially in community composition and biomass (Table 1). The choice of these sites allowed us to discern the effects of seagrass abundance and productivity on NEP and NEC that are independent of the environmental setting. Both sites were dominated by the seagrass Thalassia testudinum in a phosphorus-limited region (Fourqurean et al., 1992), have similar water depths (∼2 m), and were approximately 0.5–1 km from land. However, these sites differed in important factors like seagrass above-ground biomass, nutrient content, morphology, sediment depth, soil carbon (organic and inorganic), and soil nutrient content (Table 1). The potential for submarine groundwater discharge at these locations is low (Corbett et al., 1999). In addition to the two primary study sites, we collected time series data of DO and pH for an additional four Florida Coastal Everglades Long Term Ecological Research (FCE-LTER) sites in an effort to test whether the relationship between NEPDO and NEPDIC observed in this study can be extended over larger areas of Florida Bay.

Figure 1Site map, showing locations of the high- and low-density sites (HD and LD) and meteorological stations used to derive U10 and pCO2 data (MS and CR, respectively). Additional FCE-LTER sites used in this study are shown as the dark-green squares: Sprigger Bank (SB), Bob Allen (BA), Little Madeira (LM), and Duck Key (DK).
2.2 Sampling campaigns
We quantified NEPDO, NEPDIC, and NEC at our high-density and low-density sites by measuring diel excursions in DO, DIC, and TA and applying corrections to account for factors like air–water gas exchange and variations in water depth and light intensity. This is essentially a modification of the “free-water” approach to assessing NEP (Nixon et al., 1976; Odum and Hoskin, 1958), where the total inventory of DIC or O2 is monitored over time. A benefit of this approach over traditional chamber-based metabolism methods is that the container effect is avoided, which is known to result in underestimations of benthic respiration due to a dampening of turbulent sediment-water exchange (Hopkinson and Smith, 2007). This approach has a number of weaknesses, however, related both to the reliance on modeled air–water gas exchange, which is subject to a high degree of uncertainty (Upstill-Goddard, 2006), and the assumption that the system is closed and does not exchange water or material with adjacent systems. Both of these assumptions may be broken in shallow seagrass meadows, where tides are minimal but a wind-driven seiche can be important. Furthermore, the physics governing air–water gas exchange in these systems are very poorly understood, and while it is assumed that wind-driven turbulence is the dominant driver, other factors like convection (MacIntyre et al., 2010; Podgrajsek et al., 2014), bottom-driven turbulence (Ho et al., 2016; Raymond and Cole, 2001), surfactant activity (McKenna and McGillis, 2004; Lee and Saylor, 2010), and chemical enhancement may at times play an equal or greater role (Smith, 1985; Wanninkhof, 1992).
During two sampling campaigns in late 2018, measurements were made over consecutive diel cycles for a total of 8 d. The first campaign lasted for ∼4 d, from 28 October–1 November, while the second campaign, also ∼4 d, lasted from 25 to 29 November. Samples were taken three times per day during the first campaign (dawn, noon, and dusk) and four times per day during the second campaign (dawn, late morning, early afternoon, and dusk). During the first sampling campaign, water samples were collected for the analysis of stable isotopic composition of DIC (δ13CDIC) in an effort to constrain potential DIC sources. We applied Keeling plots to our isotopic data, where 1∕nDIC is plotted against δ13CDIC. In this approach, the y intercept (as 1∕nDIC approaches 0) indicates the δ13CDIC value as nDIC approaches infinite concentration (e.g., as 1∕nDIC approaches 0) and can be interpreted as an indicator of the δ13CDIC of the source of the DIC (Karlsson et al., 2007).
2.3 Discrete measurements
At our primary study sites, water samples for total alkalinity (TA) and dissolved inorganic carbon (DIC) were collected with pre-rinsed borosilicate bottles at a depth of approximately 0.2 m. TA and DIC samples were preserved with a saturated solution of HgCl2 and stored on ice until analysis (Dickson et al., 2007). Samples for δ13CDIC were taken at the same depth, filtered to 0.45 µm, and preserved with HgCl2. Calcite saturation state (Ωcalcite) was calculated in CO2SYS (Lewis and Wallace, 1998) from measured TA, DIC, salinity, and temperature, using the H2CO3 dissociation constants of Mehrbach et al. (1973) refit by Dickson and Millero (1987).
At each of our primary sites, small quadrats (n=6; 10 cm×20 cm) were randomly placed; at the quadrats, aerial seagrass primary productivity () rates were determined using the leaf-marking technique (Zieman et al., 1989). For this analysis, seagrass leaves were scraped of all epiphytes using a razor blade, rinsed, and dried at 65 ∘C until a constant weight. This dried seagrass material was then weighed as seagrass biomass. Dry samples were homogenized and ground to a fine powder using a motorized mortar and pestle in preparation for tissue elemental content analysis (C, N, and P). Powdered samples were analyzed for total carbon (TC) and nitrogen content using an elemental analyzer (Thermo FlashEA, 1112 series). Phosphorus content was determined by a dry-oxidation, acid hydrolysis extraction followed by a colorimetric analysis of phosphate concentration of the extract (Fourqurean et al., 1992). The elemental ratio is reported as mole:mole. Surface soils were collected using a 60 mL manual piston core following previously described methods for determining soil carbon content (Corg and Cinorg; Fourqurean et al., 2012b).
2.4 Continuous measurements
At each of our primary sites, we deployed a YSI EXO2 water quality sonde which recorded water depth, sea surface temperature (SST; ∘C), sea surface salinity (SSS), and dissolved oxygen (DO; mg L−1) at an interval of 15 min. In situ pH was measured at each site with an ion-sensitive field effect transistor sensor (Sea-Bird SeaFET) at an interval of 5 min, with an initial accuracy of ±0.05 pH on the Total scale. In order to assess the sensitivity of NEP and NEC to light availability, we recorded photosynthetically active radiation (PAR) at the seagrass canopy ( – microeinsteins per second per square meter; an einstein is equal to one mole of photons) with a submerged Sea-Bird ECO-PAR sensor equipped with an automatic wiper for the optics. We also deployed Lowell tilt current meters (TCMs) at both of our primary sites to assess lateral transfer of water through the site, but the observed current speeds were below the minimum detectable speed for these instruments ( cm s−1).
At the four FCE-LTER sites (Fig. 1), we measured DO and pH over a span of 4–7 d in September (BA, LM, and DK) and 8 d in December (SB), with an hourly sampling frequency using YSI EXO2 sondes. These sites span broad gradients in phosphorus limitation, seagrass productivity (Fourqurean et al., 1992), carbonate production (Yates and Halley, 2006), DIC and TA concentrations (Millero et al., 2001), and air–water CO2 exchange (Yates and Halley, 2006; DuFore, 2012). We used these pH and DO data to calculate temporal excursions in DO (ΔDO) and hydrogen ion concentration (Δ[H+]; mM h−1), which are proxies for NEPDO and NEPDIC, respectively (Long et al., 2015b). Data from these FCE-LTER deployments were compared with data from the two primary sites to determine whether the results of this study were generalizable to the rest of Florida Bay.
2.5 Benthic chamber fluxes
During the second sampling campaign, benthic chambers were deployed continuously over bare sediment at each of our primary sites to measure sediment-water fluxes of TA and DIC, excluding the effect of seagrass shoots. At the beginning of the experiment, acrylic chambers (∼2.5 L) were flushed with site water and placed at a naturally seagrass-free location on the sediment, within a few meters of each of our primary sites. Chamber incubations ran for a total of 4 d. At intervals ranging from 8 to 20 h, ∼150 mL samples were taken from the chambers using a syringe, and the chambers were re-equilibrated with ambient site water. Fluxes were calculated based on the difference in concentration between the ambient water sample at the initial time of chamber placement and the final concentration inside the chamber.
2.6 Sample analysis
TA was analyzed in at least triplicate (n=3–5) 25 mL subsamples by automated Gran titration at a controlled temperature on an Apollo AS-ALK2, with an average precision (standard deviation of replicate measurements) of ±1.89 µmol kg−1, or 0.07 % of the average measured TA. Samples for DIC were analyzed by injecting 250 µL subsamples into an impinger filled with 10 % HCl, converting all DIC to CO2, which was subsequently transferred with a pure N2 carrier gas to a LI-COR 6262 infrared gas analyzer in integration mode. Samples were repeatedly injected (3–5 times) to improve the precision, which was still noticeably lower than that for TA, at ±5.11 µmol kg−1, or 0.21 %. During each TA and DIC run, a certified reference material (CRM) was repeatedly measured to quantify any drift or systematic bias with these analyses. The CRM used was purchased from Andrew Dickson at the Marine Physical Laboratory in La Jolla, California, and was a part of batch no. 154. We used these CRM measurements to correct TA and DIC, assuming a linear drift between repeat CRM runs. The magnitude of this correction was on average 0.75 % for DIC and 0.34 % for TA. Both TA and DIC measurements were converted to gravimetric units by multiplying the concentration (µM) by the calculated SSS- and SST-derived seawater density using the Gibbs Seawater toolbox for MATLAB (GSW; McDougall and Barker, 2010) to derive units of micromoles per kilogram.
Samples for δ13CDIC were analyzed on a Thermo GasBench coupled to a Thermo DELTA V Isotope Ratio Mass Spectrometer and reported in delta (δ) notation in units of per mill (‰) relative to Vienna Pee Dee Belemnite. Precision for this measurement was ±0.4 ‰ based on replicate analyses of CRM (Dickson et al., 2003).
2.7 NEP and NEC calculations
NEC, NEPDIC, and NEPDO were determined by integrating temporal excursions in salinity-normalized TA (nTA), DIC (nDIC), and DO. We quantified the total TA or DIC inventory over time to determine NEC and NEP in what is an application of the open-water approach. This approach requires a static water mass that is thoroughly mixed and a water residence time that is long enough to prevent lateral exchanges from affecting TA and DIC concentrations. This open water approach is often applied to shallow coastal systems including tidally inundated coral-reef lagoons, which are restricted from exchanges with the coastal ocean at low tide (Shaw et al., 2012; McMahon et al., 2018). While this approach may not be appropriate for coral-reef lagoons at high tide due to excessive lateral mixing and vertical heterogeneities (McMahon et al., 2018), this region in Florida Bay is not subject to tidally driven mixing to the same extent. First, NEC () was estimated using the alkalinity anomaly technique, which assumes that variations in TA are affected only by CaCO3 precipitation and dissolution (Eq. 1):
where ΔnTA was the difference in nTA (), h was the water depth, and ρ was the seawater density. The −0.5 scalar was required because 2 mol of TA are required to form 1 mol of CaCO3 production. Salinity-normalized DIC (ΔnDIC) was calculated in the same manner as ΔnTA. The temporal excursion in nTA used for Eq. (1) was calculated between each sampling point shown in Fig. 2g and h, for a total of 28 individual measurements of NEC. SSSAverage was determined for each sampling campaign at each site. By convention, NEC is positive when TA consumption occurs, and CaCO3 is inferred to have been precipitated. Because of this, other processes which act as sources or sinks of TA will necessarily impact calculated NEC. Such processes include denitrification, which is a net source of TA due to the consumption of HNO3. Sulfate reduction also produces TA but only if reduced sulfur is retained in the sediment and is not oxidized in oxygenated pore water. NEPDO (Eq. 2; ) and NEPDIC (Eq. 3; ) were calculated in a similar manner, but with additional corrections for air–water gas exchange and DIC consumption by NEC:
where O2 and CO2 fluxes (Eqs. 4 and 5) were estimated with a bulk-transfer approach using two different formulations for the gas transfer velocity (k600; cm h−1). These k600 parameterizations were intended to represent upper (Raymond and Cole, 2001) and lower (Ho et al., 2006) bounds for gas exchange. Wind data used to derive the k600 were taken from the NOAA meteorological station at Islamorada (DW1872; Fig. 1) and normalized to a height of 10 m a.m.s.l. under neutral drag conditions (U10; Large and Pond, 1981):
where pCO2(water) was the partial pressure of CO2 (µatm), and O2 was the measured DO concentration (mg L−1). pCO2(water) was calculated from measured TA and DIC using CO2SYS as above. Atmospheric pCO2 (pCO2(air)) was taken from the nearby Cheeca Rocks mooring buoy operated by the NOAA (Fig. 1), while O2(air) was calculated from the measured DO (%). The gas solubility (K) and Schmidt numbers (Sc) were calculated from in situ SSS and SST (Wanninkhof, 1992; Weiss, 1974). No attempt was made to refine NEC by accounting for the TA produced by ecosystem productivity, but preliminary calculations assuming TA increases with DIC consumption at a ratio of 17∕106 (Middelburg, 2019) indicated that this TA production was a small fraction of total NEC (average difference of <10 %). Furthermore, the implicit consideration of NEPDIC into the calculation of NEC (Eq. 1) introduces a circular reference in Eq. (3) (which includes NEC) that cannot be resolved in this approach.
2.8 Uncertainty analysis for NEP and NEC calculations
While our primary study sites are minimally affected by lunar tides, light water currents driven by wind and other factors do occur. When current speed is sufficiently high, and combined with spatial gradients in TA or DIC, the assumptions implicit in the open-water approach may not hold, and calculated metabolic rates will be subject to error. We consider this advection combined with spatial concentration gradients to be the largest source of uncertainty in our metabolic calculations. To address this concern, we calculated upper and lower bounds of NEC and NEP using conservative estimates of possible advective TA, DIC, and DO exchange. Given the spatial separation between the high- and low-density sites of approximately 4 km, and the average concentration difference in TA of 300 µmol kg−1, we estimate an average spatial gradient of 300∕4, or 75 . Given the close relationship between TA and DIC at this site, we consider the spatial gradient in DIC to be equal to that for TA. The average spatial gradient in DO was much lower, at 4.6 . These spatial concentration gradients ( were combined with a conservative estimate of water velocity (u) of 1.0 cm s−1 to estimate the contribution of advective forcing to calculated metabolic rates. Because current speed was below the limit of detection, we cannot infer current direction, leading us to take the cautious approach of applying this error term as an absolute value to both sides of our metabolic rate measurements. For example, the upper (NECUB) and lower bounds for NEC (NECLB) were calculated as and . Uncertainty bounds for NEPDIC and NEPDO were calculated in the same manner, using the average spatial gradients in DIC and DO listed above.
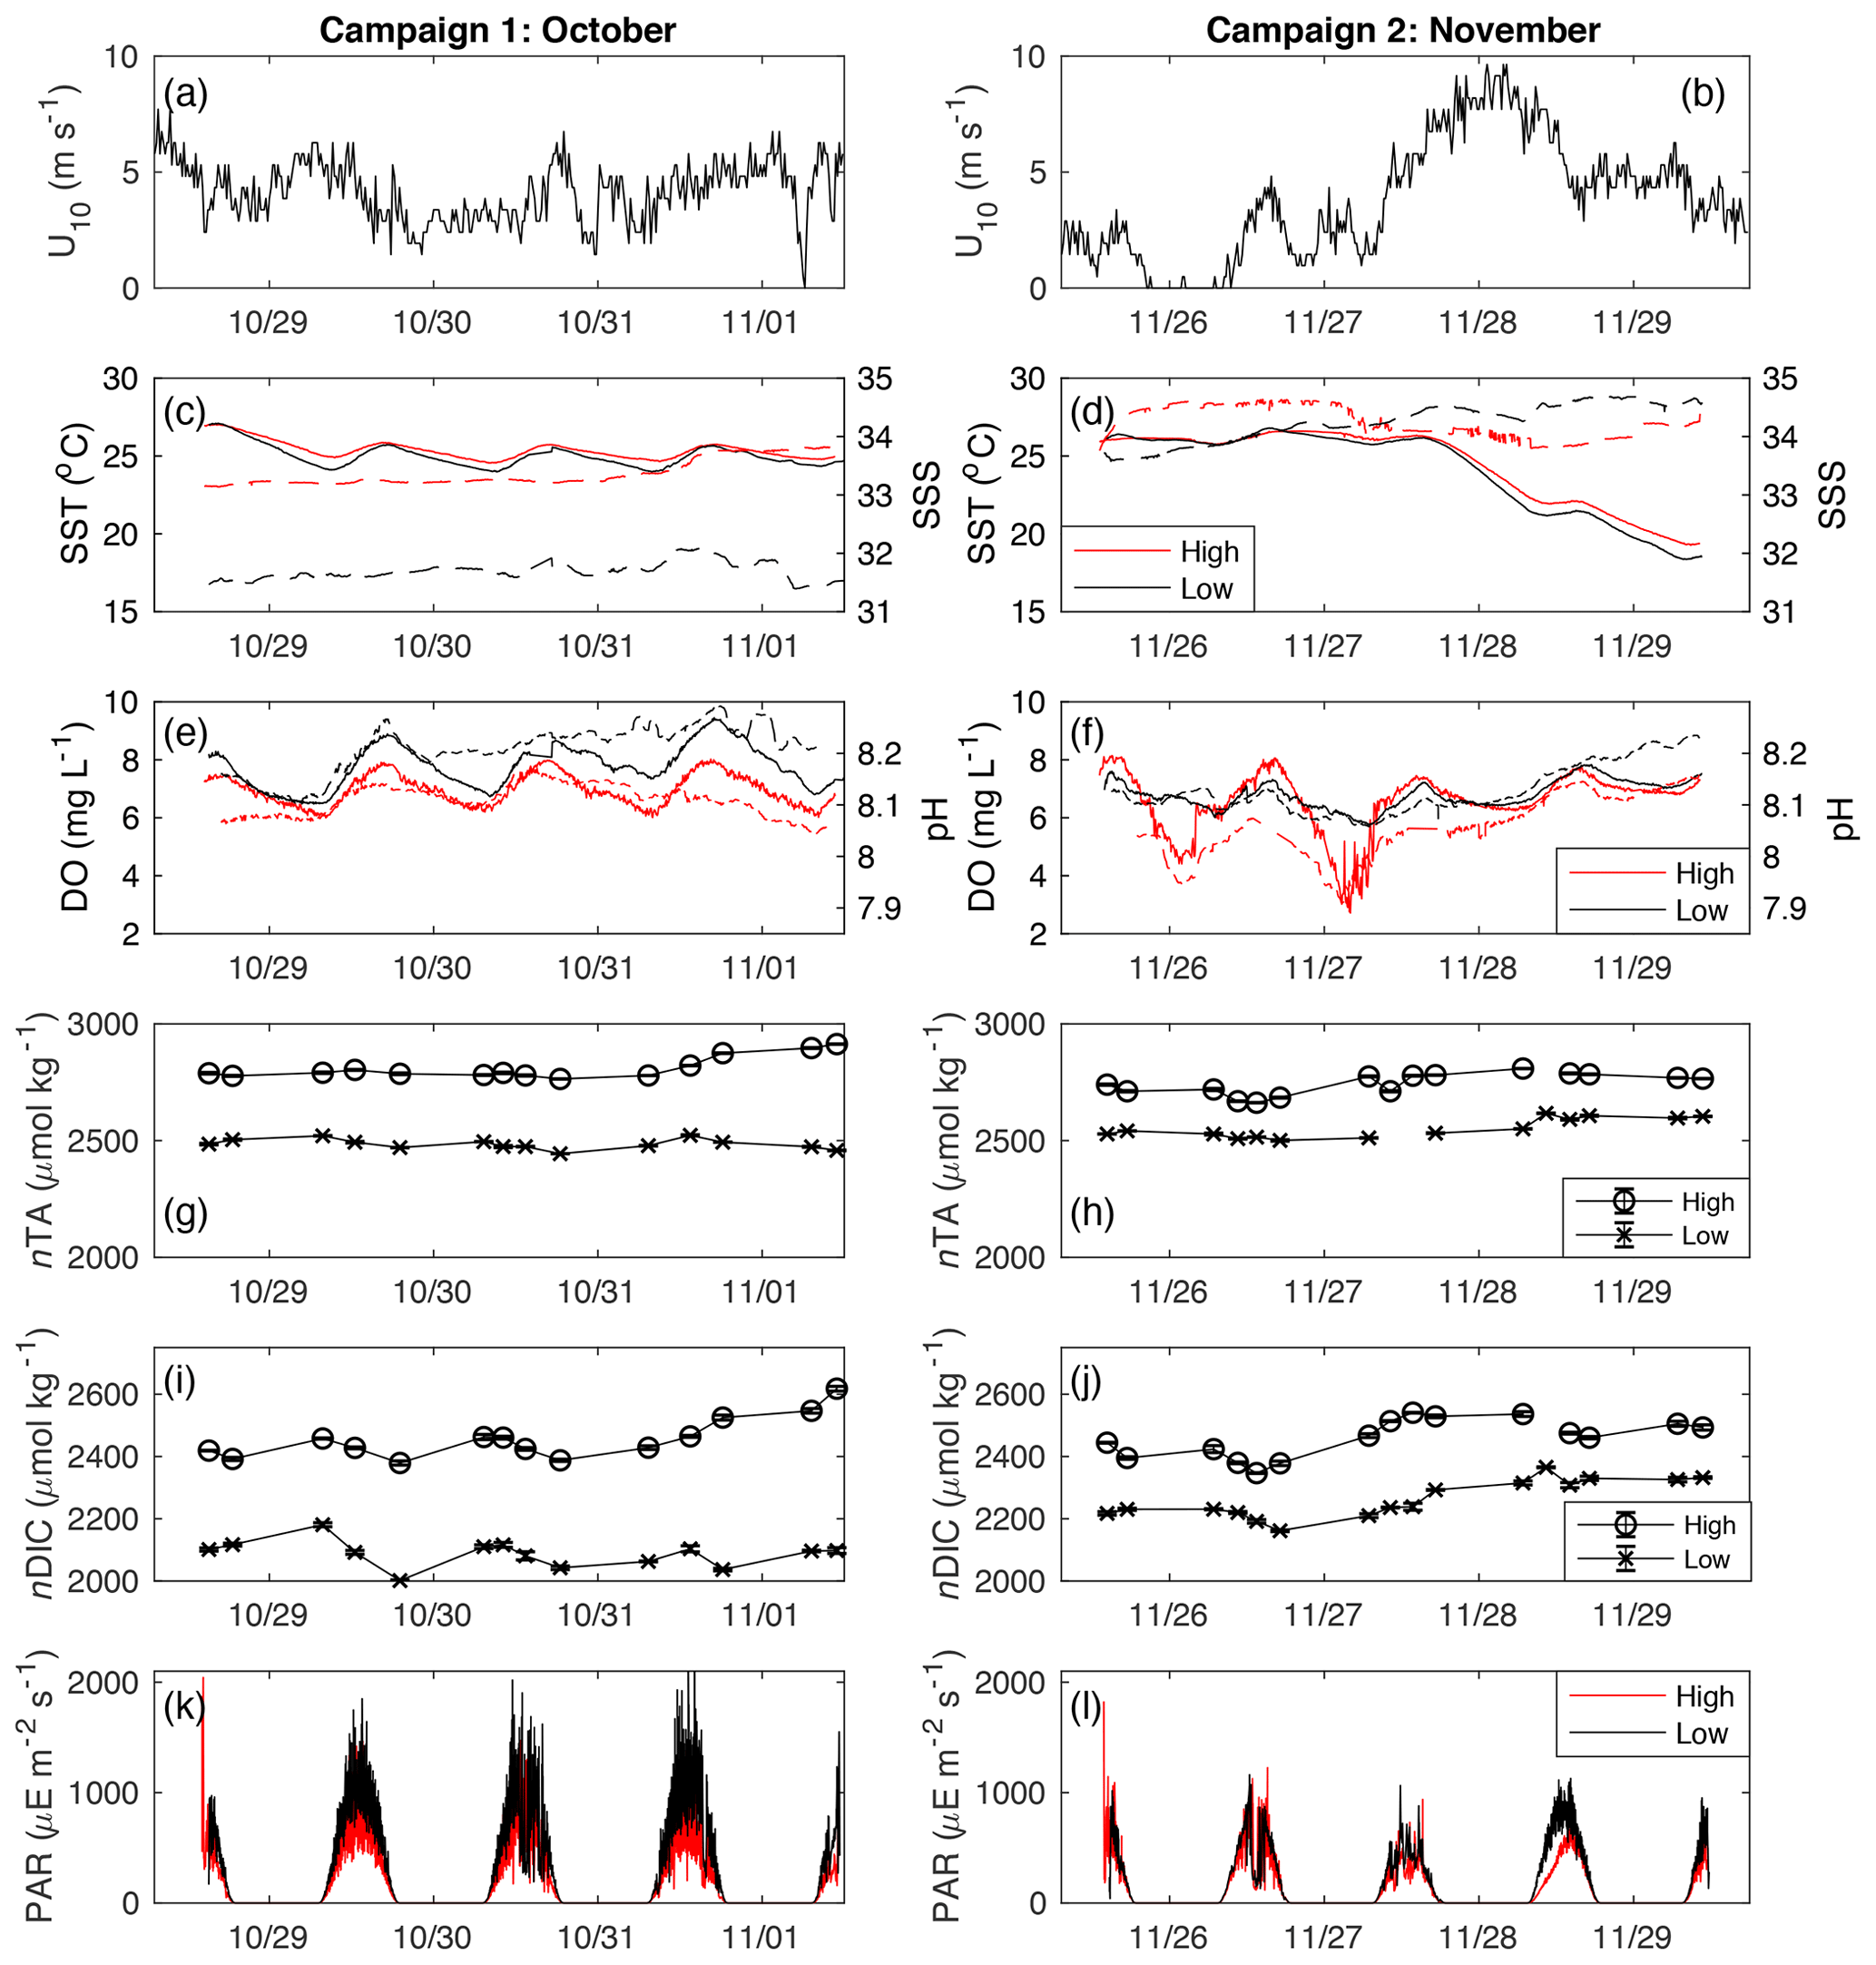
Figure 2Time series of (a–b) U10 (m s−1), (c–d) SST and SSS, (e–f) DO (mg L−1) and SeaFET pH, (g–h) nTA (µmol kg−1), (i–j) nDIC (µmol kg−1), and (k–l) PAR (). For panels (c)–(f), the solid lines are linked to the left axis, while the dashed lines are for the right axis.
3.1 Physicochemical conditions
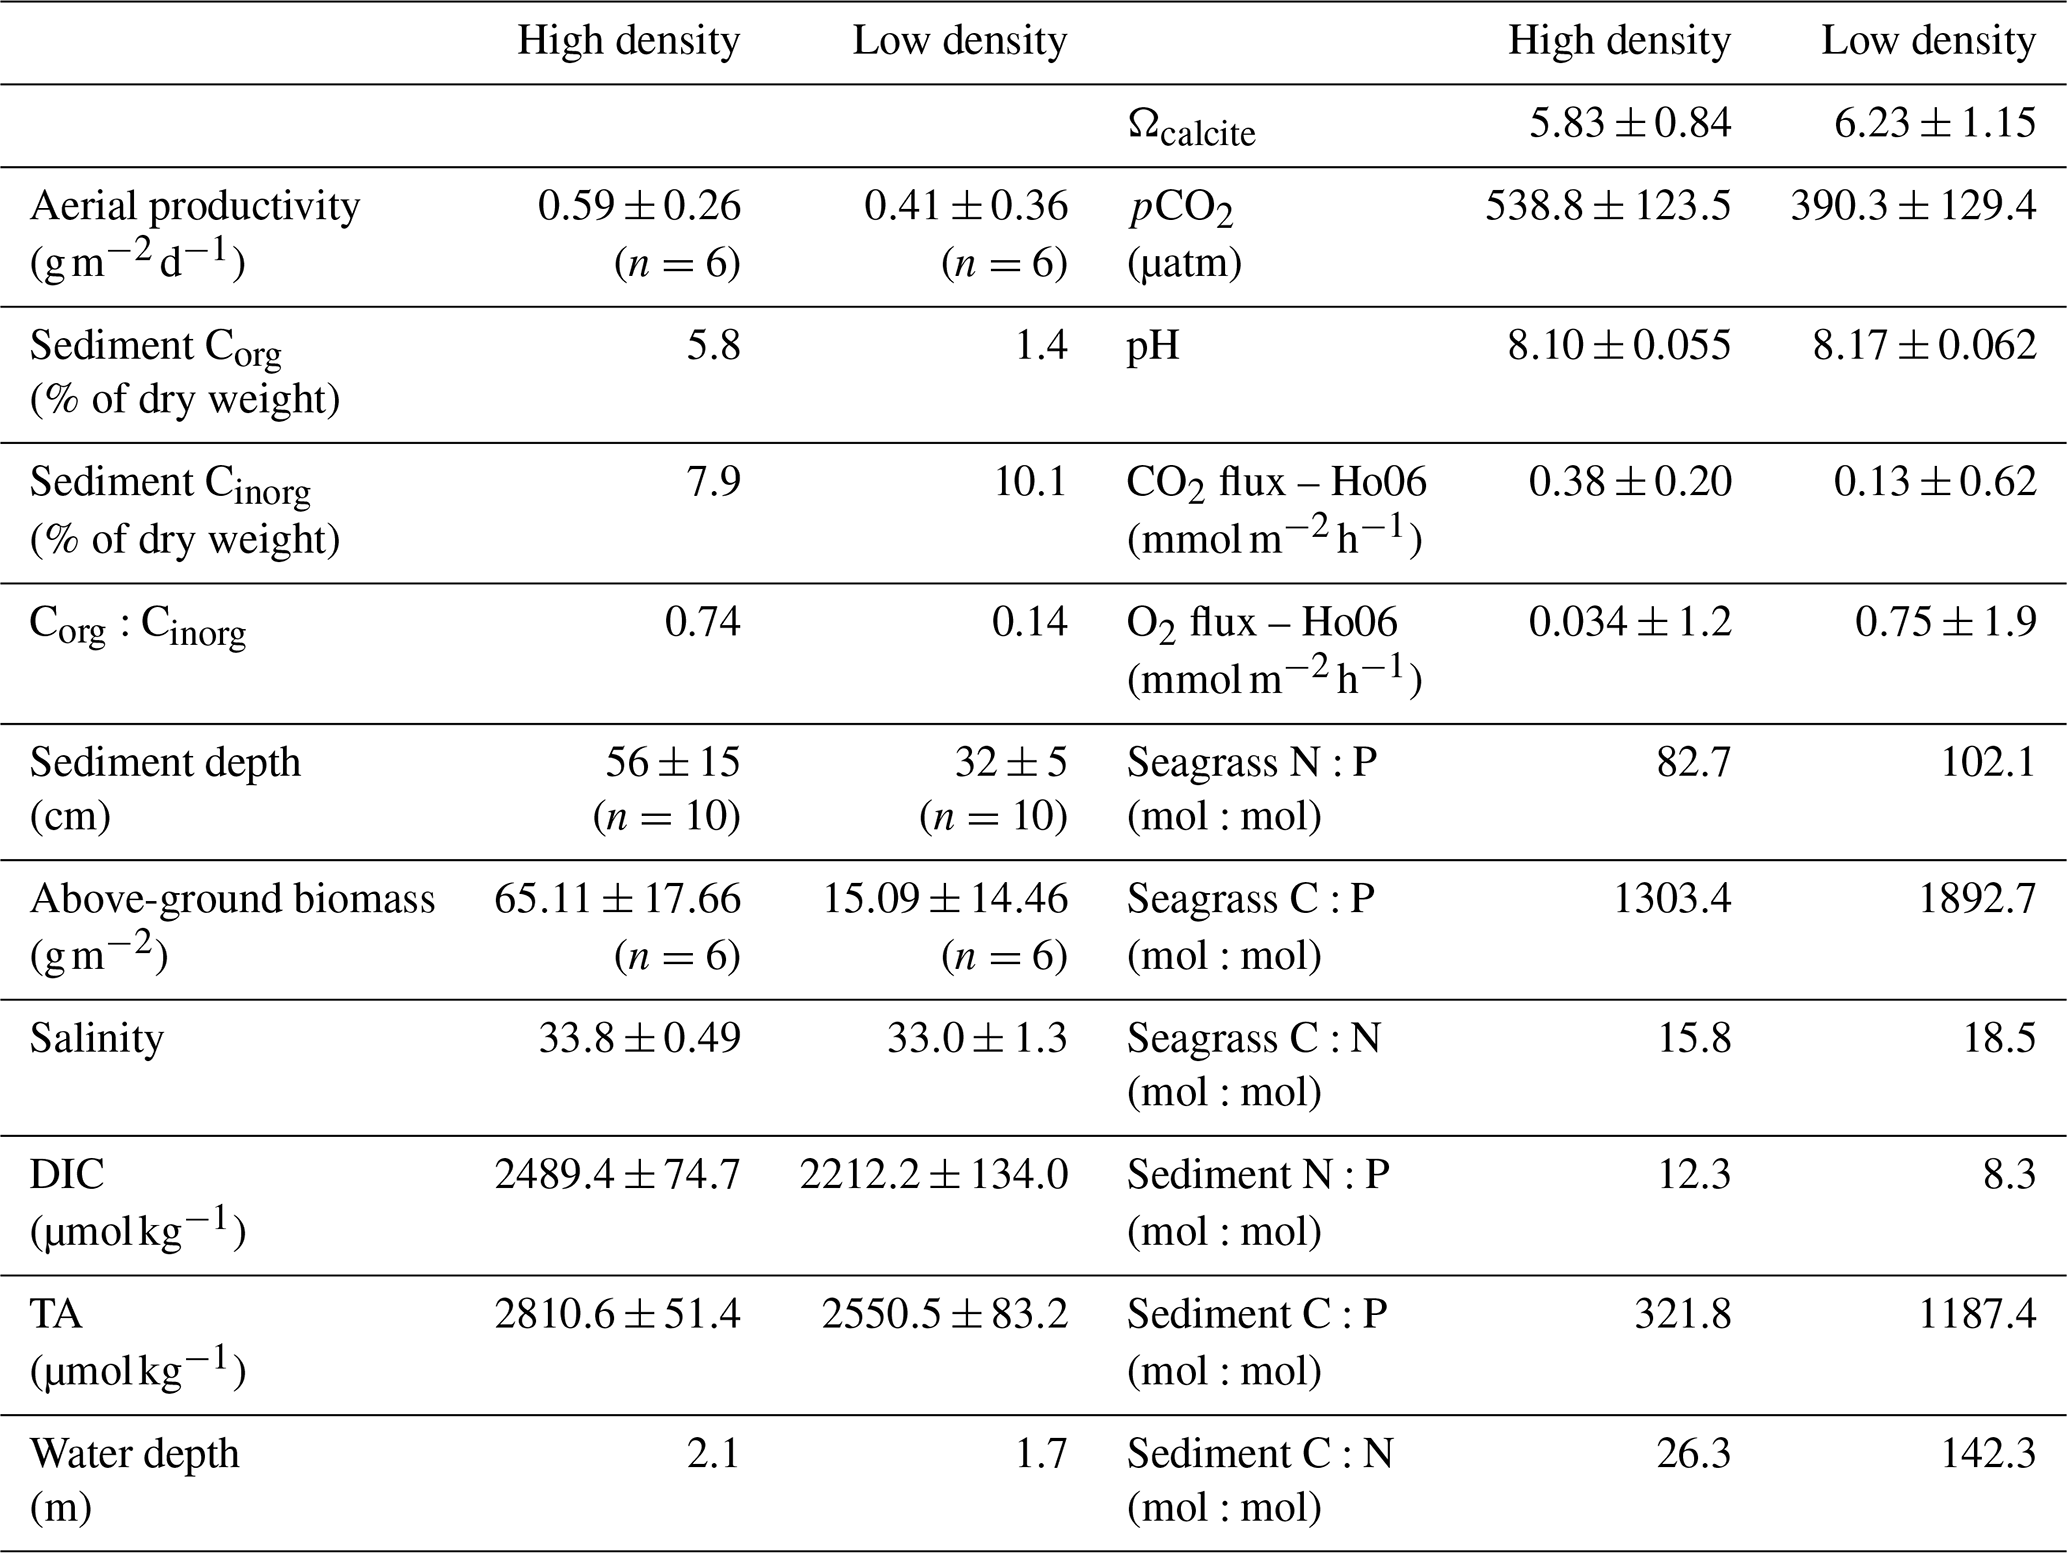
At each site, variations in SSS were generally less than 1 during each sampling campaign, indicating that precipitation and fresh groundwater inputs were likely minor sources of freshwater to these sites during the study period (Fig. 2c, d). Across sampling campaigns, SSS was more variable, ranging from 33.15 to 34.63 at the high-density site and from 31.45 to 34.67 at the low-density site. SST values at both sites followed each other closely, exhibiting diurnal variations of ∼2 ∘C and ranging from 18.5 to 27.0 across the entire study period (Fig. 2c, d). Diurnal variations in PAR coincided with those in SST, as is typical for sunlit shallow water (Fig. 2k, l). Likewise, both DO and pH exhibited typical diel excursions. The peak DO concentration of 8.14 (high density) and 9.45 mg L−1 (low density) occurred in the late afternoon, coinciding with maximum pH of approximately 8.17 (high density) and 8.29 (low density), respectively. The average pH was 8.08±0.05 at the high-density site, compared with 8.17±0.05 at the low-density site. The calculated pCO2(water) at the high-density site (538.8±123.5 µatm) was generally greater than atmospheric equilibrium, while average pCO2(water) was less than pCO2(air) at the low-density site (390.3±129.4; Table 1). The calculated CO2 flux was generally positive (from the water to the atmosphere) and small in magnitude, between 0.13±0.62 and 0.38±0.20 at the high-density site (RC01 and Ho06, respectively) and 0.20±0.40 and 0.067±0.35 at the low-density site (Table 1). There was a difference between CO2 fluxes derived using the RC01 and Ho06 k600 parameterizations, but this difference was small in magnitude compared to NEP and NEC; so for the sake of simplicity, we only present results using the Ho06 parameterization in the main text of this paper. Results considering both parameterizations are given in the Supplement.
Table 1Table of physicochemical conditions (TA, DIC, and salinity) and seagrass and sediment chemical characteristics (average±SD).
Between the first and second sampling campaigns, average midday PAR (from 10:00 to 14:00 LT) reaching the benthos at the low-density site fell by approximately 38 %, from 916±332 during the first sampling campaign to 567±219 for the second sampling campaign. Similarly, average midday PAR at the high-density site fell by ∼31 %, from 627±259 during the first sampling campaign to 432±211 for the second sampling campaign. After the passage of a large cold front and associated high wind speed on 28 November, SST fell by more than 5 ∘C. At the initial SSS, DIC, and TA, the thermodynamic effect of this cooling was a nearly 0.1 increase in pH (CO2SYS), which was on the order of the typical diel range (Fig. 2e, f). While this rapid pH increase (independent of DO) was evident at the low-density site, no such change occurred at the high-density site (Fig. 2f), indicating that biological factors outweighed the thermodynamic effect on pH there.
Across the study period, nTA at the high-density site was always greater than nTA at the low-density site, and nTA was generally higher than nDIC at both sites. Diel cycles were evident in both nDIC and nTA, coinciding with typical variations in net ecosystem production (consuming nDIC) and calcification (consuming nTA). The average slope between nTA and nDIC (ΔnTA:ΔnDIC) was 0.64 and 0.41 for high- and low-density sites, respectively (Fig. 3), indicating that variations in TA and DIC were likely driven by a combination of ecosystem metabolism (expected slope of −0.15 if NO3 is used), calcification (slope of 2), and reduction (slope of 1) and denitrification (slope of 0.8), as has been suggested for other types of Florida seagrass (Camp et al., 2016; Challener et al., 2016). However, in this underdetermined case in which all of the aforementioned processes occur, the application of a simple nTA vs. nDIC plot cannot reveal the relative importance of these factors.
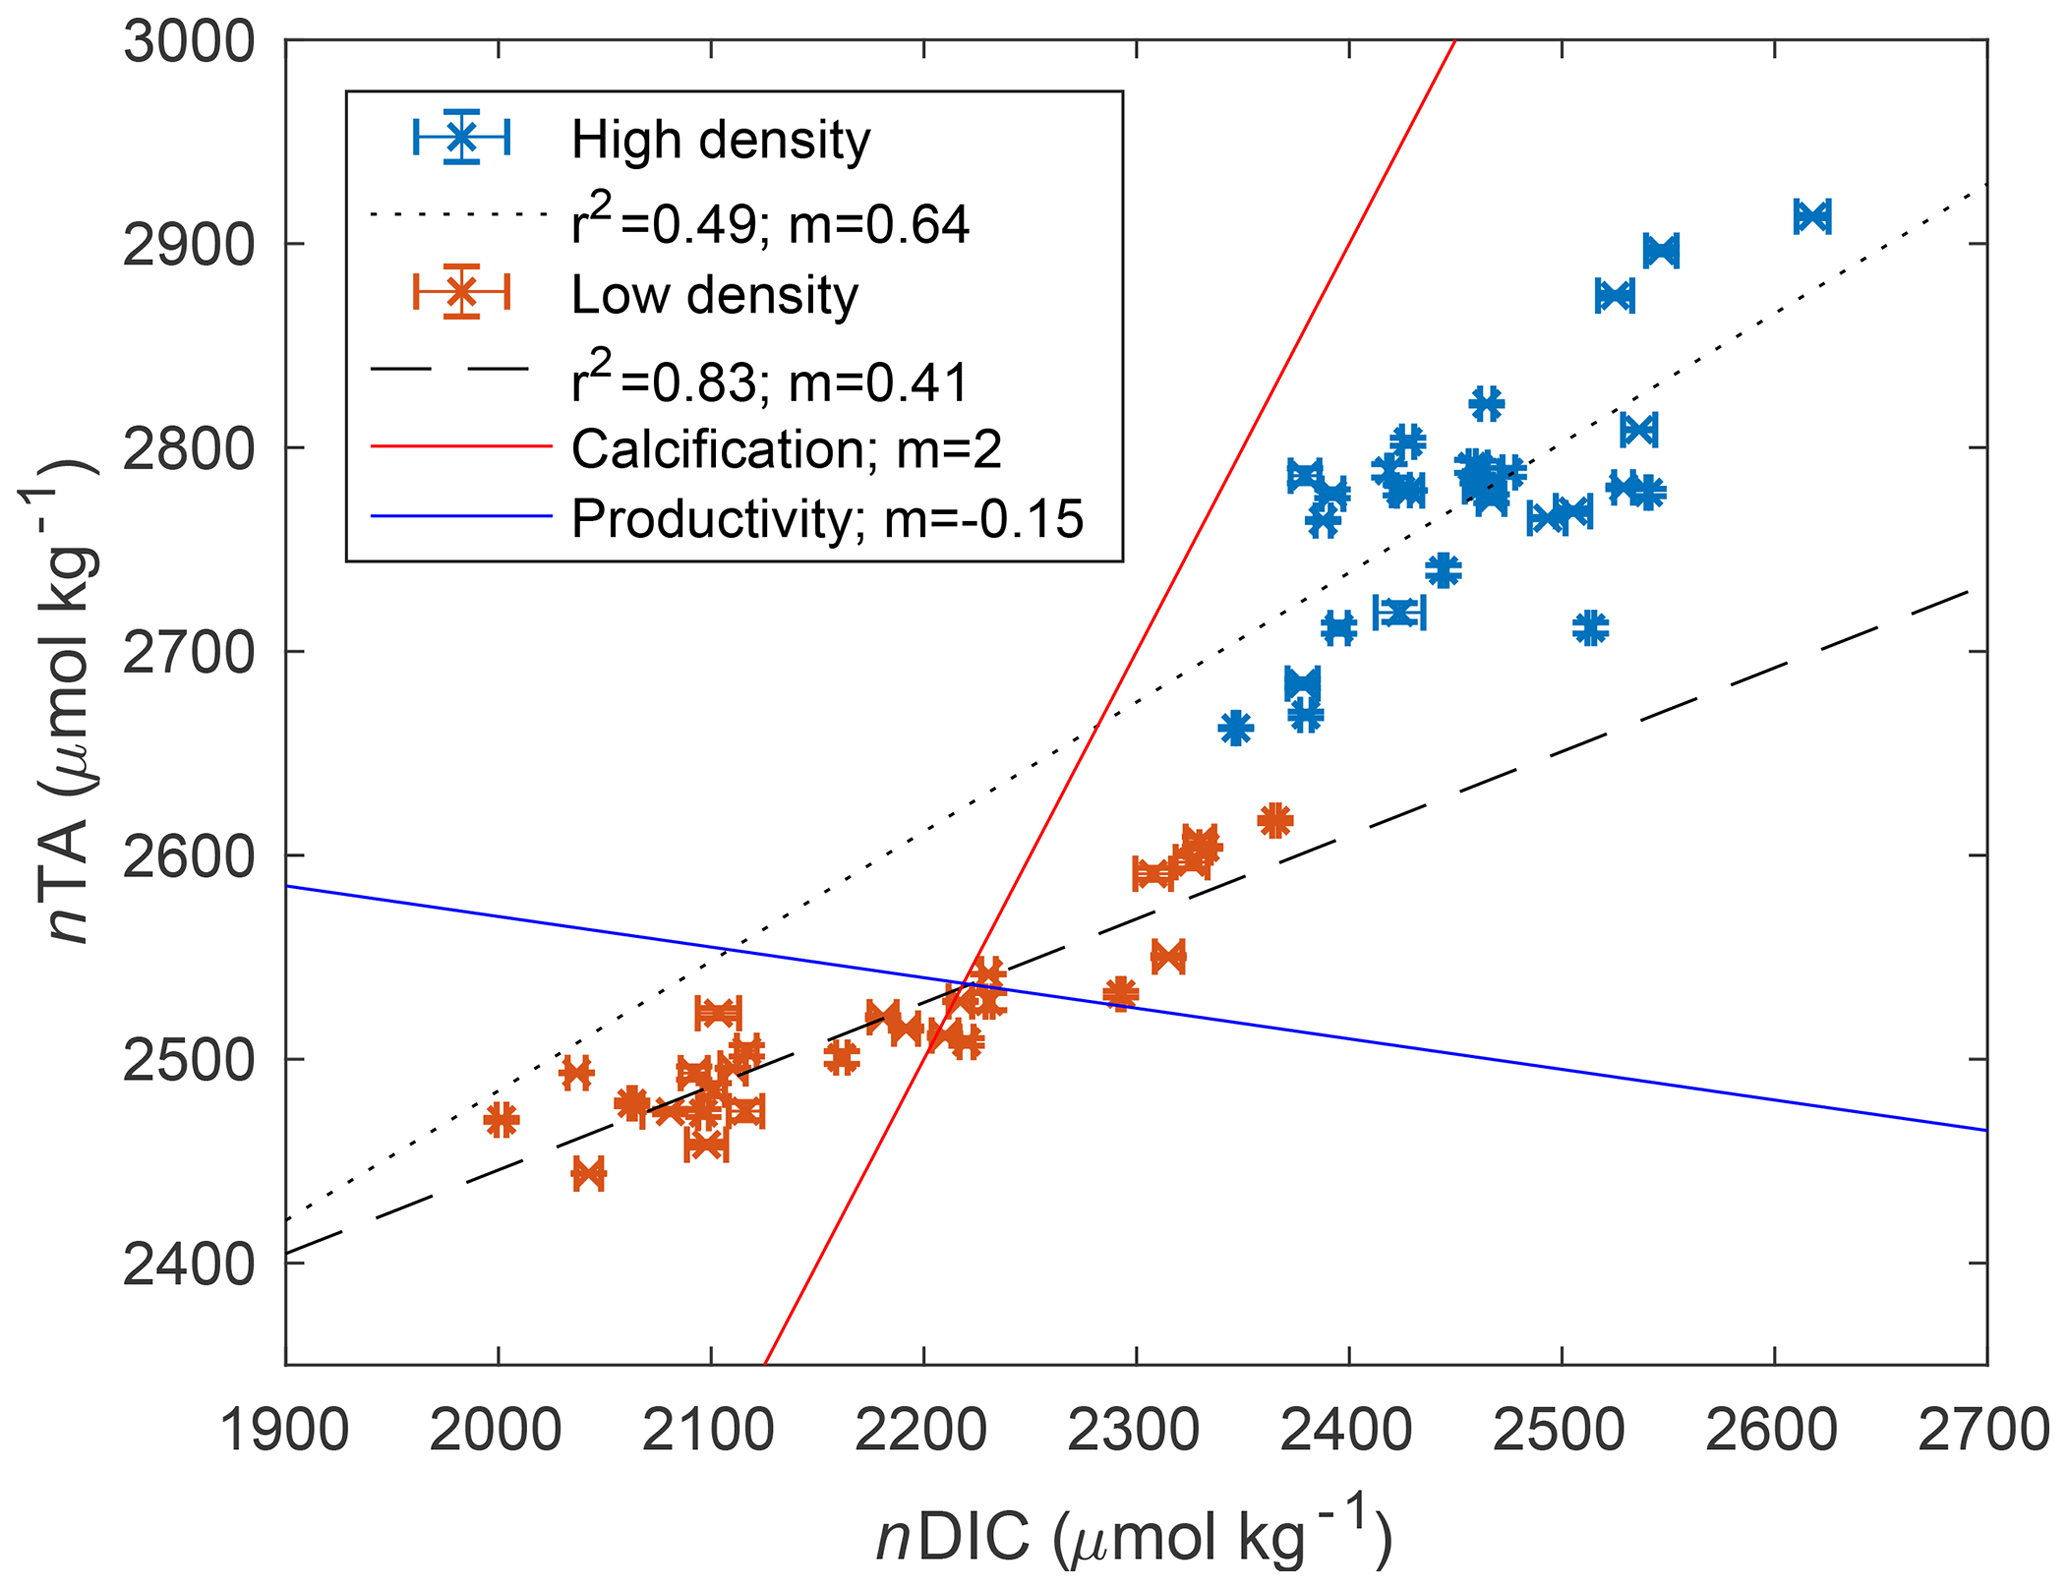
Figure 3Scatter plot of nDIC and nTA for both high-density (blue) and low-density (orange) sites, and associated slope (m) and correlation coefficient (R2) of the linear regression. The red reference line indicates the expected relationship if calcification is dominant, consuming 2 mol of TA for every mole of DIC consumed to form CaCO3. The blue reference line shows the approximate relationship expected for aerobic respiration and productivity, which consumes approximately 0.15 mol of TA for every mole of DIC respired.
3.2 NEP and NEC
At both sites, calculated NEPDO and NEPDIC followed a clear diel pattern, increasing between sunrise and early afternoon and decreasing through sunset (Fig. 4). Nighttime NEPDO and NEPDIC were nearly always negative (heterotrophic), while daytime values were larger and more variable, often exceeding ∼15–20 in the late morning. Individual measurements of NEPDIC for the low-density site (−14.5 to 29.2 ) and high-density site (−36.2 to 21.4 ) were very large compared with seagrass above-ground primary productivity, which was between 1.5 and 2 at both sites (Table 1). While NEC was also strongly negative (dissolving) at night, it was highly variable during the day, with no clear trend between sunrise and sunset (Fig. 4). It is important to note that this approach does not account for any TA production by net reduction and denitrification, and any such TA inputs may bias these estimates of NEC. However, our NEC estimates are at least an order of magnitude larger than typical published measurements of seagrass reduction (Holmer et al., 2003; Brodersen et al., 2019) and denitrification (Welsh et al., 2001) rates, suggesting that our NEC determinations were indeed largely driven by CaCO3 precipitation and dissolution. Still, other studies have found relatively high rates of reduction in seagrass sediments (Hines and Lyons, 2007), especially those with high seagrass shoot density (Holmer and Nielsen, 1997), so we express caution in the interpretation of our NEC results.
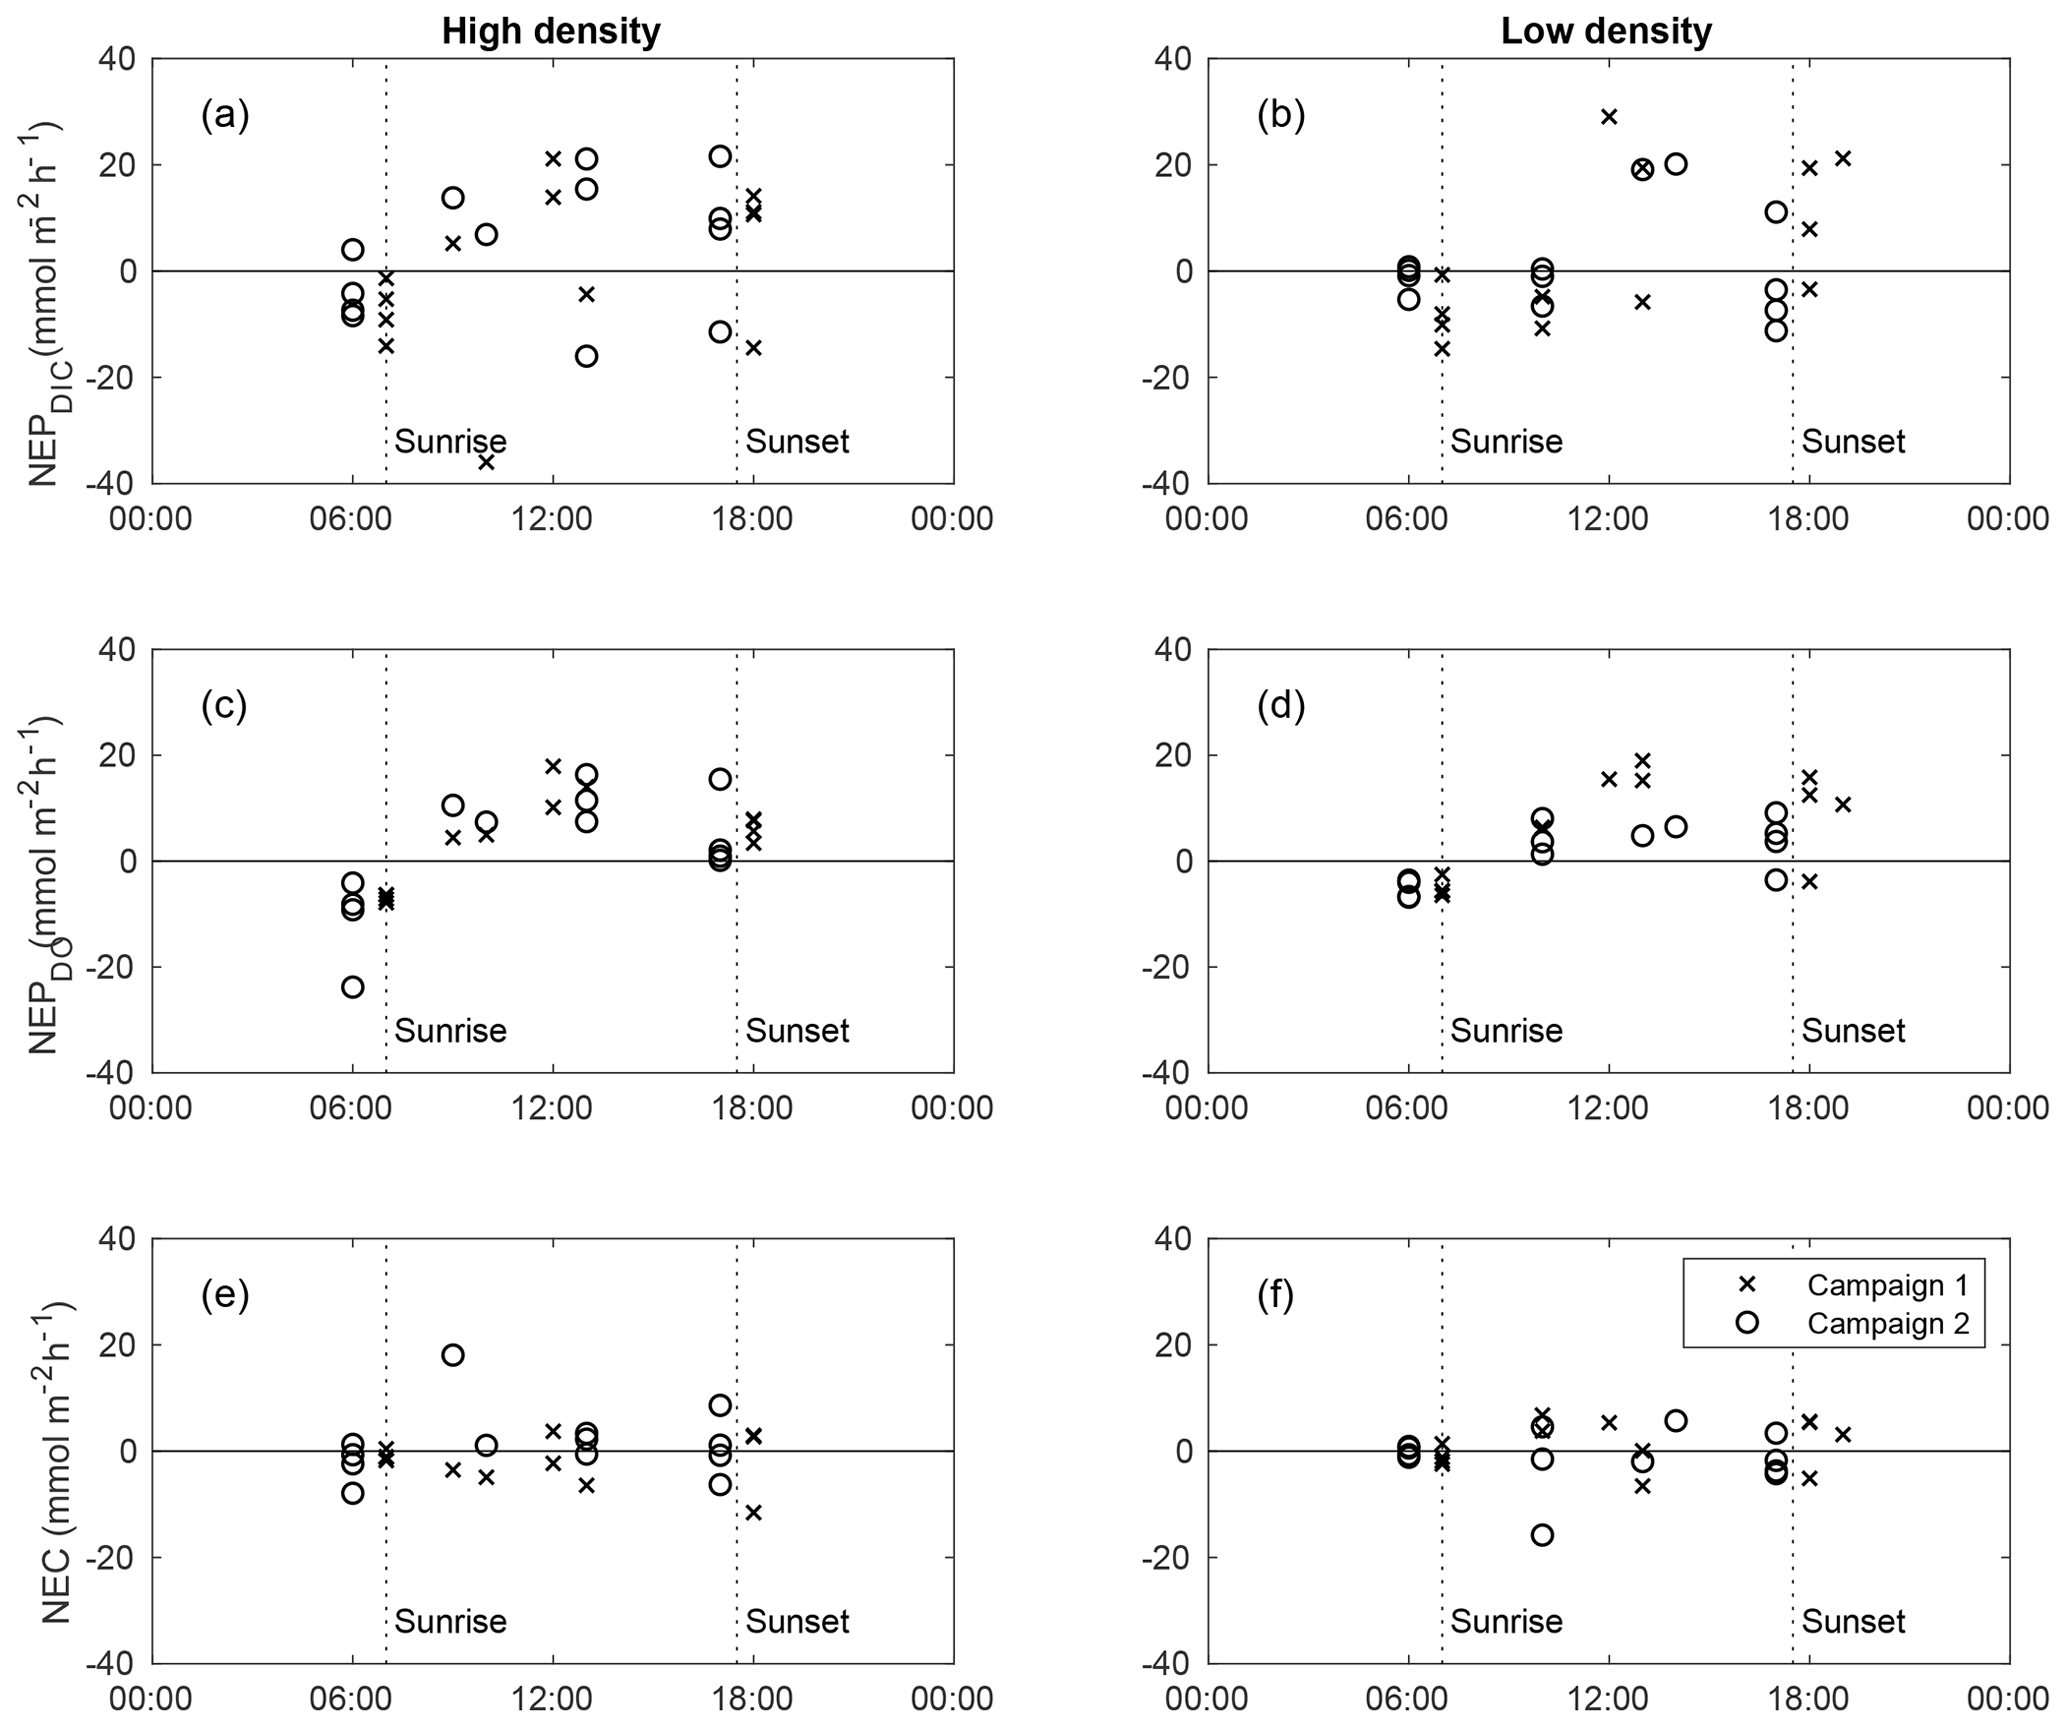
Figure 4Diel trends in NEPDIC (a–b), NEPDO (c–d), and NEC (e–f) for the high-density site (left panels) and low-density site (right panels) for sampling campaign 1 (crosses) and 2 (circles). The x axis represents the midpoint time for each NEP or NEC calculation period.
As discussed previously, the combination of advection with spatial concentration gradients can generate an error in calculated metabolic rates by breaking the assumptions required in the open-water approach. When NEPDIC or NEC was large, our estimated uncertainty due to this mixing effect was relatively low (Fig. 5). However, when metabolic rates were close to zero, the effect of advection became quite large and potentially problematic. The average uncertainty in NEC due to advection ( was 2.4 and 2.9 for the low- and high-density sites, respectively. This corresponds to 65 % and 76 % of average NEC. Likewise, this mixing error could account for 4.7 and 5.8 , or ∼50 % of average NEPDIC. While this effect was at times large for both NEPDIC and NEC, it was quite small for NEPDO due to the small spatial gradients in the DO present between our two primary sites. The uncertainty in NEPDO due to advection was 0.28 and 0.34 , or 4.0 % and 4.2 % of average rates at the low- and high-density sites, respectively.
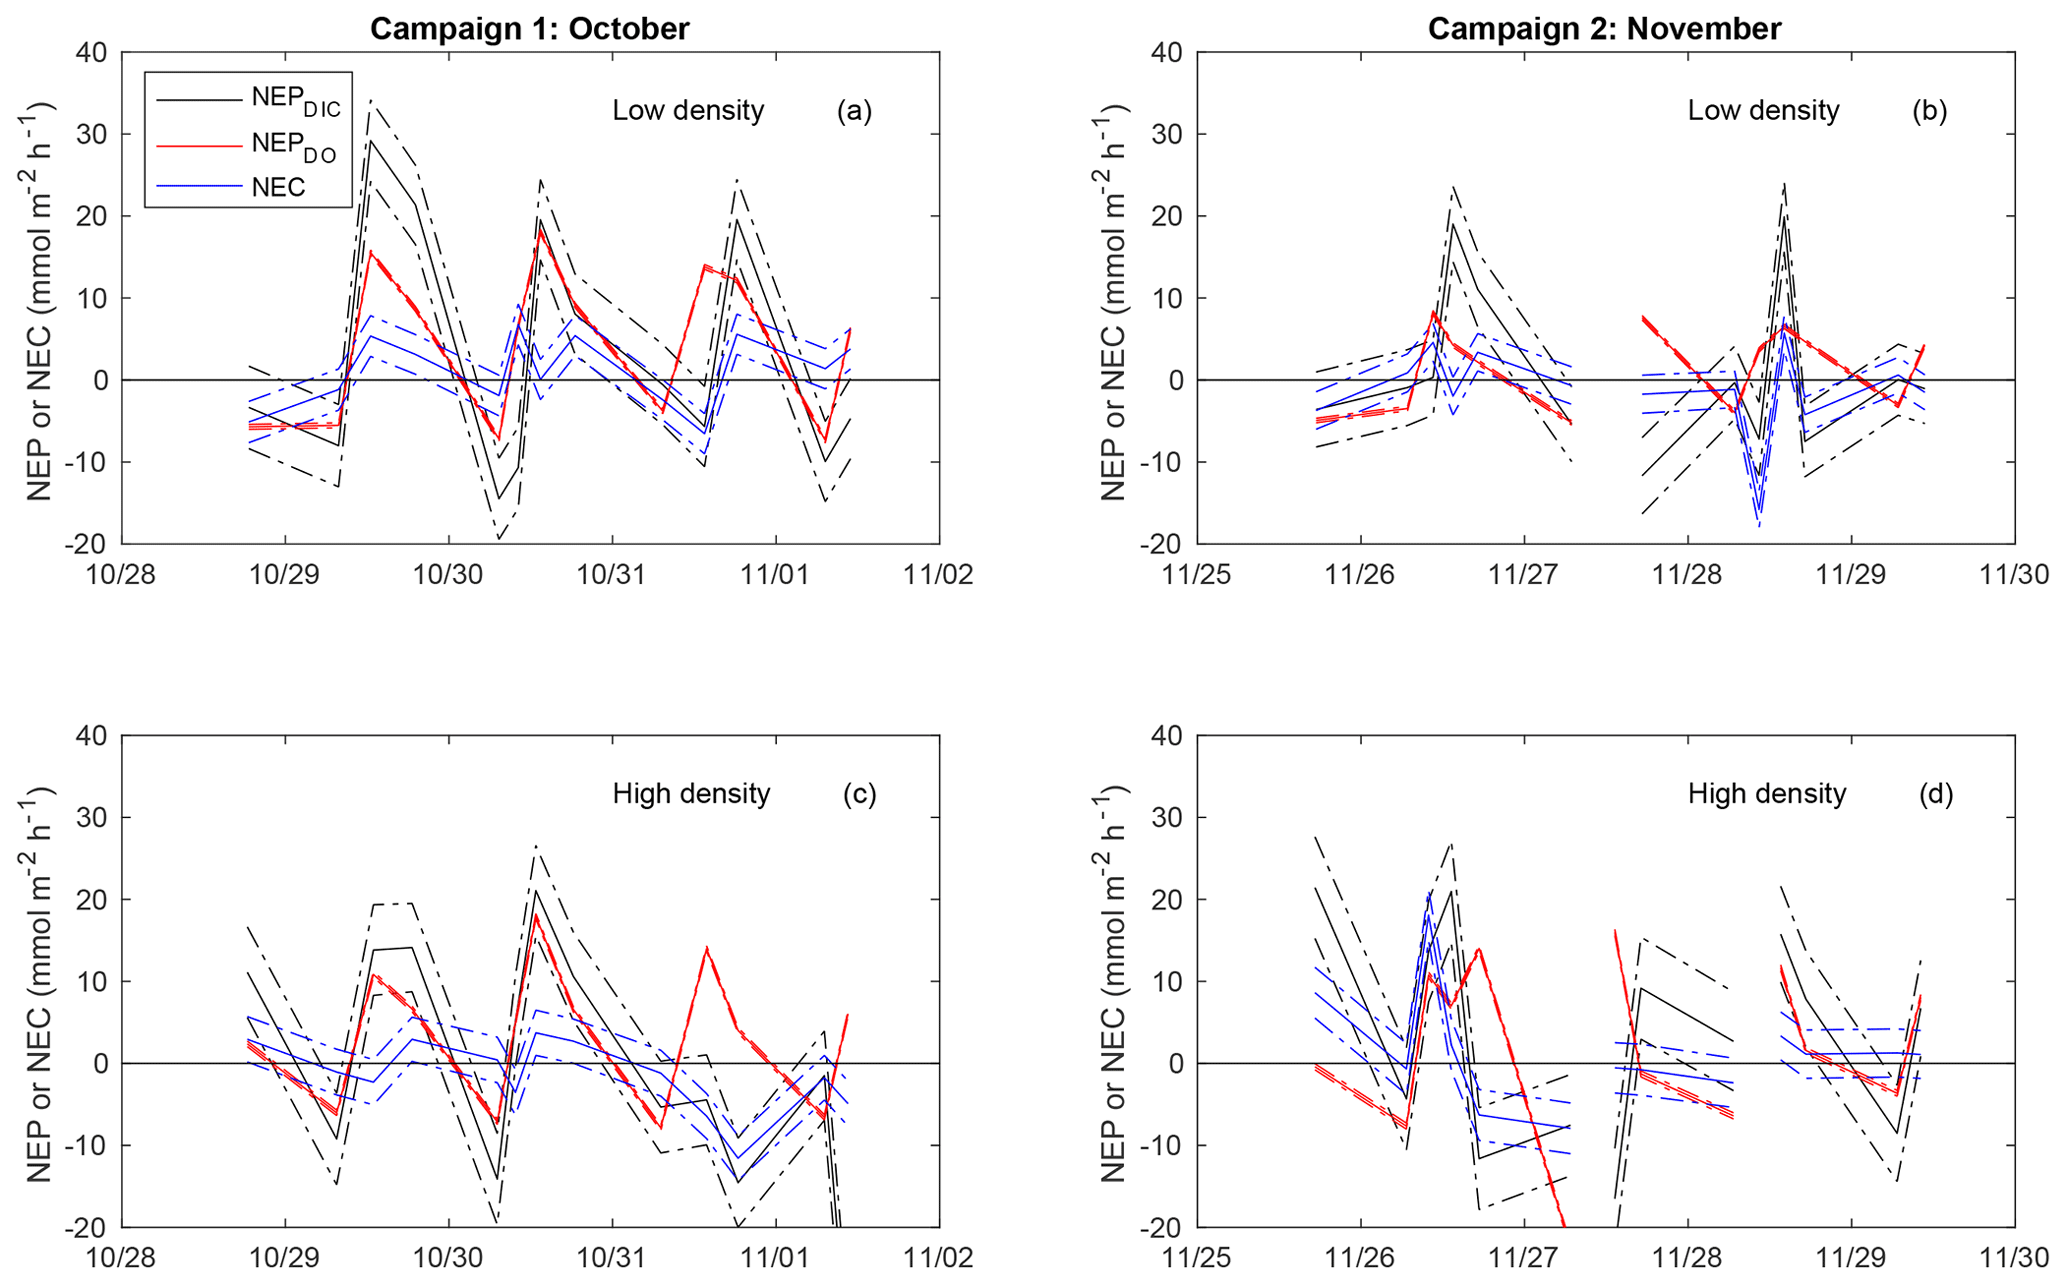
Figure 5Time-series plot of NEC (blue), NEPDIC (black), and NEPDO (red), including the upper and lower uncertainty bounds related to error due to advection (dashed lines).
When discrete NEP and NEC rates were integrated over cumulative day and night hours, diel trends became more recognizable (Fig. 6a–b). NEPDIC and NEPDO were positive during the day (net autotrophic) and negative (net heterotrophic) at night for both sites. While the impact of advective exchanges on the uncertainty of metabolic calculations was minor for NEPDO, it was relatively important for NEPDIC. While mean daytime NEPDIC was positive at both sites, the estimated lower bounds for daytime NEPDIC were slightly negative, at −0.03 and −1.1 for the low- and high-density sites, respectively. This is partially due to the act of binning metabolic values by “day” and “night”, which combines early morning and afternoon rates with midday peaks in NEP and NEC. Metabolic rates did not (and should not) exhibit a stepwise change during sunrise and sunset, but data from these time periods were combined with midday peaks in NEP and NEC in Fig. 4. In other words, temporally integrating by day and night over a sinusoidal diel signal will always have the effect of decreasing the absolute magnitude of average metabolic rates for daytime and nighttime periods. However, we emphasize that this simple uncertainty analysis gives us ample reason to be cautious when interpreting metabolic rates derived from open-water approaches in coastal waters. Nevertheless, both mean nighttime NEPDIC and its upper and lower bounds were negative, giving strong evidence that these sites were indeed net heterotrophic at night (Fig. 6a) and net heterotrophic over the study period (Fig. 6b).
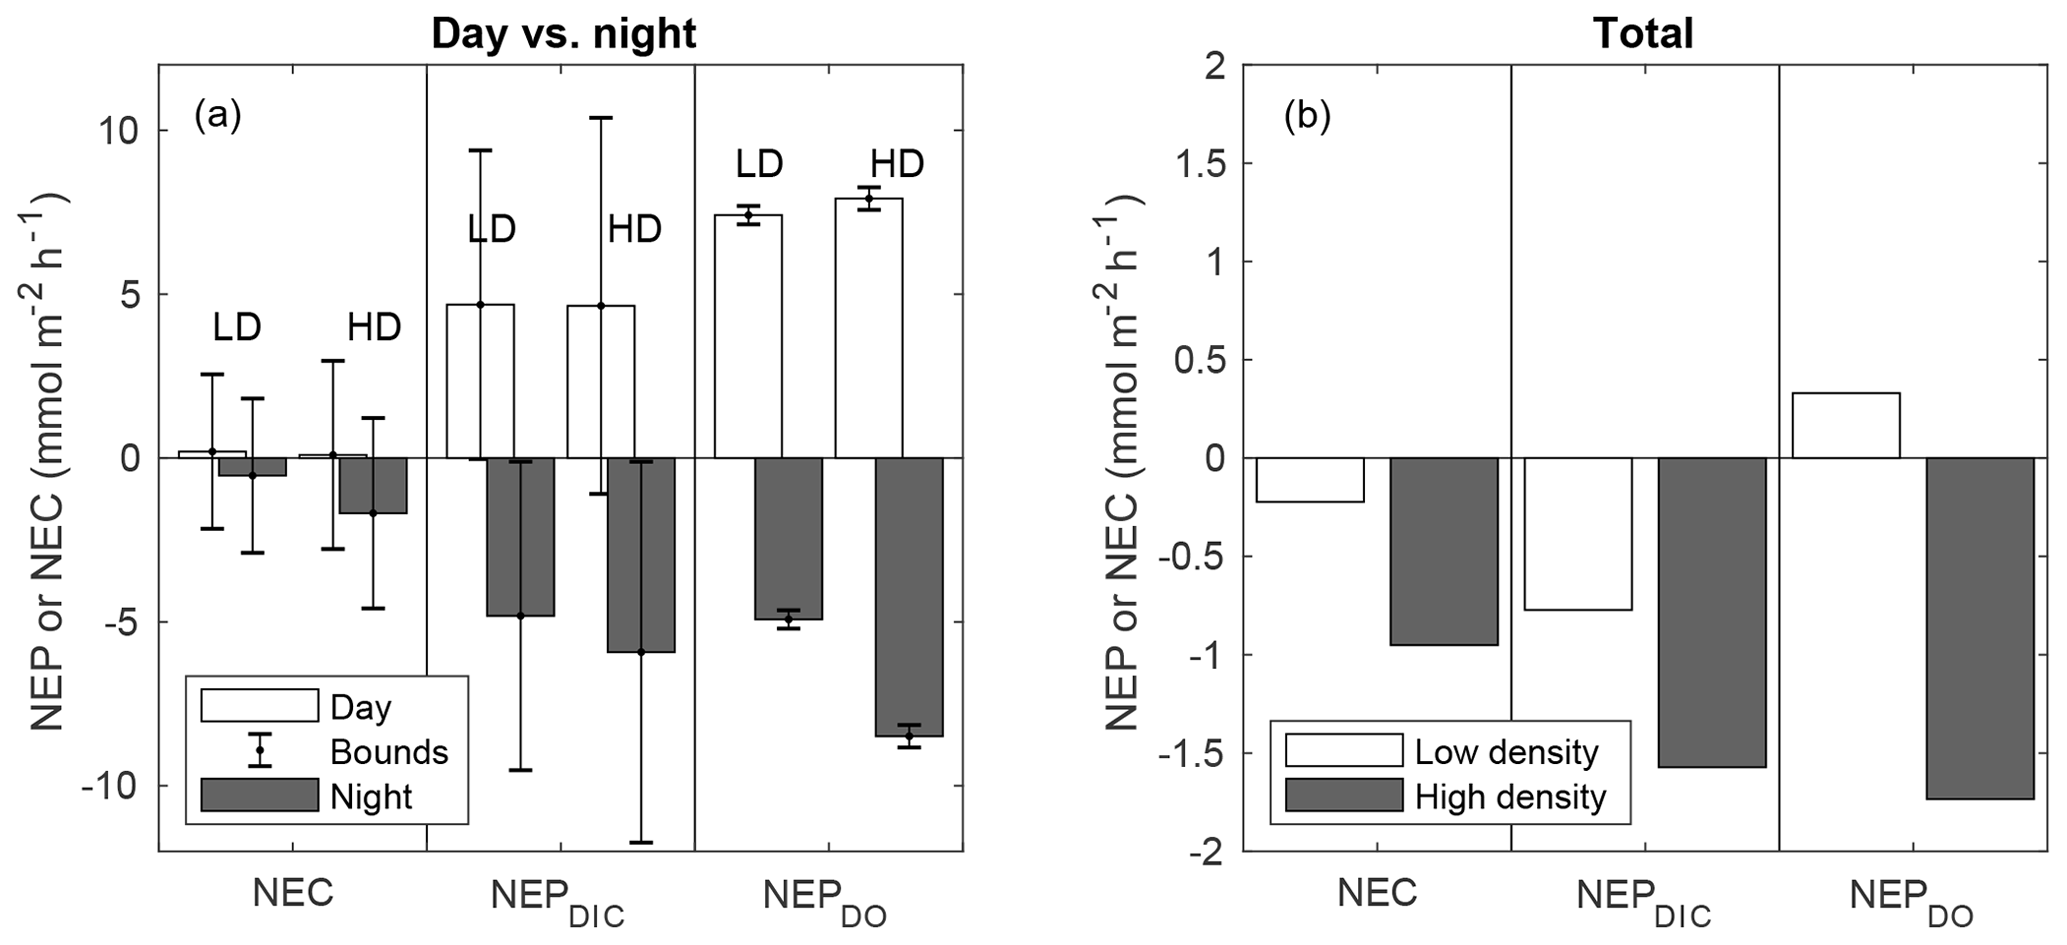
Figure 6NEC, NEPDIC, and NEPDO integrated over daytime and nighttime periods (a) and over the entire study period (b). NEP values are shown for k600 of Ho et al. (2006). The error bars in panel (a) represent upper and lower bounds for metabolic rates determined in Sect. 2.8.
While the advective uncertainty term for NEC calculations was similar in size to that for NEPDIC, rates of NEC were typically lower than NEPDIC, causing upper and lower uncertainty bounds for day and night integrated NEC to contain zero (Fig. 6a). This was due to the obscuring effect of integrating over daytime and nighttime periods as well as the choice of a highly conservative estimate of water velocity (1 cm s−1) in this uncertainty analysis. The presence of larger spatial concentration gradients, faster currents, or greater water depth could all cause this uncertainty term to increase in relation to metabolic rates. Nevertheless, in this study, NEC was more consistently negative (net dissolving) at night (Fig. 6a), causing cumulative NEC to be less than zero (Fig. 6b). This nighttime dissolution was slightly greater at the high-density site than the low-density site. Given the relative paucity of positive NEC estimates across the study period (Fig. 4) and the clear signal of negative NEC during the night, it is likely that net dissolving conditions were more frequent than net calcifying conditions. Therefore, we have confidence that over the full study period, both sites were net dissolving (negative NEC), as depicted in Fig. 6b. Average NEC was less than NEPDIC such that the NEC:NEPDIC ratio was 0.54 and 0.31 for the high- and low-density sites, respectively – well within the range of tropical seagrass ecosystems globally (Camp et al., 2016) and locally (Turk et al., 2015).
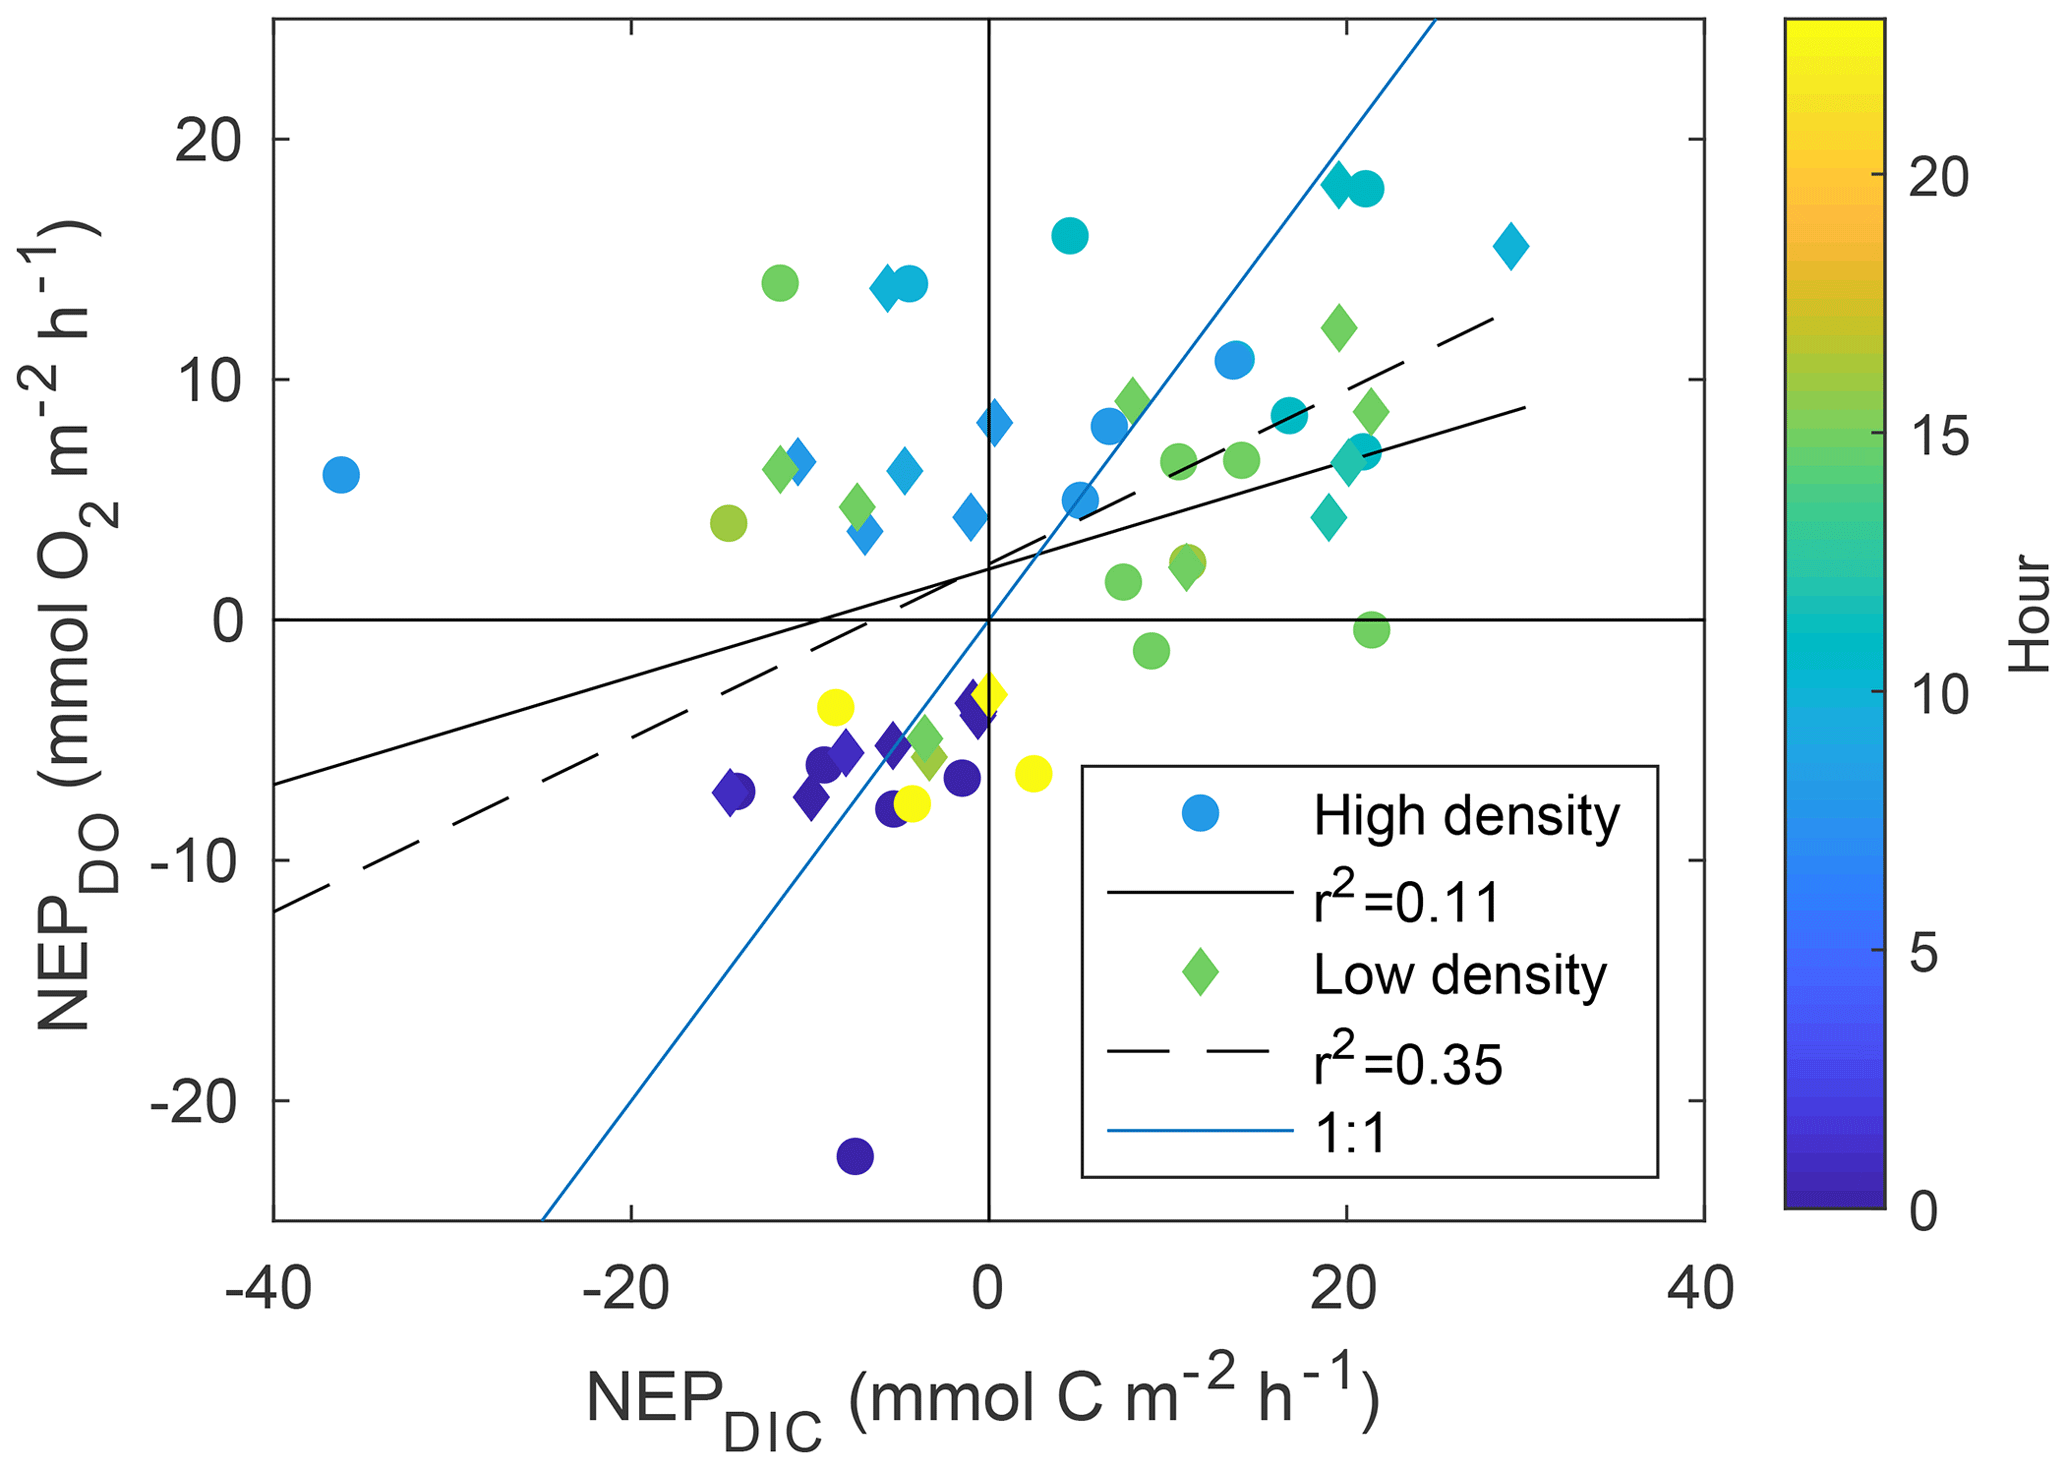
While NEPDIC and NEC were likely negative (heterotrophic and dissolving) at both sites over the entire study period (Fig. 6b), NEPDO was small and positive at the low-density site and negative at the high-density site. This difference between NEPDO and NEPDIC was still prominent when values were split by day and night. Although NEPDIC and NEPDO agreed in direction, NEPDO was greater in magnitude than NEPDIC for all time periods except at night for the low-density site (Fig. 5a). In fact, the linear relationship between NEPDO and NEPDIC in this study was not significantly different from zero for the high-density site (p=0.095; r2=0.11) and was significant but weak (p=0.001; R2=0.35) for the low-density seagrass site (Fig. 8). While NEPDO and NEPDIC agreed in sign at night (dark blue points in Fig. 8), there was no such relationship for daytime NEPDO and NEPDIC. Correlations between net ecosystem processes and PAR were not strong (R2<0.5) for NEPDIC and NEPDO and were very weak (R2<0.05) for NEC (Fig. 7a–c).
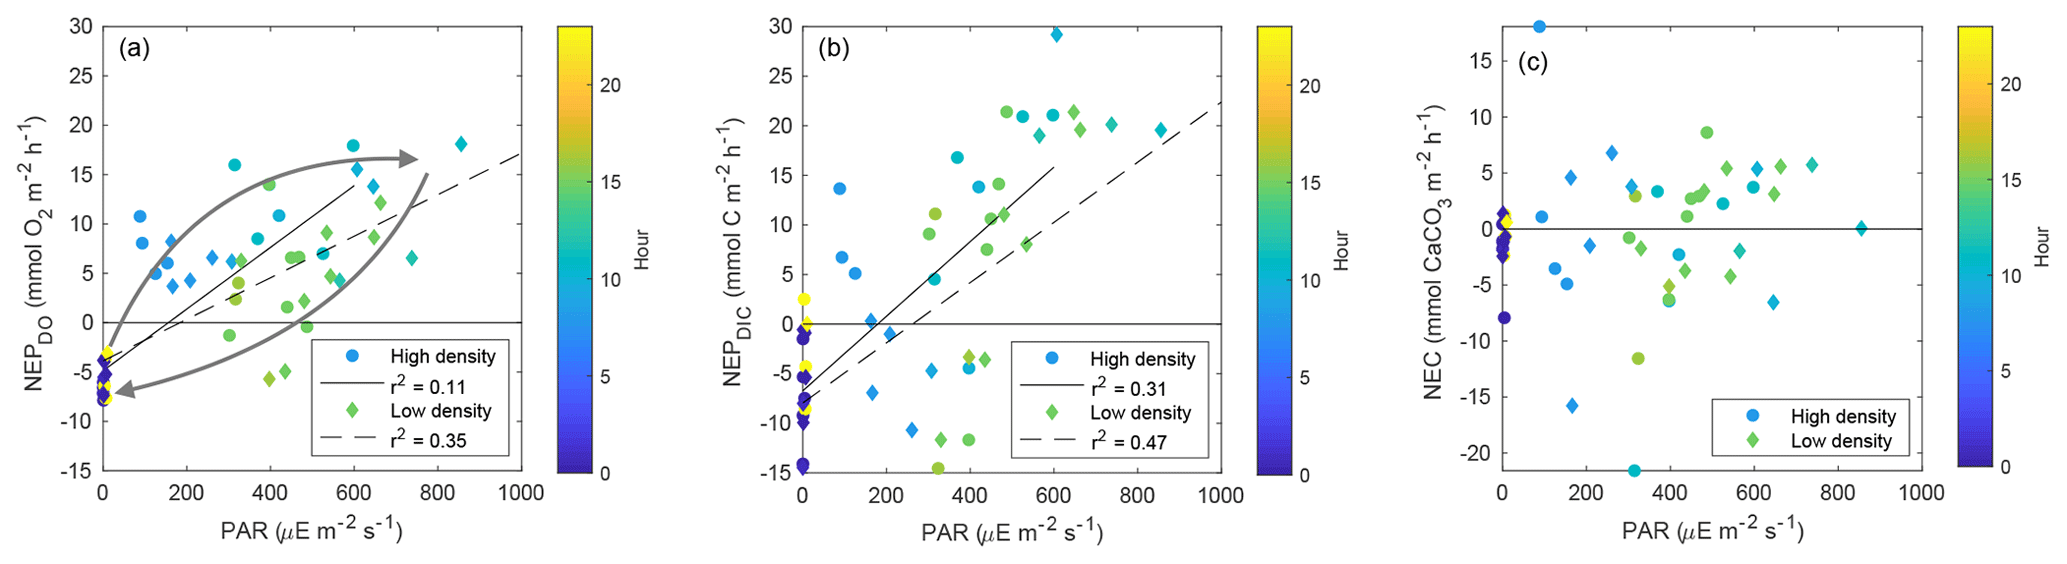
Figure 7Scatter plots of (a) NEPDO vs. PAR, NEPDIC, and NEC vs. PAR (b–c). Points are colored by the average hour for the respective time period over which NEP or NEC was calculated. The arrows in (a) are intended to highlight the hysteretic pattern between PAR and NEPDO.
To address whether this disconnect between NEPDO and NEPDIC exists outside of the two primary sites (Fig. 9; high- and low-density sites), we assembled pH and DO data from four additional sites across Florida Bay (Fig. 9: SB, BA, DK, and LM). Even though Δ[H+] and ΔDO were correlated at our primary sites and one of the four LTER sites (LM), correlations were poor (R2<0.25) at the remaining LTER sites. The LM site is heavily influenced by terrestrial inputs from the coastal Everglades and fringing mangroves, which likely contributed to the significant relationship between Δ[H+] and ΔDO there (R2=0.48).
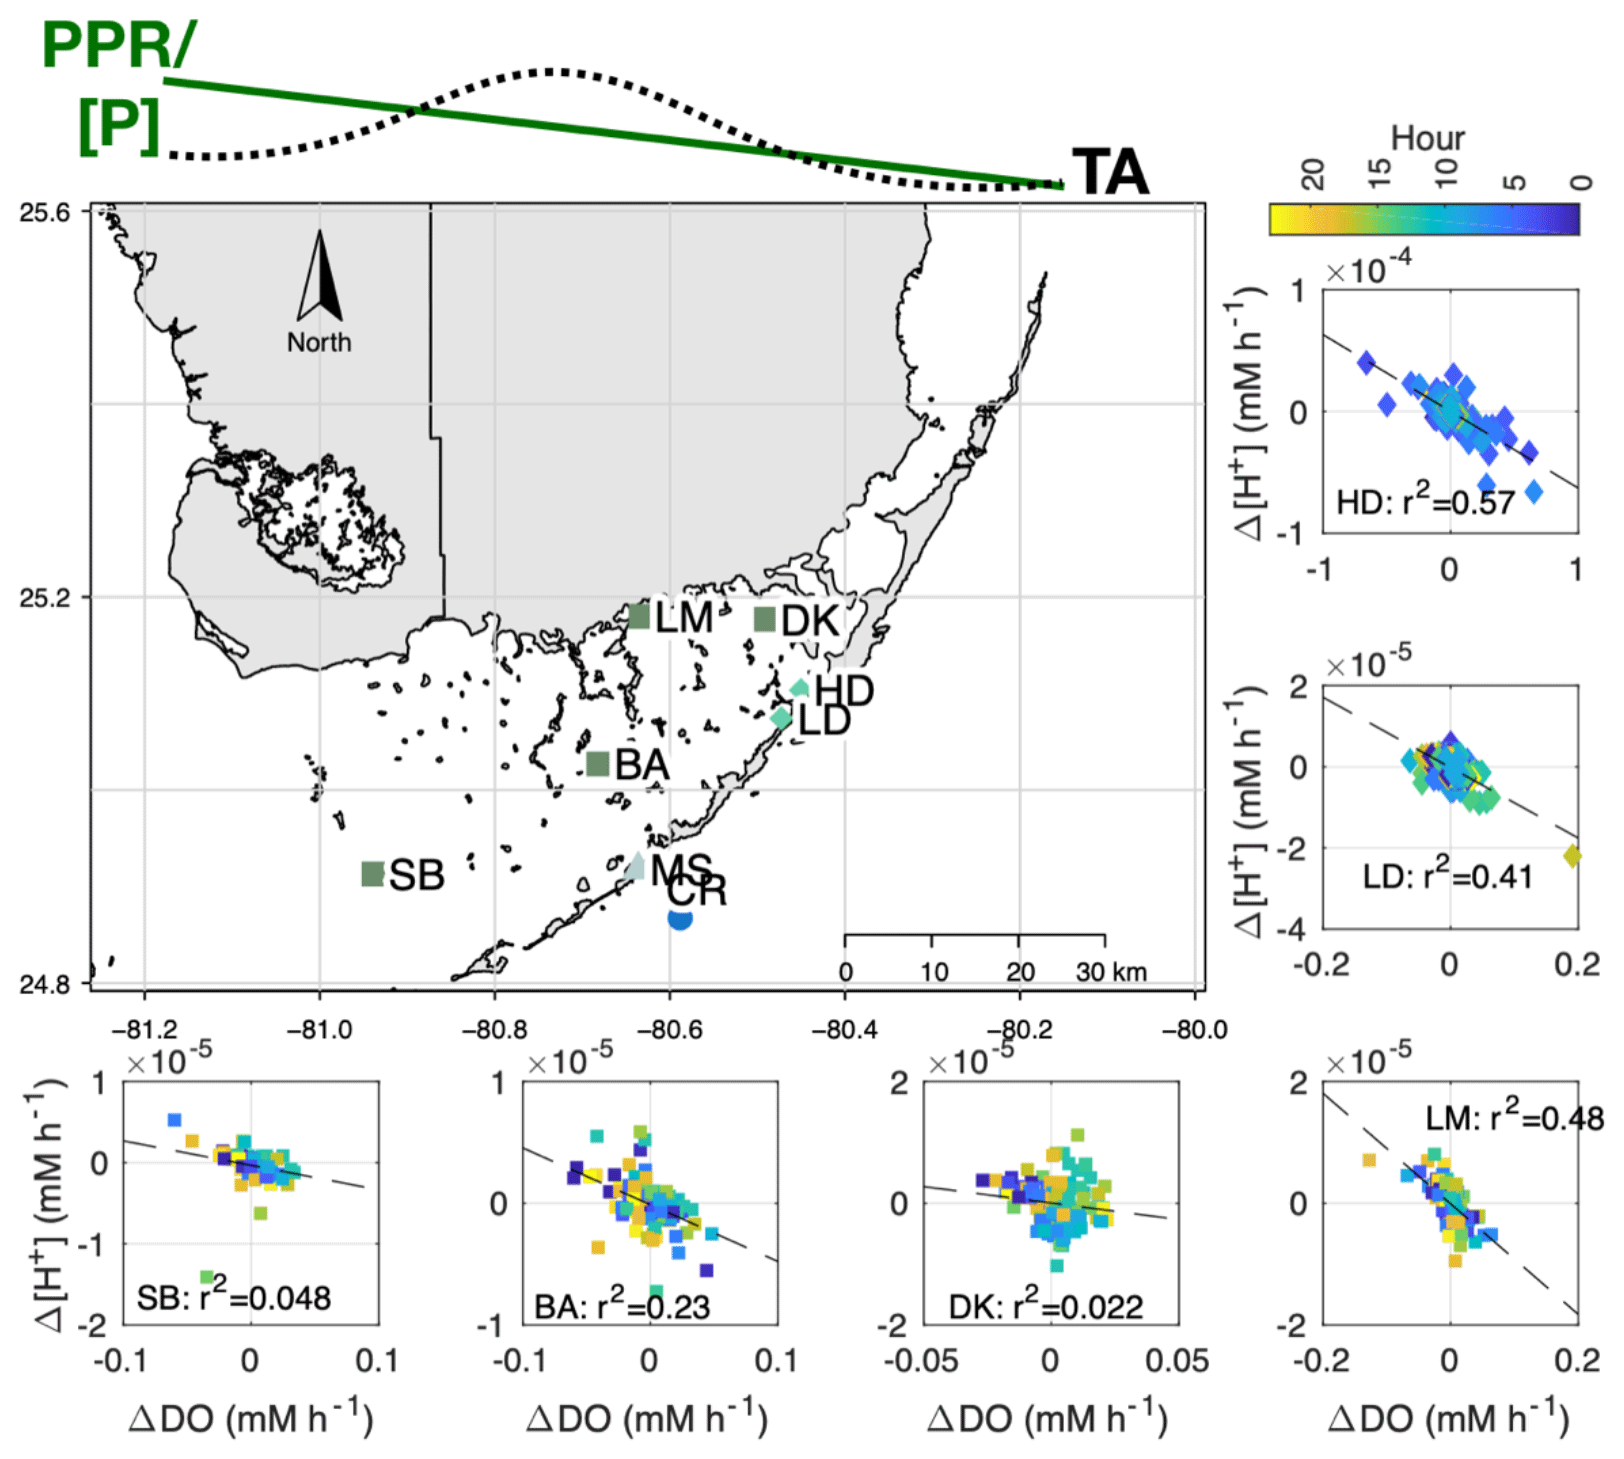
Figure 9Map showing Δ[H+] vs. ΔDO relationship for sites associated with LTER (SB, BA, DK, and LM) and the present study (high density – HD – and low density – LD). At the top of the figure, we present the general east-to-west pattern in seagrass primary productivity (PPR), phosphorus content ([P]; Fourqurean et al., 1992), and TA (Millero et al., 2001) within Florida Bay. All LTER sites failed to meet the assumptions for a test of slope significance (gvlma package in R), so we simply report the R2.
3.3 δ13CDIC and benthic flux of TA and DIC
While both sites were net dissolving (negative NEC) over the study period (Fig. 6b), the calculated calcite saturation state (Ωcalcite, CO2SYS) was relatively high, at 5.83±0.84 and 6.23±1.15 at the high- and low-density sites, respectively (Table 1), indicating that dissolution of carbonates in the sediments was contributing to water column DIC. The uncertainty of this Ωcalcite calculation was ±0.30, or approximately 5 % of the average value. The Keeling plot indicated that source δ13CDIC values were and ‰ (95 % confidence interval) for the high- and low-density sites, respectively (Fig. 10).
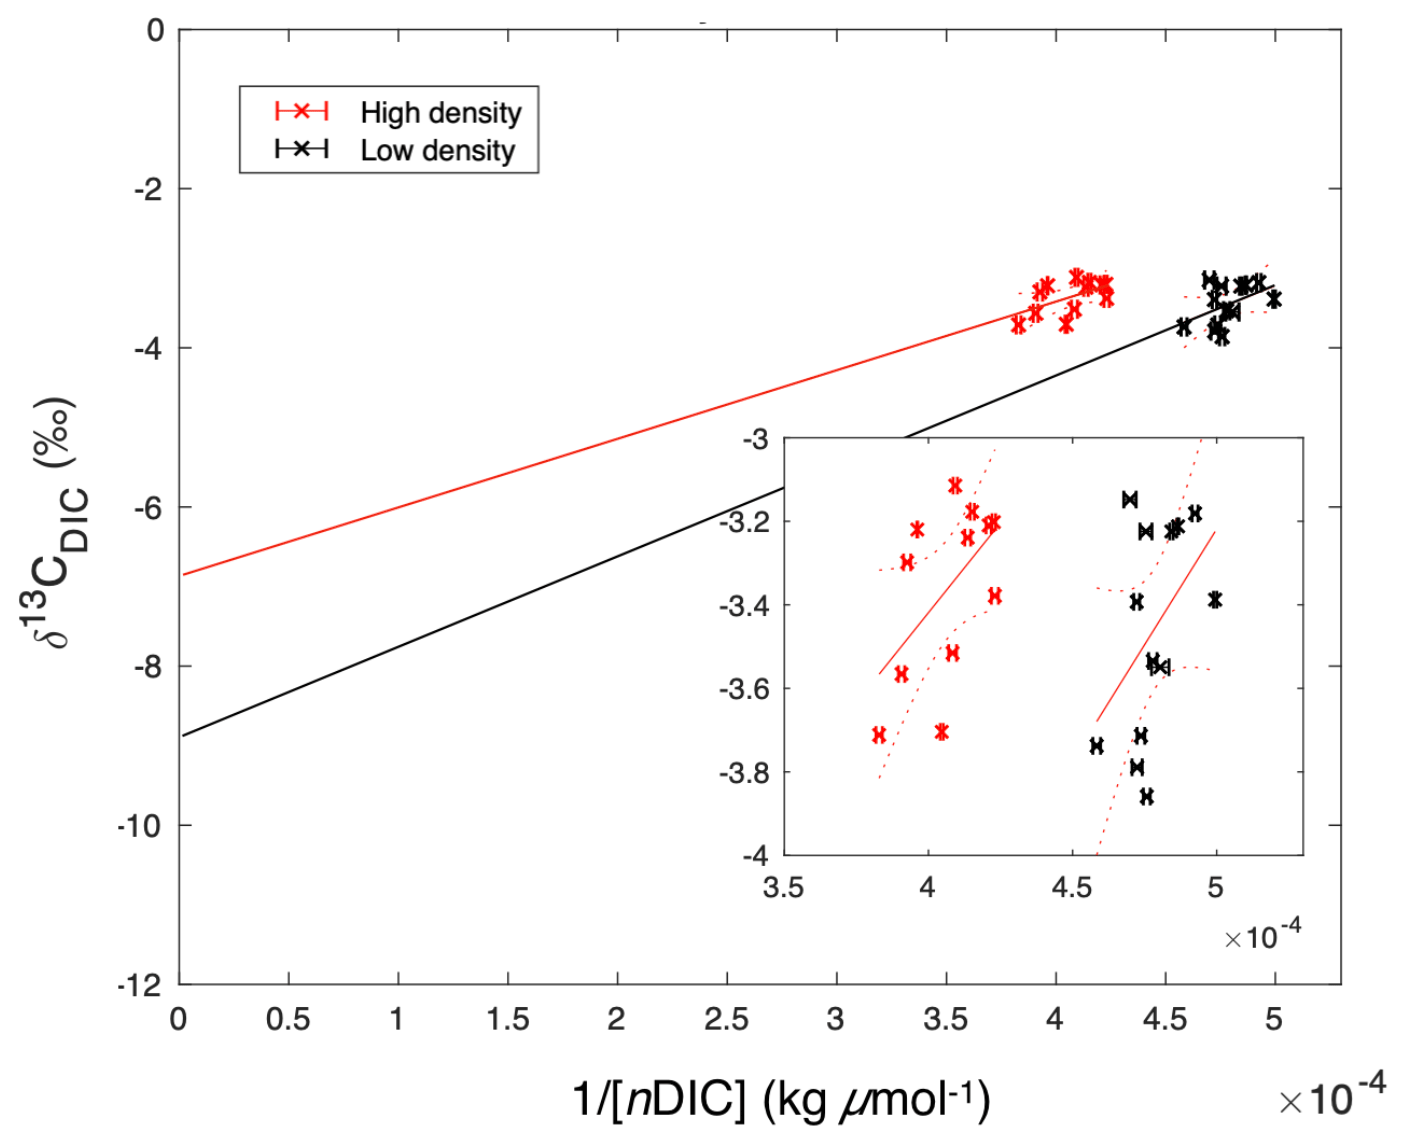
Figure 10Keeling plot of 1∕[nDIC] versus δ13CDIC, suggesting potential endmember isotopic values. These y intercept δ13CDIC values were and ‰ (95 % confidence interval) for the high- and low-density sites, respectively. The inset figure is zoomed to the extent of collected data, while the large figure is scaled to demonstrate the extrapolation required in order to extend the data to the y intercept.
Benthic chamber flux experiments (over bare sediment) during the second sampling campaign yielded average benthic DIC fluxes of 0.76±0.7 and 1.26±0.8 at the low- and high-density sites, respectively. These benthic DIC fluxes could explain 109 % () of the average NEPDIC at the low-density site and 79 % () at the high-density site. Benthic TA fluxes were 0.24±0.16 at the low-density site but were highly variable and not significantly different from zero at the high-density site (0.16±0.4 ). Benthic TA flux could explain 120 % () of cumulative NEC at the low-density site but only 18 % () at the high-density site.
4.1 Drivers of NEP
Individual measurements of NEPDIC for the low-density site (−14.5 to 29.2 ) and high-density site (−36.2 to 21.4 ) were within the range of some previous studies, including the NEPDO of Turk et al. (2015; to 12.3±1.0 ), Perez et al. (2018; ∼23.8 ), and Long et al. (2015a; 0.45–1.46 ). Over the entire study period, however, cumulative NEPDIC was negative at both sites (Fig. 6b), indicating that heterotrophic conditions dominated in both seagrass meadows during these two sampling campaigns. CO2 fluxes were positive at both sites, indicating a net release of CO2 from the water to the atmosphere (Table 1). Seagrass above-ground primary productivity rates were between 1.5 and 2 at both sites (Table 1), approximately 3 orders of magnitude lower, and opposite in sign, than the measured NEPDIC. This large difference provides further evidence that seagrass above-ground primary productivity is only a component of net ecosystem productivity, which was likely dominated by sediment processes (including seagrass belowground productivity, which was not measured during this study) and epiphytic primary productivity. We found a clear disagreement between daytime NEPDO and NEPDIC such that the linear relationship between NEPDO and NEPDIC was not significantly different from zero for the high-density site (p=0.095; R2=0.11) and was significant but very weak (p=0.001; R2=0.35) for the low-density site (Fig. 8). Such a disagreement between NEPDO and NEPDIC has been observed recently in coral ecosystems (Perez et al., 2018). This discrepancy between NEPDO and NEPDIC may be related to the thermodynamics of CO2 and O2 dissolution, as the solubility of O2 is much less than that of CO2 (Weiss, 1970, 1974). Any O2 produced or consumed by NEP will rapidly exchange with the atmosphere, while most of the CO2 generated by NEP will enter the carbonate buffering system and persist as or ions rather than exchangeable CO2. The standard deviation of O2 fluxes was much larger than that of CO2 fluxes, in part due to this effect. Furthermore, as the total pool of O2 in the water column is far less than the total pool of CO2 (i.e. DIC), the determination of NEPDO is more sensitive to the parameterization of gas transfer than NEPDIC. This is highlighted in Fig. S1 in the Supplement, where the difference between the two k600 parameterizations is much larger for NEPDO than for NEPDIC.
Further explanations for this discrepancy between NEPDO and NEPDIC can be related to differing responses of DO and DIC to variations in light availability. When PAR was plotted against NEPDO, a clear pattern of hysteresis arose, with higher NEPDO values during the morning hours than the afternoon at the same PAR intensity (shown by the arrows in Fig. 7a). Such a hysteretic pattern indicates that the response of NEPDO to light is not uniform and that photosynthetic efficiency may vary with factors such as nutrient availability, history of carbon acquisition (carbon-concentrating mechanisms), or temperature. Such a hysteretic pattern has been observed between PAR and NEC, but not for NEP, for a coral reef (Cyronak et al., 2013). This has important implications for the modeling of carbon processing in seagrass meadows, which generally assume a time-invariant relationship between light and photosynthesis (Zimmerman et al., 2015; Koweek et al., 2018).
4.2 Drivers of NEC
We found no relationship between PAR and NEC at our study sites, indicating that light-driven calcification by photoautotrophs (algal epiphytes, calcifying macroalgae, and seagrass itself) does not dominate NEC or that carbonate dissolution driven by respiration in the sediments dominated NEC. However, it is possible that the use of carbon-concentrating mechanisms could cause calcification by photoautotrophs to become decoupled from direct irradiance. While not listed in Table 1, we did observe a variety of bivalves and tube-building polychaetes that may have contributed to the high NEC at both sites. Furthermore, while Ωcalcite was always greater than 1, NEC was negative on average over the study period, indicating that the overall ecosystem was net dissolving. This co-occurrence of high Ωcalcite with overall net dissolving conditions (negative NEC) can be reconciled by considering the seagrass ecosystem as a vertically decoupled system, where positive NEC in the water column is more than balanced by carbonate dissolution in the sediments. Such a relationship has been observed or inferred in seagrass elsewhere (Millero, 2001; Burdige and Zimmerman, 2002; Burdige et al., 2010).
Our Keeling plot approach indicated potential endmember δ13CDIC values that lie between the δ13C of seagrass organic matter ( to −10; Fourqurean et al., 2015; Röhr et al., 2018) and sediment inorganic carbon (∼0 ‰; Deines 1980), indicating that both sediment organic matter respiration and carbonate dissolution were sources of DIC. It should be noted that this approach involves the extension of measurements to a theoretical δ13CDIC value at infinite DIC concentration, involving a substantial extrapolation (Fig. 10). Furthermore, this isotopic analysis implicitly assumes a closed system, which clearly is not the case in Florida Bay.
From these lines of evidence, we infer that organic carbon (OC) remineralization in sediments, combined with carbonate dissolution, contributed to the net upward DIC and TA fluxes from the sediments, which appear to have driven the observed negative NEP (heterotrophy) and NEC (dissolution), respectively. Such net heterotrophy must be fueled by Corg captured by the system, either from allochthonous sources or from autochthonous sources occurring at some time in the past. This study was conducted at two sites with relatively deep water during autumn, with relatively low light levels and short days, so it is quite possible that there could be a different net annual signal when the bright summer months are included, highlighting the need for annually resolved measurements. However, the results of our benthic flux experiments support the isotopic evidence for the role of sediment OM remineralization in NEP and NEC at these sites. When expressed as aerial fluxes, sediment-water DIC exchange was 79 % and 109 % of average NEPDIC at the high- and low-density sites, respectively. Likewise, benthic TA flux was 18 %–120 % of cumulative NEC. Together, these benthic flux measurements, along with isotopic evidence, support the role of sediment biogeochemical cycling in the overall carbon budget at these sites. Prior studies have shown high rates of denitrification (Eyre and Ferguson, 2002) and reduction (Hines and Lyons, 2007; Holmer et al., 2001; Smith et al., 2004) in seagrass soils, so it seems quite possible that these processes contributed to much of the inferred net ecosystem heterotrophy here. The extent to which these anaerobic TA-generating processes also affect our NEC estimates is largely dependent on the fraction of reduced species that are re-oxidized in oxygenated micro-zones within surface sediments. There is a clear need for more research exploring the linkages between sediment early diagenesis and water-column biogeochemistry over seagrass. This is especially important, given the recent attention that seagrass systems have received as potential “buffering” mechanisms for coastal ocean acidification (Manzello et al., 2012; Unsworth et al., 2012; Hendriks et al., 2014; Cyronak et al., 2018; Koweek et al., 2018; Pacella et al., 2018).
However, there is a geologic context for this observed negative NEC in the northeastern region of Florida Bay. Florida Bay is geologically young, having formed during the retreat of the Holocene shoreline following the end of the last major glaciation, approximately 4–5000 years ago (Bosence et al., 1985). The sedimentary deposits that filled in this basin are dominated by calcareous mud formed by extensive Thalassia meadows, and their associated epibionts and macroalgae (Bosence et al., 1985), and these autochthonous sources are sufficient to explain the observed sediment distributions (Stockman et al., 1967). Early work suggests that calcareous sediments in Florida Bay can be separated into distinct zones of calcareous sediment formation, migration, and destruction, the last of which extends across NE Florida Bay, where this study took place (Wanless and Tagett, 1989). A limited sediment supply of ∼0.01 mm yr−1 in this “destructional” zone, compared to the rate of sea level rise, results in the presence of a thin veneer of sediment on the bottoms of the basins and narrow, erosional mudbanks (Stockman et al., 1967). Our primary sites were in this destructional zone, and our finding of negative NEC indicates that at these sites (during the fall season), the destructional nature of this part of the bay may be partly explained by net carbonate dissolution. It is important to note the limited spatial and temporal scope of this study, and we caution that our findings of net negative NEP and NEC are likely not applicable to Florida Bay as a whole or even to these sites across seasons. Indeed, prior studies have shown substantial seasonal and spatial variability in carbonate chemistry (Millero et al., 2001; Zhang and Fischer, 2014) and seagrass primary productivity (Fourqurean et al., 2005).
Lastly, it is clear that sediments below seagrass in Florida Bay have been accumulating autochthonous organic carbon (Corg) and carbonate sediments for over 3000 years (Fourqurean et al., 2012b), suggesting that the ecosystem is producing more organic matter than it is consuming and is storing more carbonates than it is dissolving (Howard et al., 2018). To reconcile our finding of net negative NEP and NEC with the knowledge that this system is a net producer of Corg and CaCO3, we must infer that NEP and NEC are not homogeneous throughout Florida Bay or throughout the year.
4.3 Regional implications and future outlook
Variations in TA and DIC exports affect the carbonate buffering of adjacent ecosystems, further complicating the relationship between NEPDO and NEPDIC. In Fig. 9, we show that correlations between Δ[H+] and ΔDO at the LTER sites were generally poor. This poor fit is partially caused by the existence of the carbonate buffering system, which dampens the magnitude of pH variability, in comparison with the unbuffered nature of DO. However, we maintain that lateral TA transport also affects the relationship between Δ[H+] and ΔDO, given the phosphorus-driven spatial gradient in seagrass primary production in Florida Bay (Zieman et al., 1989; Fourqurean et al., 1992) and the realization that ecosystem production is linked with increased calcification (Frankovich and Zieman, 1994; Enríquez and Schubert, 2014; Perez et al., 2018). In addition, the mangroves that lie upstream of Florida Bay export water high in DIC and TA, and low in DO to Florida Bay (Ho et al., 2017), so that areas immediately affected by this runoff (like LTER site LM) will have a larger range in Δ[H+] and ΔDO. Likewise, we can infer that the relationship between NEPDO and NEPDIC is also altered by spatio-temporal variations in TA, although data are lacking in the present study that conclusively demonstrate this effect. Prior studies have shown that TA varies seasonally (Millero et al., 2001) and over diel cycles (present study; Yates et al., 2007) in response to fluctuations in calcification (Yates and Halley, 2006) and salinity (net water balance), offering some explanation for the poor across-site relationship between ΔDO and Δ[H+]. TA generated by calcite dissolution or anaerobic biogeochemical processes like denitrification and reduction likely play an important, yet currently unknown, role. Anaerobic generation of TA through denitrification or reduction in seagrass soils is an additional source not quantified here but should be addressed in the future. However, we can conclude that the observed lack of a relationship between ΔDO and Δ[H+] holds across the seagrass productivity gradient in Florida Bay, indicating that this discrepancy between NEPDO and NEPDIC may extend across broad regions of the subtropics. This may challenge the application of new in situ approaches that rely on variations in pH and DO alone to infer rates of biogeochemical processes (e.g. Long et al., 2015b).
Our results also suggest that the role of seagrass carbon cycling in larger, regional, or global carbon cycles may be much more complex than originally thought. Modern estimates of carbon uptake by seagrass ecosystems are based largely on measurements of Corg burial rates or changes in standing stock of Corg (Duarte et al., 2005; Fourqurean et al., 2012a, b). While valuable, studies based solely on rates of Corg burial integrate processes over long timescales and may miss the impact of seagrass NEP and NEC on air–water CO2 exchange and lateral CO2(water) and TA export. Indeed, it has been suggested that the dissolution of allochthonous carbonates in seagrass soils is an unrecognized sink of atmospheric CO2 that exports TA to the coastal ocean on scales significant to global CO2 budgets (Saderne et al., 2019). If we are to more accurately constrain the role of seagrass ecosystems in the global carbon cycle, we must begin to consider the net ecosystem carbon balance (NECB), which is the residual carbon produced or consumed after all sources and sinks have been accounted for (Chapin et al., 2006). In aquatic systems, this will involve a precise measurement of the net ecosystem exchange (NEE) of CO2 between the air and water. In the present study, we used a bulk-transfer equation (Eqs. 4 and 5) to estimate NEE, but new technologies such as eddy covariance and improved flux chambers mean that direct measurements of seagrass NEE are on the horizon. The combination of direct NEE measurements with rigorous assessments of NEP and NEC is one promising avenue through which NECB may be approached.
In this study, we present the first direct NEPDIC measurements in a representative seagrass meadow by combining rigorous carbonate system analysis with a diel sampling approach. We found negative NEPDIC and NEC at both sites, indicating that despite typical values of seagrass biomass and productivity (Table 1), both sites were net heterotrophic and net dissolving over the study period. When metabolic rates were low, they were likely affected by error due to the combined effect of advection and spatial concentration gradients, which can break the assumptions required for our open-water approach. On the contrary, this source of uncertainty was less important when metabolic rates were high. While we had some success in applying this open-water approach at these sites, we caution that error due to advection must be considered in sites where water currents are greater or when the water depth is greater. Multiple lines of evidence point to sediment respiration and carbonate dissolution (Fig. 10) as drivers of negative NEP and NEC. While our isotopic and benthic flux measurements were coarse, they support the role of aerobic and anaerobic remineralization (denitrification and reduction; Holmer et al., 2001; Eyre and Ferguson, 2002; Smith et al., 2004) coupled with carbonate dissolution (Jensen et al., 1998, 2009; Burdige and Zimmerman, 2002) as under-recognized components of total ecosystem NEP and NEC. Because of this, we express caution in interpreting our NEC results as strictly net production of CaCO3; it appears that TA generated by anaerobic processes in the sediment likely influenced our estimates of NEC. Further studies should refine our estimates of benthic DIC and TA fluxes from seagrass sediments (with benthic chambers in the present study, underwater eddy covariance in Long et al., 2015b, and Yamamoto et al., 2015, or pore-water modeling) and compare these values to other component fluxes of NEP and NEC (seagrass primary production, CO2 flux, etc.).
A key finding of this study was the divergence between NEPDO and NEPDIC, which we attribute to the following factors: (1) carbonate system buffering, which retains NEP-generated CO2 in the water as DIC, (2) more rapid gas transfer, combined with a larger exchangeable pool for O2 than for CO2, and (3) a clear time-variant response of NEPDO to irradiance (Fig. 7a). While DO-based approaches offer many advantages in cost and temporal coverage, we suggest that future studies should first constrain the underlying carbonate chemistry and assess the relationship between NEPDIC and NEPDO. Unfortunately, given the very limited temporal scope of this study, just 8 d, it is impossible to extend the results of this study to longer timescales. At present, we cannot determine whether the seagrass ecosystem at this site is net dissolving and heterotrophic throughout the year or even across seasons. More research is needed to assess the role of seasonal- to annual-scale variability in NEP and NEC on coastal ocean acidification trends. The use of new techniques, such as eddy covariance and improved autonomous instruments for pH, pCO2, and TA, should allow future studies to build on this work and fill in our understanding of carbonate chemistry dynamics over longer, annual timescales. In particular, these new approaches should be targeted at constraining NEE (air–water CO2 exchange) in conjunction with direct and rigorous measurements of NEP and NEC. The combination of these approaches will allow for the first direct assessments of seagrass NECB, a critical next step in the valuation of seagrass in the context of the global carbon cycle.
All datasets generated during this project are published on the data sharing repository Figshare (Van Dam, 2019, https://doi.org/10.6084/m9.figshare.7707029.v1). Further requests for data or methods sharing can be directed towards the corresponding author.
The supplement related to this article is available online at: https://doi.org/10.5194/bg-16-4411-2019-supplement.
BRVD designed the research methodology and formal analysis for this study, while field and lab work was carried out by BRVD and CL. Isotopic analysis of DIC was conducted by CLO. The original draft of this paper was prepared by BRVD, while further review and editing were conducted by JWF, CLO, and CL. Funding for this study was acquired by JWF.
The authors declare that they have no conflict of interest.
This work was supported by the US National Science Foundation through the Florida Coastal Everglades Long Term Ecological Research program under grant nos. DEB-1237517 and DEB-1832229. This project is also funded by the DAAD (no 57429828) from funds of the German Federal Ministry of Education and Research (BMBF). We thank Sara Wilson, Roxane Bowden, Mary Zeller, and Mark Kershaw for assistance in the lab and field. We also appreciate the assistance of the National Parks Service, who provided housing and lab space for this study. This is contribution no. 166 from the Center for Coastal Oceans Research in the Institute of Water and Environment at Florida International University. We acknowledge the thoughtful comments and suggestions of three anonymous reviewers.
This research has been supported by the National Science Foundation (grant nos. DEB-1237517 and DEB-1832229).
The article processing charges for this open-access
publication were covered by a Research
Centre of the Helmholtz Association.
This paper was edited by Jack Middelburg and reviewed by three anonymous referees.
Barrón, C., Duarte, C. M., Frankignoulle, M., and Borges, A. V.: Organic carbon metabolism and carbonate dynamics in a Mediterranean seagrass (Posidonia oceanica) meadow, Estuar. Coasts, 29, 417–426, https://doi.org/10.1007/BF02784990, 2006.
Bosence, D. W. J.: Biogenic Carbonate Production in Florida Bay, Bull. Mar. Sci., 44, 419–433, 1989.
Bosence, D. W. J., Rowlands, R. J., and Quine, M. L.: Sedimentology and budget of a Recent carbonate mound, Florida Keys, Sedimentology, 32, 317–343, https://doi.org/10.1111/j.1365-3091.1985.tb00515.x, 1985.
Bouillon, S., Dehairs, F., Velimirov, B., Abril, G., and Borges, A. V.: Dynamics of organic and inorganic carbon across contiguous mangrove and seagrass systems (Gazi Bay, Kenya), J. Geophys. Res.-Biogeo., 112, 1–14, https://doi.org/10.1029/2006JG000325, 2007.
Brodersen, K. E., Trevathan-tackett, S. M., Nielsen, D. A., Macreadie, P. I., and Durako, M. J.: Oxygen Consumption and Sulfate Reduction in Vegetated Coastal Habitats : Effects of Physical Disturbance, Front. Mar. Sci., 6, 1–13, https://doi.org/10.3389/fmars.2019.00014, 2019.
Burdige, D. J. and Zimmerman, R. C.: Impact of Sea Grass Density on Carbonate Dissolution in Bahamian Sediments, Limnol. Oceanogr., 47, 1751–1763, https://doi.org/10.4319/lo.2002.47.6.1751, 2002.
Burdige, D. J., Hu, X., and Zimmerman, R. C.: The widespread occurrence of coupled carbonate dissolution/reprecipitation in surface sediments on the Bahamas Bank, Am. J. Sci., 310, 492–521, https://doi.org/10.2475/06.2010.03, 2010.
Camp, E. F., Suggett, D. J., Gendron, G., Jompa, J., Manfrino, C., and Smith, D. J.: Mangrove and Seagrass Beds Provide Different Biogeochemical Services for Corals Threatened by Climate Change, Front. Mar. Sci., 3, 1–16, https://doi.org/10.3389/fmars.2016.00052, 2016.
Challener, R. C., Robbins, L. L., and Mcclintock, J. B.: Variability of the carbonate chemistry in a shallow, seagrass-dominated ecosystem: Implications for ocean acidification experiments, Mar. Freshw. Res., 67, 163–172, https://doi.org/10.1071/MF14219, 2016.
Chapin, F. S., Pace, M. L., Harden, J. W., Schulze, E.-D., Randerson, J. T., Harmon, M. E., McGuire, A. D., Woodwell, G. M., Wirth, C., Clark, D. A., Neff, J. C., Baldocchi, D. D., Lovett, G. M., Goulden, M. L., Howarth, R. W., Valentini, R., Sala, O. E., Aber, J. D., Melillo, J. M., Matson, P. A., Schimel, D. S., Ryan, M. G., Houghton, R. A., Cole, J. J., Schlesinger, W. H., Running, S. W., Heimann, M., Mooney, H. A., and Rastetter, E. B.: Reconciling Carbon-cycle Concepts, Terminology, and Methods, Ecosystems, 9, 1041–1050, https://doi.org/10.1007/s10021-005-0105-7, 2006.
Corbett, D. R., Chanton, J., Burnett, W., Dillon, K., Rutkowski, C., and Fourqurean, J. W.: Patterns of groundwater discharge into Florida Bay, Limnol. Oceanogr., 44, 1045–1055, https://doi.org/10.4319/lo.1999.44.4.1045, 1999.
Cyronak, T., Santos, I. R., McMahon, A., and Eyre, B. D.: Carbon cycling hysteresis in permeable carbonate sands over a diel cycle: Implications for ocean acidificationn, Limnol. Oceanogr., 58, 131–143, https://doi.org/10.4319/lo.2013.58.1.0131, 2013.
Cyronak, T., Andersson, A. J., D'Angelo, S., Bresnahan, P. J., Davidson, C. C. C., Griffin, A., Kindeberg, T., Pennise, J., Takeshita, Y., and White, M.: Short-Term Spatial and Temporal Carbonate Chemistry Variability in Two Contrasting Seagrass Meadows: Implications for pH Buffering Capacities, Estuar. Coasts, 5, 1–15, https://doi.org/10.1007/s12237-017-0356-5, 2018.
Deines, P.: The isotopic composition of reduced organic carbon, in: Handbook of Environmental Isotope Geochemistry, vol. 1, edited by: Fritz, P. and Fontes, J. C., Elsevier, New York, pp. 329–406, 1980.
Dickson, A. G. and Millero, F. J.: A comparison of the equilibrium constants for the dissociation of carbonic acid in seawater media, Deep-Sea Res., 34, 1733–1743, 1987.
Dickson, A. G., Afghan, J. D., and Anderson, G. C.: Reference materials for oceanic CO2 analysis: a method for the certification of total alkalinity, Marine Chem., 80, 185–197, 2003.
Dickson, A. G., Sabine, C. L., and Christian, J. R.: Guide to Best Practices for Ocean CO2 Measurements, PICES Special Publication, 3, 2007.
Duarte, C. M., Middelburg, J. J., and Caraco, N.: Major role of marine vegetation on the oceanic carbon cycle, Biogeosciences, 2, 1–8, https://doi.org/10.5194/bg-2-1-2005, 2005.
Duarte, C. M., Marbà, N., Gacia, E., Fourqurean, J. W., Beggins, J., Barrón, C., and Apostolaki, E. T.: Seagrass community metabolism: Assessing the carbon sink capacity of seagrass meadows, Global Biogeochem. Cycles, 24, 1–8, https://doi.org/10.1029/2010GB003793, 2010.
DuFore, C. M.: Spatial and Temporal Variations in the Air-Sea Carbon Dioxide Fluxes of Florida Bay, dissertation, University of South Florida, Tampa, FL, 2012.
Enríquez, S. and Schubert, N.: Direct contribution of the seagrass Thalassia testudinum to lime mud production, Nat. Commun., 5, 1–12, https://doi.org/10.1038/ncomms4835, 2014.
Eyre, B. D. and Ferguson, A. J. P.: Comparison of carbon production and decomposition, benthic nutrient fluxes and denitrification in seagrass, phytoplankton, benthic microalgae- and macroalgae-dominated warm-temperate Australian lagoons, Mar. Ecol. Prog. Ser., 229, 43–59, https://doi.org/10.3354/meps229043, 2002.
Fourqurean, J., Zieman, J., and Powell, G.: Phosphorus limitation of primary production in Florida Bay: Evidence from ratios of the dominant seagrass Thalassia testudinum, Limnol. Oceanogr., 37, 162–171, 1992.
Fourqurean, J. W., Escoria, S. P., Anderson, W. T., and Zieman, J. C.: Spatial and Seasonal Variability in Elemental Content, δ13C, and δ15N of Thalassia testudinum from South Florida and Its Implications for Ecosystem Studies, Estuaries, 28, 447–461, 2005.
Fourqurean, J. W., Duarte, C. M., Kennedy, H., Marbà, N., Holmer, M., Mateo, M. A., Apostolaki, E. T., Kendrick, G. A., Krause-Jensen, D., McGlathery, K. J., and Serrano, O.: Seagrass ecosystems as a globally significant carbon stock, Nat. Geosci., 5, 505–509, https://doi.org/10.1038/ngeo1477, 2012a.
Fourqurean, J. W., Kendrick, G. A., Collins, L. S., Chambers, R. M., and Vanderklift, M. A.: Carbon, nitrogen and phosphorus storage in subtropical seagrass meadows: Examples from Florida Bay and Shark Bay, Mar. Freshw. Res., 63, 967–983, https://doi.org/10.1071/MF12101, 2012b.
Fourqurean, J. W., Manuel, S. A., Coates, K. A., Kenworthy, W. J., and Boyer, J. N.: Water quality, isoscapes and stoichioscapes of seagrasses indicate general P limitation and unique N cycling in shallow water benthos of Bermuda, Biogeosciences, 12, 6235–6249, https://doi.org/10.5194/bg-12-6235-2015, 2015.
Frankovich, T. A. and Zieman, J. C.: Total epiphyte and epiphytic carbonate production on Thalassia testudinum across Florida Bay, Bull. Mar. Sci., 54, 679–695, 1994.
Ganguly, D., Singh, G., Ramachandran, P., Selvam, A. P., Banerjee, K., and Ramachandran, R.: Seagrass metabolism and carbon dynamics in a tropical coastal embayment, Ambio, 46, 667–679, https://doi.org/10.1007/s13280-017-0916-8, 2017.
Hendriks, I. E., Olsen, Y. S., Ramajo, L., Basso, L., Steckbauer, A., Moore, T. S., Howard, J., and Duarte, C. M.: Photosynthetic activity buffers ocean acidification in seagrass meadows, Biogeosciences, 11, 333–346, https://doi.org/10.5194/bg-11-333-2014, 2014.
Hines, M. and Lyons, W.: Biogeochemistry of Nearshore Bermuda Sediments. I. Sulfate Reduction Rates and Nutrient Generation, Mar. Ecol. Prog. Ser., 8, 87–94, https://doi.org/10.3354/meps008087, 2007
Ho, D. T., Law, C. S., Smith, M. J., Schlosser, P., Harvey, M., and Hill, P.: Measurements of air-sea gas exchange at high wind speeds in the Southern Ocean: Implications for global parameterizations, Geophys. Res. Lett., 33, L16611, https://doi.org/10.1029/2006GL026817, 2006.
Ho, D. T., Coffineau, N., Hickman, B., Chow, N., Koffman, T., and Schlosser, P.: Influence of current velocity and wind speed on air-water gas exchange in a mangrove estuary, Geophys. Res. Lett., 3813–3821, https://doi.org/10.1002/2016GL068727, 2016.
Ho, D. T., Ferrón, S., Engel, V. C., Anderson, W. T., Swart, P. K., Price, R. M., and Barbero, L.: Dissolved carbon biogeochemistry and export in mangrove-dominated rivers of the Florida Everglades, Biogeosciences, 14, 2543–2559, https://doi.org/10.5194/bg-14-2543-2017, 2017.
Holmer, M. and Nielsen, S. L.: Sediment sulfur dynamics related to biomass- density patterns in Zostera marina (eelgrass) beds, Mar. Ecol. Prog. Ser., 146, 163–171, 1997.
Holmer, M., Andersen, F. O., Nielsen, S. L., and Boschker, H. T. S.: The importance of mineralization based on sulfate reduction for nutrient regeneration in tropical seagrass sediments, Aquat. Bot., 71, 1–17, https://doi.org/10.1016/S0304-3770(01)00170-X, 2001.
Holmer, M., Duarte, C. M., and Marba, N.: Sulfur cycling and seagrass (Posidonia oceanica) status in carbonate sediments, Biogeochemistry, 66, 223–239, 2003.
Hopkinson, C. S. and Smith, E. M.: Estuarine respiration: An overview of benthic, pelagic and whole system respiration, in: Respiration in aquatic ecosystems, edited by: del Giorgio, P. A. and Williams, P., Oxford Univ. Press., 122–146, https://doi.org/10.1093/acprof:oso/9780198527084.003.0008, 2007.
Howard, J. L., Creed, J. C., Aguiar, M. V. P., and Fouqurean, J. W.: CO2 released by carbonate sediment production in some coastal areas may offset the benefits of seagrass “Blue Carbon” storage, Limnol. Oceanogr., 63, 160–172, https://doi.org/10.1002/lno.10621, 2018.
Jensen, H. S., McGlathery, K., Marino, J. R., and Howarth, R. W.: Forms and availability of sediment phosphorus in carbonate sand of Bermuda seagrass beds, Limnol. Oceanogr., 43, 799–810, 1998.
Jensen, H. S., Nielsen, O. I., Koch, M. S., and de Vicente, I.: Phosphorus release with carbonate dissolution coupled to sulfide oxidation in Florida Bay seagrass sediments, Limnol. Oceanogr., 54, 1753–1764, https://doi.org/10.4319/lo.2009.54.5.1753, 2009.
Karlsson, J., Jansson, M., and Jonsson, A.: Respiration of allochthonous organic carbon in unproductive forest lakes determined by the Keeling plot method, Limnol. Oceanogr., 52, 603–608, https://doi.org/10.4319/lo.2007.52.2.0603, 2007.
Koweek, D. A., Zimmerman, R. C., Hewett, K. M., Gaylord, B., Giddings, S. N., Nickols, K. J., Ruesink, J., Stachowicz, J. J., Takeshita, Y., and Caldeira, K.: Expected limits on the ocean acidi fi cation buffering potential of a temperate seagrass meadow, Ecol. Appl., 28, 1694–1714, https://doi.org/10.1002/eap.1771, 2018.
Large, W. and Pond, S.: Open Ocean Momentum Flux Measurements in Moderate to Strong Winds, J. Phys. Oceanogr., 11, 324–336, 1981.
Lee, R. J. and Saylor, J. R.: The effect of a surfactant monolayer on oxygen transfer across an air/water interface during mixed convection. Int. J. Heat Mass Tran., 53, 3405–3413, https://doi.org/10.1016/j.ijheatmasstransfer.2010.03.037, 2010.
Lewis, E. and Wallace, D. W. R.: Program developed for CO2 system calculations, Rep. ORNL/CDLAC-105, Carbon Dioxide Inf. and Anal. Cent., Oak Ridge Natl. Lab., U.S. Dep. of Energy, Oak Ridge, Tenn., 1998.
Long, M., Berg, P., and Falter, J.: Seagrass metabolism across a productivity gradient using the eddy covariance, Eulerian control volume, and biomass addition techniques, J. Geophys. Res.-Ocean., 120, 2676–2700, https://doi.org/10.1002/2014JC010441, 2015a.
Long, M. H., Charette, M. A., Martin, W. R., and Mccorkle, D. C.: Oxygen metabolism and pH in coastal ecosystems: Eddy Covariance Hydrogen ion and Oxygen Exchange System (ECHOES), Limnol. Oceanogr. Methods, 13, 438–450, https://doi.org/10.1002/lom3.10038, 2015b.
MacIntyre, S., Jonsson, A., Jansson, M., Aberg, J., Turney, D. E., and Miller, S. D.: Buoyancy flux, turbulence, and the gas transfer coefficient in a stratified lake, Geophys. Res. Lett., 37, 2–6, https://doi.org/10.1029/2010GL044164, 2010.
Manzello, D. P., Enochs, I. C., Melo, N. Gledhill, D. K., and Johns, E. M.: Ocean acidification refugia of the florida reef tract, PLoS One, 7, 1–10, https://doi.org/10.1371/journal.pone.0041715, 2012.
Mazarrasa, I., Marbà, N., Lovelock, C. E., Serrano, O., Lavery, P. S., Fourqurean, J. W., Kennedy, H., Mateo, M. A., Krause-Jensen, D., Steven, A. D. L., and Duarte, C. M.: Seagrass meadows as a globally significant carbonate reservoir, Biogeosciences, 12, 4993–5003, https://doi.org/10.5194/bg-12-4993-2015, 2015.
McDougall, T. J. and Barker, P. M.: Getting started with TEOS-10 and the Gibbs Seawater (GSW) Oceanographic Toolbox, 28 pp., SCOR/IAPSO WG127, ISBN 978-0-646-55621-5, 2010.
McKenna, S. P. and McGillis, W. R.: The role of free-surface turbulence and surfactants in air-water gas transfer, Int. J. Heat Mass Tran., 47, 539–553, https://doi.org/10.1016/j.ijheatmasstransfer.2003.06.001, 2004.
McMahon, A., Santos, I. R., Schulz, K. G., Cyronak, T., and Maher, D. T.: Determining coral reef calcification and primary production using automated alkalinity, pH and pCO2 measurements at high temporal resolution. Estuarine, Coast. Shelf Sci., 209, 80–88, https://doi.org/10.1016/j.ecss.2018.04.041, 2018.
Mehrbach, C., Culberson, C. H., Hawley, J. E., and Pytkowicz, R. M.: Measurement of the apparent dissociation constants of carbonic acid in seawater at atmospheric pressure, Limnol. Oceanogr., 18, 897–907, https://doi.org/10.4319/lo.1973.18.6.0897, 1973.
Middelburg, J. J.: Marine Carbon Biogeochemistry, Springer Briefs in Earth System Sciences, 1, https://doi.org/10.1007/978-3-030-10822-9_1, 2019.
Millero, F., Hiscock, W., Huang, R., Roche, M., and Zhang, J.: Seasonal Variation of the Carbonate System in Florida Bay, Bull. Mar. Sci., 68, 101–123, 2001.
Nixon, S. W., Oviatt, C. A., Garber, J., and Lee, V.: Diel Metabolism and Nutrient Dynamics in a Salt Marsh Embayment, Ecology, 57, 740–750, 1976.
Odum, H. T. and Hoskin, C. M.: Comparative studies on the metabolism of marine waters, Publ. Inst. Mar. Sci., Univ. Tex., Texas, 1958.
Pacella, S. R., Brown, C. A., Waldbusser, G. G., Labiosa, R. G., and Hales, B.: Seagrass habitat metabolism increases short-term extremes and long-term offset of CO2 under future ocean acidification, P. Natl. Acad. Sci. USA, 115, 1–6, https://doi.org/10.23719/1407616, 2018.
Perez, D. I., Phinn, S. R., Roelfsema, C. M., Shaw, E., Johnston, L., and Iguel, J.: Primary Production and Calcification Rates of Algae-Dominated Reef Flat and Seagrass Communities, J. Geophys. Res.-Biogeo., 123, 2362–2375, https://doi.org/10.1029/2017JG004241, 2018.
Podgrajsek, E., Sahleìe, E., and Rutgersson, A.: Diel cycle of lake-air CO2 flux from a shallow lake and the impact of waterside convection on the transfer velocity, J. Geophys. Res.-Biogeo., 119, 487–507, https://doi.org/10.1002/2014JG002781, 2014.
Raymond, P. A. and Cole, J. J.: Gas Exchange in Rivers and Estuaries: Choosing a Gas Transfer Velocity, Estuaries, 24, 312–317, 2001.
Röhr, M. E., Holmer, M., Baum, J. K., Björk, M., Chin, D., Chalifour, L., Cimon, S., Cusson, M., Dahl, M., and Deyanova, D.: Blue Carbon Storage Capacity of Temperate Eelgrass (Zostera marina) Meadows, Glob. Biochem. Cycles, 1457–1475, https://doi.org/10.1029/2018GB005941, 2018.
Ruiz-Halpern, S., Macko, S. A., and Fourqurean, J. W.: The effects of manipulation of sedimentary iron and organic matter on sediment biogeochemistry and seagrasses in a subtropical carbonate environment, Biogeochemistry, 87, 113–126, https://doi.org/10.1007/s10533-007-9162-7, 2008.
Saderne, V., Geraldi, N. R., Macreadie, P. I., Maher, D. T., Middelburg, J. J., Serrano, O., Almahasheer, H., Arias-Ortiz, A., Cusack, M., Eyre, B. D., Fourqurean, J. W., Kennedy, H., Krause-Jensen, D., Kuwae, T., Lavery, P. S., Lovelock, C. E., Marba, N., Masqué, P., Mateo, M. A., Mazarrasa, I., McGlathery, K. J., Oreska, M. P. J., Sanders, C. J., Santos, I. R., Smoak, J. M., Tanaya, T., Watanabe, K., and Duarte, C. M.: Role of carbonate burial in Blue Carbon budgets, Nat. Commun., 120, 29–38, https://doi.org/10.1038/s41467-019-08842-6, 2019.
Shaw, E. C., McNeil, B. I., and Tilbrook, B.: Impacts of ocean acidification in naturally variable coral reef flat ecosystems, J. Geophys. Res.-Oceans, 117, C3, https://doi.org/10.1029/2011jc007655, 2012.
Smith, A. C., Kostka, J. E., Devereux, R., and Yates, D. F.: Seasonal composition and activity of sulfate-reducing prokaryotic communities in seagrass bed sediments, Aquat. Microb. Ecol., 37, 183–195, https://doi.org/10.3354/ame037183, 2004.
Smith, S.: Physical, chemical and biological characteristics of CO2 gas flux across the air-water interface, Plant Cell Environ., 8, 387–398, 1985.
Stockman, K. W., Ginsburg, R. N., and Shinn, E. A.: The Production of Lime Mud by Algae in South Florida, J. Sediment Petrol., 37, 633–648, 1967.
Turk, D., Yates, K. K., Esperance, C. L., Melo, N., Ramsewak, D., Dowd, M., Estrada, S. C., Herwitz, S. R., McGillis, W. R., Vega-Rodriguez, M., Toro-Farmer, G., L'Esperance, C., Melo, N., Ramsewak, D., Dowd, M., Estrada, S. C., Muller-Karger, F. E., Herwitz, S. R., and McGillis, W. R.: Community metabolism in shallow coral reef and seagrass ecosystems, lower Florida Keys, Mar. Ecol. Prog. Ser., 538, 35–52, https://doi.org/10.3354/meps11385, 2015.
Unsworth, R. K. F., Collier, C. J., Henderson, G. M., and McKenzie, L. J.: Tropical seagrass meadows modify seawater carbon chemistry: Implications for coral reefs impacted by ocean acidification, Environ. Res. Lett., 7, 2, https://doi.org/10.1088/1748-9326/7/2/024026, 2012.
Upstill-Goddard, R. C.: Air–sea gas exchange in the coastal zone, Estuar. Coast. Shelf Sci., 70, 388–404, https://doi.org/10.1016/j.ecss.2006.05.043, 2006.
Van Dam, B.: Florida Bay Diel, figshare, https://doi.org/10.6084/m9.figshare.7707029, 2019.
Wanless, H. R. and Tagett, M. G.: Origin , Growth and Evolution of Carbonate Mudbanks in Florida Bay, Bull. Mar. Sci., 44, 454–489, 1989.
Wanninkhof, R. H.: Relationship Between Wind Speed and Gas Exchange, J. Geophys. Res., 97, 7373–7382, https://doi.org/10.1029/92JC00188, 1992.
Weiss, R. F.: Solubility of nitrogen, oxygen, and argon in water and seawater, Deep-Sea Res., 17, 721–735, 1970.
Weiss, R. F.: Carbon Dioxide in Water and Seawater: The Solubility of a Non-ideal Gas, Mar. Chem., 2, 203–215, 1974.
Welsh, D., Castadelli, G., Bartoli, M., Poli, D., Careri, M., De Wit, R., and Viaroli, P.: Denitrification in an intertidal seagrass meadow, a comparison of 15N-isotope and acetylene-block techniques: Dissimilatory nitrate reduction to ammonia as a source of N2O?, Mar. Biol., 139, 1029–1036, https://doi.org/10.1007/s002270100672, 2001.
Yamamoto, S., Kayanne, H., Tokoro, T., Kuwae, T., and Watanabe, A.: Total alkalinity flux in coral reefs estimated from eddy covariance and sediment pore-water profiles, Limnol. Oceanogr., 60, 229–241, https://doi.org/10.1002/lno.10018, 2015.
Yates, K. K. and Halley, R. B.: Diurnal variation in rates of calcification and carbonate sediment dissolution in Florida Bay, Estuar. Coasts, 29, 24–39, https://doi.org/10.1007/BF02784696, 2006.
Yates, K. K., Dufore, C., Smiley, N., Jackson, C., and Halley, R. B.: Diurnal variation of oxygen and carbonate system parameters in Tampa Bay and Florida Bay, Mar. Chem., 104, 110–124, https://doi.org/10.1016/j.marchem.2006.12.008, 2007.
Zhang, J.-Z. and Fischer, C. J.: Carbon Dynamics of Florida Bay: Spatiotemporal Patterns and Biological Control, Environ. Sci. Technol., 48, 9161–9169, https://doi.org/10.1021/es500510z, 2014.
Ziegler, S. and Benner, R.: Ecosystem metabolism in a subtropical, seagrass-dominated lagoon, Mar. Ecol. Prog. Ser., 173, 1–12, https://doi.org/10.3354/meps173001, 1998.
Zieman, J. C., Fourqurean, J. W., and Iverson, R. L.: Distribution, Abundance and Productivity of Seagrasses and Macroalgae in Florida Bay, Bull. Mar. Sci., 44, 292–311, 1989.
Zimmerman, R. C., Hill, V. J., and Gallegos, C. L.: Predicting effects of ocean warming, acidification, and water quality on Chesapeake region eelgrass, Limnol. Oceanogr., 60, 1781–1804, https://doi.org/10.1002/lno.10139, 2015.