the Creative Commons Attribution 4.0 License.
the Creative Commons Attribution 4.0 License.
 | 20 Nov 2019
How will the key marine calcifier Emiliania huxleyi respond to a warmer and more thermally variable ocean?
Xinwei Wang
Feixue Fu
Pingping Qu
Joshua D. Kling
Haibo Jiang
Yahui Gao
David A. Hutchins
Global warming will be combined with predicted increases in thermal variability in the future surface ocean, but how temperature dynamics will affect phytoplankton biology and biogeochemistry is largely unknown. Here, we examine the responses of the globally important marine coccolithophore Emiliania huxleyi to thermal variations at two frequencies (1 d and 2 d) at low (18.5 ∘C) and high (25.5 ∘C) mean temperatures. Elevated temperature and thermal variation decreased growth, calcification and physiological rates, both individually and interactively. The 1 d thermal variation frequencies were less inhibitory than 2 d variations under high temperatures, indicating that high-frequency thermal fluctuations may reduce heat-induced mortality and mitigate some impacts of extreme high-temperature events. Cellular elemental composition and calcification was significantly affected by both thermal variation treatments relative to each other and to the constant temperature controls. The negative effects of thermal variation on E. huxleyi growth rate and physiology are especially pronounced at high temperatures. These responses of the key marine calcifier E. huxleyi to warmer, more variable temperature regimes have potentially large implications for ocean productivity and marine biogeochemical cycles under a future changing climate.


Climate-driven changes such as ocean warming alter the productivity and composition of marine phytoplankton communities, thereby influencing global biogeochemical cycles (Boyd et al., 2018; Hutchins and Fu, 2017; Thomas, et al., 2012). Increasing sea surface temperatures have been linked to global declines in phytoplankton concentration (Boyce et al., 2010), changes in spring bloom timing (Friedland et al., 2018) and biogeographic shifts in harmful algal blooms (Fu et al., 2012; Gobler et al., 2017). Warming and acidification may drive shifts away from dinoflagellate or diatom dominance and towards nanophytoplankton (Hare et al., 2007; Keys et al., 2018). Similarly, Morán et al. (2010) predicted that a gradual shift will occur towards smaller primary producers in a warmer ocean.
Effects of temperature increases on phytoplankton diversity are uncertain. Warming and phytoplankton biodiversity were found to be inversely correlated in a coastal California diatom assemblage, at least on short timescales (Tatters et al., 2018). In contrast, a 5-year long mesocosm experiment found that elevated temperature can modulate species coexistence, thus increasing phytoplankton species richness and productivity (Yvon-Durocher et al., 2015). Globally, rising temperatures may result in losses of phytoplankton biodiversity in the tropics but gains in the polar regions (Thomas et al., 2012). It is thought that ocean warming will lead to a poleward range expansion of warm-water species at the expense of cold-water species (Boyd et al., 2010; Gao et al., 2018; Hallegraeff, 2010; Hutchins and Fu, 2017; Thomas et al., 2012). It is evident that rising ocean temperatures will benefit some groups, while having detrimental consequences for others (Boyd et al., 2010, 2015, 2018; Feng, et al., 2017; Fu et al., 2014). For example, recent decades of satellite observations show a striking poleward shift in the distribution of blooms of the coccolithophore Emiliania huxleyi, a species that was previously virtually absent in polar waters (Boyd et al., 2010; Neukermans et al., 2018).
Coccolithophores are the most successful calcifying phytoplankton in the ocean and contribute almost half of global marine calcium carbonate production. They play crucial biogeochemical roles by performing both photosynthesis and calcification and facilitate carbon export to the deep ocean through the ballasting effects of their calcium carbonate shells (Klaas and Archer, 2002; Krumhardt et al., 2017; Monteiro et al., 2016). E. huxleyi (Lohm.) is the most abundant and cosmopolitan coccolithophore, forming prolific blooms in many regions (Holligan, et al., 1983, 1993; Iglesias-Rodríguez et al., 2002; Westbroek et al., 1993).
The responses of E. huxleyi to global change factors have been intensively investigated. Many E. huxleyi strains are sensitive to ocean acidification, which negatively affects their growth rates and calcification (Feng et al., 2018; Hoppe et al., 2011). However, among the many currently changing environmental drivers, temperature may be among the most important in regulating coccolithophore physiology (Boyd et al., 2010). Feng et al. (2008) reported that the growth rate of E. huxleyi was improved by elevated temperature at low irradiance. Furthermore, temperature was the most important driver controlling both cellular particulate organic and inorganic carbon content of a Southern Hemisphere E. huxleyi strain (Feng et al., 2018).
Most research about the effects of global warming on E. huxleyi and phytoplankton in general has focused on predicted increases in mean temperatures. However, in the natural environment, seawater temperatures fluctuate over timescales ranging from hours, to days, to months (Bozinovic et al., 2011; Jiang et al., 2017). Future climate models predict not only in an increase in mean temperature but also an increase in temperature variability (frequency and intensity), as well as a higher probability of extreme events (IPCC, 2013).
The impacts of climatic variability and extremes have been best studied in metazoans, where they may sometimes have a larger effect than increases in climatic averages alone (Vázquez et al., 2017; Vasseur et al., 2014; Zander et al., 2017). Variability can promote greater zooplankton species richness, compared with long-term average conditions (Cáceres 1997; Shurin et al., 2010). In corals, temperature variability could buffer warming stress, elevate thermal tolerance and reduce the risk of bleaching (Oliver and Palumbi, 2011; Safaie et al., 2018).
In comparison, we still lack a thorough understanding of how thermal variation affects phytoplankton growth and physiology. Unlike zooplankton, the few available studies suggest increasing thermal variation may decrease phytoplankton biomass and biodiversity and shift the community towards small phytoplankton (Burgmer and Hillebrand, 2011; Rasconi et al., 2017). Two studies have shown that plastic responses play a key role in acclimation and adaptation to thermal fluctuations in algae (Kremer et al., 2018; Schaum and Collins, 2014). Population growth rates of phytoplankton in fluctuating thermal environments have been quantitatively modeled based on data from thermal response curves obtained under constant temperatures (Bernhardt et al., 2018).
In view of this relative lack of information on the effects of nonsteady state temperatures on biogeochemically important phytoplankton, we carried out a thermal variability study using the Sargasso Sea E. huxleyi isolate CCMP371. Our experiments combined ocean warming with thermal variations, with a focus on the increasing frequency of temperature variations under global climate change. We examined growth rates, photosynthesis, calcification and elemental composition under constant, 1 d and 2 d temperature variations. This study is intended to provide insights into how different frequencies of thermal variation may influence the physiology and biogeochemistry of this important marine calcifying phytoplankton species under both current and future sea surface temperatures.
The marine coccolithophore E. huxleyi (Lohm.) Hay and Mohler strain CCMP371 (isolated from the Sargasso Sea) was maintained in the laboratory as stock batch cultures in an Aquil medium (100 µmol L−1 , 10 µmol L−1 ), made with 0.2 µM filtered coastal seawater collected from the California region (Sunda et al., 2005). Cells were grown at 22 ∘C under 120 µmol photons m−2 s−1 cool white fluorescent light with a 12 h to 12 h light to dark cycle.
2.1 Experimental set-up
An aluminum thermal gradient block with a range of 13 temperatures was used to perform the thermal response curve and temperature variation experiments. For the thermal curve experiment, the extreme temperatures of the thermal block were set to 8.5 and 28.6 ∘C, with intermediate temperatures of 10.5, 12, 13.5, 15.5, 17.5, 18.5, 21.3, 22.6, 24.5, 26.6 and 27.6 ∘C. The E. huxleyi cells were transferred from the stock cultures into triplicate 120 mL acid-washed polycarbonate bottles in the thermal block under a 12 h light and 12 h dark cycle at 180 µmol photons m−2 s−1. For the light intensity measurement, irradiance was measured individually at each position in the thermal block using a light meter with a small detector bulb to fit into the round holes drilled to fit the experimental bottles (LI-250A light meter, LI-COR). During measurements the detector bulb was positioned identically in each position and, if necessary, the positions of the fluorescent lights were adjusted nearer or farther until the light intensity was between 175 and 185 µmol photons m−2 s−1 for every experimental replicate.
Semicontinuous culturing methods were used for all experiments. Cultures were diluted with an Aquil medium every 2 d to keep them in exponential growth stage while acclimating to the treatment temperatures for 2 weeks before starting the variation experiment. Dilution volumes were calculated to match growth rates of each individual replicate, as measured using in vivo chlorophyll a (Chl a) fluorescence. Once steady-state growth rates were recorded for 3–5 consecutive transfers, the cultures were sampled (Zhu et al., 2017). Due to the decrease in cell numbers during cultivation at 28.6 ∘C (from our preliminary experiment), these cultures were diluted from 22 ∘C stock cultures. They were then sampled as a batch culture (without dilution) after 4–6 d to estimate the negative growth rates and elemental stoichiometry at this upper-limit temperature point.
Six treatments were used to determine the responses of E. huxleyi growth, photosynthesis and calcification to different frequencies of temperature fluctuation. Temperature fluctuation treatments included: (1) low temperature, constant (18.5 ∘C); (2) low temperature, 1 d fluctuation cycle (16–21, mean = 18.5 ∘C); (3) low temperature, 2 d fluctuation cycle (16–21, mean = 18.5 ∘C); (4) high temperature, constant (25.5 ∘C); (5) high temperature, 1 d fluctuation cycle (23–28, mean = 25.5 ∘C); and (6) high temperature, 2 d fluctuation cycle (23–28, mean = 25.5 ∘C). For the variation treatment cycles, cultures were incubated at the cool phase (16 and 23 ∘C for low and high temperatures, respectively) for either 1 or 2 d. They were then switched to the warm phase (21 and 28 ∘C for low and high temperature, respectively) for the same amount of time. It took about 0.5 h to readjust the thermal block to the transformed temperature at the beginning of each new treatment cycle. The experimental E. huxleyi cultures were grown in triplicate in 120 mL acid-washed polycarbonate bottles using the thermal block under a 12 h light/12 h dark cycle at 180 µmol photons m−2 s−1.
For the variable temperature experiment, cultures were diluted semicontinuously with an Aquil medium every 2 d for constant and 1 d variation treatments and every 4 d for 2 d variation treatments. To ensure nutrient-replete conditions in the 2 d variation treatments, Aquil nitrate and phosphate stocks were added at the 2 d midpoint of every 4 d thermal cycle to make sure that the final nitrate and phosphate concentrations were not depleted and were always maintained at > 100 and > 10 µmol L−1, respectively. Cultures were grown for at least eight dilutions (∼16 d for constant and 1 d variation treatments and ∼32 d for 2 d variation treatments) to acclimate to the different experimental conditions before final sampling. All variation treatments were sampled twice across the thermal variation cycle, once during the cool phase and once during the warm phase.
2.2 Growth rates
In vivo fluorescence was measured daily for the 1 d variation treatment and every 2 d for the constant and 2 d variation treatments using a Turner 10AU fluorometer (Turner Designs, CA). In vivo-derived growth rates were subsequently verified using cell samples counted with a nanoplankton counting chamber on an Olympus BX51 microscope. Specific growth rates (d−1) were calculated using the in vivo fluorescence and cell count data as follows: μ= ln[N(T2) ∕ N(T1)] ∕ (T2−T1). N(T1) and N(T2) are the in vivo fluorescence values (for thermal curve experiments and constant treatments) or cell counts (for variation treatments because of potential changes in cellular in vivo fluorescence during fluctuation) at T1 and T2.
2.3 Chl a analysis
Some 20 mL culture samples were filtered onto GF/F glass fiber filters (Whatman, Maidstone, UK) for Chl a analysis. In vitro Chl a was extracted with 90 % aqueous acetone for 24 h at −20 ∘C and then measured using a Turner 10 AU fluorometer (Turner Design, USA) (Fu et al., 2007).
2.4 Elemental analysis
Elemental composition sampling included total particulate carbon (TPC), particulate organic carbon (POC), particulate organic nitrogen (PON), particulate inorganic carbon (PIC) and particulate organic phosphorus (POP), allowing calculation of cellular elemental stoichiometry and calcite/organic carbon ratios (PIC ∕ POC) (Feng et al., 2008). Culture samples for TPC, POC and PON were collected onto pre-combusted GF/F glass fiber filters (Whatman) and dried in a 60 ∘C oven overnight. For POC analysis, filters were fumed for 24 h with saturated HCl (∼37 %) to remove all inorganic carbon prior to analysis. TPC, PON and POC were then measured by a 440 Elemental Analyzer (Costech Inc, CA), according to previous studies (Hutchins et al., 1998; Feng et al., 2008). PIC was calculated as the difference between TPC and POC. For POP measurement, culture samples were filtered onto pre-combusted GF/F filters (Whatman) and analyzed using a molybdate colorimetric method (Solórzano and Sharp, 1980) with minor modifications, as in Fu et al. (2007).
2.5 Total carbon fixation, photosynthesis and calcification rates, and ratios
Total carbon fixation, photosynthetic carbon fixation and calcification rates were measured using the 14C incubation technique (Platt et al., 1980), with slight modifications, as in Feng et al. (2008). Culture samples from each treatment (60 mL) were spiked with 0.2 µCi NaH14CO3 and then incubated for 4 h under their respective experimental conditions. After incubation, samples were filtered on two Whatman GF/F filters (30 mL each) for total carbon fixation and photosynthetic rate separately. The filters for photosynthetic rate measurement were fumed with saturated HCl (∼37 %) before adding scintillation fluid. A sample of 30 mL from each treatment (10 mL from each replicate bottle) was filtered immediately, after adding equal amounts of NaH14CO3 for procedural filter blanks. Filters were then placed in 7 mL scintillation vials with 4 mL scintillation fluid overnight in the dark. To determine the total radioactivity (TA), 0.2 µCi NaH14CO3, together with 100 µL phenylalanine was placed in scintillation vials with the addition of 4 mL scintillation solution. All samples were counted on a Perkin Elmer Liquid Scintillation Counter to measure the radioactivity. Total carbon fixation and photosynthetic rate were calculated from TA, final radioactivity and total dissolved inorganic carbon (DIC) values. Calcification rate was then calculated as the difference between total carbon fixation and photosynthetic rate for each sample.
2.6 Model for thermal responses of E. huxleyi
Growth rates measured under constant temperatures in the thermal block were fitted to the Eppley thermal performance curve (Eppley, 1972; Norberg, 2004; Thomas et al., 2012). This function quantifies parameters of growth temperature effects, including the temperature optimum for growth (Topt) and high and low temperature limits (Tmax and Tmin, respectively) in our strain of E. huxleyi. To predict growth rates under variable thermal regimes from our constant temperature thermal curves, we applied a recently developed model based on the Eppley curve but incorporating nonlinear averaging in conjunction with consideration of Jensen's inequality (Bernhardt et al., 2018). This new thermal fluctuation model takes into account the amount of time that the cells spend at each portion of their thermal performance curve, as well as incorporating the observation that growth rates usually increase slowly with temperature at the cooler end of the curve but then drop off very quickly at the upper, warm end of the curve (Jensen's inequality). This model is more realistic and skillful under variable temperatures than previous work assuming a linear relationship between temperature and growth rates, as nonlinear averaging allows much more accurate predictions when dealing with skewed thermal curves. Several recent studies of phytoplankton thermal variability responses have successfully applied the Bernhardt et al. (2018) model (Qu et al., 2019; Kling et al., 2019).
2.7 Statistical analysis
The mean values of most parameters measured under the variation treatments were calculated by averaging the values from the cool and warm phases, including all the elemental content and ratios, as well as photosynthetic and calcification rates and ratios. Statistical analyses were performed using R (version 3.5.0). For the response of E. huxleyi to warming, the mean growth rate or elemental ratios of three replicates at 12 temperature points were used to fit the growth rate or elemental ratios curves. A one-way ANOVA was applied to analyze the difference between the average value for the entire temperature range and the value at each individual temperature for the elemental ratios. For the response of E. huxleyi to thermal variation, a one-way ANOVA was performed to test the statistical significance in growth rate, elemental stoichiometry, and photosynthetic and calcification rates and ratios among different frequencies (constant, 1 d and 2 d) of temperature variabilities at cool and warm phases under high and low temperatures. The p values were calculated based on Student's t test via two functions including compare_means() and stat_compare_mean() in the ggpubr package, and the figures were generated via the ggplot package in open-source statistical software R version 3.5.0 (R Foundation).
3.1 Responses of E. huxleyi to warming
The growth rates of E. huxleyi at constant temperature increased significantly with warming from 0.09±0.01 d−1 at 8.5 ∘C to a maximum value of 0.90±0.02 d−1 at 21.3 ∘C. Growth was optimal up to 24.5 ∘C and then decreased rapidly to d−1 at 28.6 ∘C (p<0.05, Fig. 1).
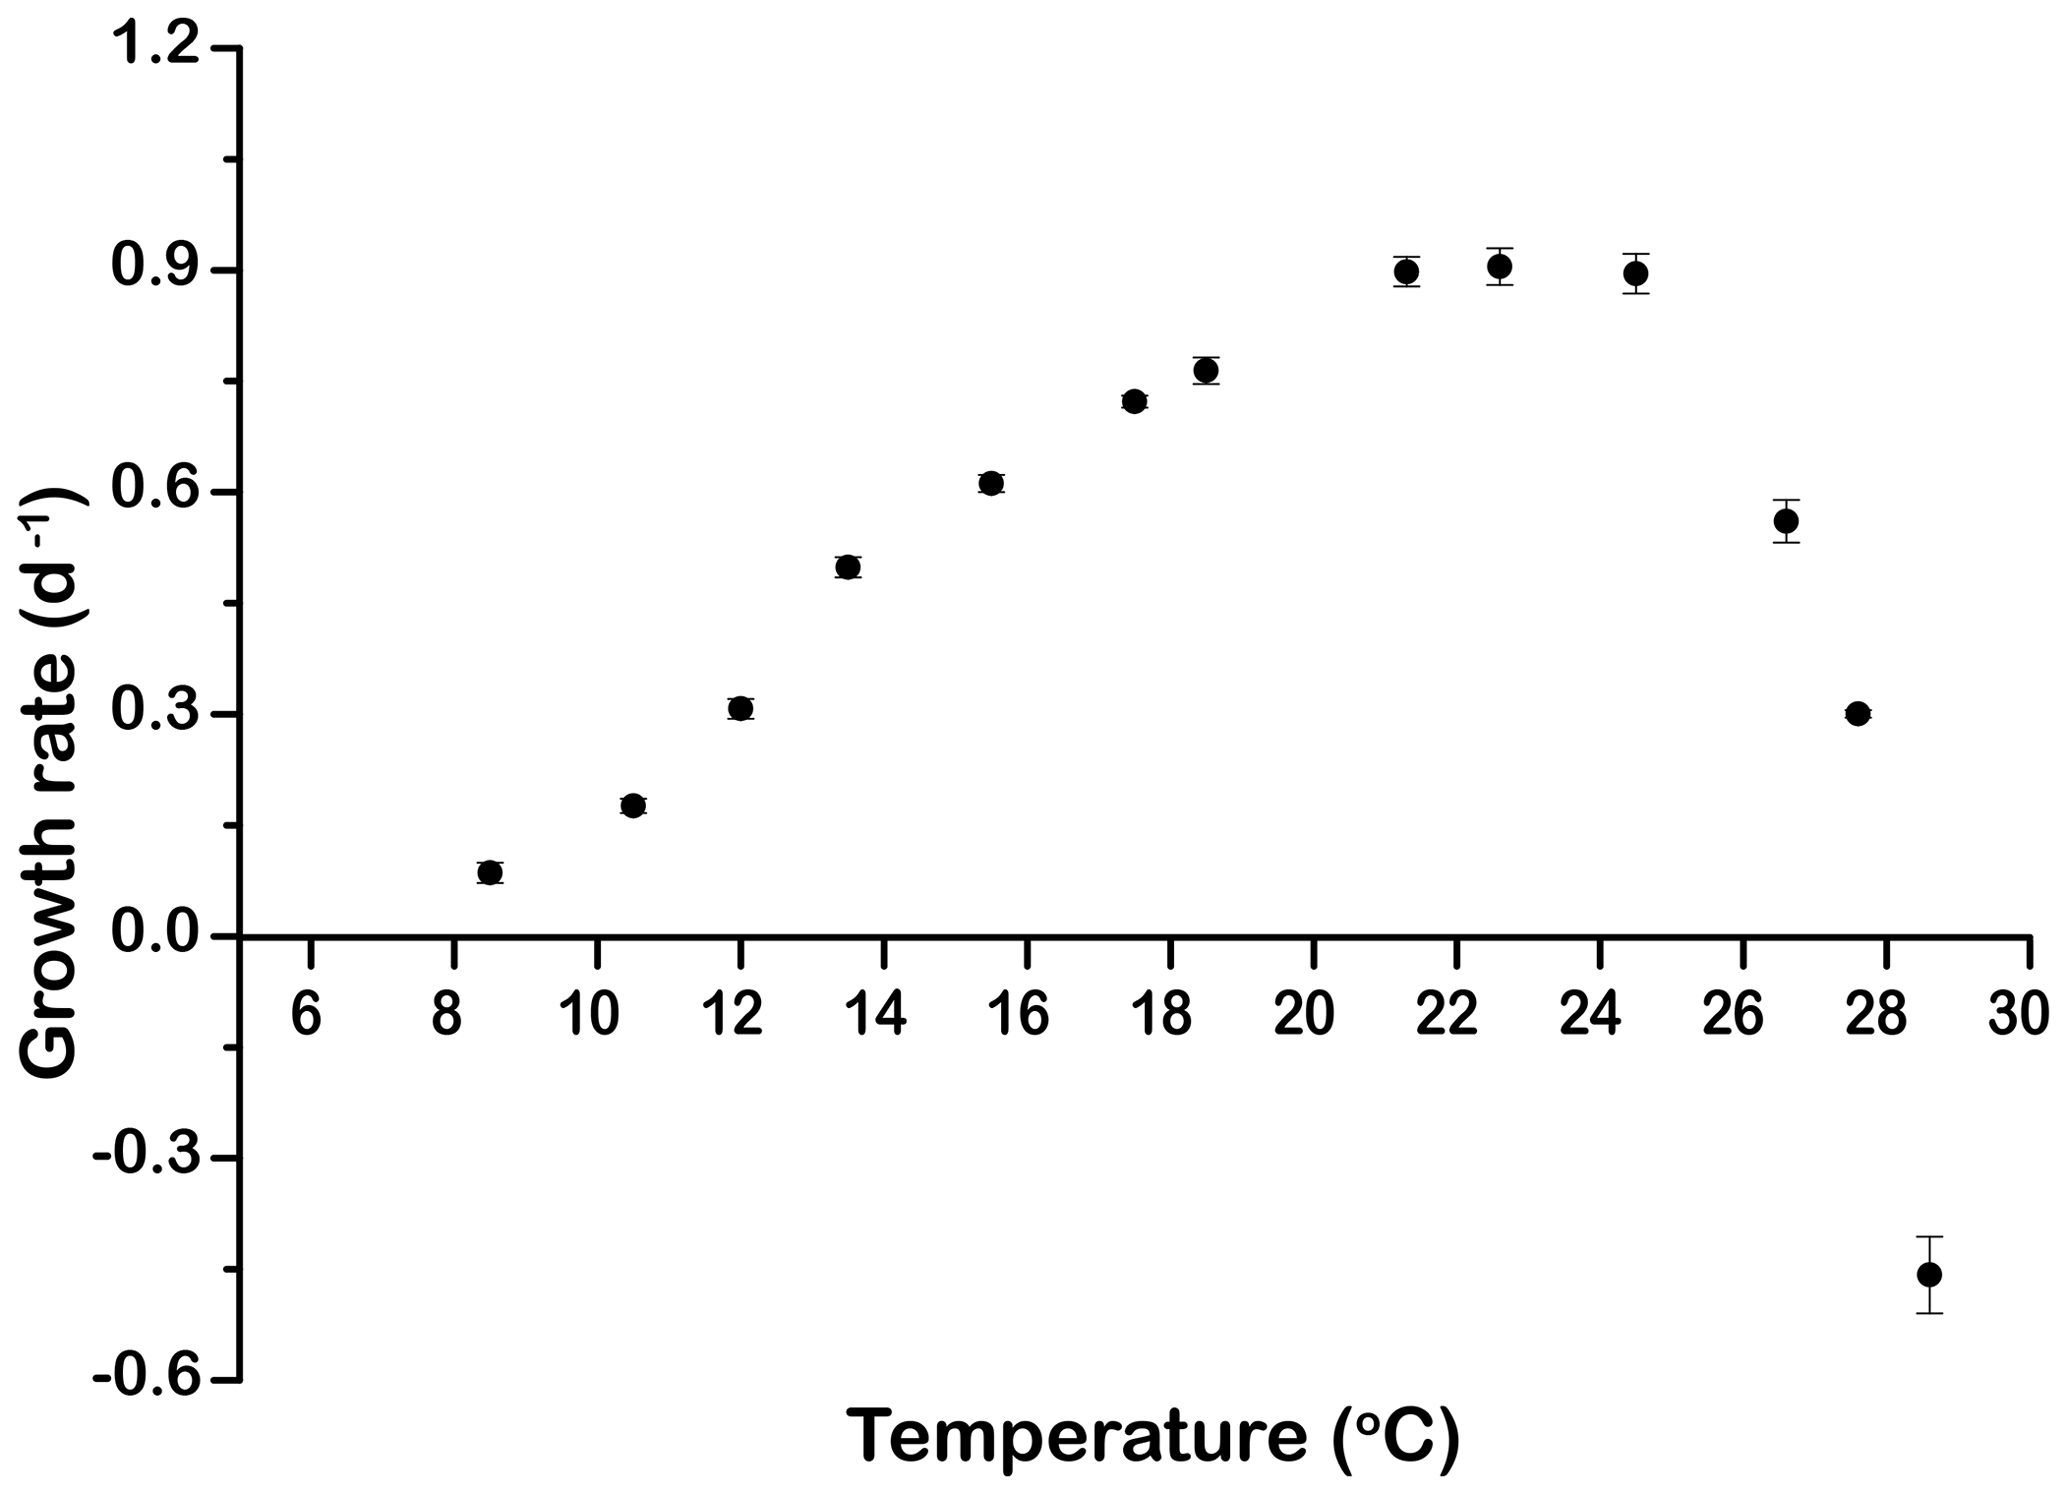
Figure 1Thermal performance curve showing cell-specific growth rates (d−1) of Emiliania huxleyi CCMP371 across a temperature range from 8.5 to 28.6∘. Symbols represent means, and error bars are the standard deviations of three replicates at each temperature, but in many cases the errors bars are smaller than the symbols.
The elemental ratios of the cells in the different temperature treatments were compared to the average elemental ratios across the entire temperature range (Fig. 2). The thermal trends of TPC ∕ PON ratios were generally similar to those of growth rates, in that ratios increased from 8.5 to 17.5 ∘C and then decreased from 24.5 to 27.6 ∘C. The TPC ∕ PON ratios at 8.5, 10.5 and 27.6 ∘C were significantly lower than the average level of all the temperature points (p<0.05, Fig. 2a). The POC ∕ PON ratios of most temperature points were very close to the mean value of 6.3, except at 27.6 ∘C (7.1) and 28.6 ∘C (7.4), which were significantly higher than the average (p<0.05, Fig. 2b). The highest PIC ∕ POC ratio was 0.49±0.07 at 22.6 ∘C, and the lowest PIC ∕ POC ratio was 0.05±0.04 at 27.6 ∘C, a value that was almost 90 % lower than the highest value. The PIC ∕ POC ratios at the lowest temperature tested (10.5 ∘C) and at the high end of the temperature range (26.6 and 27.6 ∘C) were significantly lower than the average level (Fig. 2c). Chl a ∕ POC ratios were significantly lower at 8.5, 10.5 and 27.6 ∘C than the mean and at 17.5, 21.3, 22.6 and 24.5 ∘C were significantly higher than the average (p<0.05, Fig. 2c). The trends of PIC ∕ POC and Chl a ∕ POC ratio were similar, in that they gradually increased from low temperature to the highest value at 22.6 ∘C and then dropped rapidly as temperature increased further (Fig. 2c, d).
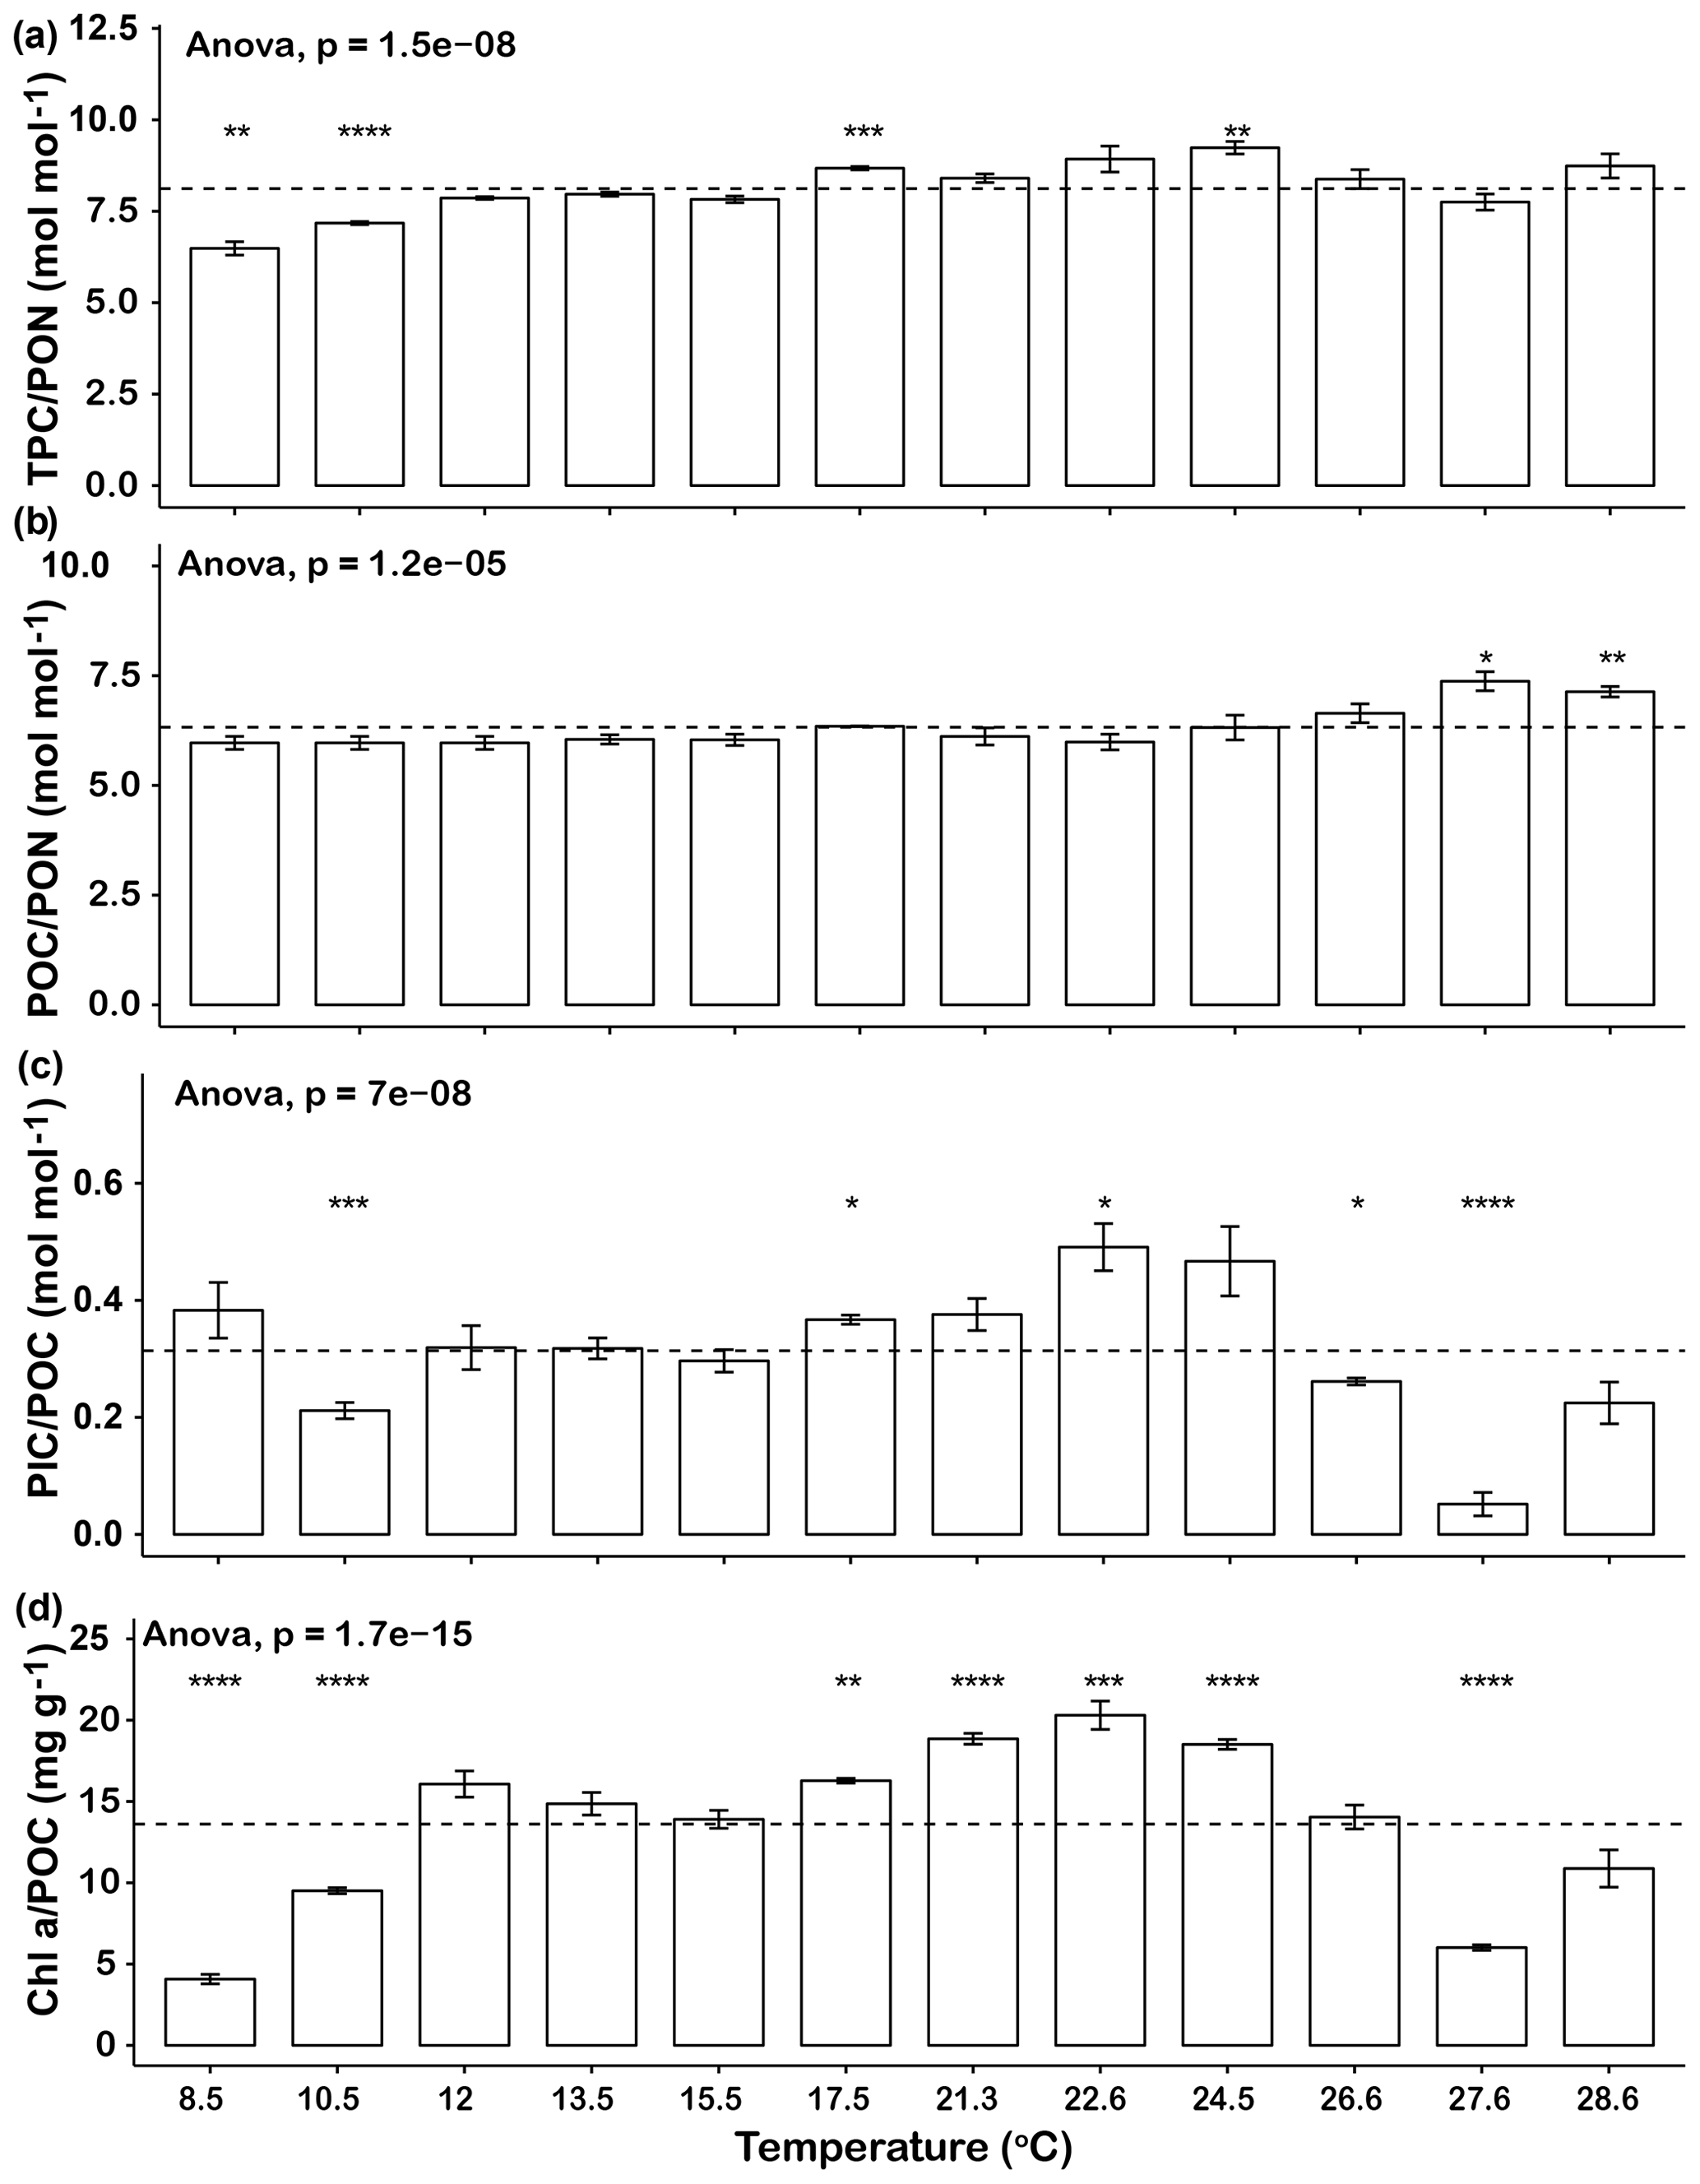
Figure 2Changes in Emiliania huxleyi TPC ∕ PON ratios (a), POC ∕ PON ratios (b), PIC ∕ POC ratios (c) and Ch a ∕ POC ratios (d) across a temperature range from 8.5 to 28.6∘C. Dashed lines represent the average ratios for the entire temperature range. Bars represent means, and error bars are the standard deviations of three replicates at each temperature. Asterisks (*) represent the significant difference (p<0.05) between average ratios and the ratio at each temperature.
3.2 Responses of E. huxleyi to temperature variations
3.2.1 Growth rate
In low-temperature experiments, both 1 d and 2 d temperature variations had a negative effect on growth rate. The mean growth rates of the 1 d (0.71±0.01 d−1) and 2 d (0.72±0.01 d−1) variation treatments were not significantly different from each other (p>0.05), but both were lower than that of the constant 18.5 ∘C treatment (0.76±0.01, p<0.05) (Fig. 3a). Growth rates were low during the cool phase (16 ∘C) of the experiment (∼0.5–0.6 d−1), but those of the 2 d variation cycle were not significantly different from the constant control at this temperature (p>0.05). However, the growth rates during the cool phase of the 1 d variation cycle were lower than those of the constant 16 ∘C treatment (p<0.05). During the warm phase of the thermal cycle (21 ∘C), there were no significant differences in the elevated growth rates (∼0.85–0.9 d−1) of the constant control and those of either variable treatment (p>0.05, Fig. 3a).
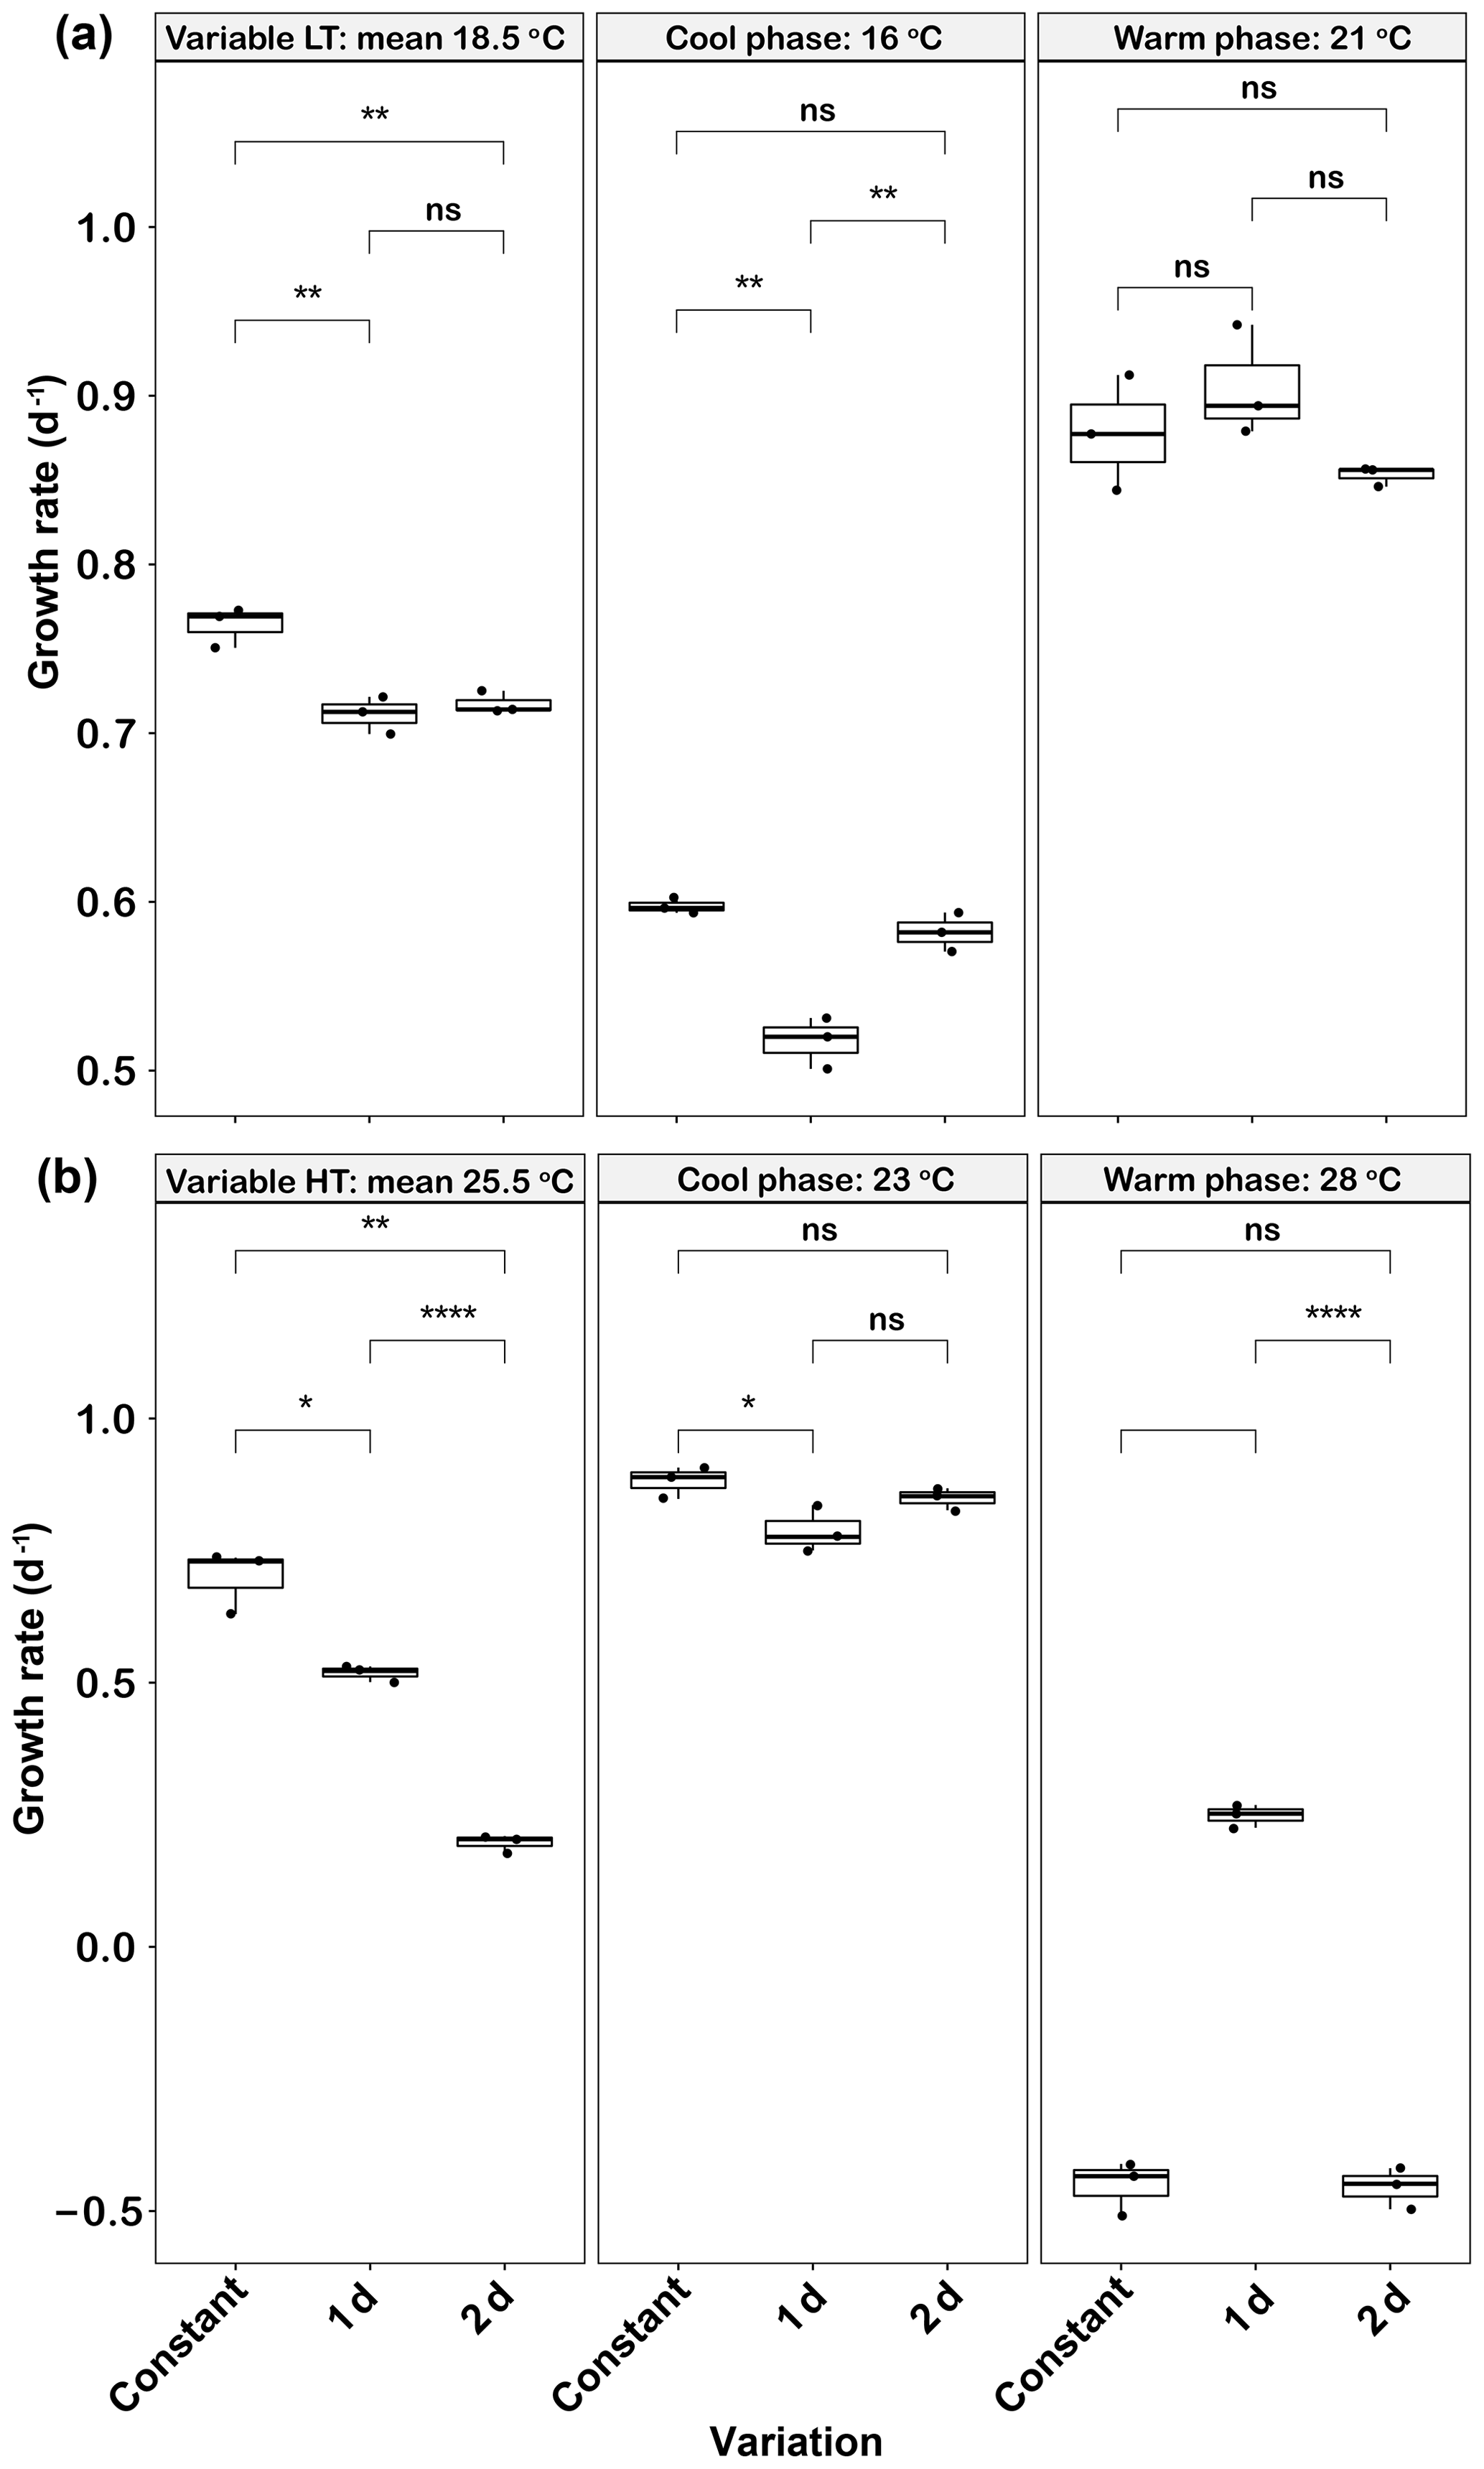
Figure 3Emiliania huxleyi growth rate responses to constant temperatures and during the warm and cool phases of the two thermal variation frequencies (1 d and 2 d) under low (a) and high (b) mean temperatures. The thick black line in the boxplots represents median values for each experimental treatment; the whiskers on the boxplots indicate 1.5× interquartile range. Listed p values with their respective brackets are the statistical significance between two treatments.
In the high-temperature experiments, as in the low-temperature experiments, both temperature variation frequencies had a negative effect on mean growth rates. The growth rates in the 2 d variation treatment were (0.20±0.02 d−1), a decrease of ∼74 % compared with the constant 25.5 ∘C (p<0.05) and ∼62 % of the 1 d variation treatment value (p<0.05, Fig. 3b). During the cool phase (23 ∘C), the growth rate of the 1 d variation treatment was slightly lower (p<0.05) than the constant 23 ∘C, but there were no significant changes between 2 d variations and the constant 23 ∘C treatment (p>0.05, Fig. 3b). During the warm phase (28 ∘C), the constant 28 ∘C and 2 d variation treatment both had negative growth rates of and d−1, respectively. However, the 1 d variation treatment had a low but positive warm-phase growth rate at 0.25±0.02 d−1 (Fig. 3b). There was a time lag of ∼0.5 h to switch to the transformed temperature for each new growth phase, which should thus have had only minimal effect on overall growth rates across the 1 d and 2 d thermal variations.
3.2.2 Cellular PIC and POC contents and ratios
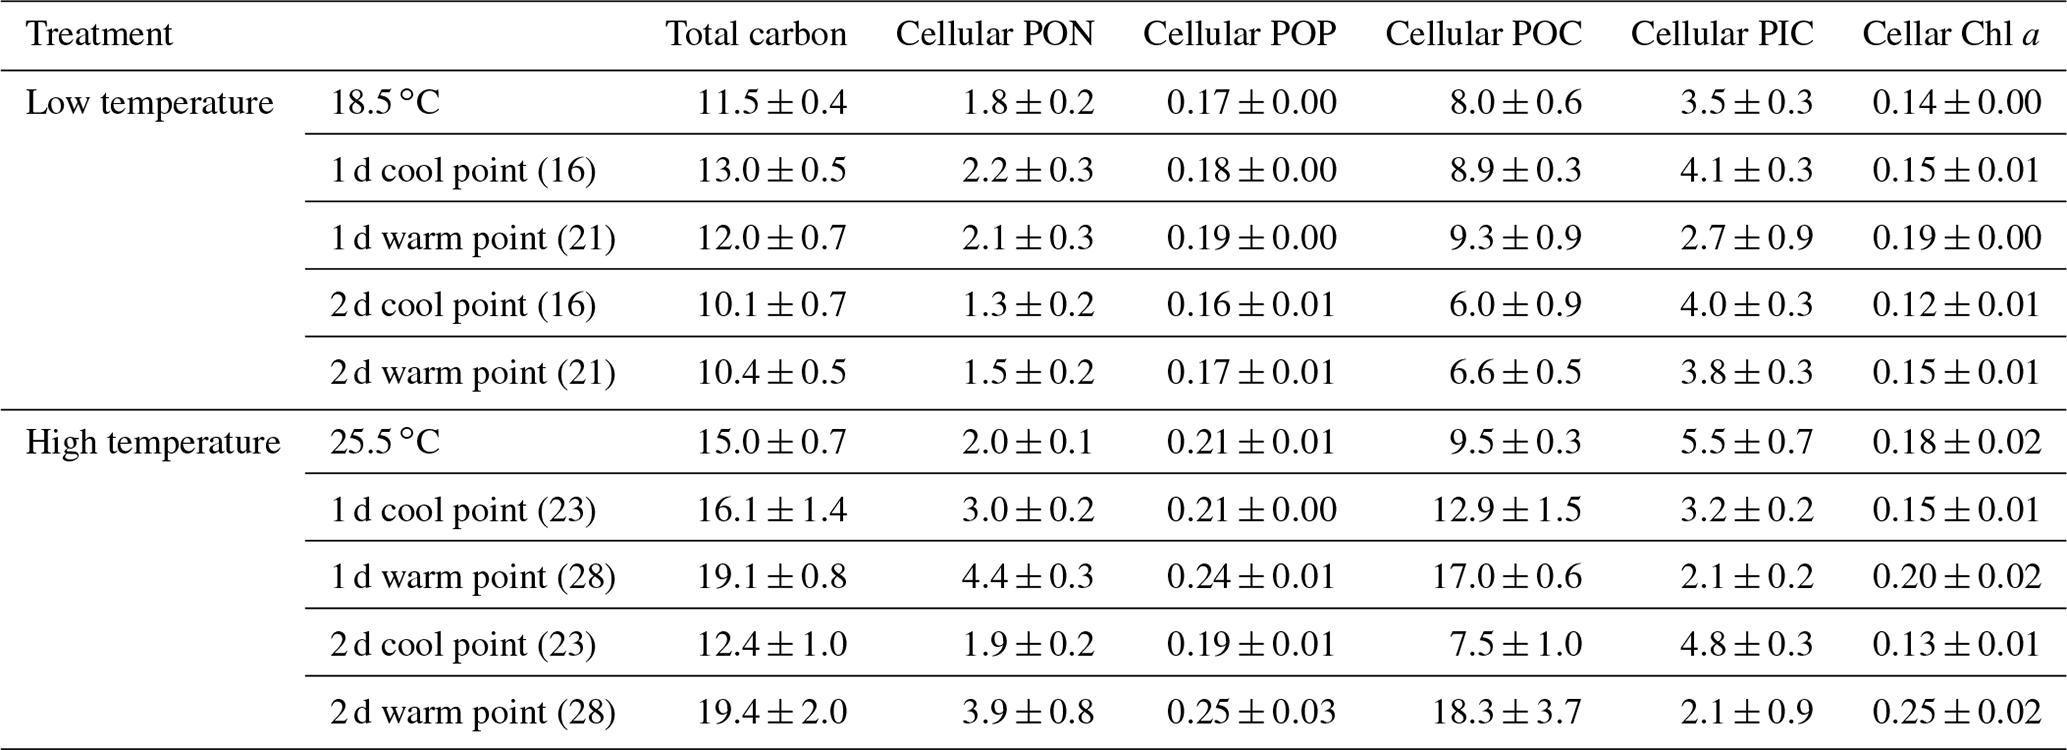
In low-temperature experiments, the cellular PIC content of the constant 18.5 ∘C treatment was 3.5±0.3 pg cell−1, and there were no significant differences with temperature variation treatments (p>0.05, Table 1). However, the cellular POC content of the constant 18.5 ∘C treatment was 8.0±0.6 pg cell−1, which was lower than in the 2 d variation treatment but significantly higher than in the 1 d variation treatment (p<0.05).
Table 1The effect of temperature variation under low and high temperature on total carbon (pg cell−1), cellular POC (pg cell−1), cellular PIC (pg cell−1), cellular PON (pg cell−1), cellular POP (pg cell−1) and cellular Chl a (pg cell−1) of Emiliania huxleyi.
Like POC, the PIC ∕ POC ratio was significantly affected by temperature variations (Fig. 4a). The lowest PIC ∕ POC ratio was found in the 1 d variation treatment (0.38±0.07), which was significantly lower than the 2 d variation treatment value (p<0.05) but close to that in the constant 18.5 ∘C (p>0.05). A similar trend was found in both the cool (16 ∘C) and warm phases (21 ∘C) of the two variation treatments, in that the PIC ∕ POC ratio of the 1 d variation treatment was lower than of the 2 d variation treatment (p<0.05, Fig. 4a). Both variation treatments had lower PIC ∕ POC ratios during the warm phase than during the cool phase, although these differences were not significant (p>0.05).
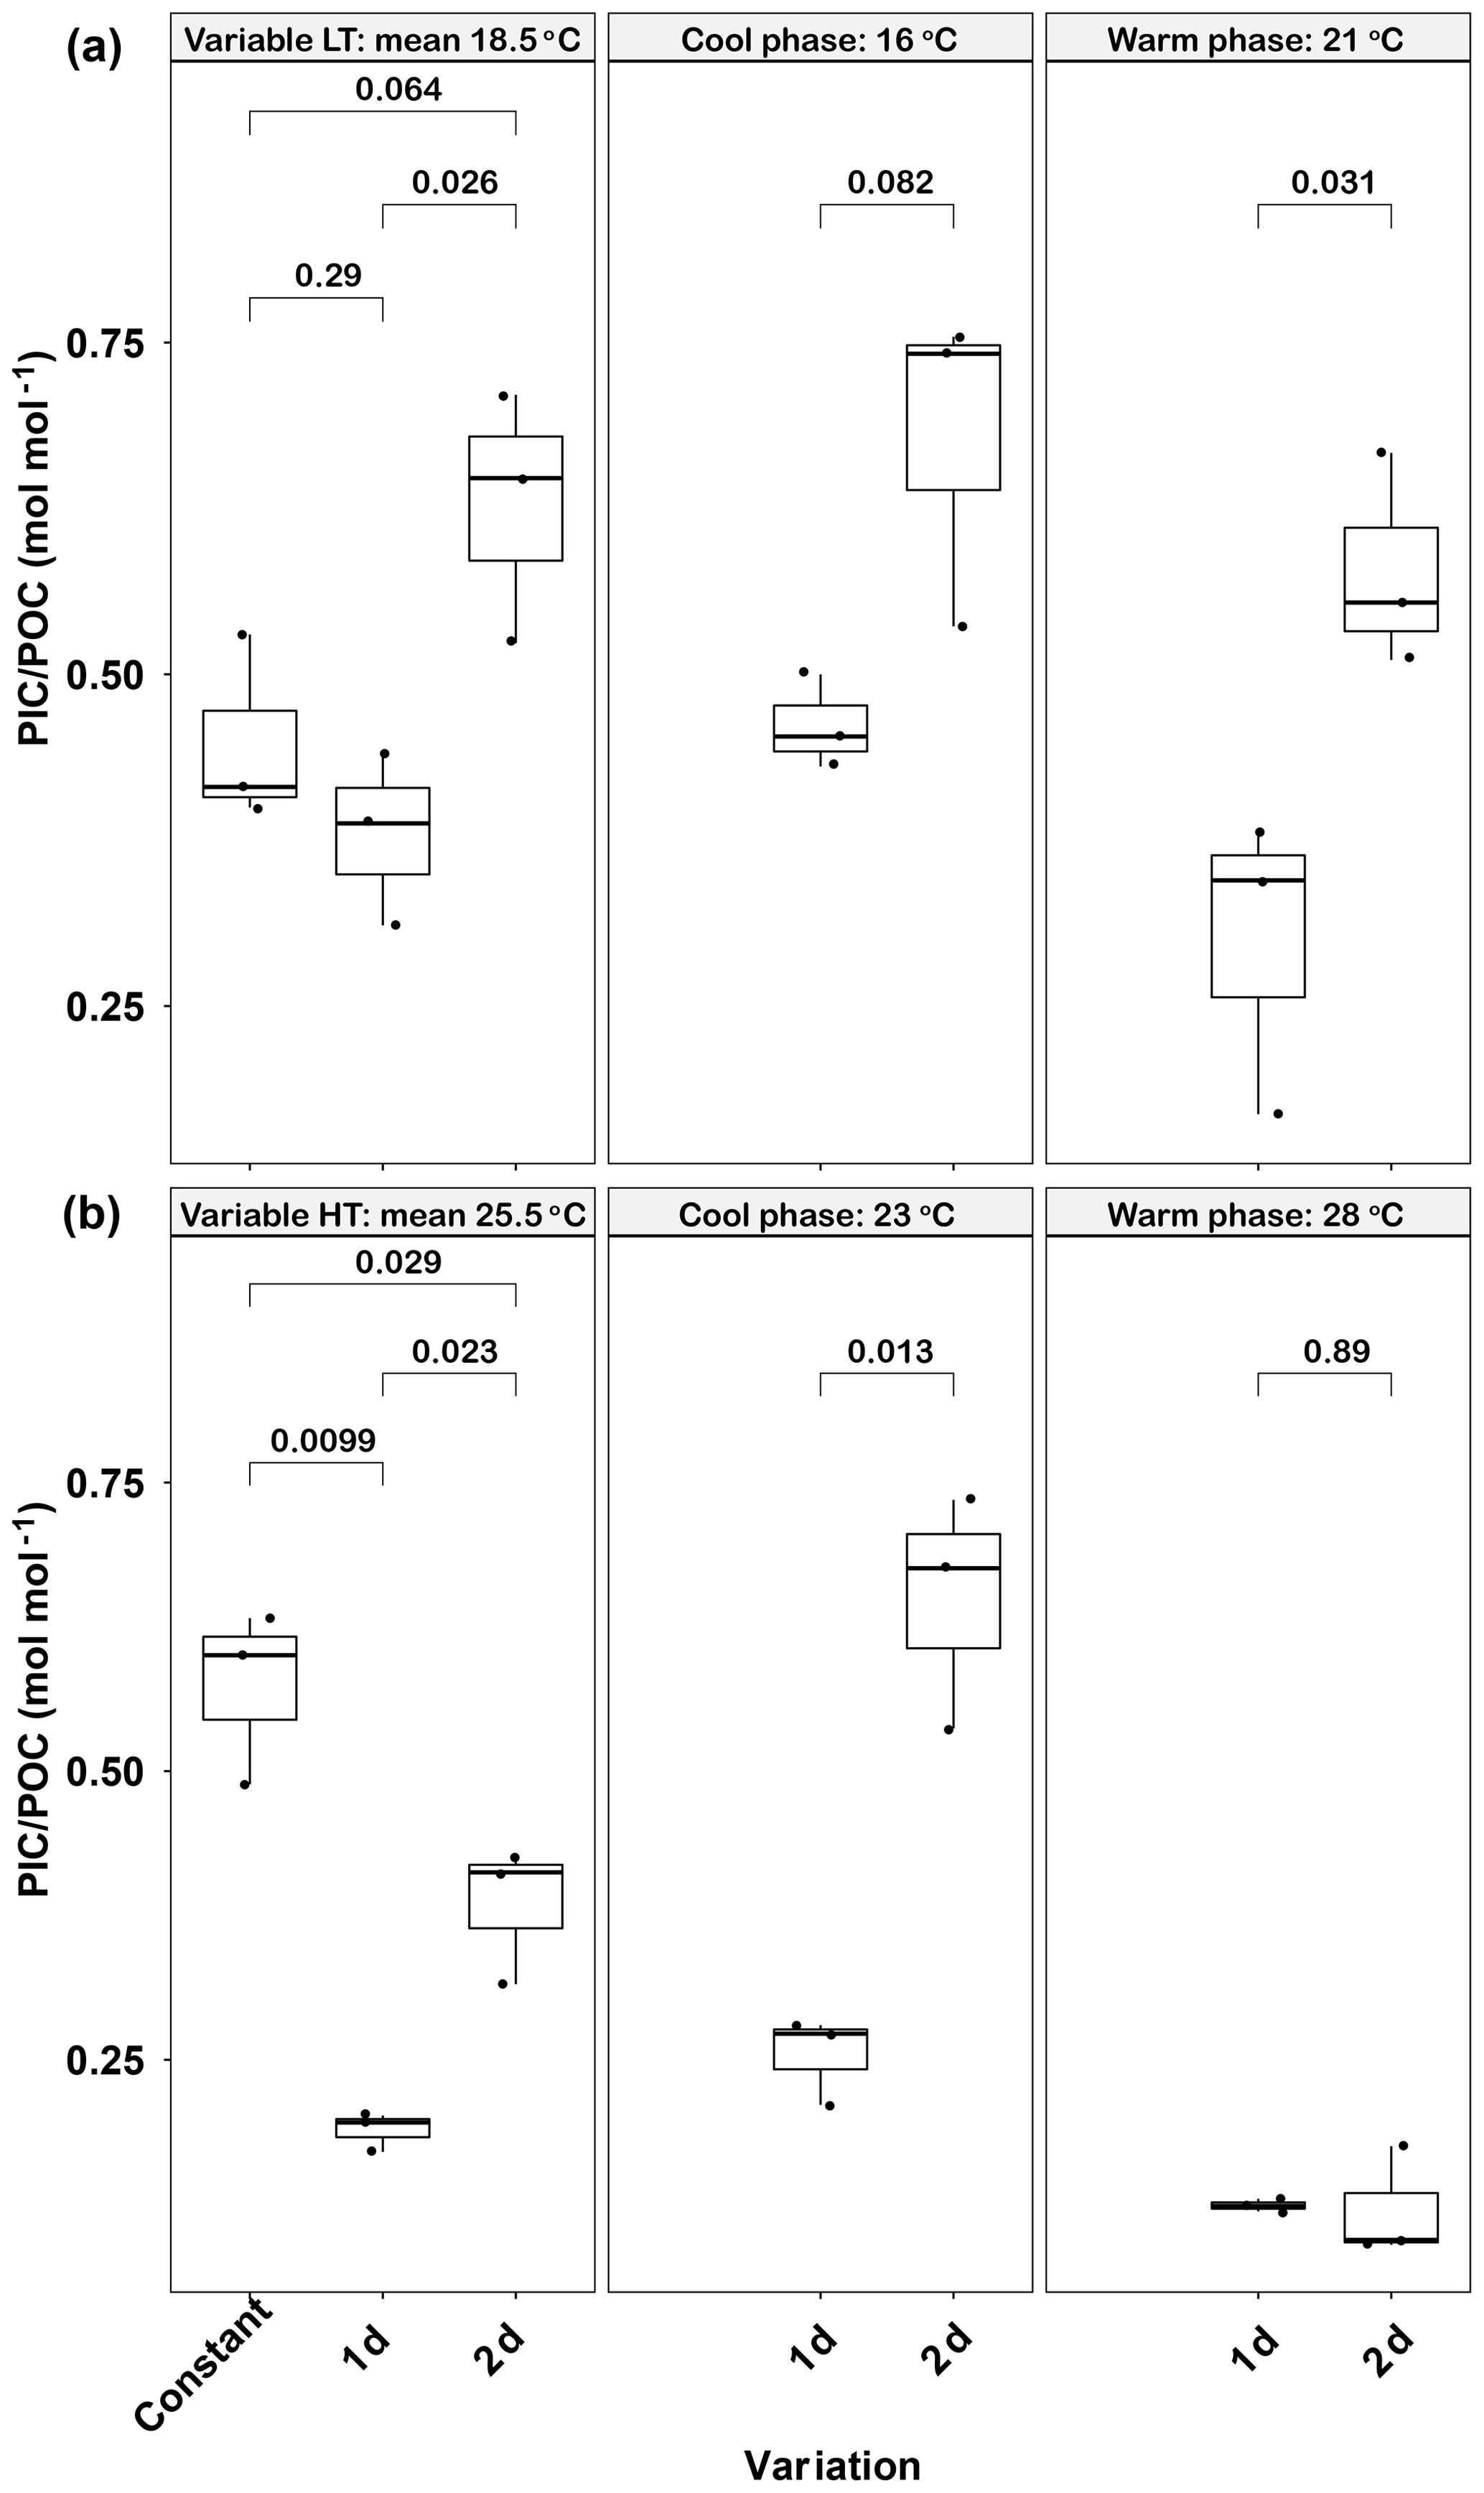
Figure 4Responses of Emiliania huxleyi PIC ∕ POC ratios to constant temperatures and during the warm and cool phases of two thermal variation frequencies (1 d and 2 d) under low (a) and high (b) mean temperatures. LT: low temperature; HT: high temperature. The thick black line in the boxplots represents median values for each experimental treatment; the whiskers on the boxplots indicate 1.5× interquartile range. Listed p values with their respective brackets denote the statistical significance between two treatments.
High-temperature experiments showed particulate carbon trends that were contrary to those of the low-temperature treatments. The PIC content and PIC ∕ POC ratios were significantly decreased by temperature variation. The cellular PIC content of the constant treatment (25.5 ∘C) was 5.5±0.3 pg cell−1, which was ∼200 % higher than that of the 1 d variation and ∼160 % higher than in the 2 d variation treatments (p<0.05, Table 1). The same trend was found for PIC ∕ POC ratios in 1 d variation and 2 d variation treatments, which decreased ∼67 % and 33 % compared with the constant 25.5 ∘C treatment, respectively (p<0.05, Fig. 4b). However, the POC content of 1 d and 2 d variation treatments was higher than in the constant 25.5 ∘C treatment (p<0.05, Table 1). During the cool phase (23 ∘C), the PIC content and PIC ∕ POC ratio of the 1 d variation treatment was significantly lower than in the 2 d variation treatment but, contrary to PIC content, the POC content of the 1 d variation treatment was significantly higher than that in the 2 d variation treatment. During the warm phase (28 ∘C), there were no significant differences of PIC content, POC content, or PIC ∕ POC ratio between the 1 d and 2 d variation treatments (Fig. 4b, Table 1).
3.2.3 Photosynthetic and calcification rates and ratios
In low-temperature treatments, there were no differences between total carbon fixation rates (photosynthesis plus calcification) for the two variable treatments relative to the constant control (Fig. 5a). However, during the cool phase total carbon fixation rates were higher in the 1 d variation than in the 2 d variation (p<0.05, Fig. 5a), while this rate was the same in both variation treatments during the warm phase (p>0.05, Fig. 5a). In high-temperature experiments, the total carbon fixation rates of the 1 d and 2 d variation treatments were significantly decreased by about ∼20 % and ∼18 % respectively, compared with the constant 25.5 ∘C treatment (p<0.05, Fig. 5b).
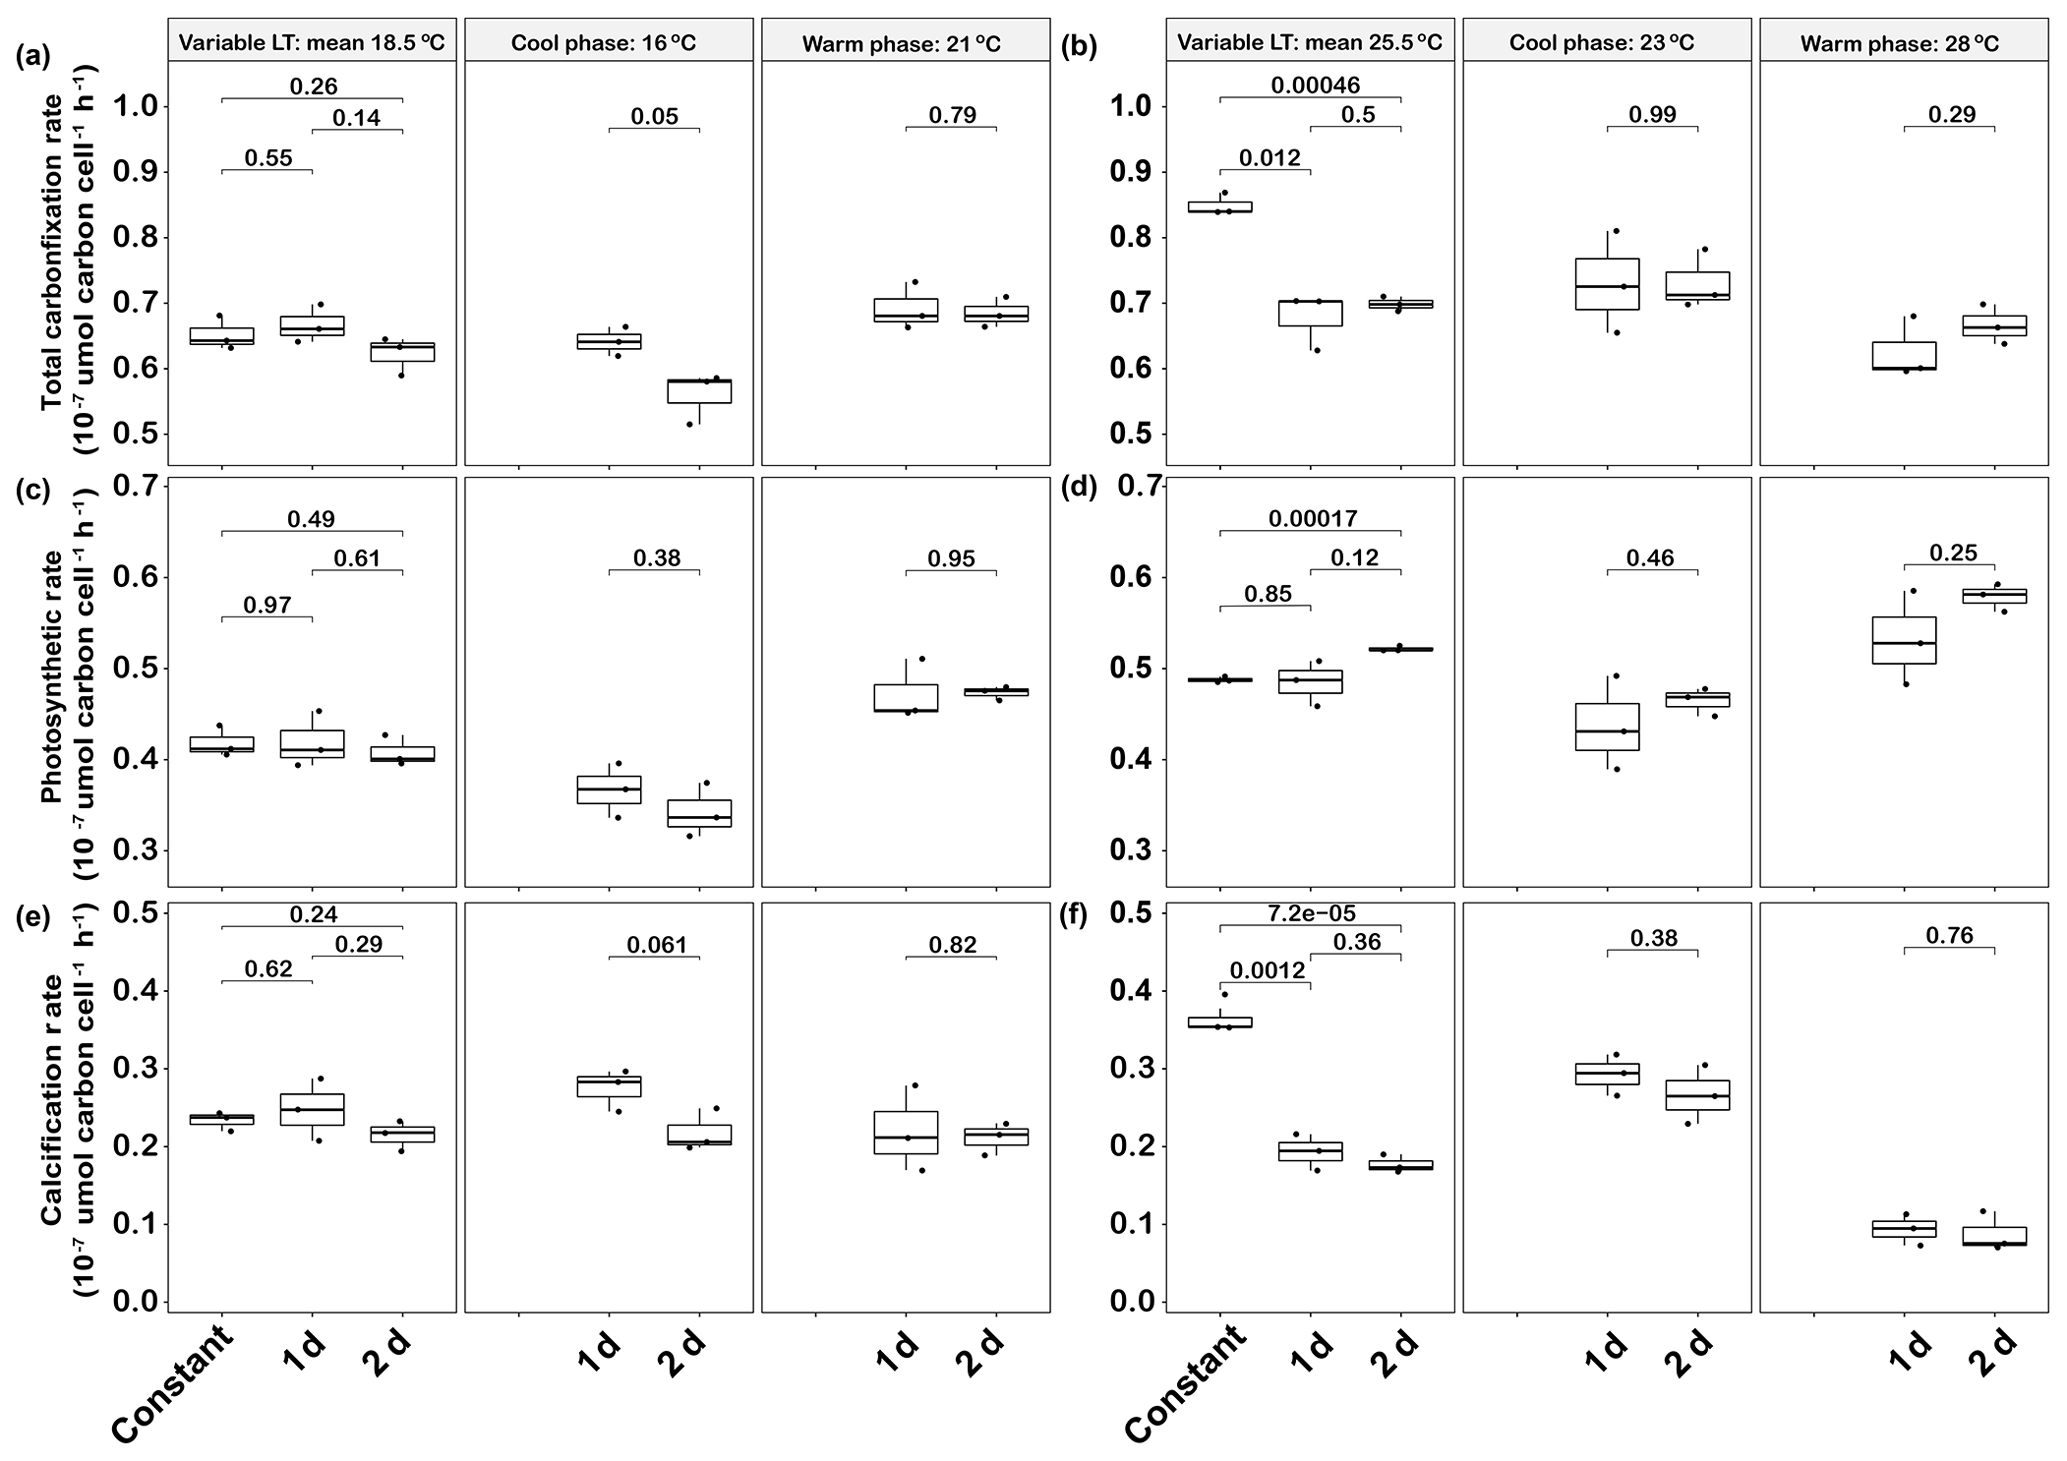
Figure 5Responses of Emiliania huxleyi photosynthetic carbon fixation and calcification at constant temperatures and during the warm and cool phases of two thermal variation frequencies (1 d and 2 d), including total carbon fixation (photosynthesis + calcification) at low (a) and high (b) temperatures, photosynthetic carbon fixation at low (c) and high (d) temperatures, and calcification rates at low (e) and high (f) temperatures. LT: low temperature; HT: high temperature. The thick black line in the boxplots represents median values for each experimental treatment; the whiskers on the boxplots indicate 1.5× interquartile range. Listed p values with their respective brackets denote the statistical significance between two treatments.
The photosynthetic and calcification rates of the constant 18.5 ∘C treatment were 0.04±0.00 pmol C cell−1 h−1 and 0.02±0.00 pmol C cell−1 h−1, respectively, which were not significantly different from both of the temperature variation treatments (p>0.05, Fig. 5c, e). Photosynthetic rates changed within the thermal cycle for both 1 d and 2 d variation treatments, with a decrease of 22 % and 28 % from the warm phase to the cool phase, respectively (Fig. 5c). However, there were no significant changes in calcification rates under either variation frequency treatment between the cool and warm phases of the thermal cycles (p>0.05).
In the mean 25.5 ∘C experiment, photosynthetic rates were not significantly different between the 2 d variation and constant treatments (p>0.05), while the photosynthetic rate of the 2 d variation was slightly higher than that of the constant 25.5 ∘C treatment (p<0.05, Fig. 5d). In contrast, calcification rates of 1 d and 2 d variation treatments at a mean temperature of 25.5 ∘C were significantly decreased by about ∼46 % and ∼51 %, respectively, relative to the constant control (p<0.05, Fig. 5f). There were no significant differences in total carbon fixation and photosynthetic and calcification rates between the 1 d variation and 2 d variation treatments during both the cool (23 ∘C) and warm (28 ∘C) phases (p>0.05, Fig. 5b, d, f).
In the low-temperature treatments, there were no significant differences in calcification to photosynthesis (Cal ∕ Photo) ratios between the constant and the two variable treatments (p>0.05, Fig. 6a). In contrast, in the high-temperature experiments, the Cal ∕ Photo ratio of the 1 d variation and 2 d variation treatments were decreased by ∼40 % and 49 %, respectively, compared with the constant 25.5 ∘C treatment (p<0.05, Fig. 6b). For both low- and high-temperature experiments, there were no significant differences between the 1 d and 2 d variation treatments in either the cool or warm phases of the thermal cycle (p>0.05, Fig. 6b). However, in both temperature treatments the lower photosynthetic rates during the cool phase (Fig. 5c, d) resulted in an increase in the Cal ∕ Photo ratio during the cool phase for both the 1 d and 2 d variation treatments (p<0.05, Fig. 6a, b).
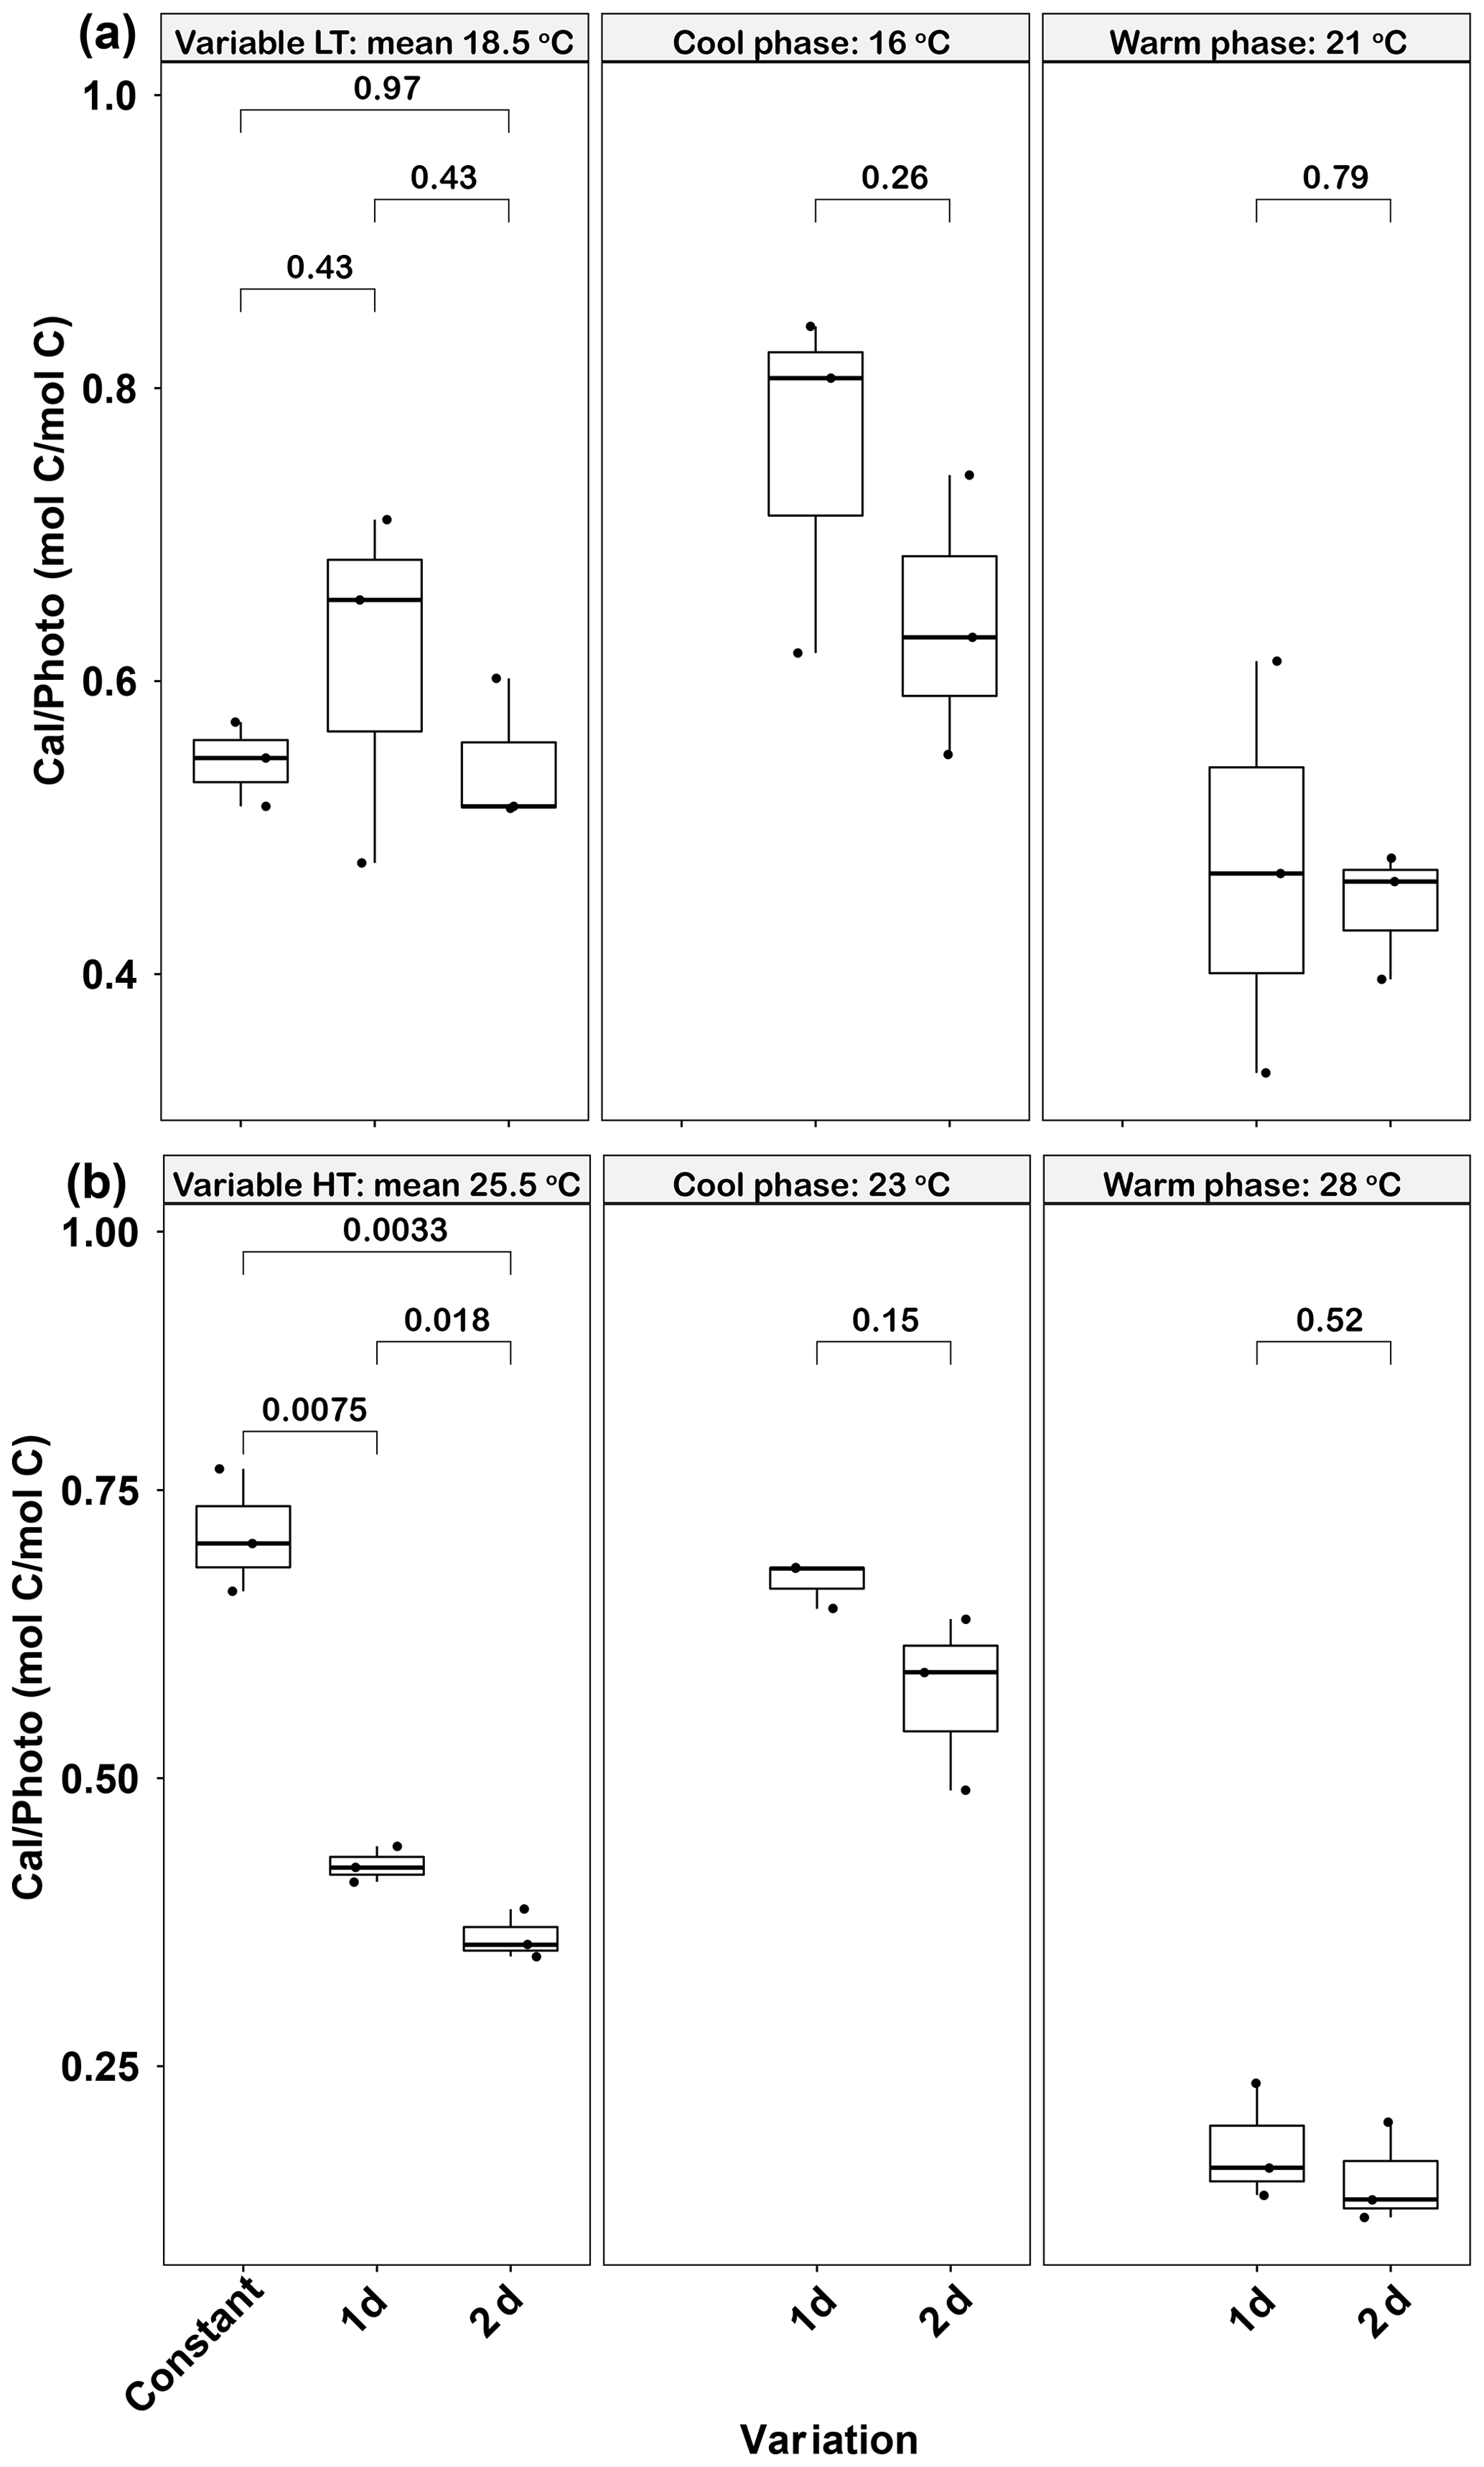
Figure 6Responses of Emiliania huxleyi calcification to photosynthesis ratios (Cal ∕ Photo) to constant temperatures and during the warm and cool phases of two thermal variation frequencies (1 and 2 d) under low (a) and high (b) mean temperatures. LT: low temperature; HT: high temperature. The thick black line in the boxplots represents median values for each experimental treatment; the whiskers on the boxplots indicate 1.5× interquartile range. Listed p values with their respective brackets denote the statistical significance between two treatments.
3.2.4 Elemental content and stoichiometry
In the low-temperature experiments, the 1 d variation and 2 d thermal variations had different effects on cellular elemental contents and ratios, relative to the constant 18.5 ∘C treatment. The 1 d variation increased most of the cellular elemental and biochemical contents (TPC, PON and Chl a) but with no significant difference (p>0.05), except for POP content (p<0.05), compared with the constant 18.5 ∘C treatment (Table 1). In contrast, the 2 d variation treatment decreased all the measured cellular elemental and biochemical contents (TPC, PON, POP and Chl a, p<0.05) in relation to the constant 18.5 ∘C treatment (Table 1). However, the TPC ∕ PON and Chl a ∕ POC ratios of the 2 d variation treatment were higher than those of the 1 d variation and constant 18.5 ∘C treatments (p<0.05, Fig. 7a, e), while the PON ∕ POP ratio was lower than in the 1 d variation and constant 18.5 ∘C treatments (p<0.05, Fig. 7c). There were no significant differences in TPC ∕ PON, PON/POP and Chl a ∕ POC ratios between the constant 18.5 ∘C and the 1 d variation treatments (p>0.05, Fig. 7a).
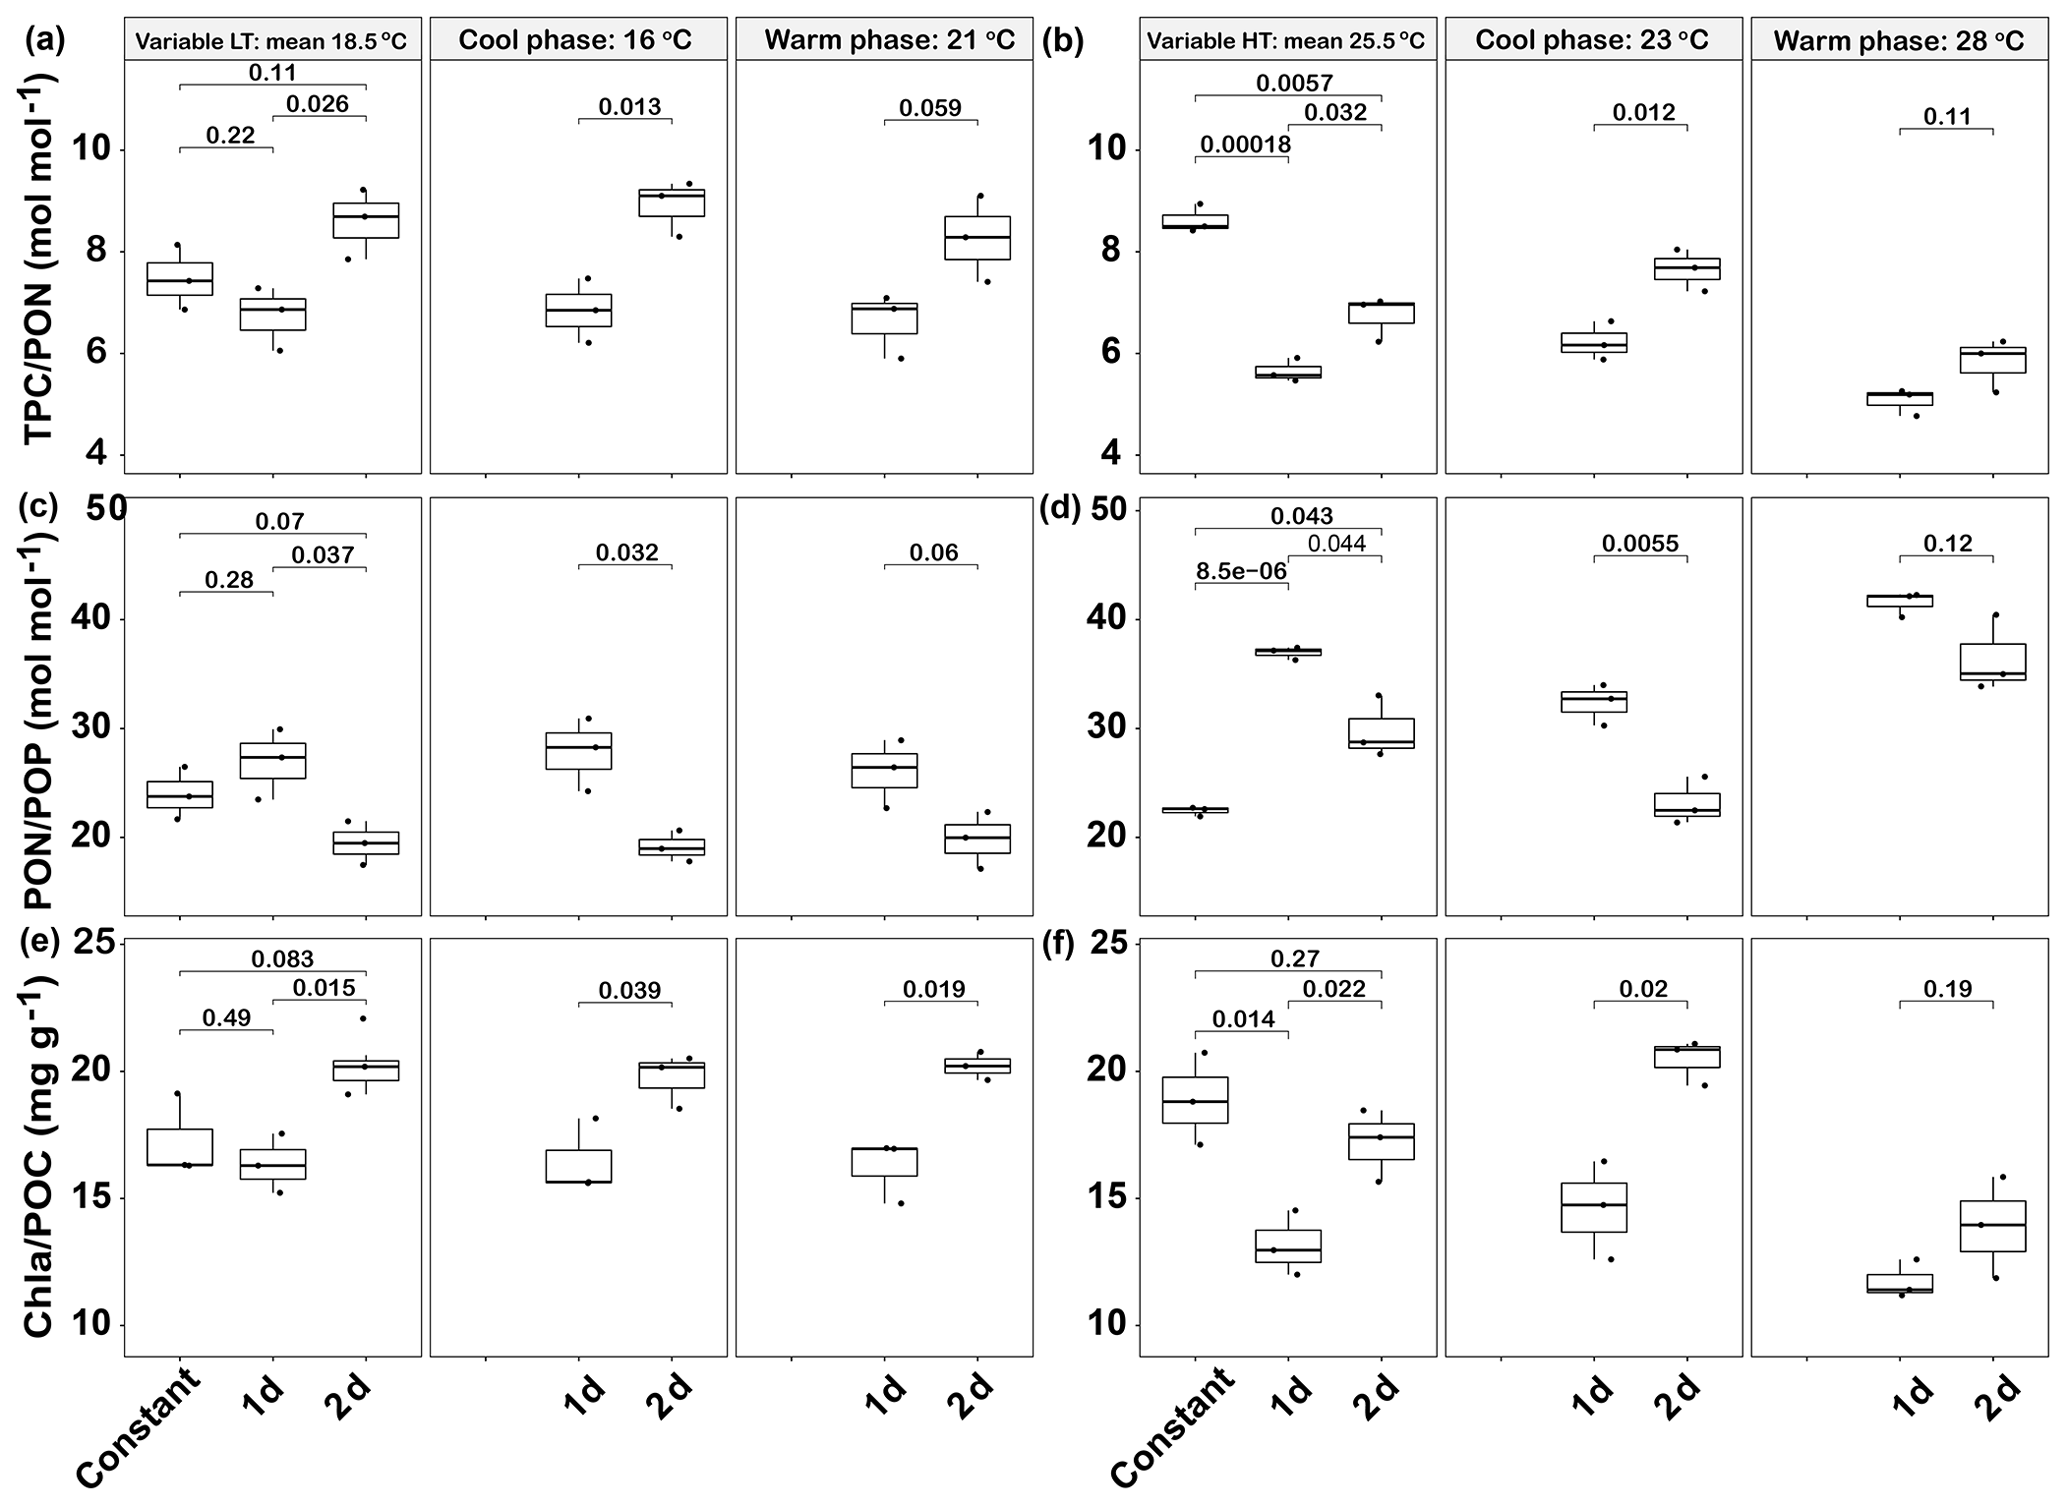
Figure 7Responses of Emiliania huxleyi elemental ratios in two thermal variation frequency treatments (1 and 2 d) compared to constant temperatures for TPC ∕ PON (a low and b high temperature), PON/POP (c low and d high temperature) and Chl a ∕ POC ratios (e low and f high temperature). LT: low temperature; HT: high temperature. The thick black line in the boxplots represents median values for each experimental treatment; the whiskers on the boxplots indicate 1.5× interquartile range. Listed p values with their respective brackets denote the statistical significance between two treatments.
In high-temperature experiments, the highest cellular TPC, PON and POP contents were all obtained under the 1 d variation treatment, which was significantly higher than under constant 25.5 ∘C conditions (p<0.05, Table 1). However, there were no significant differences in cellular Chl a content between the constant 25.5 ∘C and both variation treatments (p>0.05, Table 1). The TPC ∕ PON ratio of the constant 25.5 ∘C treatment was ∼22 % and ∼35 % higher than that of the 2 d variation and 1 d variation treatments, respectively (p<0.05, Fig. 7b), while the PON/POP ratio was highest in the 1 d variation, followed by the 2 d variation and finally by the constant control (Fig. 7d). The Chl a ∕ POC ratio of the 1 d variation treatment was significantly lower than that of the constant 25.5 ∘C and 2 d variation treatments (p<0.05), but there were no significant differences between the constant 25.5 ∘C and 2 d variation treatments (p>0.05, Fig. 7f).
During the cool phase of the high-temperature experiments (23 ∘C), the cellular TPC, PON, POP and Chl a content of 2 d variation were all significantly lower than in the 1 d variation treatment (p<0.05). Similar decreasing trends during the cool phase were observed for the TPC ∕ PON ratios (Fig. 7b) but not the Chl a ∕ POC ratio, which was ∼32 % higher than in the 1 d variation treatment (p<0.05, Fig. 7f). During the warm phase (28 ∘C), there were no significant differences of cellular TPC, PON and POP contents between 1 d and 2 d variation treatments (p>0.05, Table 1), as well as the TPC ∕ PON ratio (Fig. 7b). However, the Chl a content of the 1 d variation treatment was ∼20 % lower than that of the 2 d variation treatment (p<0.05). The Chl a ∕ POC ratio was not significantly different between the 1 d and 2 d variation treatments at the warm phase (p>0.05, Table 1, Fig. 7f).
3.3 Experimental constant temperature performance curves and measured and modeled fluctuating temperature performance curves
The experimentally determined constant condition temperature performance curves and the predicted fluctuating temperature condition temperature performance curves based on the Bernhardt et al. (2018) nonlinear averaging model are shown in Fig. 8 for E. huxleyi. Compared with the measured temperature performance curve under constant thermal conditions, the modeled curve of the fluctuating temperature condition showed a leftward shift towards lower temperatures at optimum temperatures and above. The maximum and optimal temperature of the modeled fluctuating temperature performance curve were all lower than those of the measured constant condition curve. In particular, the optimal temperature for growth decreased from 22 ∘C in constant conditions to 21 ∘C under fluctuating temperature conditions. At the same time, the maximum growth rate (μmax) of the fluctuating temperature condition was 0.8 d−1, which was lower than the constant condition value of 0.9 d−1. The measured growth rates of experimental 1 d (0.71 d−1) and 2 d (0.72 d−1) variation treatments at the relatively low mean temperature of 18.5 ∘C closely matched the model-predicted fluctuating temperature growth rate at this temperature (0.74−1, Fig. 8). However, measured and predicted growth rates did not match as well at the higher mean temperature. At 25.5 ∘C, the measured growth rate of the 1 d variation was 0.52 d−1, 30 % higher than the predicted fluctuating temperature growth rate of 0.40 d−1. In contrast, the measured growth rate of the experimental 2 d variation treatment was 0.20 d−1, a decrease of 50 % compared to the model-predicted fluctuating temperature growth rate of 0.40 d−1 at this temperature (Fig. 8).
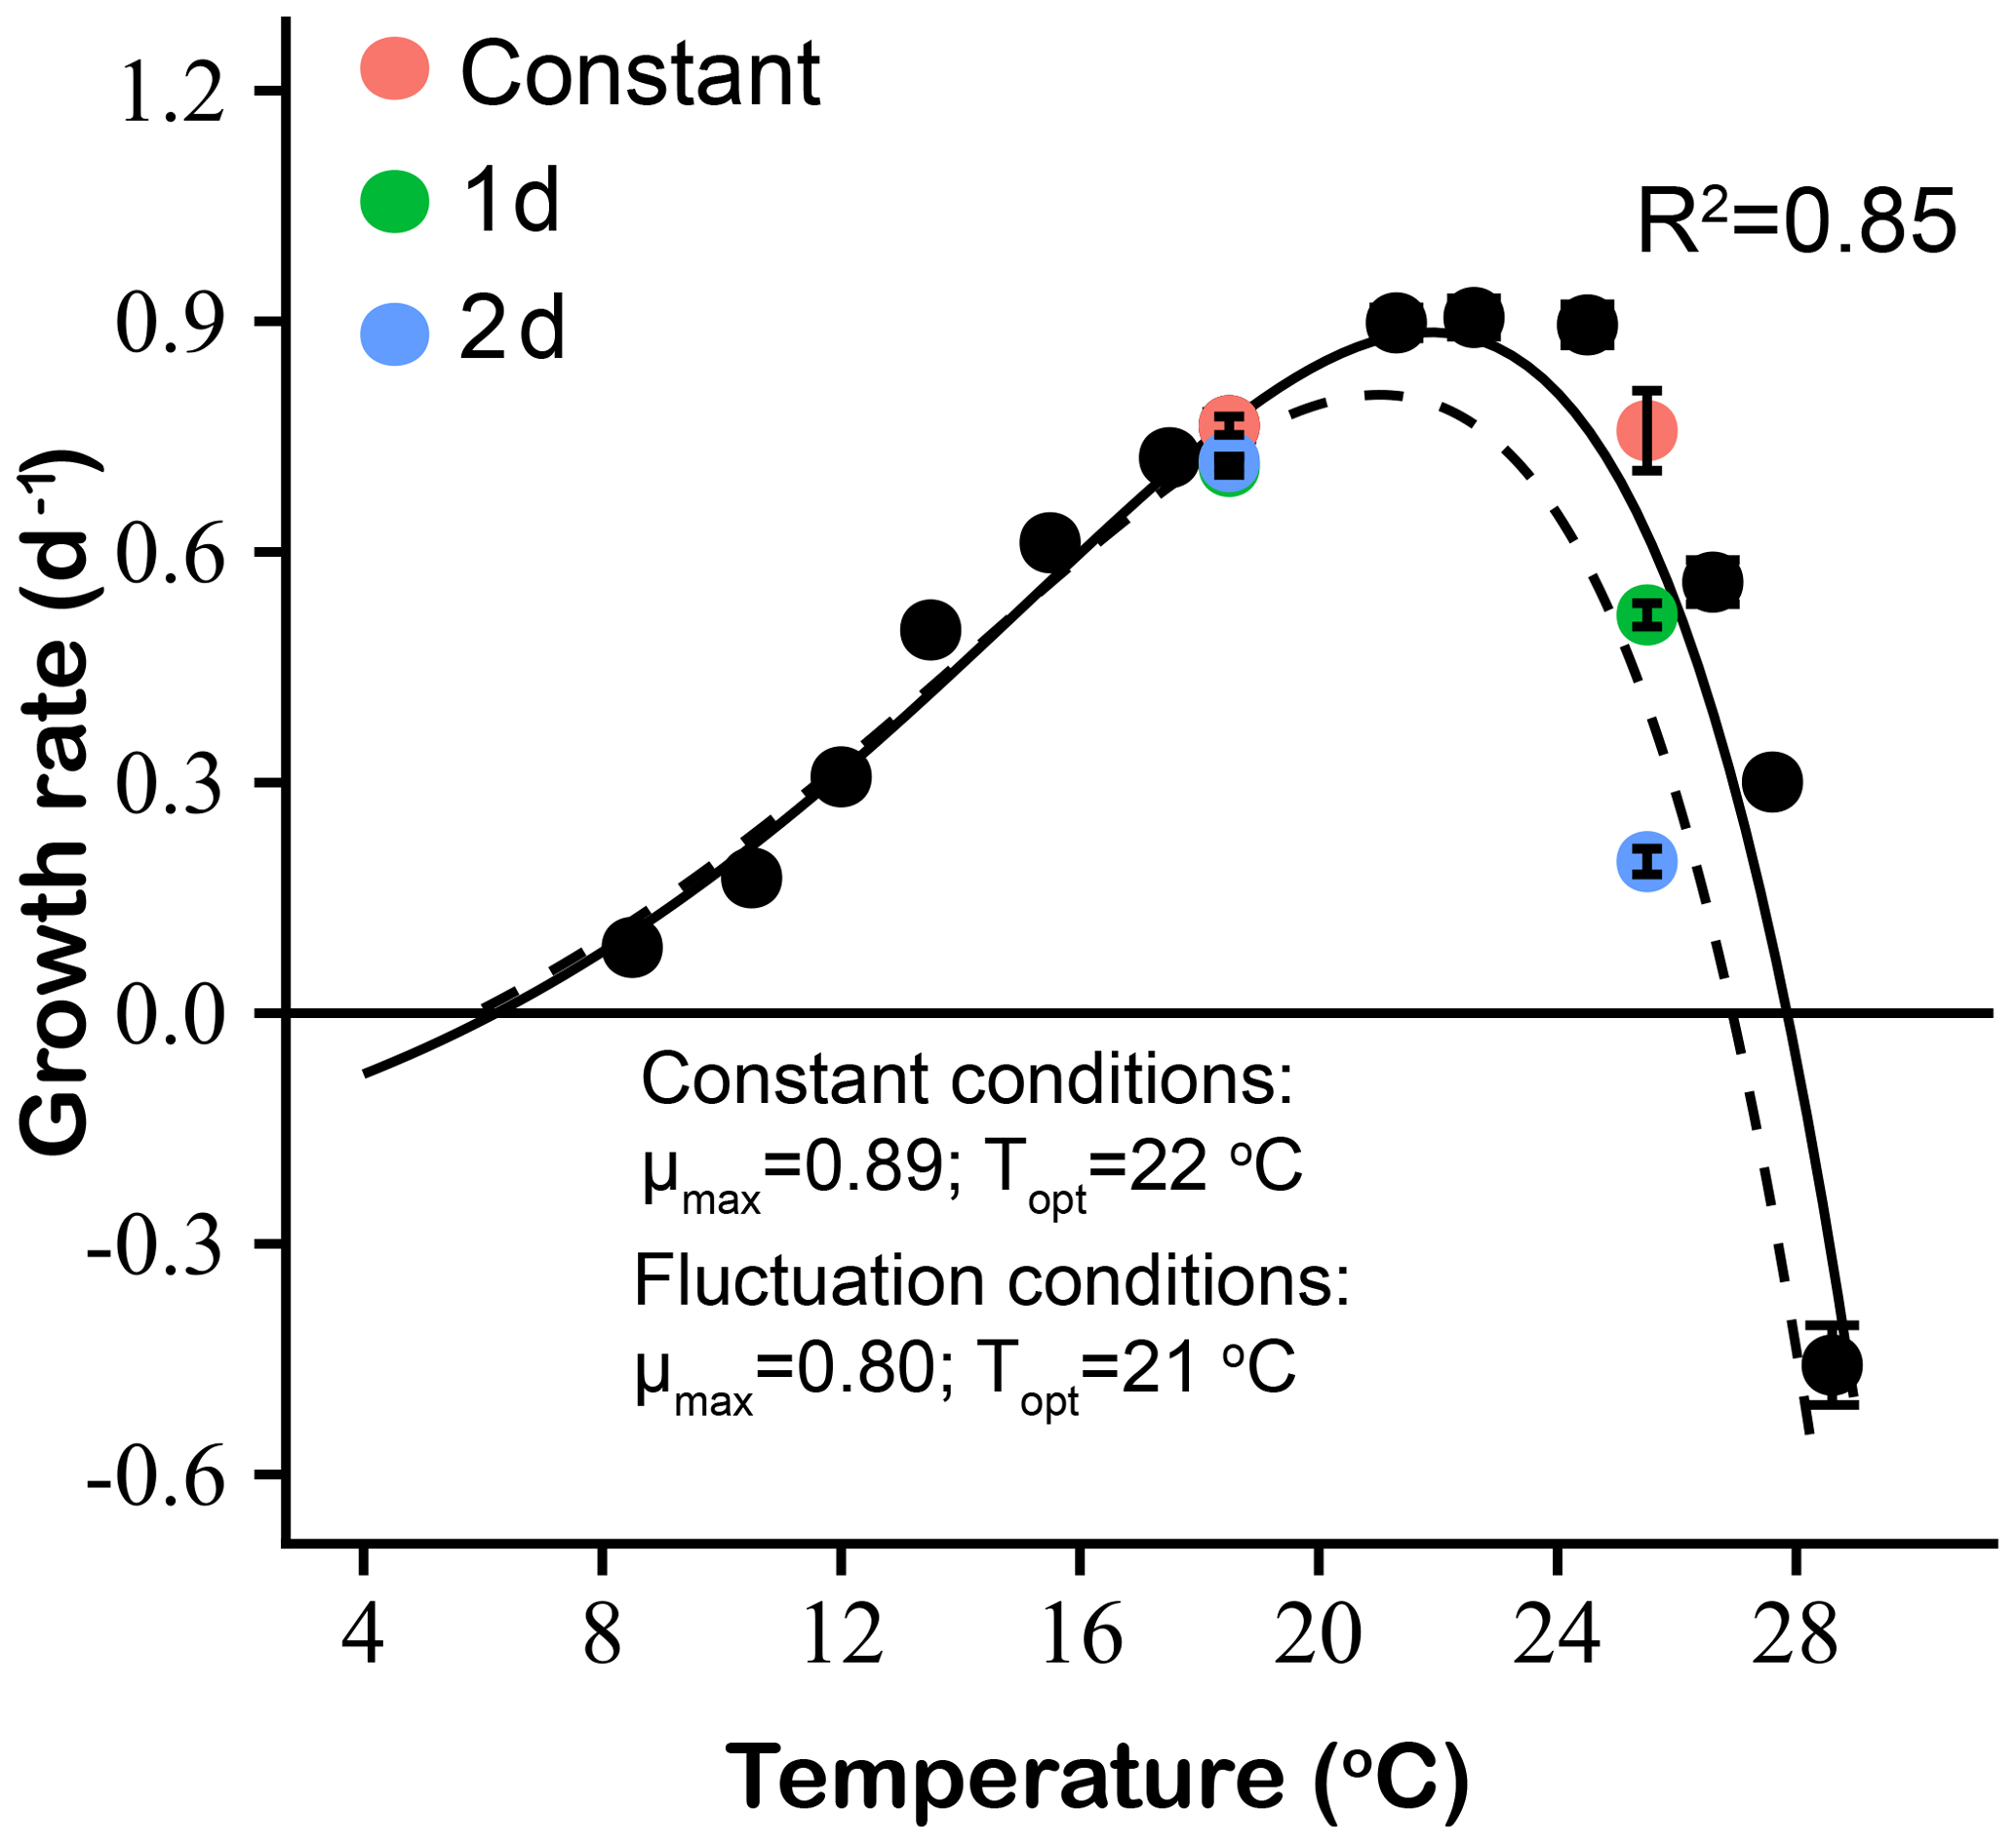
Figure 8Thermal performance curves based on specific growth rates (d−1) of Emiliania huxleyi, including our experimentally determined constant condition temperature performance curve (black symbols and solid line) and a predicted fluctuating condition temperature performance curve (dashed line) according to the model of Bernhardt et al. (2018). Measured growth rates from the two low- and high-temperature experiments are shown for constant thermal conditions (red symbols), 1 d (green symbols) and 2 d (blue symbols) variation treatments.
4.1 Effects of warming on Emiliania huxleyi growth rates and elemental ratios
Thermal response curves and optimum growth temperatures describe the importance of temperature as a control on the distribution of E. huxleyi strains in the ocean (Buitenhuis et al., 2008; Paasche, 2001). The optimal temperature range of 21.3–24.5 ∘C found in our study is similar to that of some other E. huxleyi strains (De Bodt et al., 2010; Feng et al., 2017; Rosas-Navarro et al., 2016; Zhang et al., 2014). Most studies have focused on the lower part of the temperature curve where growth rates increase with rising temperatures (Feng et al., 2017; Matson et al., 2016), with relatively few examining stressfully warm temperatures where growth is inhibited (Zhang et al., 2014).
In our study, the descending portion of the upper temperature performance curve ranged from 24.5 to 28.6 ∘C, at which point growth rates became negative. We repeated the upper thermal limit part of the curve several times to rigorously verify that cultures were unable to grow at this temperature. The magnitude of the negative growth rate is presented here as it represents an expression of the degree of stress the culture experienced at this temperature and thus makes a useful comparison with the other positive growth rate values in the variation experiments. This E. huxleyi strain was isolated from the Sargasso Sea where the sea surface temperature can reach 29 ∘C in the summer and will undoubtedly be higher in the future with global warming (https://seatemperature.info/sargasso-sea-water-temperature.html, last access: 17 January 2019). This suggests that this strain may be currently living at or very near its upper thermal limit for part of the year, as are many other tropical and subtropical phytoplankton (Thomas et al., 2012) and that it may therefore be vulnerable to further warming.
Calcification is the key biogeochemical functional trait of this species, and the PIC ∕ POC ratio of E. huxleyi can be influenced by factors that include CO2 concentration, nutrient status, irradiance and temperature (Feng et al., 2008, 2017; Raven and Crawfurd, 2012). The cellular PIC ∕ POC of E. huxleyi has been reported to decrease as irradiance and CO2 concentration rise but to increase under nitrate and phosphate limitation (Feng et al., 2017; Paasche, 1999; Riegman et al., 2000). The effect of temperature on E. huxleyi cellular PIC ∕ POC ratio is, however, more complex. De Bodt et al. (2010) and Gerecht et al. (2014) observed that higher cellular PIC ∕ POC ratios were obtained at lower temperatures for both E. huxleyi and Coccolithus pelagicus. Sett et al. (2014), however, found an opposite trend, whereby the PIC ∕ POC ratio increased with temperature in another strain of E. huxleyi. Feng et al. (2017) reported that the cellular PIC ∕ POC of E. huxleyi was increased as the temperature rose from 4 to 11 ∘C but decreased with warming from 11 to 15 ∘C and remained steady afterwards.
In our study, the cellular PIC ∕ POC ratio of E. huxleyi was positively correlated to growth rate (R2=0.73) and increased with warming from 8.5 ∘C to a maximum at 22.6 ∘C and then decreased with further warming to 27.6 ∘C. In a meta-analysis of studies using different coccolithophore subgroups, Krumhardt et al. (2017) found that the highest PIC ∕ POC ratios were observed between 15 and 20 ∘C, in the same thermal range where the highest growth rates of E. huxleyi are found, as seen here and in Sett et al. (2014). In contrast, Rosas-Navarro et al. (2016) reported that the cellular PIC ∕ POC ratio showed a minimum at optimal growth temperature (between 20 and 25 ∘C) for three strains of E. huxleyi. However, the E. huxleyi strain used here was isolated from a warmer area (the Sargasso Sea) compared with isolates from coastal Japan and New Zealand in previous studies (Rosas-Navarro et al., 2016; Feng et al., 2017). The growth temperature for our stock cultures was 22–24 ∘C, higher than that of the other two E. huxleyi strains. Feng et al. (2017) also found that the optimal temperature for calcification was close to the stock culture maintenance temperature in their study.
Our results also support suggestions that stressful high temperatures may lead to decreases in cellular PIC ∕ POC ratios and calcification (De Bodt et al., 2010; Feng et al., 2017; Gerecht et al., 2014; Krumhardt et al., 2017). The cellular PIC ∕ POC ratio of E. huxleyi was much more plastic than the other ratios we measured, including TPC ∕ PON and POC/PON. Indeed, PIC ∕ POC ratios may change dramatically (> 2-fold) with temperature for some coccolithophore subgroups (Krumhardt et al., 2017). The plasticity in PIC ∕ POC ratios of E. huxleyi during temperature changes in our study may have implications for shifts in the ballasting of coccolith-containing particles during sinking, thus affecting the ocean carbon cycle.
The cellular Chl a ∕ POC ratio of E. huxleyi showed a similar pattern with the PIC ∕ POC ratio, as it was also positively correlated to growth rate. Zhu et al. (2017) reported the cellular Chl a ∕ POC ratio of a southern California diatom was also correlated to growth rate across a very similar temperature range. In contrast, Feng et al. (2017) found that the cellular Chl a ∕ POC ratio of E. huxleyi dramatically decreased with warming. However, in our experiments, the cellular Chl a ∕ POC ratio was lower at 27.6 ∘C than at 28.6 ∘C, likely due to the negative growth rates and consequent lack of acclimation of the cultures maintained at the highest temperature. Traits such as PIC ∕ POC ratios, Chl a ∕ POC ratios and TPC ∕ PON ratios also showed some evidence for possible carryover from the stock cultures (22–24 ∘C) in this 28.6 ∘C treatment, as we were forced to sample before the cells died completely, after only 2–3 cycles of dilution.
4.2 Effect of thermal variation on Emiliania huxleyi growth and physiology
4.2.1 Constant vs. variable temperature
Thermal variability in the surface ocean is becoming an increasingly relevant topic as global warming proceeds. In our study, we found that the growth rates of a subtropical E. huxleyi strain were quite sensitive to temperature variation under both low (18.5 ∘C, “winter”) and high (25.5 ∘C, “summer”) mean temperatures. In both low- and high-temperature experiments, growth rates always decreased under temperature variation, compared with the constant mean temperature. This result agrees with previous studies showing that temperature variation slowed the growth rates of the fresh water green alga Chlorella pyrenoidosa and the marine diatom Cyclotella meneghiniana, as observed in laboratory work and during long-term field observations (Zhang et al., 2016).
This growth rate inhibition under temperature variation was more pronounced at high temperature than at low temperature, indicating that variability at the warm range boundary will have a stronger negative effect on population growth rate than variability near the lower thermal limits (Bernhardt et al., 2018). This trend suggests that acclimation to high temperature (whether constant or variable) may require greater investment in cellular repair machinery, such as heat shock proteins, thus potentially diverting nutrient and energy supplies and thereby reducing growth rates (O'Donnell et al., 2018). However, following Jensen's inequality model to predict the thermal performance curve, there should be an inflection point where the transfer between positive and negative effects of temperature variability will occur compared with the constant thermal curve. Conversely, for phytoplankton living in regions of suboptimal temperatures, thermal variation can enhance growth (Bernhardt et al., 2018). Thus, for some polar phytoplankton or for temperate species extending their ranges poleward, such as E. huxleyi (Neukermans et al., 2018), not only warming but also thermal variability may need to be taken into consideration in order to understand changes in high-latitude microbial communities and biogeochemistry cycles.
Temperature variation affected the physiology of E. huxleyi differently compared with constant temperature. Physiological traits that were affected by thermal fluctuations also differed at low temperature (“winter”) and high temperature (“summer”), suggesting different response mechanisms. Under low temperature variations (16–21 ∘C), photosynthesis and calcification were correlated with temperature, leading to rates similar to those observed with constant temperature. However, elemental contents and ratios under thermal variations differed from constant temperature. For instance, the cellular POC, PON, POP and Chl a contents increased during 1 d variations but decreased during 2 d variations, compared with constant temperature.
These cellular quota changes were reflected in elemental ratio differences (PIC ∕ POC, Chl a ∕ POC and TPC ∕ POC) between the thermal variation treatments and constant temperature. However, the changes between thermal variation and constant treatments were not significant under low temperature (“winter”), indicating that the thermal variation would not significantly influence biogeochemical cycles under these conditions. Unlike constant temperature treatments where selection may favor a higher growth rate, the trade-off for the thermal variation treatments may involve sacrificing increased growth rate in order to adjust cellular stoichiometry to adapt to the fluctuating environment.
In contrast, photosynthetic and calcification rates under high-temperature thermal variations (23–28 ∘C) were significantly different from those seen under constant temperature (25 ∘C), especially the calcification rate. Thermal variation treatments transiently but repeatedly experienced the extreme high temperature point (28 ∘C), leading to extremely low calcification rates and PIC contents and thus relatively low PIC ∕ POC and Cal ∕ Photo ratios. Previous E. huxleyi studies agree that high temperature decreases PIC content, PIC ∕ POC ratios and Cal ∕ Photo ratios (Feng et al., 2017; 2018; Gerecht et al., 2014). The two different patterns of responses to thermal variation we observed under low and high temperatures imply a seasonal pattern in the ways that thermal variations will affect the elemental stoichiometry of E. huxleyi .
Under other stresses such as nutrient limitation, trade-offs between growth rates and resource affinities may be necessary to adapt to thermal changes. For instance, nitrate affinity declines in cultures of the large centric diatom Coscinodiscus that have acclimated to warmer temperatures (Qu et al., 2018), while warming decreases cellular requirements for iron in the nitrogen-fixing cyanobacterium Trichodesmium (Jiang et al., 2018). In nitrogen-limited cultures of the marine diatom Thalassiosira pseudonana, long-term thermal adaptation acted most strongly on systems other than those involved in nitrate uptake and utilization (O'Donnell et al., 2018). Thus, it is possible that our thermal response results with E. huxleyi might have differed under nutrient-limited growth conditions.
4.2.2 The 1 d variation vs. the 2 d thermal variation
As temperature fluctuations in the surface ocean increase along with climate change, phytoplankton will be influenced by the frequencies and intensities of these thermal excursions. We found that the responses of E. huxleyi to 1 d vs. 2 d temperature variations were different at both low and high temperatures. For instance, under low temperature the transition from the warm phase to the cool phase during the thermal variation could be treated as a low-temperature stress leading to a lag phase in growth. The growth rate of the 1 d variation treatment at the cool phase was lower than that of the 2 d variation, suggesting that physiological acclimation is not rapid enough to accommodate to the shorter variation treatment, while the 2 d variation allows enough time for growth to recover. However, at the warm phase (21 ∘C) there was no difference in growth rates between the 1 d and 2 d variations compared with the constant 21∘ treatment. These results imply that there was a shorter lag phase after transfer at the optimal temperature point (21 ∘C at the warm phase) than during low-temperature stress (16 ∘C at the cool phase).
There was no significant difference in photosynthetic rates between the 1 d and 2 d variation during the warm phase (21 ∘C), but both were higher than during the cool phase, indicating the photosynthetic rate was correlated to the thermal variation cycle. However, for the calcification rate there was no significant difference between 1 d and 2 d variations during either the cool or warm phases. These results suggested that photosynthesis was more responsive to temperature variations than calcification and thus ultimately determined the growth rate in both cool and warm phases. Feng et al. (2017) reported a similar relationship between growth and photosynthetic rates of a Southern Hemisphere E. huxleyi strain cultured at different temperatures.
Temperature variation frequencies also strongly influenced elemental composition. In low-temperature experiments, the cellular contents of PON, POP and POC in the 2 d variation treatment were all higher than under 2 d variations. A notable exception to this trend was the cellular PIC content, which was not significantly different between 1 d and 2 d variation treatments. The PIC content was positively correlated to calcification and relatively stable, indicating that coccolith production and storage of E. huxleyi was relatively independent of the frequency of thermal variation.
Unlike the photosynthetic rate, the cellular elemental content of 1 d and 2 d variations were significantly different but were not changed during temperature variation when transitioning from the warm phase to the cool phase or vice versa. The temperature-dependent photosynthetic enzyme activity likely determined the similar photosynthetic rate of 1 d and 2 d variation treatments at both cool and warm phase in our short-term experiment, but the divergent responses of cellular stoichiometry in 1 d and 2 d thermal variations indicated different mechanisms of rapid acclimation to different thermal fluctuation frequencies. Our results imply that the responses of E. huxleyi to 1 d and 2 d thermal variations have different patterns, but both reach stable states during extended periods of temperature fluctuation. Due to decreasing POC content, the PIC ∕ POC ratio increased in the 2 d variation compared with the 1 d variation, suggesting that more rapid thermal fluctuations might lead to a decrease in calcite ballasting of sinking organic carbon.
Under the high-temperature scenario, thermal variation forces the microalgae to intermittently deal with a lethal high temperature during the warm phase (28 ∘C), with potentially irreversible damage to the cells. In the “summer” experiments, the mean growth rate of the 2 d variation was much lower than that of the 1 d variation. This mainly resulted from the negative growth rate of 2 d variation cultures during the warm phase (28 ∘C), whereas the growth rate of the 1 d variation was > 0.20 d−1. This result demonstrates that high-frequency temperature variations (1 d) can partly mitigate growth inhibition by high temperatures in E. huxleyi and thus allow tolerance to extreme thermal events relative to longer exposures. This observation agrees with previous studies of other marine organisms such as corals (Oliver and Palumbi, 2011; Safaie et al., 2018). In the case of our experiments, the lag phase and metabolic inertia would help to maintain the microalgae during short exposures (1 d) to high temperature when transitioning from the cool phase (23 ∘C) to the warm phase (28 ∘C).
Likewise, the particulate organic element contents (PON, POP and POC) of E. huxleyi were more stable in 1 d than in 2 d temperature variation treatments. The relatively steady status of cellular particulate organic matter content in the high-frequency temperature variation treatment may conserve energy, compared to the energy-intensive redistribution of major cellular components under lower-frequency temperature variations. This differential energetic cost may help to explain the differences in growth rates between the two treatments. Adaptation to high temperature may also require higher investment in repair machinery, such as heat shock proteins, leading to an increased demand for nitrogen and other nutrients, thus increasing cellular POC, PON and POP contents (O'Donnell et al., 2018).
4.3 Prediction and modeling of E. huxleyi responses to thermal variation
Mathematical curves based on population growth rates from laboratory studies have been used to predict future population abundance, persistence or fitness in a changing world (Bernhardt et al., 2018; Deutsch et al., 2008; Jiang et al., 2017). We applied a modified version of the Eppley thermal performance curve model with the addition of nonlinear averaging (Bernhardt et al., 2018) to predict the influence of thermal variation on the growth rate of E. huxleyi (Fig. 8). E. huxleyi growth rates were predicted to be much lower at warmer temperatures under variable conditions compared to constant conditions, but there were no significant differences at cooler temperatures. Thus, the effect of thermal variation on population growth at the upper thermal limit was predicted to be stronger than that in the lower portion of the thermal range (Bernhardt et al., 2018; Sunday et al., 2012). This phenomenon has been widely observed in ectothermic animal taxa (Dell et al., 2011), but this model for the effect of thermal variation on population growth rate may lack the ability to predict species responses at the extreme edges of their ranges (Bernhardt et al., 2018).
Our results showed that the measured effects of a variable thermal regime on E. huxleyi growth rate fitted well with model-predicted values at a relatively low temperature (mean = 18.5 ∘C) but differed considerably at high temperature (mean = 25.5 ∘C). This was especially evident under the 2 d variation conditions at a mean of 25.5 ∘C, where the growth rate was sharply lower than predicted from the constant temperature performance curve-based model. This result suggests that transient heat waves may erode thermal tolerances of E. huxleyi populations already growing near their upper thermal limits and that the frequency and duration of such extreme events is critically important in determining the magnitude of this stress. Qu et al. (2019) reported that the tropical cyanobacterium Trichodesmium erythraeum only showed a slight decrease in growth rate with thermal variation treatments at high temperature (average 30 ∘C), compared with constant 30 ∘C treatments. In contrast, the sensitivity of this E. huxleyi isolate to increasing thermal variability may reduce its fitness and its ability to compete with other taxa such as diatoms and cyanobacteria, with implications for community structure in the future subtropical ocean.
Although thermal variation at high temperature negatively impacted the growth rate of E. huxleyi in our experiment, our relatively short-term study did not address the potential for E. huxleyi to evolve under selection by frequent extreme heat events. Evolutionary change in the thermal optimum and the maximum growth temperature in response to ocean warming may reduce heat-induced mortality and mitigate some ecological impacts of global warming (O'Donnell et al., 2018; Thomas et al., 2012). For example, Schlüter et al. (2014) found that after 1 year of experimental adaptation to warming (26.3 ∘C), the marine coccolithophore E. huxleyi evolved a higher growth rate when assayed at the upper thermal tolerance limit. Similar results were reported for the marine diatom Thalassiosira pseudonana in recent studies (O'Donnell et al., 2018; Schaum et al., 2018). Schaum et al. (2018) also found that the evolution of thermal tolerance in marine diatoms can be particularly rapid in fluctuating environments. Furthermore, populations originating from more variable environments are generally more plastic (Schaum and Collins, 2014; Schaum et al., 2013). Long-term evolutionary experiments with E. huxleyi will be necessary to determine how the thermal performance curve of this important marine calcifier may diverge under selection by different frequencies and durations of extreme thermal variation events.
Understanding the combination of ocean warming and magnified thermal variability may be a prerequisite to accurately predicting the effects of climate change on the growth and physiology of the key marine calcifier E. huxleyi. This information will help to inform biogeochemical models of the marine and global carbon cycles and ecological models of phytoplankton distributions and primary productivity. How changing thermal variation frequencies and heat wave events will affect marine phytoplankton remains a relatively under-explored topic but one that is likely to become increasingly important in the changing future ocean.
The data are available by request from the corresponding author (DAH) or at https://www.bco-dmo.org/project/668547 (Hutchins, 2019).
XW, FF and DAH contributed to conceiving and planning the experiments. XW, FF, PQ, JDK and H-BJ performed the lab experiments. XW, FF, YG and DAH contributed to the data analysis and to writing the paper. All of the authors contributed comments, revisions and editing.
The authors declare that they have no conflict of interest.
We would like to thank the two reviewers for their constructive comments and suggestions.
This research has been supported by the US National Science Foundation Biological Oceanography (grant nos. OCE1538525 and OCE1638804), the National Key Research and Development Program of China (grant no. 2016YFA0601302), and the China Scholarship Council.
This paper was edited by Julia Uitz and reviewed by two anonymous referees.
Bernhardt, J. R., Sunday, J. M., Thompson, P. L., and O’connor, M. I.: Nonlinear averaging of thermal experience predicts population growth rates in a thermally variable environment, Proc. R. Soc. B Biol. Sci., 285, 20181076, https://doi.org/10.1098/rspb.2018.1076, 2018.
Boyce, D. G., Lewis, M. R., and Worm, B.: Global phytoplankton decline over the past century, Nature, 466, 591–596, https://doi.org/10.1038/nature09268, 2010.
Boyd, P., Dillingham, P., McGraw, C., Armstrong, E., Cornwall, C., Feng, Y.-Y., Hurd, C., Gault-Ringold, M., Roleda, M., and Timmins-Schiffman, E.: Physiological responses of a Southern Ocean diatom to complex future ocean conditions, Nat. Clim. Change, 6, 207–216, https://doi.org/10.1038/nclimate2811, 2015.
Boyd, P. W., Strzepek, R., Fu, F., and Hutchins, D. A.: Environmental control of open-ocean phytoplankton groups: Now and in the future, Limnol. Oceanogr., 55, 1353–1376, https://doi.org/10.4319/lo.2010.55.3.1353, 2010.
Boyd, P. W., Collins, S., Dupont, S., Fabricius, K., Gattuso, J. P., Havenhand, J., Hutchins, D. A., Riebesell, U., Rintoul, M. S., and Vichi, M.: Experimental strategies to assess the biological ramifications of multiple drivers of global ocean change – A review, Glob. Change Biol., 24, 2239–2261, https://doi.org/10.1111/gcb.14102, 2018.
Bozinovic, F., Bastías, D. A., Boher, F., Clavijo-Baquet, S., Estay, S. A., and Angilletta Jr., M. J.: The mean and variance of environmental temperature interact to determine physiological tolerance and fitness, Physiol. Biochem. Zool., 84, 543–552, https://doi.org/10.1086/662551, 2011.
Buitenhuis, E. T., Pangerc, T., Franklin, D. J., Le Quéré, C., and Malin, G.: Growth rates of six coccolithophorid strains as a function of temperature, Limnol. Oceanogr., 53, 1181–1185, https://doi.org/10.4319/lo.2008.53.3.1181, 2008.
Burgmer, T. and Hillebrand, H.: Temperature mean and variance alter phytoplankton biomass and biodiversity in a long-term microcosm experiment, Oikos, 120, 922–933, https://doi.org/10.1111/j.1600-0706.2010.19301.x, 2011.
Cáceres, C. E.: Temporal variation, dormancy, and coexistence: a field test of the storage effect, P. Natl. Acad. Sci. USA, 94, 9171–9175, 1997.
De Bodt, C., Van Oostende, N., Harlay, J., Sabbe, K., and Chou, L.: Individual and interacting effects of pCO2 and temperature on Emiliania huxleyi calcification: study of the calcite production, the coccolith morphology and the coccosphere size, Biogeosciences, 7, 1401–1412, https://doi.org/10.5194/bg-7-1401-2010, 2010.
Dell, A. I., Pawar, S., and Savage, V. M.: Systematic variation in the temperature dependence of physiological and ecological traits, P. Natl. Acad. Sci. USA, 108, 10591–10596, 2011.
Deutsch, C. A., Tewksbury, J. J., Huey, R. B., Sheldon, K. S., Ghalambor, C. K., Haak, D. C., and Martin, P. R.: Impacts of climate warming on terrestrial ectotherms across latitude, P. Natl. Acad. Sci. USA, 105, 6668–6672, https://doi.org/10.1073/pnas.0709472105, 2008.
Eppley, R. W.: Temperature and phytoplankton growth in the sea, Fish. Bull, 70, 1063–1085, 1972.
Feng, Y., Warner, M. E., Zhang, Y., Sun, J., Fu, F.-X., Rose, J. M., and Hutchins, D. A.: Interactive effects of increased pCO2, temperature and irradiance on the marine coccolithophore Emiliania huxleyi (Prymnesiophyceae), Eur. J. Phycol., 43, 87–98, https://doi.org/10.1080/09670260701664674, 2008.
Feng, Y., Roleda, M. Y., Armstrong, E., Boyd, P. W., and Hurd, C. L.: Environmental controls on the growth, photosynthetic and calcification rates of a Southern Hemisphere strain of the coccolithophore Emiliania huxleyi, Limnol. Oceanogr., 62, 519–540, https://doi.org/10.1002/lno.10442, 2017.
Feng, Y., Roleda, M. Y., Armstrong, E., Law, C. S., Boyd, P. W., and Hurd, C. L.: Environmental controls on the elemental composition of a Southern Hemisphere strain of the coccolithophore Emiliania huxleyi, Biogeosciences, 15, 581–595, https://doi.org/10.5194/bg-15-581-2018, 2018.
Friedland, K. D., Mouw, C. B., Asch, R. G., Ferreira, A. S. A., Henson, S., Hyde, K. J., Morse, R. E., Thomas, A. C., and Brady, D. C.: Phenology and time series trends of the dominant seasonal phytoplankton bloom across global scales, Global Ecol. Biogeogr., 27, 551–569, https://doi.org/10.1111/geb.12717, 2018.
Fu, F. X., Warner, M. E., Zhang, Y., Feng, Y., and Hutchins, D. A.: Effects of increased temperature and CO2 on photosynthesis, growth, and elemental ratios in marine Synechococcus and Prochlorococcus (Cyanobacteria), J. Phycol., 43, 485–496, https://doi.org/10.1111/j.1529-8817.2007.00355.x, 2007.
Fu, F.-X., Tatters, A. O., and Hutchins, D. A.: Global change and the future of harmful algal blooms in the ocean, Mar. Ecol. Prog. Ser., 470, 207–233, https://doi.org/10.3354/meps10047, 2012.
Fu, F.-X., Yu, E., Garcia, N. S., Gale, J., Luo, Y., Webb, E. A., and Hutchins, D. A.: Differing responses of marine N2 fixers to warming and consequences for future diazotroph community structure, Aquat. Microb. Ecol., 72, 33–46, https://doi.org/10.5194/bgd-12-4273-2015, 2014.
Gao, K., Zhang, Y., and Häder, D.-P.: Individual and interactive effects of ocean acidification, global warming, and UV radiation on phytoplankton, J. Appl. Phycol., 30, 743–759, https://doi.org/10.1007/s10811-017-1329-6, 2018.
Gerecht, A. C., Šupraha, L., Edvardsen, B., Probert, I., and Henderiks, J.: High temperature decreases the PIC ∕ POC ratio and increases phosphorus requirements in Coccolithus pelagicus (Haptophyta), Biogeosciences, 11, 3531–3545, https://doi.org/10.5194/bg-11-3531-2014, 2014.
Gobler, C. J., Doherty, O. M., Hattenrath-Lehmann, T. K., Griffith, A. W., Kang, Y., and Litaker, R. W.: Ocean warming since 1982 has expanded the niche of toxic algal blooms in the North Atlantic and North Pacific oceans, P. Natl. Acad. Sci. USA, 114, 4975–4980, https://doi.org/10.1073/pnas.1619575114, 2017.
Hallegraeff, G. M.: Ocean climate change, phytoplankton community responses, and harmful algal blooms: a formidable predictive challenge, J. Phycol., 46, 220–235, https://doi.org/10.1111/j.1529-8817.2010.00815.x, 2010.
Hare, C. E., Leblanc, K., Ditullio, G. R., Kudela, R. M., Zhang, Y., Lee, P. A., Riseman, S., and Hutchins, D. A.: Consequences of increased temperature and CO2 for phytoplankton community structure in the Bering Sea, Mar. Ecol. Prog., 352, 9–16, https://doi.org/10.3354/meps07182, 2007.
Holligan, P., Viollier, M., Harbour, D., Camus, P., and Champagne-Philippe, M.: Satellite and ship studies of coccolithophore production along a continental shelf edge, Nature, 304, 339–342, https://doi.org/10.1038/304339a0, 1983.
Holligan, P. M., Fernández, E., Aiken, J., Balch, W. M., Boyd, P., Burkill, P. H., Finch, M., Groom, S. B., Malin, G., and Muller, K.: A biogeochemical study of the coccolithophore, Emiliania huxleyi, in the North Atlantic, Global Biogeochem. Cy., 7, 879–900, https://doi.org/10.1029/93GB01731, 1993.
Hoppe, C., Langer, G., and Rost, B.: Emiliania huxleyi shows identical responses to elevated pCO2 in TA and DIC manipulations, J. Exp. Mar. Bio. Ecol., 406, 54–62, https://doi.org/10.1016/j.jembe.2011.06.008, 2011.
Hutchins, D. A.: Project: How does intensity and frequency of environmental variability affect phytoplankton growth?, NSF-sponsored data archive, available at: https://www.bco-dmo.org/project/668547, last access: 17 January 2019.
Hutchins, D. A. and Fu, F.: Microorganisms and ocean global change, Nat. Microbiol., 2, 17058, https://doi.org/10.1038/nmicrobiol.2017.58, 2017.
Hutchins, D. A., DiTullio, G. R., Zhang, Y., and Bruland, K. W.: An iron limitation mosaic in the California upwelling regime, Limnol. Oceanogr., 43, 1037, 10.4319/lo.1998.43.6.1037, 1998.
Iglesias-Rodríguez, M. D., Brown, C. W., Doney, S. C., Kleypas, J., Kolber, D., Kolber, Z., Hayes, P. K., and Falkowski, P. G.: Representing key phytoplankton functional groups in ocean carbon cycle models: Coccolithophorids, Global Biogeochem. Cy., 16, 1100, https://doi.org/10.1029/2001GB001454, 2002.
IPCC: Summary for Policymakers, in: Climate Change 2013 – The Physical Science Basis: Working Group I Contribution to the Fifth Assessment Report of the Intergovernmental Panel on Climate Change, Cambridge, Cambridge University Press, IPCC report, 2013
Jiang, L., Sun, Y.-F., Zhang, Y.-Y., Zhou, G.-W., Li, X.-B., McCook, L. J., Lian, J.-S., Lei, X.-M., Liu, S., and Cai, L.: Impact of diurnal temperature fluctuations on larval settlement and growth of the reef coral Pocillopora damicornis, Biogeosciences, 14, 5741–5752, https://doi.org/10.5194/bg-14-5741-2017, 2017.
Jiang, H.-B., Fu, F.-X. Rivero-Calle, S., Levine, N., Sañudo-Wilhelmy, S.A., Qu, P.-P., Wang, X.-W., Pinedo Gonzalez, P., Zhu, Z., and Hutchins, D.A., Ocean warming alleviates iron limitation of marine nitrogen fixation, Nat. Clim. Change, 8, 709–712, doi.org/10.1038/s41558-018-0216-8, 2018.
Keys, M., Tilstone, G., Findlay, H. S., Widdicombe, C. E., and Lawson, T.: Effects of elevated CO2 and temperature on phytoplankton community biomass, species composition and photosynthesis during an experimentally induced autumn bloom in the western English Channel, Biogeosciences, 15, 3203–3222, https://doi.org/10.5194/bg-15-3203-2018, 2018.
Klaas, C. and Archer, D. E.: Association of sinking organic matter with various types of mineral ballast in the deep sea: Implications for the rain ratio, Global Biogeochem. Cy., 16, 1116, https://doi.org/10.1029/2001GB001765, 2002.
Kling, J. D., Lee, M. D., Fu, F.-X., Phan, M., Wang, X., Qu, P. P., and Hutchins, D. A.: Transient exposure to novel high temperatures reshapes coastal phytoplankton communities, ISME Journal, in press, https://doi.org/10.1038/s41396-019-0525-6, 2019.
Kremer, C. T., Fey, S. B., Arellano, A. A., and Vasseur, D. A.: Gradual plasticity alters population dynamics in variable environments: thermal acclimation in the green alga Chlamydomonas reinhartdii, Proc. Biol. Sci., 285, 10271942, https://doi.org/10.1098/rspb.2017.1942, 2018.
Krumhardt, K. M., Lovenduski, N. S., Iglesias-Rodriguez, M. D., and Kleypas, J. A.: Coccolithophore growth and calcification in a changing ocean, Prog. Oceanogr., 159, 276–295, https://doi.org/10.1016/j.pocean.2017.10.007, 2017.
Matson, P. G., Ladd, T. M., Halewood, E. R., Sangodkar, R. P., Chmelka, B. F., and Iglesias-Rodriguez, M. D.: Intraspecific differences in biogeochemical responses to thermal change in the coccolithophore Emiliania huxleyi, PLoS One, 11, e0162313, https://doi.org/10.1371/journal.pone.0162313, 2016.
Monteiro, F. M., Bach, L. T., Brownlee, C., Bown, P., Rickaby, R. E., Poulton, A. J., Tyrrell, T., Beaufort, L., Dutkiewicz, S., and Gibbs, S.: Why marine phytoplankton calcify, Sci. Adv., 2, e1501822, https://doi.org/10.1126/sciadv.1501822, 2016.
Morán, X. A. G., Lopez-Urrutia, Á., Calvo-Diaz, A., and Li, W. K.: Increasing importance of small phytoplankton in a warmer ocean, Glob. Change Biol., 16, 1137–1144, https://doi.org/10.1111/j.1365-2486.2009.01960.x, 2010.
Neukermans, G., Oziel, L., and Babin, M.: Increased intrusion of warming Atlantic water leads to rapid expansion of temperate phytoplankton in the Arctic, Glob. Change Biol., 24, 2545–2553, https://doi.org/10.1111/gcb.14075, 2018.
Norberg, J.: Biodiversity and ecosystem functioning: a complex adaptive systems approach, Limnol. Oceanogr., 49, 1269–1277, 2004.
O'Donnell, D. R., Hamman, C. R., Johnson, E. C., Kremer, C. T., Klausmeier, C. A., and Litchman, E.: Rapid thermal adaptation in a marine diatom reveals constraints and tradeoffs, Glob. Change Biol., 24, 4554–4565, https://doi.org/10.1111/gcb.14360, 2018.
Oliver, T. and Palumbi, S.: Do fluctuating temperature environments elevate coral thermal tolerance?, Coral Reefs, 30, 429–440, https://doi.org/10.1007/s00338-011-0721-y, 2011.
Paasche, E.: Reduced coccolith calcite production under light-limited growth: a comparative study of three clones of Emiliania huxleyi (Prymnesiophyceae), Phycologia, 38, 508–516, 1999.
Paasche, E.: A review of the coccolithophorid Emiliania huxleyi (Prymnesiophyceae), with particular reference to growth, coccolith formation, and calcification-photosynthesis interactions, Phycologia, 40, 503–529, https://doi.org/10.2216/i0031-8884-40-6-503.1, 2001.
Platt, T., Gallegos, C. L., and Harrison, W. G.: Photoinhibition of photosynthesis in natural assemblages of marine-phytoplankton, J. Mar. Res., 38, 687–701, 1980.
Qu, P., Fu, F., and Hutchins, D. A.: Responses of the large centric diatom Coscinodiscus sp. to interactions between warming, elevated CO2, and nitrate availability, Limnol. Oceanogr., 63, 1407–1424, https://doi.org/10.1002/lno.10781, 2018.
Qu, P., Fu, F.-X., Kling, J. D., Huh, M., Wang, X., and Hutchins, D. A.: Distinct responses of the nitrogen-fixing marine cyanobacterium Trichodesmium to a thermally variable environment as a function of phosphorus availability, Front. Microbiol., 10, 1282, https://doi.org/10.3389/fmicb.2019.01282, 2019.
Rasconi, S., Winter, K., and Kainz, M. J.: Temperature increase and fluctuation induce phytoplankton biodiversity loss–Evidence from a multi-seasonal mesocosm experiment, Ecol. Evol., 7, 2936–2946, https://doi.org/10.1002/ece3.2889, 2017.
Raven, J. A. and Crawfurd, K.: Environmental controls on coccolithophore calcification, Mar. Ecol. Prog. Ser., 470, 137–166, https://doi.org/10.3354/meps09993, 2012.
Riegman, R., Stolte, W., Noordeloos, A. A., and Slezak, D.: Nutrient uptake and alkaline phosphatase (EC ) activity of Emiliania huxleyi (Prymnesiophyceae) during growth under N and P limitation in continuous cultures, J. Phycol., 36, 87–96, https://doi.org/10.1046/j.1529-8817.2000.99023.x, 2000.
Rosas-Navarro, A., Langer, G., and Ziveri, P.: Temperature affects the morphology and calcification of Emiliania huxleyi strains, Biogeosciences, 13, 2913–2926, https://doi.org/10.5194/bg-13-2913-2016, 2016.
Safaie, A., Silbiger, N. J., McClanahan, T. R., Pawlak, G., Barshis, D. J., Hench, J. L., Rogers, J. S., Williams, G. J., and Davis, K. A.: High frequency temperature variability reduces the risk of coral bleaching, Nat. Commun., 9, 2244, https://doi.org/10.1038/s41467-018-04074-2, 2018.
Schaum, C. E. and Collins, S.: Plasticity predicts evolution in a marine alga, P. Roy. Soc. B, 281, 20141486, https://doi.org/10.1098/rspb.2014.1486, 2014.
Schaum, C. E., Buckling, A., Smirnoff, N., Studholme, D., and Yvon-Durocher, G.: Environmental fluctuations accelerate molecular evolution of thermal tolerance in a marine diatom, Nat. Commun., 9, 1719, https://doi.org/10.1038/s41467-018-03906-5, 2018.
Schaum, E., Rost, B., Millar, A. J., and Collins, S.: Variation in plastic responses of a globally distributed picoplankton species to ocean acidification, Nat. Clim. Change, 3, 298–302, https://doi.org/10.1038/NCLIMATE1774, 2013.
Schlüter, L., Kai, T. L., Gutowska, M. A., Gröger, J. P., Riebesell, U., and Reusch, T. B. H.: Adaptation of a globally important coccolithophore to ocean warming and acidification, Nat. Clim. Change, 4, 1024–1030, https://doi.org/10.1038/nclimate2379, 2014.
Sett, S., Bach, L. T., Schulz, K. G., Koch-Klavsen, S., Lebrato, M., and Riebesell, U.: Temperature modulates coccolithophorid sensitivity of growth, photosynthesis and calcification to increasing seawater pCO2, PLoS One, 9, e88308, https://doi.org/10.1371/journal.pone.0088308, 2014.
Shurin, J. B., Winder, M., Adrian, R., Keller, W., Matthews, B., Paterson, A. M., Paterson, M. J., Pinel-Alloul, B., Rusak, J. A., and Yan, N. D.: Environmental stability and lake zooplankton diversity–contrasting effects of chemical and thermal variability, Ecol. Lett., 13, 453–463, https://doi.org/10.1111/j.1461-0248.2009.01438.x, 2010.
Solórzano, L. and Sharp, J. H.: Determination of total dissolved phosphorus and particulate phosphorus in natural waters, Limnol. Oceanogr., 25, 754–758, https://doi.org/10.4319/lo.1980.25.4.0754, 1980.
Sunda, W. G., Price, N. M., and Morel, F. M.: Trace metal ion buffers and their use in culture studies, Algal Culturing Techniques, 4, 35–63, 2005.
Sunday, J. M., Bates, A. E., and Dulvy, N. K.: Thermal tolerance and the global redistribution of animals, Nat. Clim. Change, 2, 686–690, https://doi.org/10.1038/nclimate1539, 2012.
Tatters, A. O., Schnetzer, A., Xu, K., Walworth, N. G., Fu, F., Spackeen, J. L., Sipler, R. E., Bertrand, E. M., McQuaid, J. B., Allen, A. E, Bronk, D.A., Gao, K., Sun, J., Caron, D. A., and Hutchins, D. A.: Interactive effects of temperature, CO2 and nitrogen source on a coastal California diatom assemblage, J. Plank. Res., 40, 151–164, 2018.
Thomas, M. K., Kremer, C. T., Klausmeier, C. A., and Litchman, E.: A global pattern of thermal adaptation in marine phytoplankton, Science, 338, 1085–1088, https://doi.org/10.1126/science.1224836, 2012.
Vázquez, D. P., Gianoli, E., Morris, W. F., and Bozinovic, F.: Ecological and evolutionary impacts of changing climatic variability, Biol. Rev., 92, 22–42, https://doi.org/10.1111/brv.12216, 2017.
Vasseur, D. A., DeLong, J. P., Gilbert, B., Greig, H. S., Harley, C. D., McCann, K. S., Savage, V., Tunney, T. D., and O'Connor, M. I.: Increased temperature variation poses a greater risk to species than climate warming, P. Roy. Soc. Lond. B, 281, 20132612, https://doi.org/10.1098/rspb.2013.2612, 2014.
Westbroek, P., Brown, C. W., van Bleijswijk, J., Brownlee, C., Brummer, G. J., Conte, M., Egge, J., Fernández, E., Jordan, R., and Knappertsbusch, M.: A model system approach to biological climate forcing. The example of Emiliania huxleyi, Glob. Planet. Change, 8, 27–46, 1993.
Yvon-Durocher, G., Allen, A. P., Cellamare, M., Dossena, M., Gaston, K. J., Leitao, M., Montoya, J. M., Reuman, D. C., Woodward, G., and Trimmer, M.: Five years of experimental warming increases the biodiversity and productivity of phytoplankton, PLoS Biol., 13, e1002324, https://doi.org/10.1371/journal.pbio.10023242015.
Zander, A., Bersier, L. F., and Gray, S. M.: Effects of temperature variability on community structure in a natural microbial food web, Glob. Change Biol., 23, 56–67, https://doi.org/10.1111/gcb.13374, 2017.
Zhang, M., Qin, B., Yu, Y., Yang, Z., Shi, X., and Kong, F.: Effects of temperature fluctuation on the development of cyanobacterial dominance in spring: Implication of future climate change, Hydrobiologia, 763, 135–146, https://doi.org/10.1007/s10750-015-2368-0, 2016.
Zhang, Y., Klapper, R., Lohbeck, K. T., Bach, L. T., Schulz, K. G., Reusch, T. B. H., and Riebesell, U.: Between- and within-population variations in thermal reaction norms of the coccolithophore Emiliania huxleyi, Limnol. Oceanogr., 59, 1570–1580, https://doi.org/10.4319/lo.2014.59.5.1570, 2014.
Zhu, Z., Qu, P., Fu, F., Tennenbaum, N., Tatters, A. O., and Hutchins, D. A.: Understanding the blob bloom: Warming increases toxicity and abundance of the harmful bloom diatom Pseudo-nitzschia in California coastal waters, Harmful Algae, 67, 36–43, https://doi.org/10.1016/j.hal.2017.06.004, 2017.