the Creative Commons Attribution 4.0 License.
the Creative Commons Attribution 4.0 License.
 | 11 Nov 2019
Stable isotope signatures of Holocene syngenetic permafrost trace seabird presence in the Thule District (NW Greenland)
Sebastian Wetterich
Thomas A. Davidson
Anatoly Bobrov
Thomas Opel
Torben Windirsch
Kasper L. Johansen
Ivan González-Bergonzoni
Anders Mosbech
Erik Jeppesen
Holocene permafrost from ice wedge polygons in the vicinity of large seabird breeding colonies in the Thule District, NW Greenland, was drilled to explore the relation between permafrost aggradation and seabird presence. The latter is reliant on the presence of the North Water Polynya (NOW) in the northern Baffin Bay. The onset of peat accumulation associated with the arrival of little auks (Alle alle) in a breeding colony at Annikitisoq, north of Cape York, is radiocarbon-dated to 4400 cal BP. A thick-billed murre (Uria lomvia) colony on Appat (Saunders Island) in the mouth of the Wolstenholme Fjord started 5650 cal BP. Both species provide marine-derived nutrients (MDNs) that fertilize vegetation and promote peat growth. The geochemical signature of organic matter left by the birds is traceable in the frozen Holocene peat. The peat accumulation rates at both sites are highest after the onset, decrease over time, and were about 2-times faster at the little auk site than at the thick-billed murre site. High accumulation rates induce shorter periods of organic matter (OM) decomposition before it enters the perennially frozen state. This is seen in comparably high C∕N ratios and less depleted δ13C, pointing to a lower degree of OM decomposition at the little auk site, while the opposite pattern can be discerned at the thick-billed murre site. Peat accumulation rates correspond to δ15N trends, where decreasing accumulation led to increasing depletion in δ15N as seen in the little-auk-related data. In contrast, the more decomposed OM of the thick-billed murre site shows almost stable δ15N. Late Holocene wedge ice fed by cold season precipitation was studied at the little auk site and provides the first stable-water isotopic record from Greenland with mean δ18O of ‰, mean δD of ‰, mean d excess of 7.7±0.7 ‰, and a δ18O-δD slope of 7.27, which is close to those of the modern Thule meteoric water line. The syngenetic ice wedge polygon development is mirrored in testacean records of the little auk site and delineates polygon low-center, dry-out, and polygon-high-center stages. The syngenetic permafrost formation directly depending on peat growth (controlled by bird activity) falls within the period of neoglacial cooling and the establishment of the NOW, thus indirectly following the Holocene climate trends.
- Article
(16775 KB) -
Supplement
(475 KB) - BibTeX
- EndNote


The Thule District of Northwest Greenland (Fig. 1) is notable for its large seabird colonies along the coast, especially the little auk, Alle alle (e.g., Boertmann and Mosbech, 1998), and the thick-billed murre, Uria lomvia (e.g., Kampp, 1990), both belonging to the auk family (Alcidae). The mainly piscivorous thick-billed murre and the planktivorous little auk both depend on the resources from the productive North Water Polynya (NOW), which is situated in northern Baffin Bay (Stirling, 1980; Davidson et al., 2018). The area is especially important for the little auk as >80 % of the global breeding population of the species, corresponding to approximately 33 million pairs, is estimated to breed (Boertmann and Mosbech, 1998; Kampp et al., 2000; Egevang et al., 2003). This has been linked to an exceptional abundance of their preferred zooplankton prey (Calanus hyperboreus and C. glacialis), which is available in the NOW throughout the little auk breeding season (Møller et al., 2018). The thick-billed murre population of the Thule District is estimated to be approx. 225 000 breeding pairs, accounting for 68 % of the Greenlandic breeding population of the species (Merkel et al., 2014).
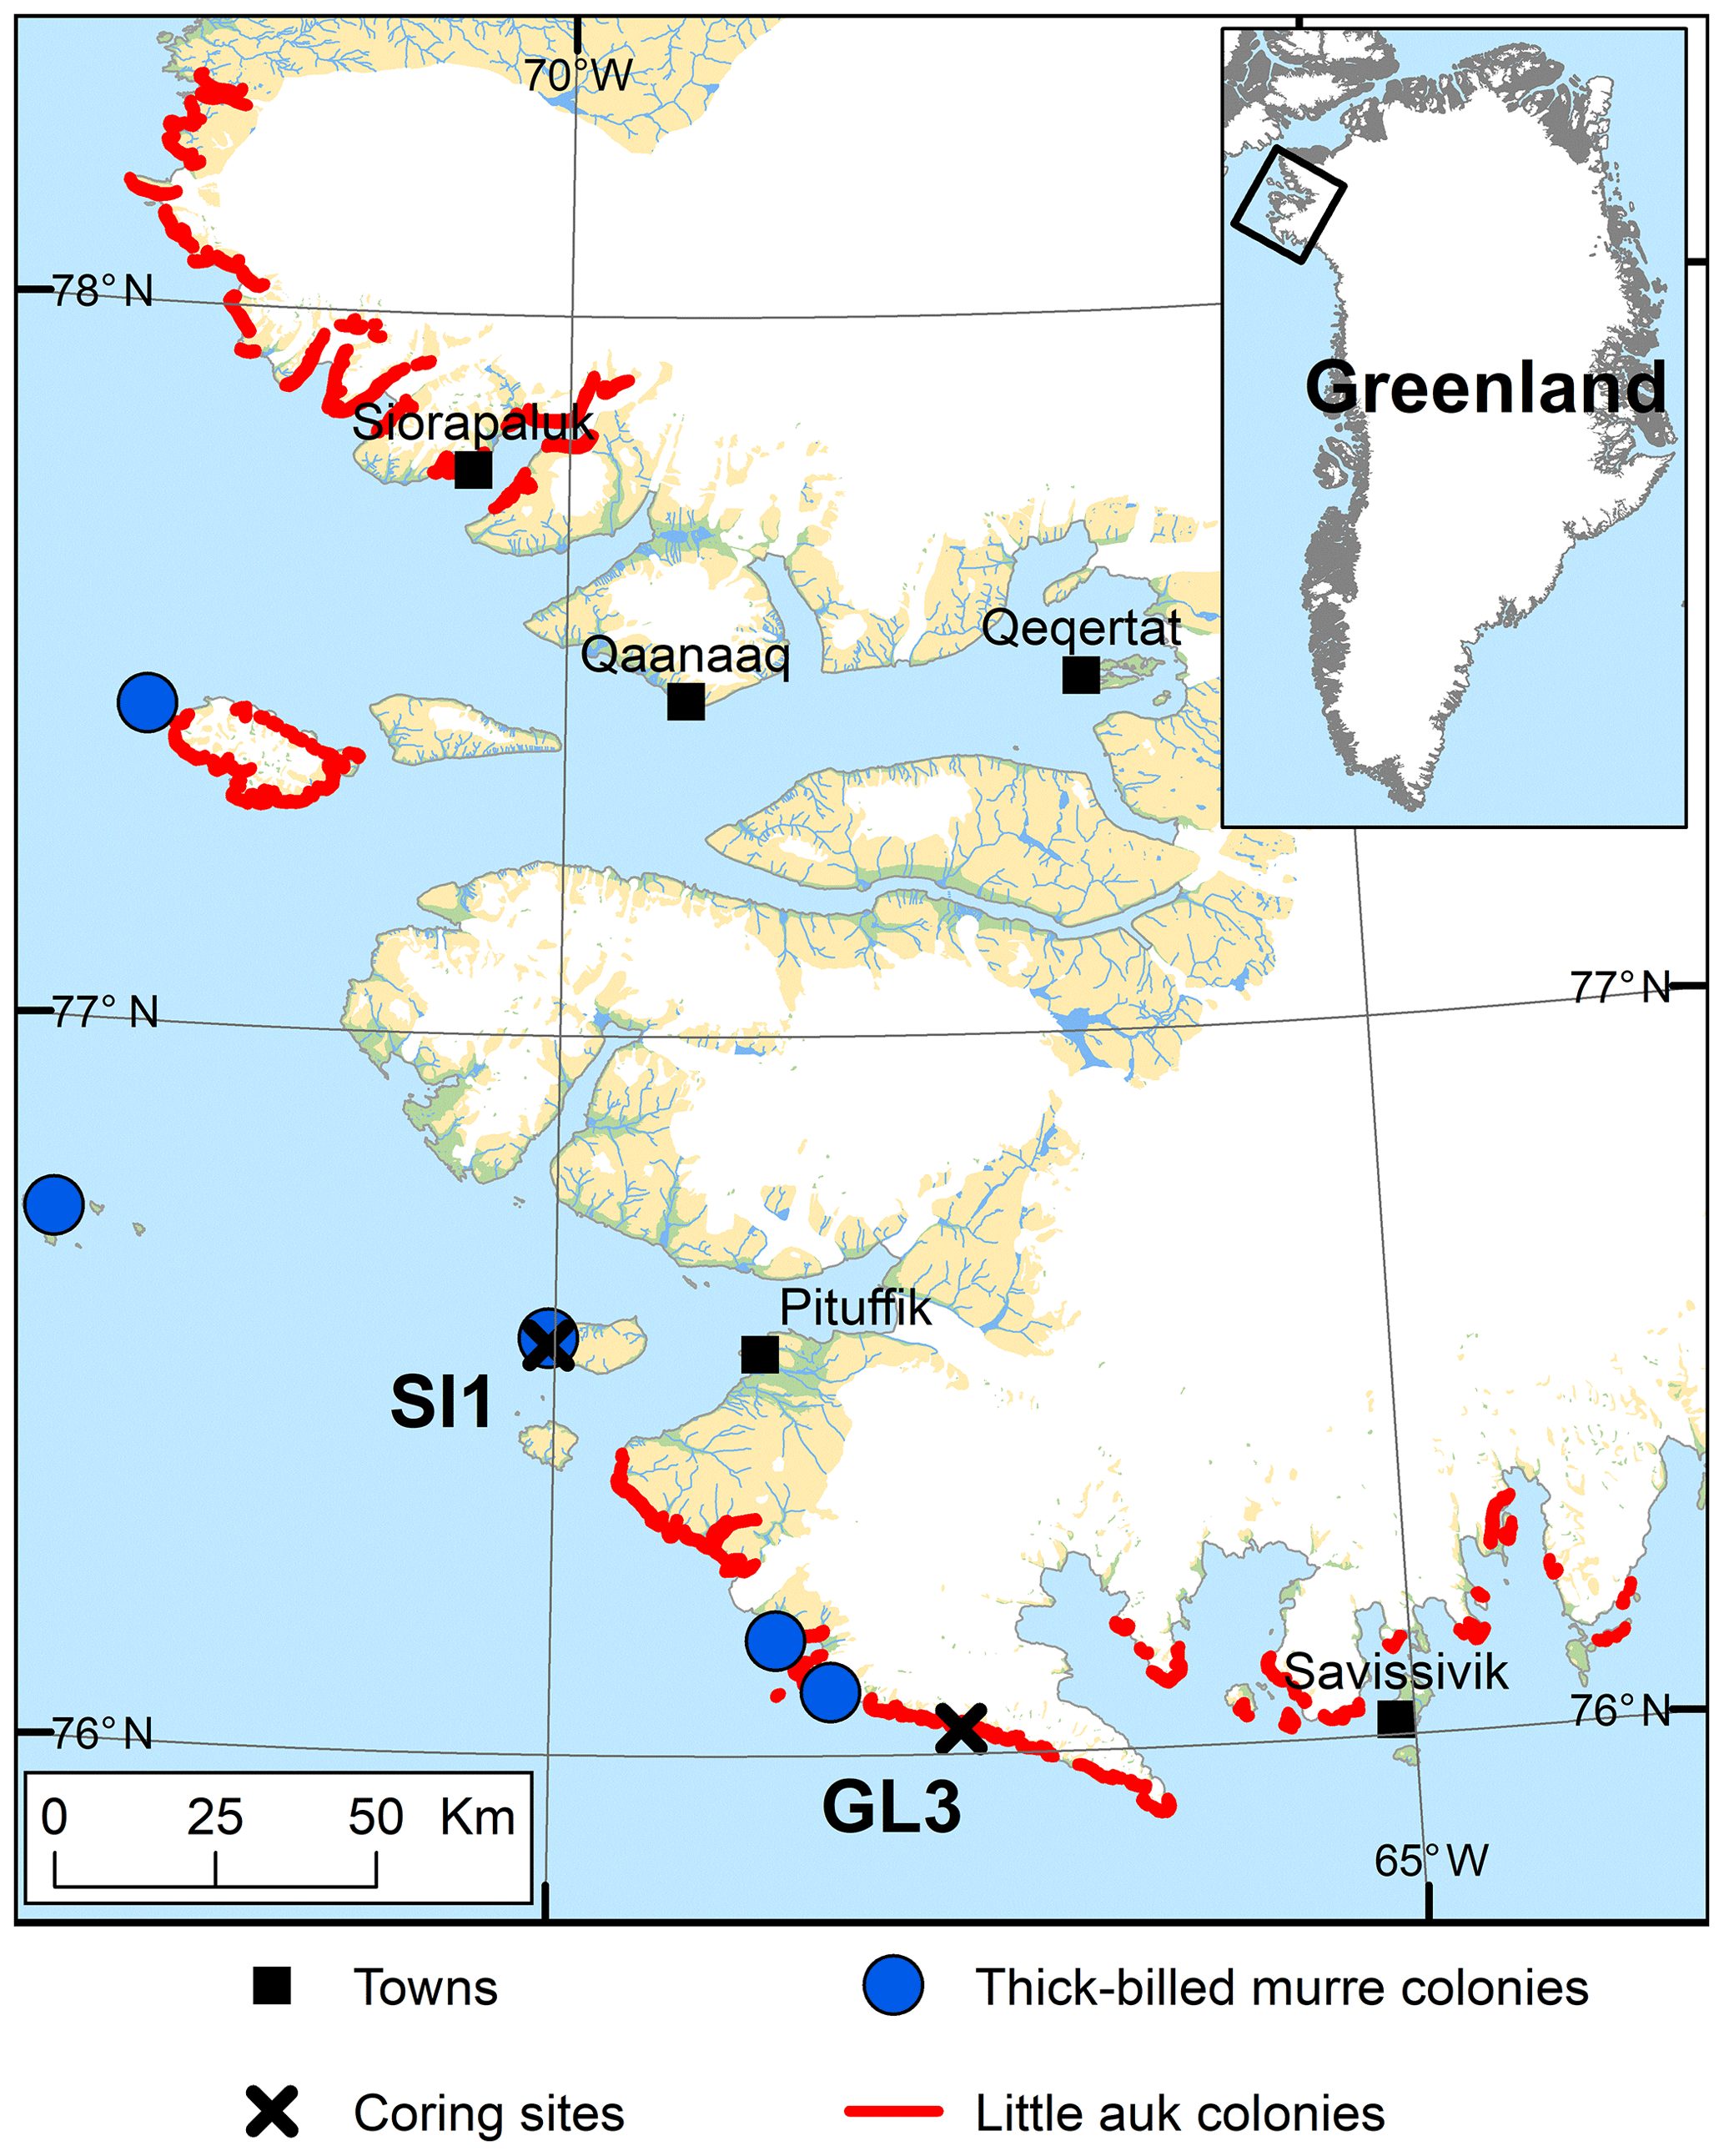
Figure 1The study area in the Thule District, NW Greenland, including the location of coring sites on Saunders Island (SI1) and at Annikitisoq (GL3) and the distribution of breeding colonies of little auk and thick-billed murre after Boertmann and Mosbech (1998) and The Greenland Seabird Colony Register, maintained by the Danish Centre for Environment and Energy, Aarhus University, and the Greenland Institute of Natural Resources.
The seabirds transport large quantities of marine-derived nutrients (MDNs) from their foraging areas at sea to the terrestrial coastal environments surrounding their breeding sites. By doing so, they act as ecosystem engineers transforming the areas around the colonies, and leaving explicit signatures of their presence (González-Bergonzoni et al., 2017). The input of MDNs around large breeding sites facilitates vegetation growth and peat accumulation at high latitudes (e.g., Zwolicki et al., 2013), completely altering the prevailing ice-free coastal area that is otherwise dominated by bedrock. Hence, areas around bird colonies are hotspots of floral and faunal biodiversity and productivity (Mosbech et al., 2018), and the onset of peat formation and syngenetic permafrost aggradation coincides with the establishment of seabird colonies.
High-latitude soils affected by avian MDN input are enriched in limiting plant nutrients such as nitrogen and phosphorus (e.g., Zwolicki et al., 2013), leading to increased diversity, biomass, and coverage of vegetation. Soil-inhabiting protist communities such as testate amoebae (testaceans) show altered species richness and composition if their habitats are influenced by seabird colonies (Mazei et al., 2018; Vincke et al., 2007).
Vegetation fertilized by MDNs and the subsequent peat formation over millennia enable permafrost aggradation. Syngenetic (concurrent with accumulation) freezing of the peat and ice wedge polygon formation shape the topography when ice wedges grow in polygonal patterns owing to thermal contraction (frost) cracking of the frozen ground in winter and filling of the cracks mostly by snowmelt in spring (Leffingwell, 1915). The melt water entering the frost cracks refreezes immediately due to the subzero ground temperatures and forms vertical ice veins. Ice wedges widen by repetition of these processes and grow upwards with ongoing organic or mineralic accumulation on top. The stable isotope composition of water from wedge ice serves as a proxy of winter climate conditions since the ice derives mainly from winter precipitation (e.g., Opel et al., 2018).
Previous studies have examined the current relation between the NOW and little auk populations (Mosbech et al., 2018), including the availability of their preferred zooplankton prey (e.g., Møller et al., 2018). The onset of seabird colonies in the study area was previously explored using lake sediments and frozen peat by Davidson et al. (2018), whose data are partly employed in the present study that focuses on resulting peat growth and permafrost aggradation in connection with seabird breeding sites. By using for the first time Holocene permafrost and testacean records from the Thule District the study, aims at deciphering (1) the relation between the seabird colony presence and syngenetic permafrost aggradation onset over time and (2) the alternation and preservation of bird presence signals in OM properties of frozen peat.
The climate conditions in Pituffik (Thule Air Base, TAB, 1948–2013, WMO station 4202) display mean annual air temperatures of −10.8 ∘C with the warmest mean temperatures in July (5.5 ∘C) and the coldest in February (−25.1 ∘C) (Cappelen, 2014). The mean annual precipitation amounts to only 127 mm and the wettest month is August with a mean value of 25 mm (1961–1990; DMI, 2018). The low precipitation and the large annual temperature amplitude create continental climate conditions close to those of High Arctic deserts. The ice-free coastal areas belong to the continuous permafrost zone (Brown et al., 1997). Permafrost reaches more than 300 m in depth (Roethlisberger, 1961) and the zero-amplitude ground temperature of −10 ∘C occurs at about 7.6 m below the surface (b.s.) in the Pituffik Valley (Bjella, 2013). Main parts of the regional permafrost formed epigenetically when sediments and rock froze after Late Glacial Interstadial to Holocene deglaciation and exposition to negative annual air temperatures. The uppermost permafrost of depositional areas, however, formed syngenetically with ongoing sedimentation and shaped the modern topography by periglacial landforms such as ice wedge polygons and other patterned-ground features (Horwath et al., 2008). The uppermost and seasonally thawed (active) layer reaches 0.1 to 0.7 m in thickness.
The sample material was retrieved at two locations, at Annikitisoq (informal name Great Lake; 76.03288∘ N, 67.61811∘ W) north of Cape York and on Appat (Saunders Island; 76.56908∘ N, 70.04099∘ W) in the mouth of the Wolstenholme Fjord (Fig. 1). Based on the GIMP digital elevation model (Howat et al., 2014) and the geoid EGM2008, sample sites GL3 and GL3-IW at Annikitisoq are 22.1 m above mean sea level, whereas sample site SI1 on Appat is 14.2 m above mean sea level. All three sites are well above the marine limit. The sites exhibit well-expressed high-center polygons that reach about 12 m in diameter with trenches up to 2 m deep at Annikitisoq and about 4 to 5 m in diameter with trenches up to 1.5 m deep on Appat (Fig. 2). At Annikitisoq, the polygons partly cover gentle slopes below a colony of little auks and the catchments of a proglacial lake and a stream draining the lake (Fig. 2). On Appat, elevated polygon centers were found below a cliff with breeding sites of thick-billed murre. According to the Circumpolar Arctic Vegetation Map, both sites are categorized as prostrate/hemiprostrate dwarf-shrub tundra (P2) composed of dwarf shrubs, mosses, rushes, forbs, and lichens (CAVM Team, 2003). In the little auk colony at Annikitisoq, the general vegetation pattern corresponded very closely to the vegetation pattern in the little auk colony of Qeqertaq (Salve Island), which is described in detail in Mosbech et al. (2018) and seems to be representative of most little auk colonies in Southern Thule without musk oxen. Thus, up high, close to the boulder scree where the little auks nest, the vegetation was dominated by foxtail grass and chickweed, whereas further down the slope, where the GL3 core was extracted, the vegetation solely consisted of mosses and lichens (corresponding approx. to the 150 m mark on the vegetation transect in Fig. 3 of Mosbech et al., 2018). Mosses dominated the center of the GL3 polygon, where the coring took place, whereas the lichens dominated the surface at the periphery of the polygon (Fig. 2a–c). We observed no dwarf shrubs at Annikitisoq, and it is our general impression that dwarf shrubs are absent in areas under heavy influence of little auks. The vegetation at the sampling site at Appat was more diverse, with mosses and foxtail grass at the center of the polygon, where the SI1 core was extracted, and a mixed community at the periphery of the polygon consisting of Arctic willow, foxtail grass, chickweed, and Arctic poppy (Fig. 2e).
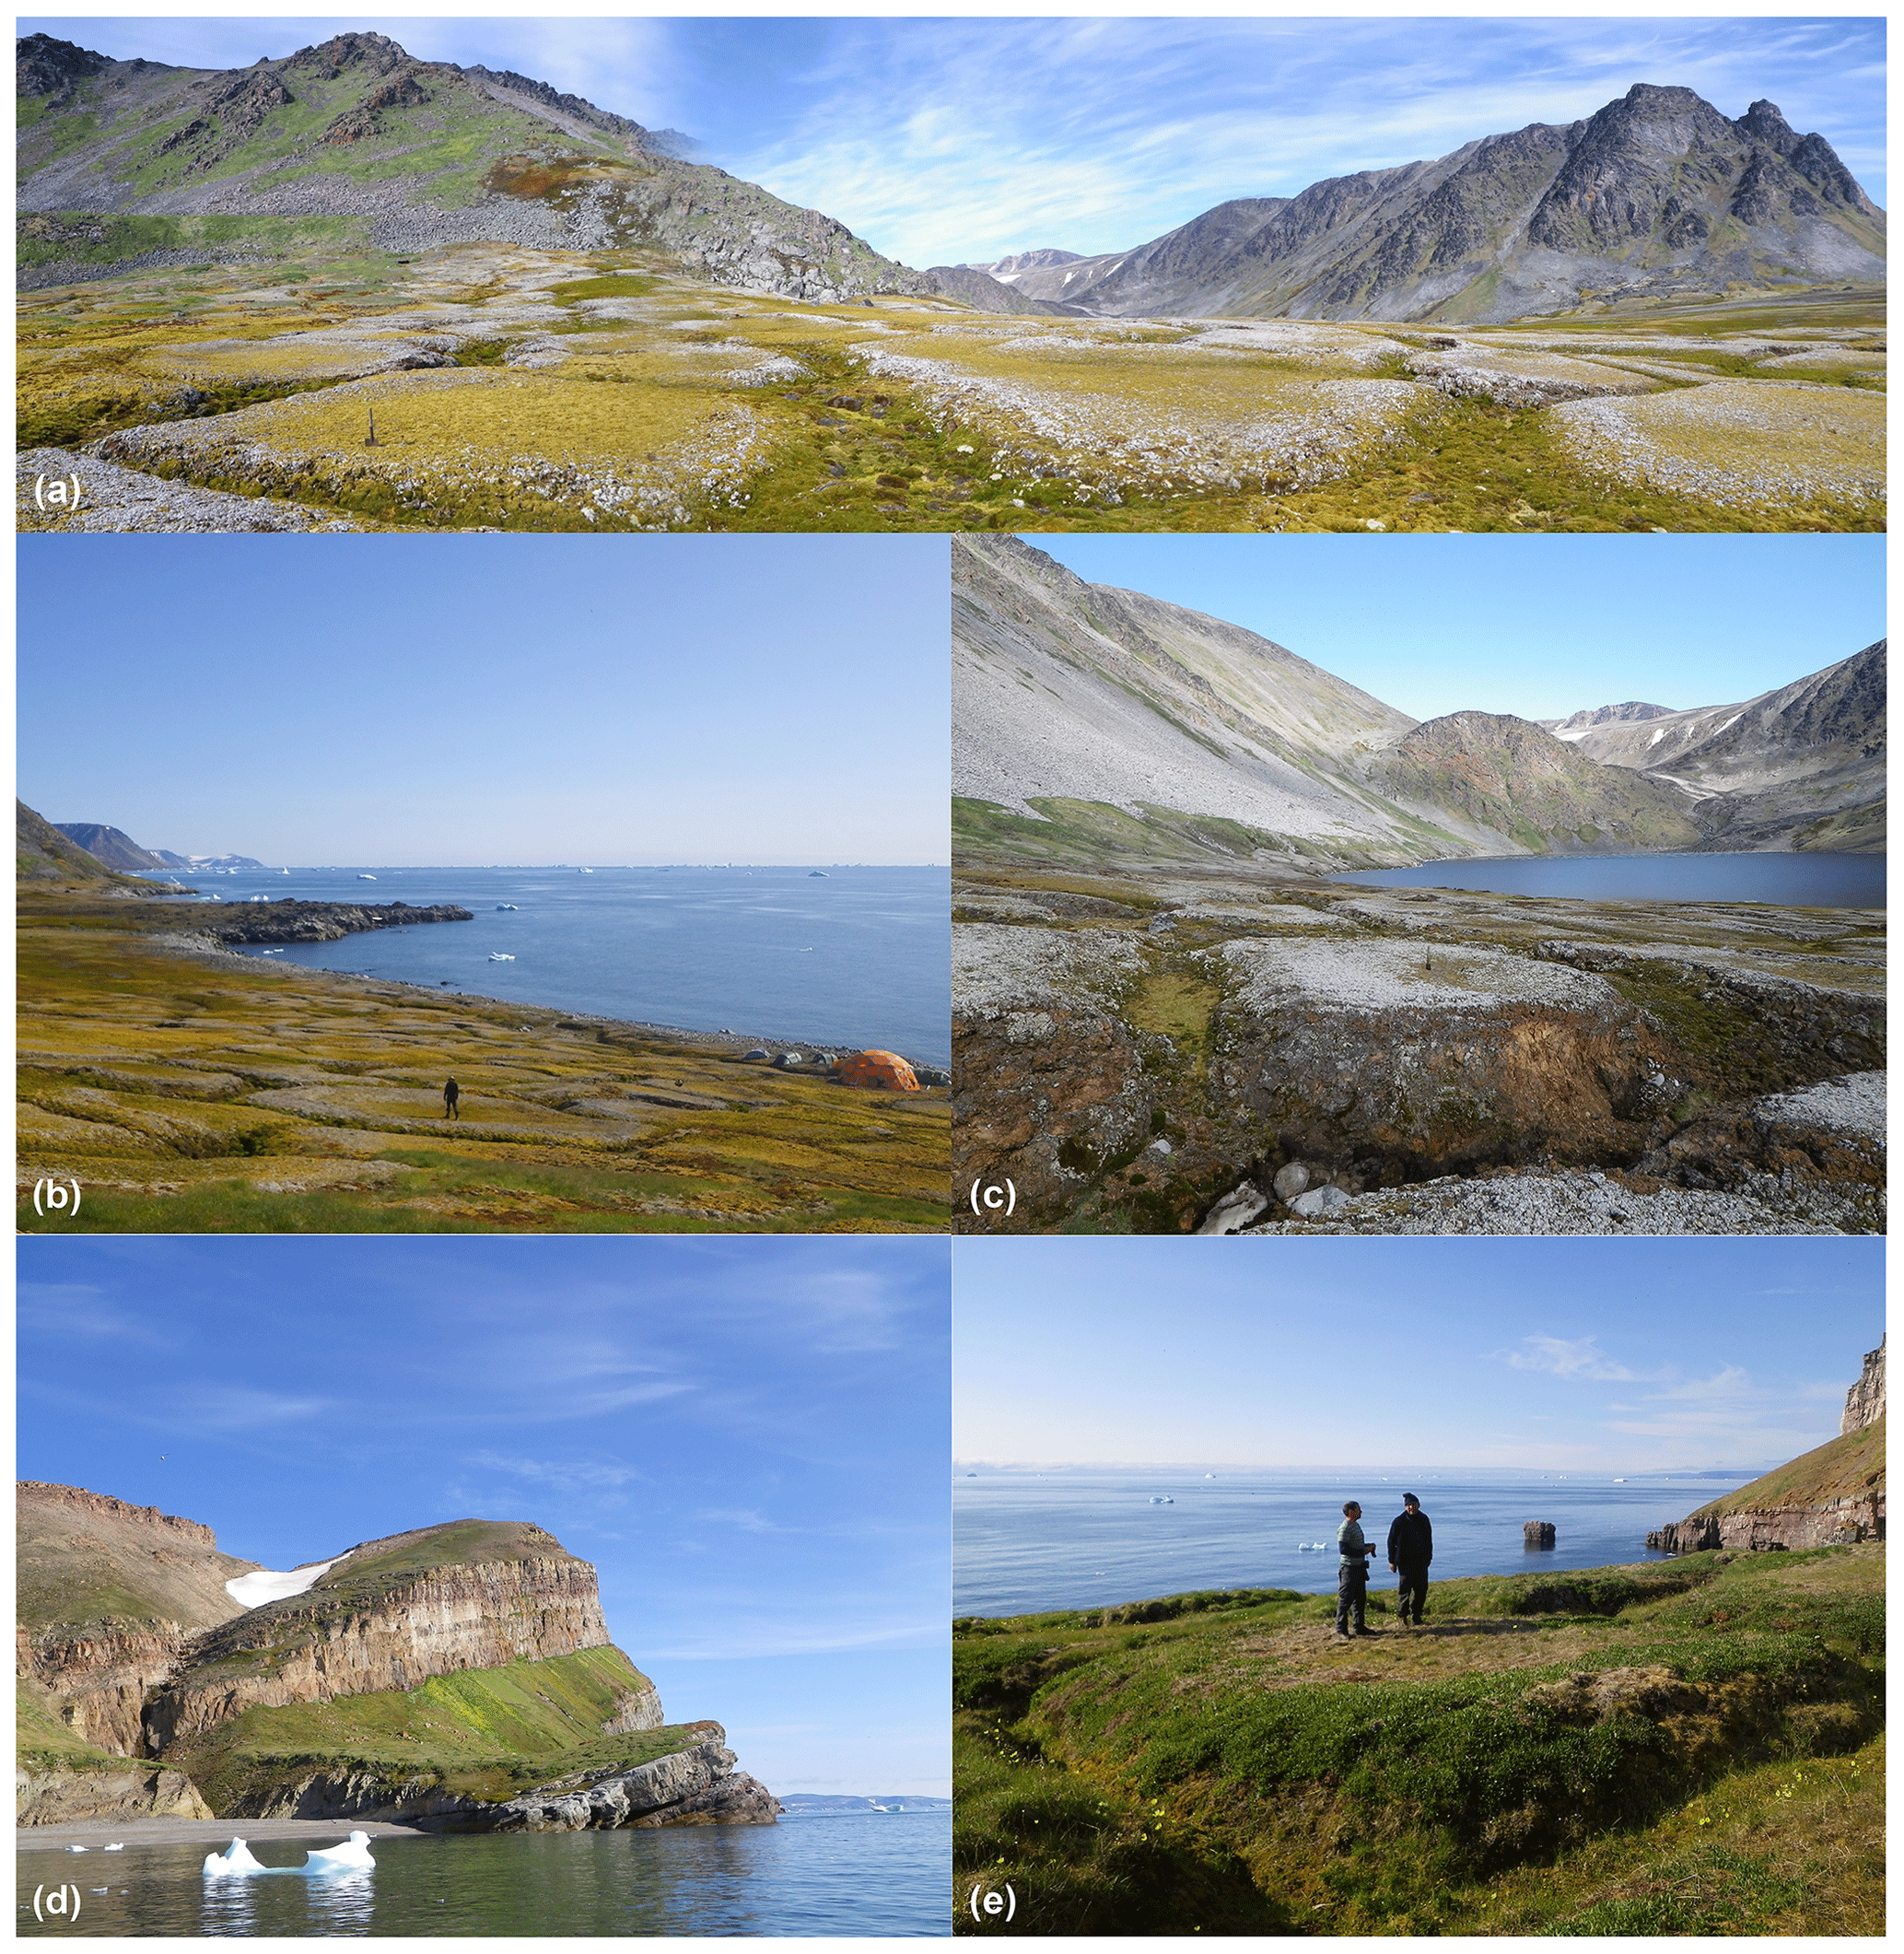
Figure 2High-center polygons at Annikitisoq (a–c) and on Appat (d–e). Coring sites are shown in (c) and (e). Note the persons for scale.
3.1 Fieldwork
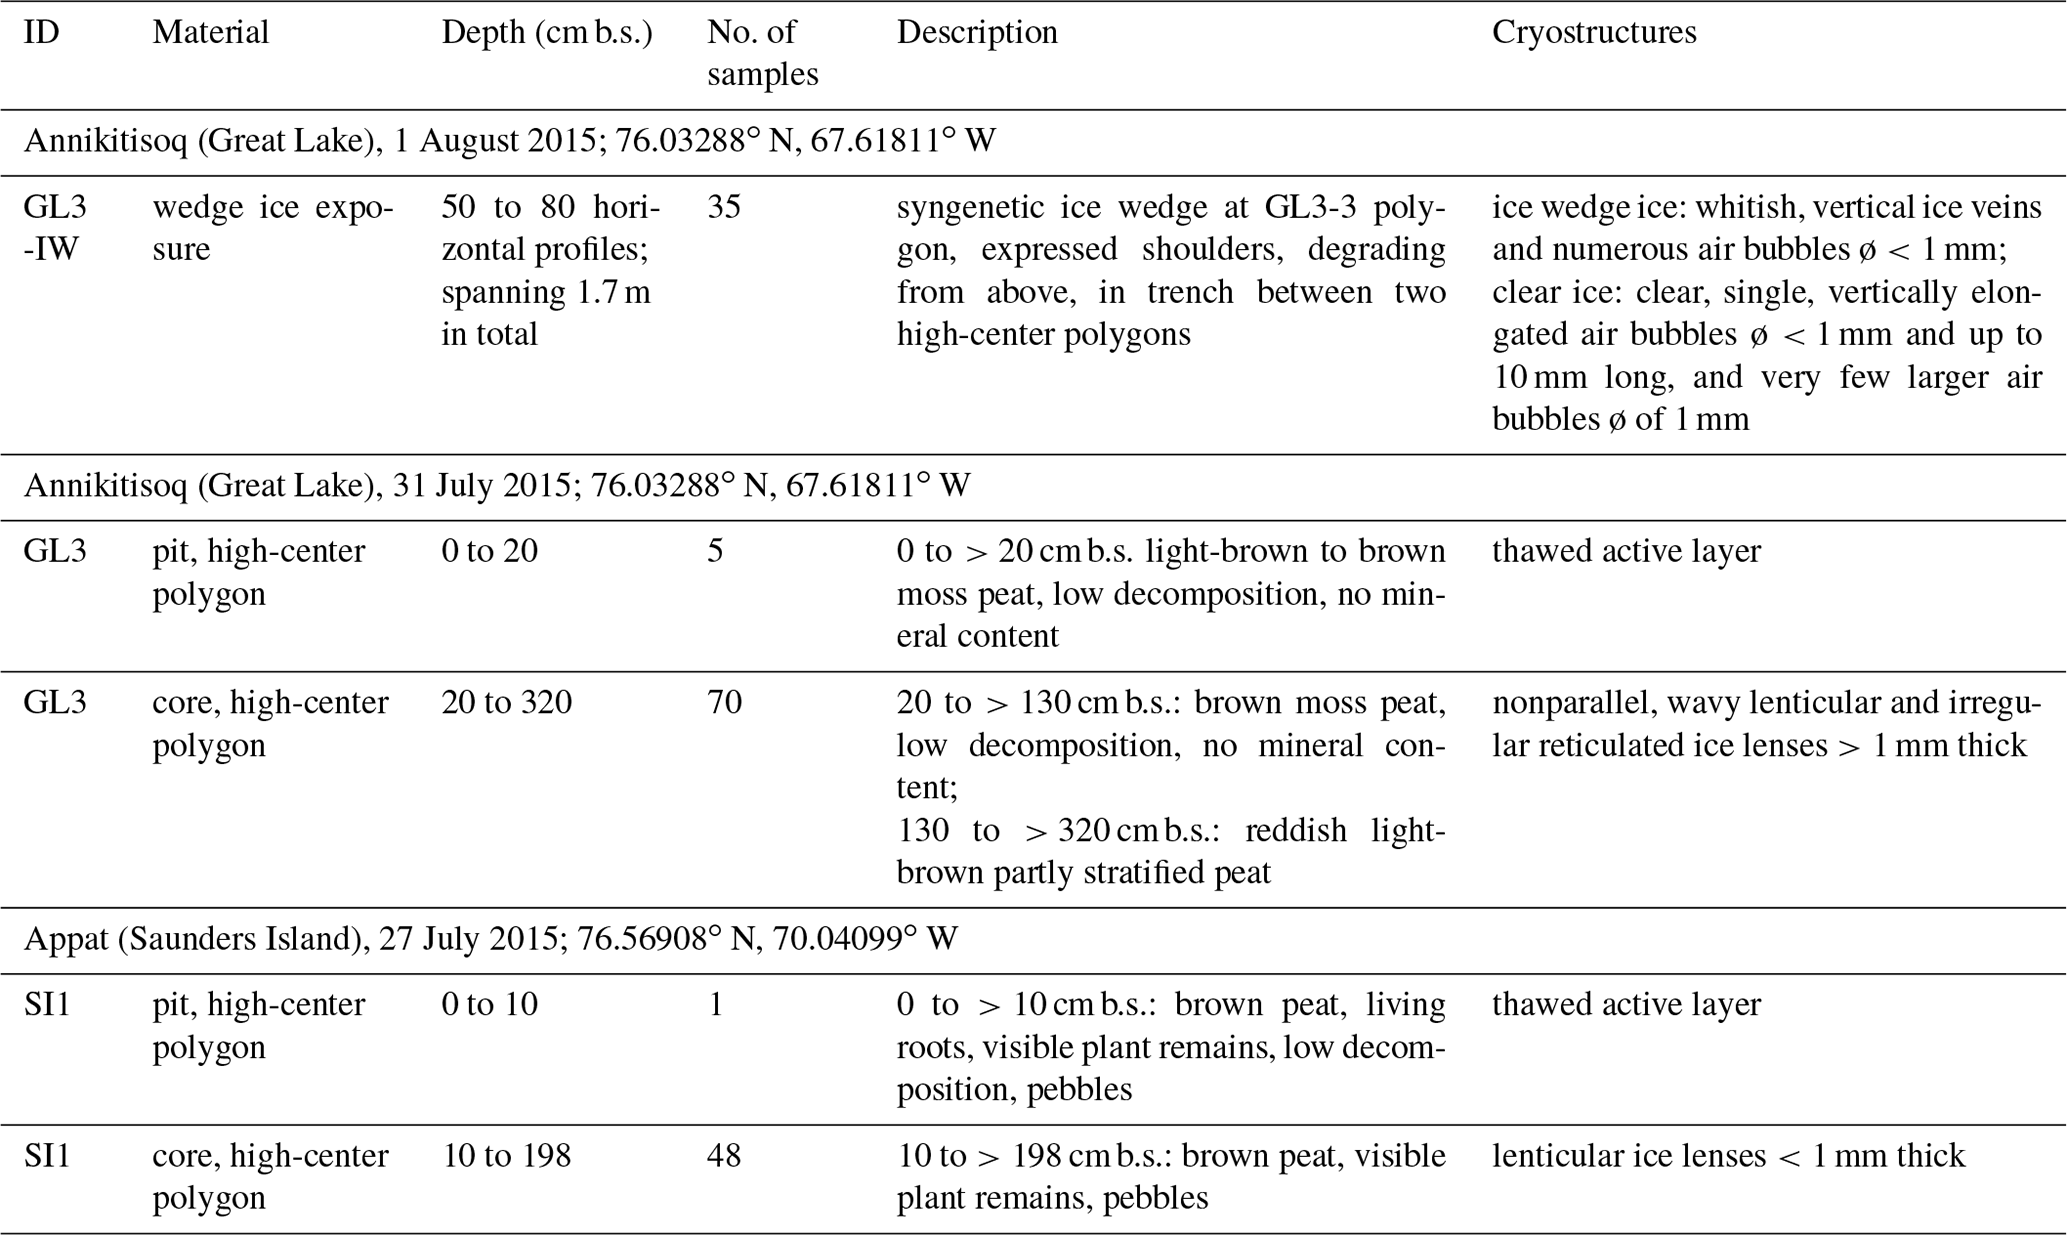
Fieldwork was undertaken between 21 July and 14 August 2015 in the Thule District, NW Greenland. The centers of high-center polygons were chosen for coring. The uppermost active layer was excavated using spades and sampled. The active layer depth reached 20 cm at Annikitisoq and 10 cm on Appat. Below the permafrost table, the peat deposits were extracted using a SIPRE corer driven by a two-stroke engine (Hughes and Terasmae, 1963). The diameter of the coring barrel was 48 mm and its length 1 m. Extensions were used to reach deeper deposits until the corer hit boulders, larger than the drill tube diameter, whose density increased at the transition between the peat and the underlying bedrock. The drilling at Annikitisoq (core GL3) reached a depth of 320 cm b.s. and on Appat (core SI1) 195 cm b.s. (Table 1). After drilling, cryostructures of intrasedimental ice were described following French and Shur (2010), and the cores were kept frozen until subsampling and analyses. At Annikitisoq, wedge ice was exposed in a trench between two high polygon centers at the cored GL3 polygon. Neither a distinct frost crack nor rejuvenation stages were observed in the ice wedge. Thus, no traces of modern ice wedge growth were seen and the ice represents the buried remains of a degrading ice wedge network. Clearly expressed shoulders confirm the syngenetic formation of the wedge ice. The wedge ice exposure was about 1.7 m wide, about 1 m high above the trench bottom, and about 1.2 m below the GL3 polygon surface (Fig. 3). Using an axe and hammer, the ice was split into 35 subsamples across a horizontal transect between 30 and 50 cm above the trench bottom (at 50 to 80 cm b.s.).
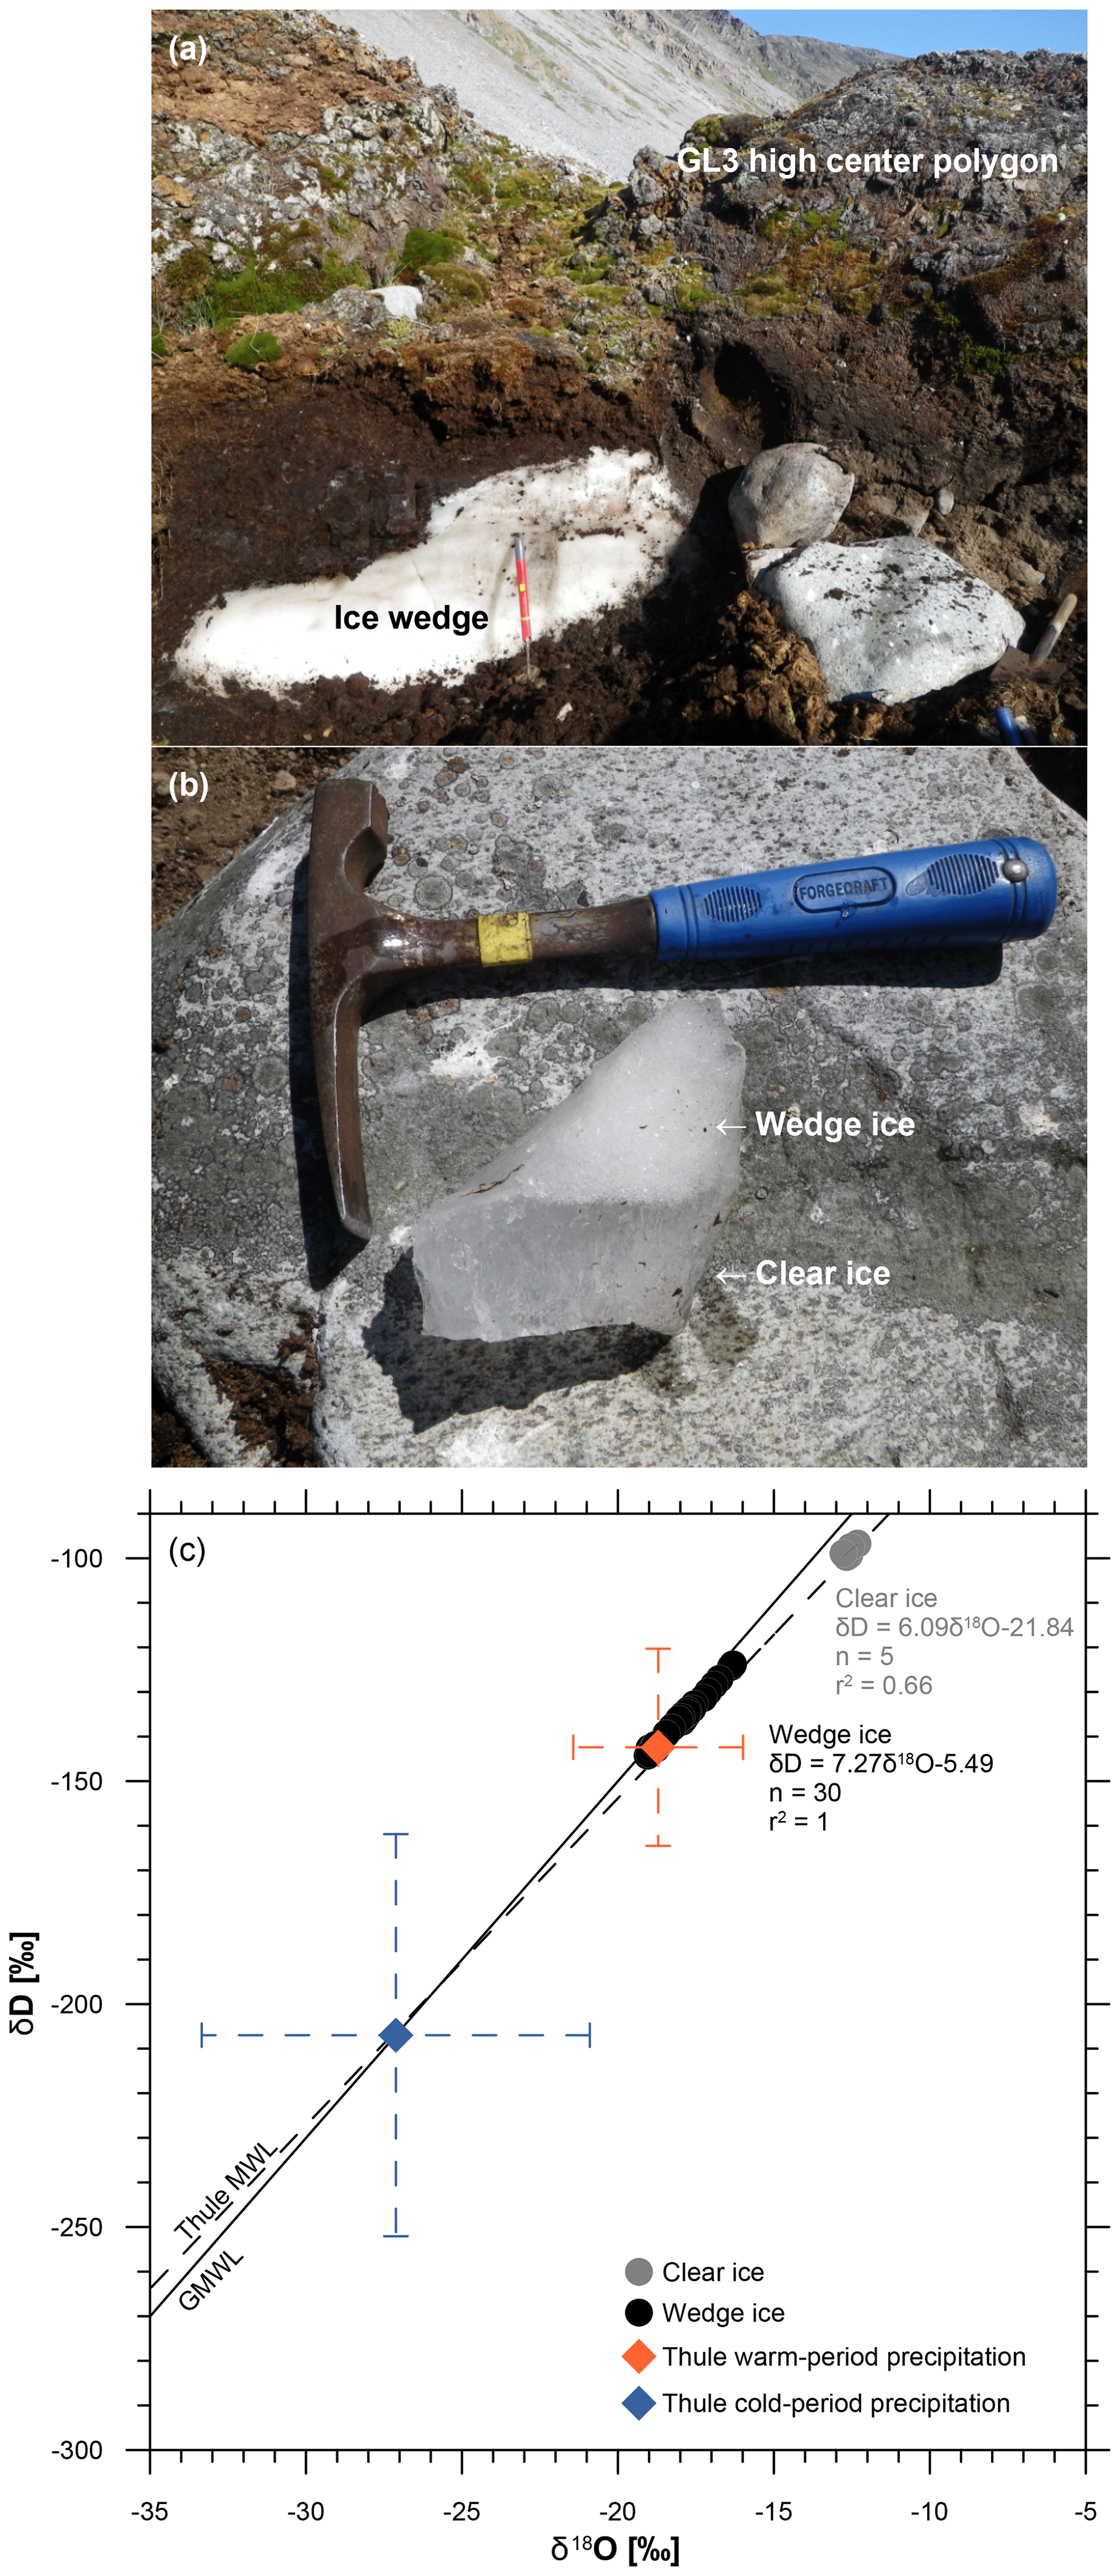
Figure 3Ground ice exposed in a trench at the GL3 polygon (a) including wedge ice and clear ice (b), which differ in their isotopic composition (c). Co-isotopic data are shown along with the global meteoric water line (GMWL; Craig, 1961) and the Thule MWL (GNIP database, 2018) based on precipitation data from 1966 to 1970 (monthly means, n=43, δD = 7.33δ18O−7.14, R2=0.97). The mean modern cold season (October to May, n=29) and warm season (June to September, n=14) precipitation data and standard deviation are shown by blue and orange diamond symbols, respectively (GNIP database, 2018).
Table 1Cryolithological description of peat core GL3 and wedge ice from Annikitisoq and peat core SI1 from Appat in the Thule District (NW Greenland).
3.2 Permafrost analyses
The frozen cores were sectioned at 2–4 cm increments by a band saw for further analytical work and then freeze-dried. The GL3 core totalled 75 samples (including four unfrozen active-layer samples) and the SI1 core 49 samples (including 1 unfrozen active-layer sample). The gravimetric ice content was measured as the weight difference between fresh and freeze-dried bulk sediment samples and is expressed as ice content in weight percentage (wt %).
The oxygen (δ18O) and hydrogen (δD) stable isotope compositions of wedge ice were measured using a Finnigan MAT Delta-S mass spectrometer, 1σ better than 0.1 ‰ for δ18O and 0.8 ‰ for δD (Meyer et al., 2000). Values are given as per mill (‰) difference from the Vienna Standard Mean Ocean Water (VSMOW) standard. The deuterium excess (d) is calculated following Eq. (1) (Dansgaard, 1964): d=δD–8⋅δ18O.
3.3 Radiocarbon dating and organic matter analyses
In total, 11 samples from the GL3 core and 6 samples from the SI1 core were radiocarbon-dated at the Aarhus AMS Centre (AARAMS). The dates are published by Davidson et al. (2018), wherein more details on lab procedures are given. The radiocarbon ages were transformed into calendar years using the IntCal13 calibration curve (Reimer et al., 2013). Age models for the cores were fitted using the R routine BACON, a Bayesian age–depth modeling approach (Blaauw and Christen, 2011). Ages reported and used in the figures are median modeled ages with 1σ probability range in calibrated years before the present (cal BP). The zonation of the cores was deduced from obvious changes in the accumulation rates.
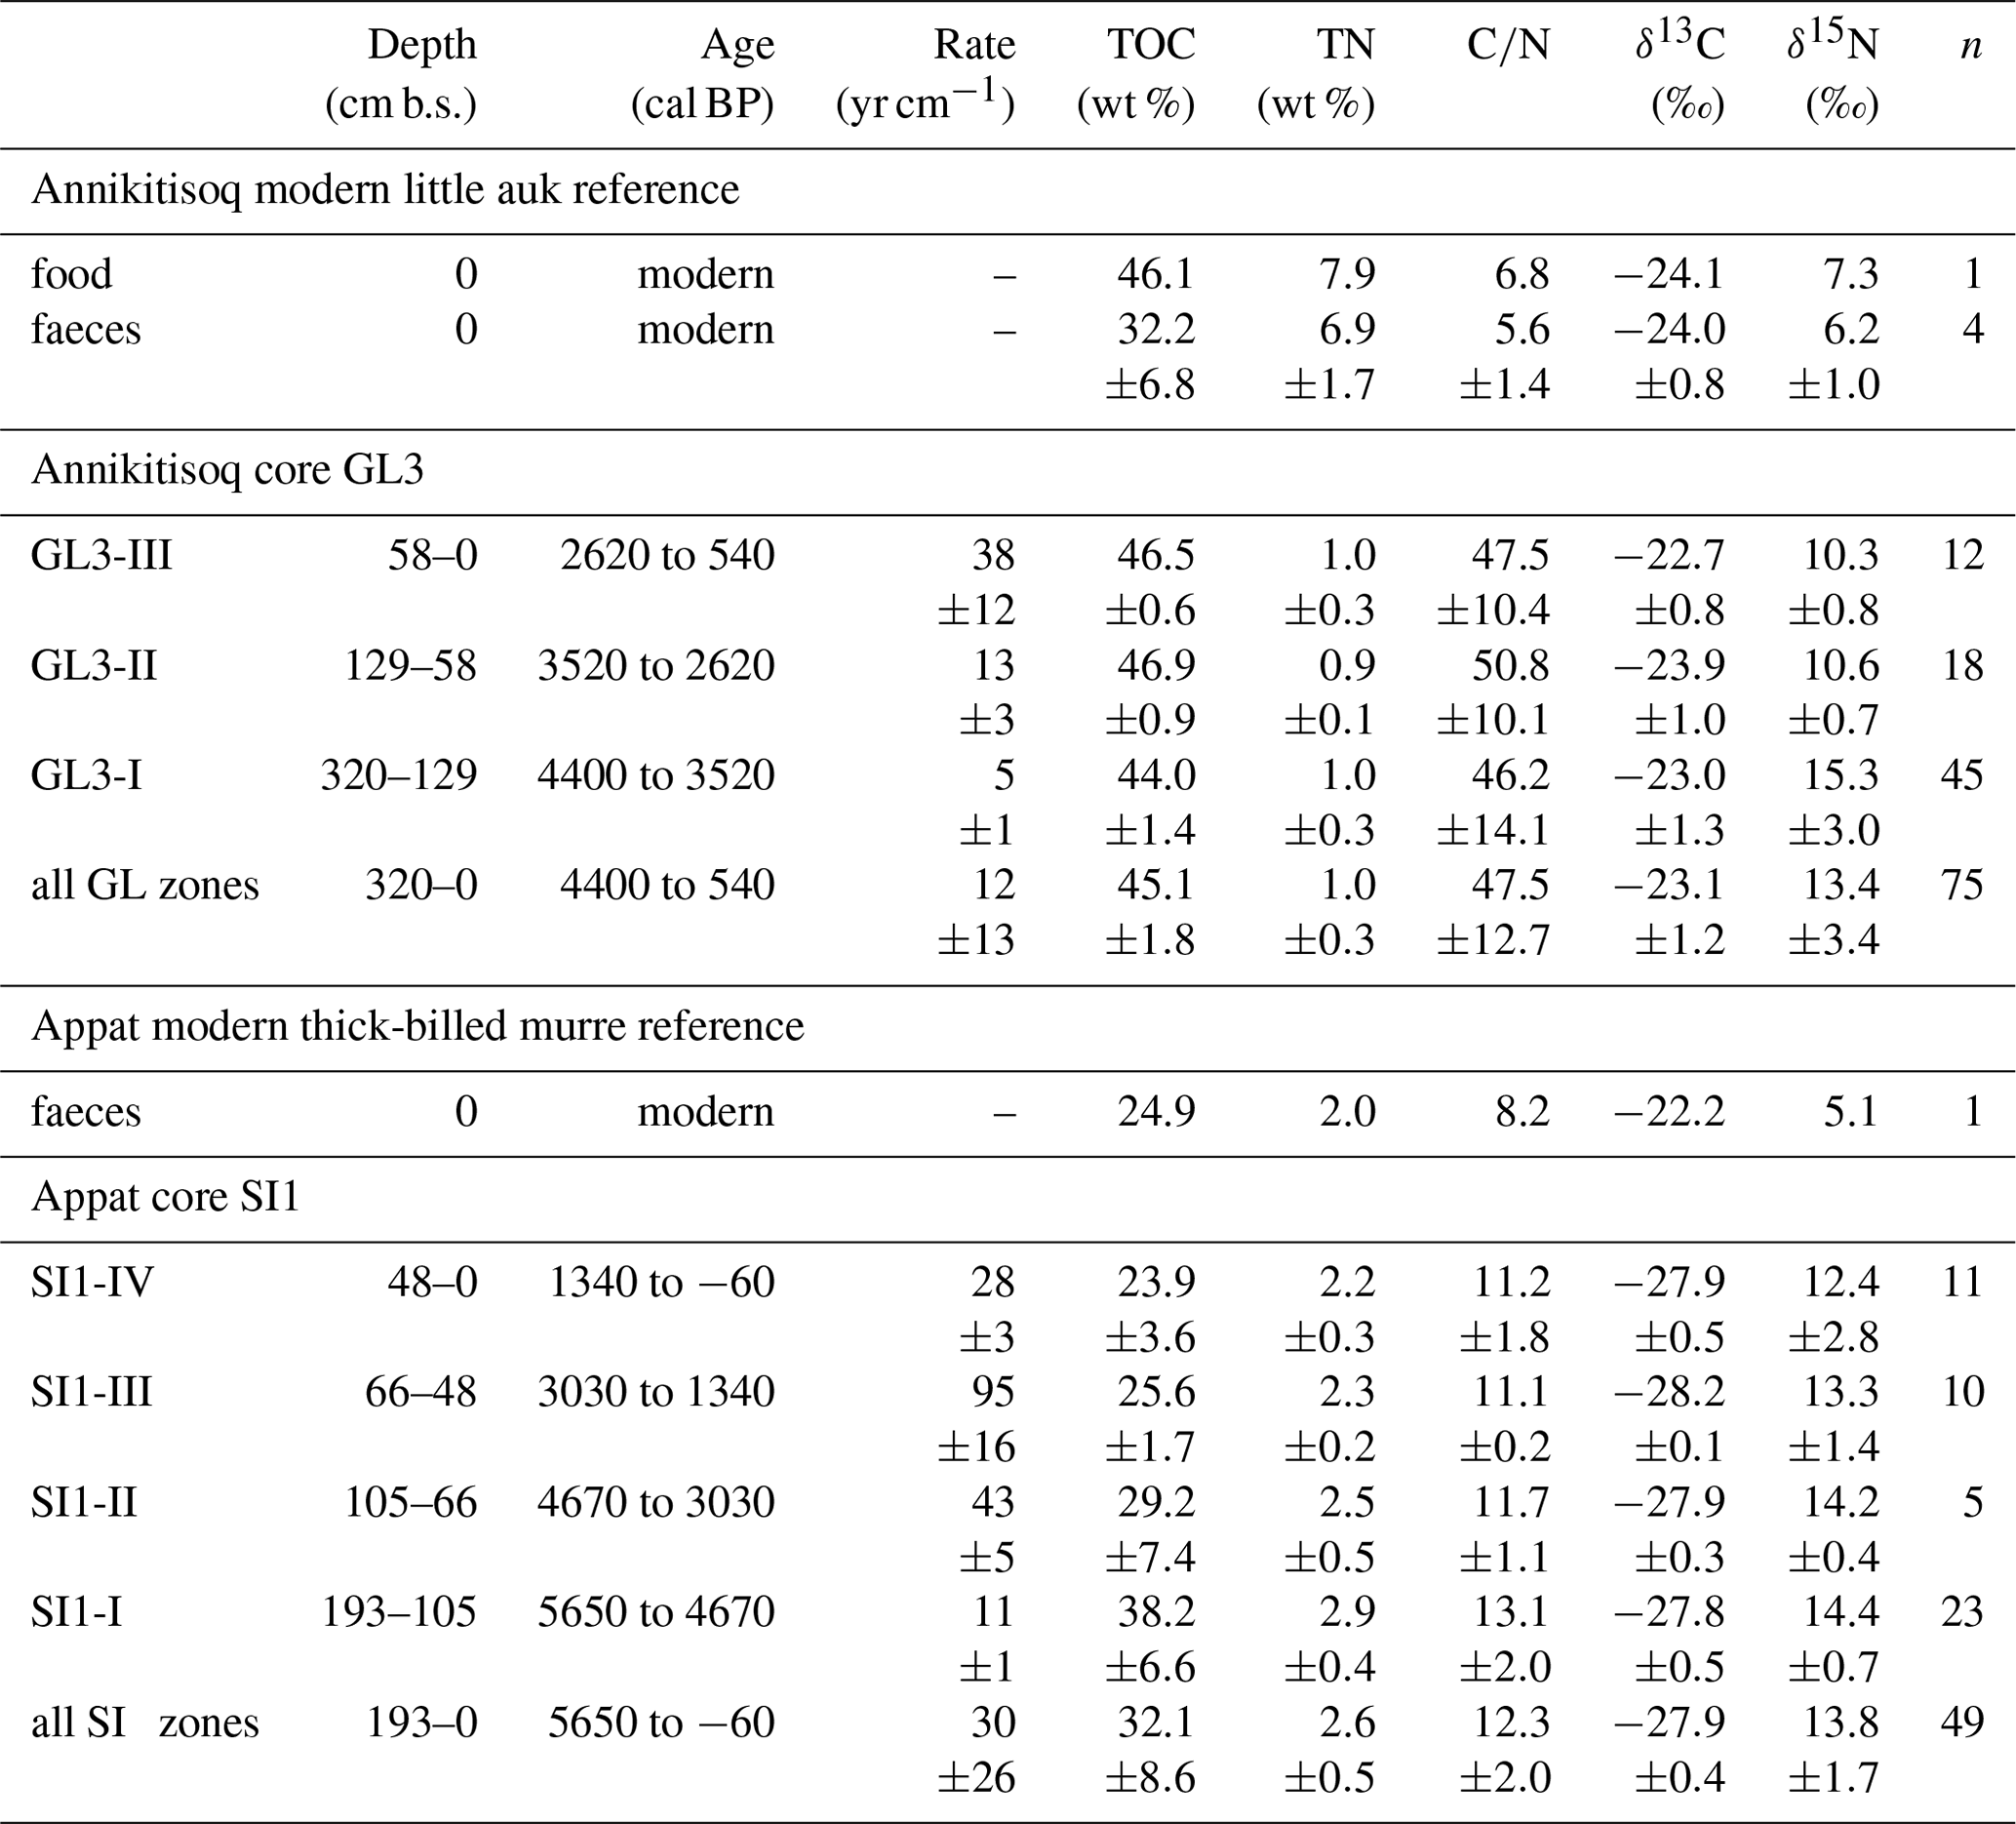
Total nitrogen (TN) and total organic carbon (TOC) contents of the peat samples were measured with elemental analyzers (Elementar Vario EL III for TN and Elementar Vario MAX C for TOC; analytical accuracy ±0.1 wt %). The ratio of TOC and TN is referred to as C∕N. Stable carbon (δ13C) and nitrogen (δ15N) isotope analysis was undertaken using a Thermo Scientific Delta V Advantage isotope ratio mass spectrometer equipped with a Flash 2000 organic elemental analyzer using helium as a carrier gas. Values are given as per mill (‰) difference from the Vienna Pee Dee Belemnite (VPDB) standard for δ13C and from nitrogen in ambient air (AIR) for δ15N. The accuracy was better than ±0.15 ‰ for δ13C and ±0.2 ‰ for δ15N. Further details are given in Davidson et al. (2018). The OM analyses of the modern source material (bird food and faeces samples, Table 2) were undertaken at the UC Davis Stable Isotope Facility, California, USA, whose lab procedures are described in detail at https://stableisotopefacility.ucdavis.edu/ (last access: 5 January 2019). The long-term standard deviation is 0.2 ‰ for δ13C and is 0.3 ‰ for δ15N.
Table 2Modern reference and core data from Annikitisoq and Appat showing the core zonation by depth and time intervals, the accumulation rates as well as the mean values and standard deviation of organic matter properties per zone and per entire core.
3.4 Testacean analysis
Samples of about 1 g (dry weight) for testacean analysis were suspended in purified water and wet-sieved through a 500 µm screen. Testacean shells were identified on glycerin slides under a light microscope and ecologically characterized following Chardez (1965), Beyens and Bobrov (2016), and Bobrov et al. (2013). Count numbers of testacean shells per sample were generally low (Tables S1 and S2 in the Supplement). Thus, the interpretation is cautiously based on the ecological groups combining species with similar requirements under specific habitat and environmental conditions. Species of the eurybiontic, moss-inhabiting, and hydrophilic ecological groups were distinguished. The eurybiontic species occur in soils and tolerate a wide range of environmental conditions. Moss-inhabiting species were further distinguished into xerophilic or hygrophilic ecological groups indicating dry or wet conditions, respectively. The hydrophilic group comprises species that inhabit open water bodies. Changes in the ratio of ecological groups indicate changes in environmental conditions, primarily habitat moisture.
4.1 Annikitisoq – core GL3 and wedge ice GL3 data
The polygon development at Annikitisoq covers the period from 4400 to 540 cal BP over the total core length of 320 cm and the succession was divided into three zones as follows: GL3-I (4400 to 3520 cal BP, 320 to 129 cm b.s.), GL3-II (3520 to 2620 cal BP, 129 to 58 cm b.s.), and GL3-III (2620 to 540 cal BP, 58 to 0 cm b.s.) (Table 2).
Zone GL3-I is composed of reddish light-brown partly stratified peat with nonparallel, wavy lenticular and irregular reticulated cryostructures. Single ice lenses were >1 mm thick. The zones GL3-II and GL3-III (except for the uppermost 20 cm active layer) comprise frozen brown peat with the same cryostructures as in GL3-I. The ice content is high in the frozen core with a mean value of 80±4 wt %, while the moisture content of the active layer decreases to 39 wt % in the uppermost sample. The accumulation rate reflects fast polygon growth after establishment of the little auk colony and decreases in a stepwise manner over time (Fig. 4). TN and TOC show low variation over the entire record with mean values of 1.0±0.3 wt % and 45.1±1.8 wt %, respectively. The C∕N increases in GL3-I from the bottom upwards from 28 up to a maximum value of 92. Within GL3-II, the C∕N varies considerably between 39 and 85 and decreases in GL3-III from 62 to 27 with deceasing depth. The stable carbon and nitrogen compositions of the GL3 core shows some variations in zone GL3-I with a mean of ‰ in δ13C and a mean of 15.3±3.0 ‰ in δ15N. In zone GL3-II, δ13C still varies around ‰, while δ15N remains steady with 10.6±0.7 ‰ as it does in GL3-III with 10.3±0.8 ‰, where also δ13C shows only little variation with ‰ (Fig. 4).
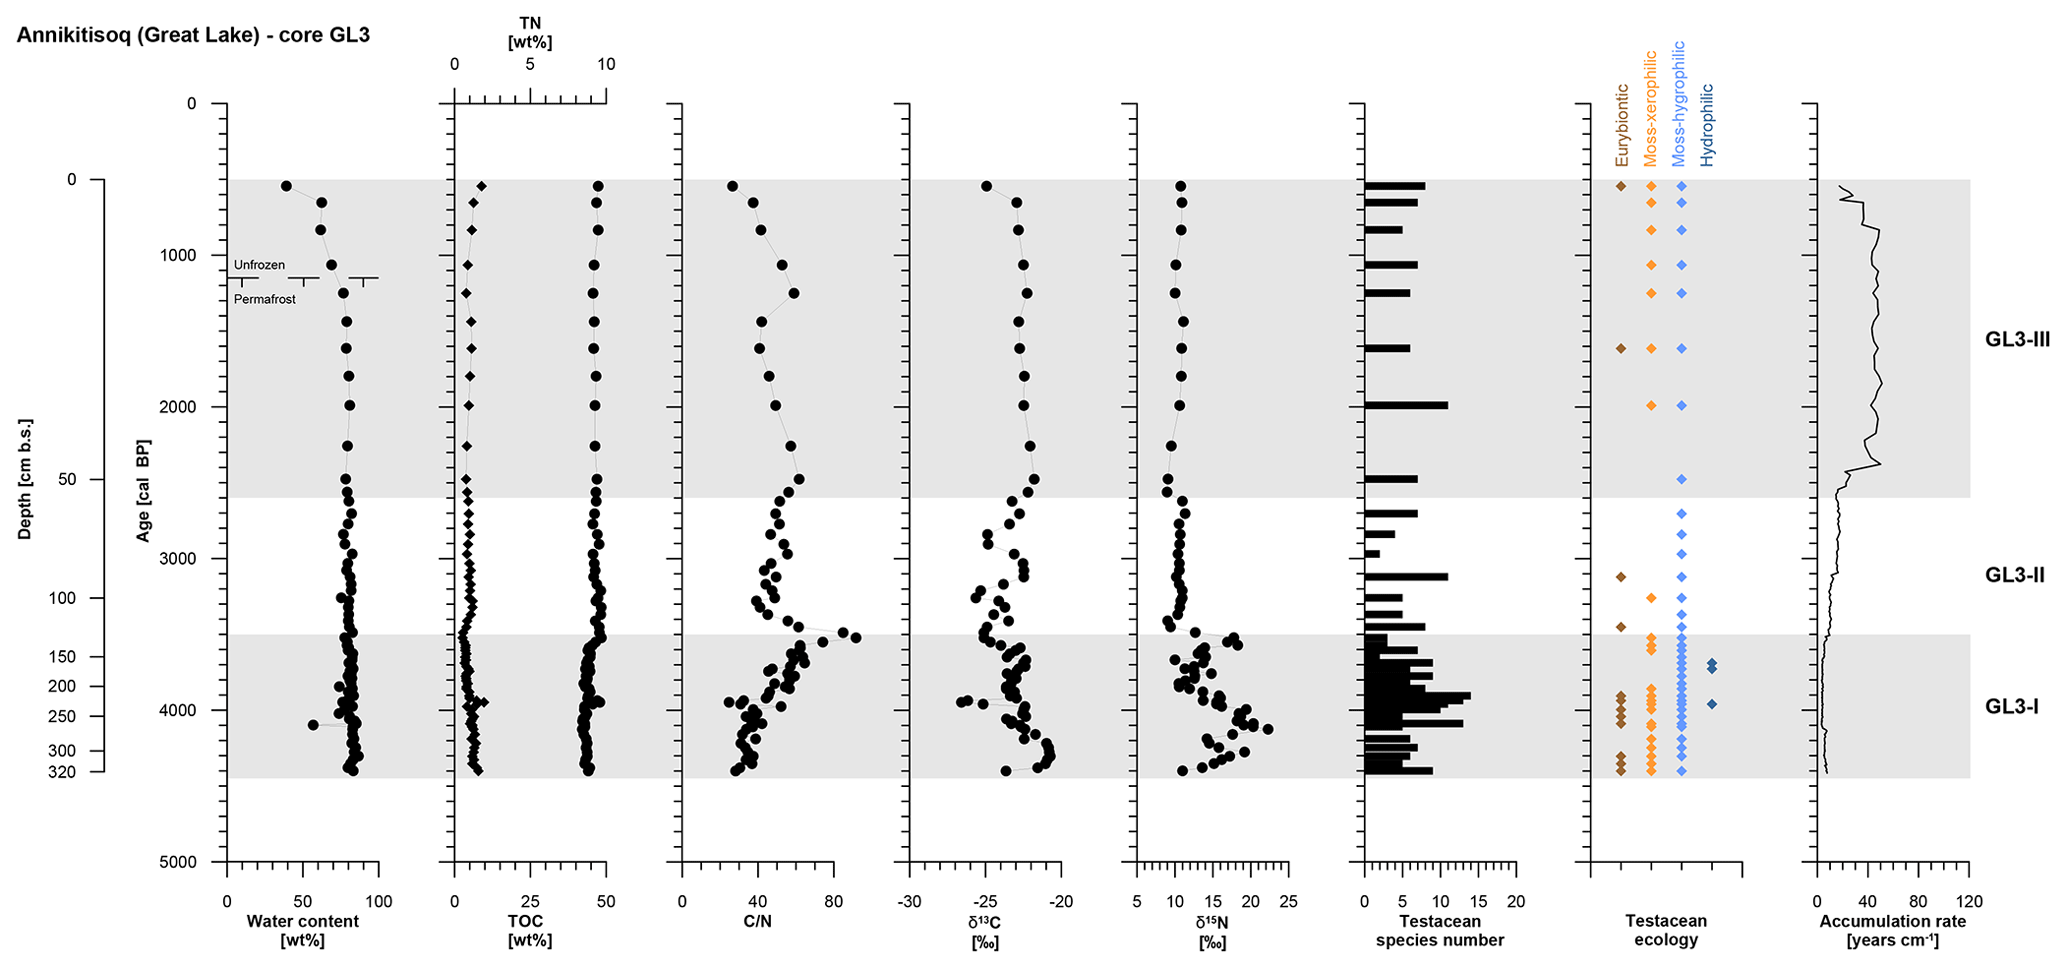
Figure 4OM data and age information according to Davidson et al. (2018) as well as testacean ecological groups and zonation of core GL3 from Annikitisoq. TN data are given as black diamonds and refer to the upper x axis.
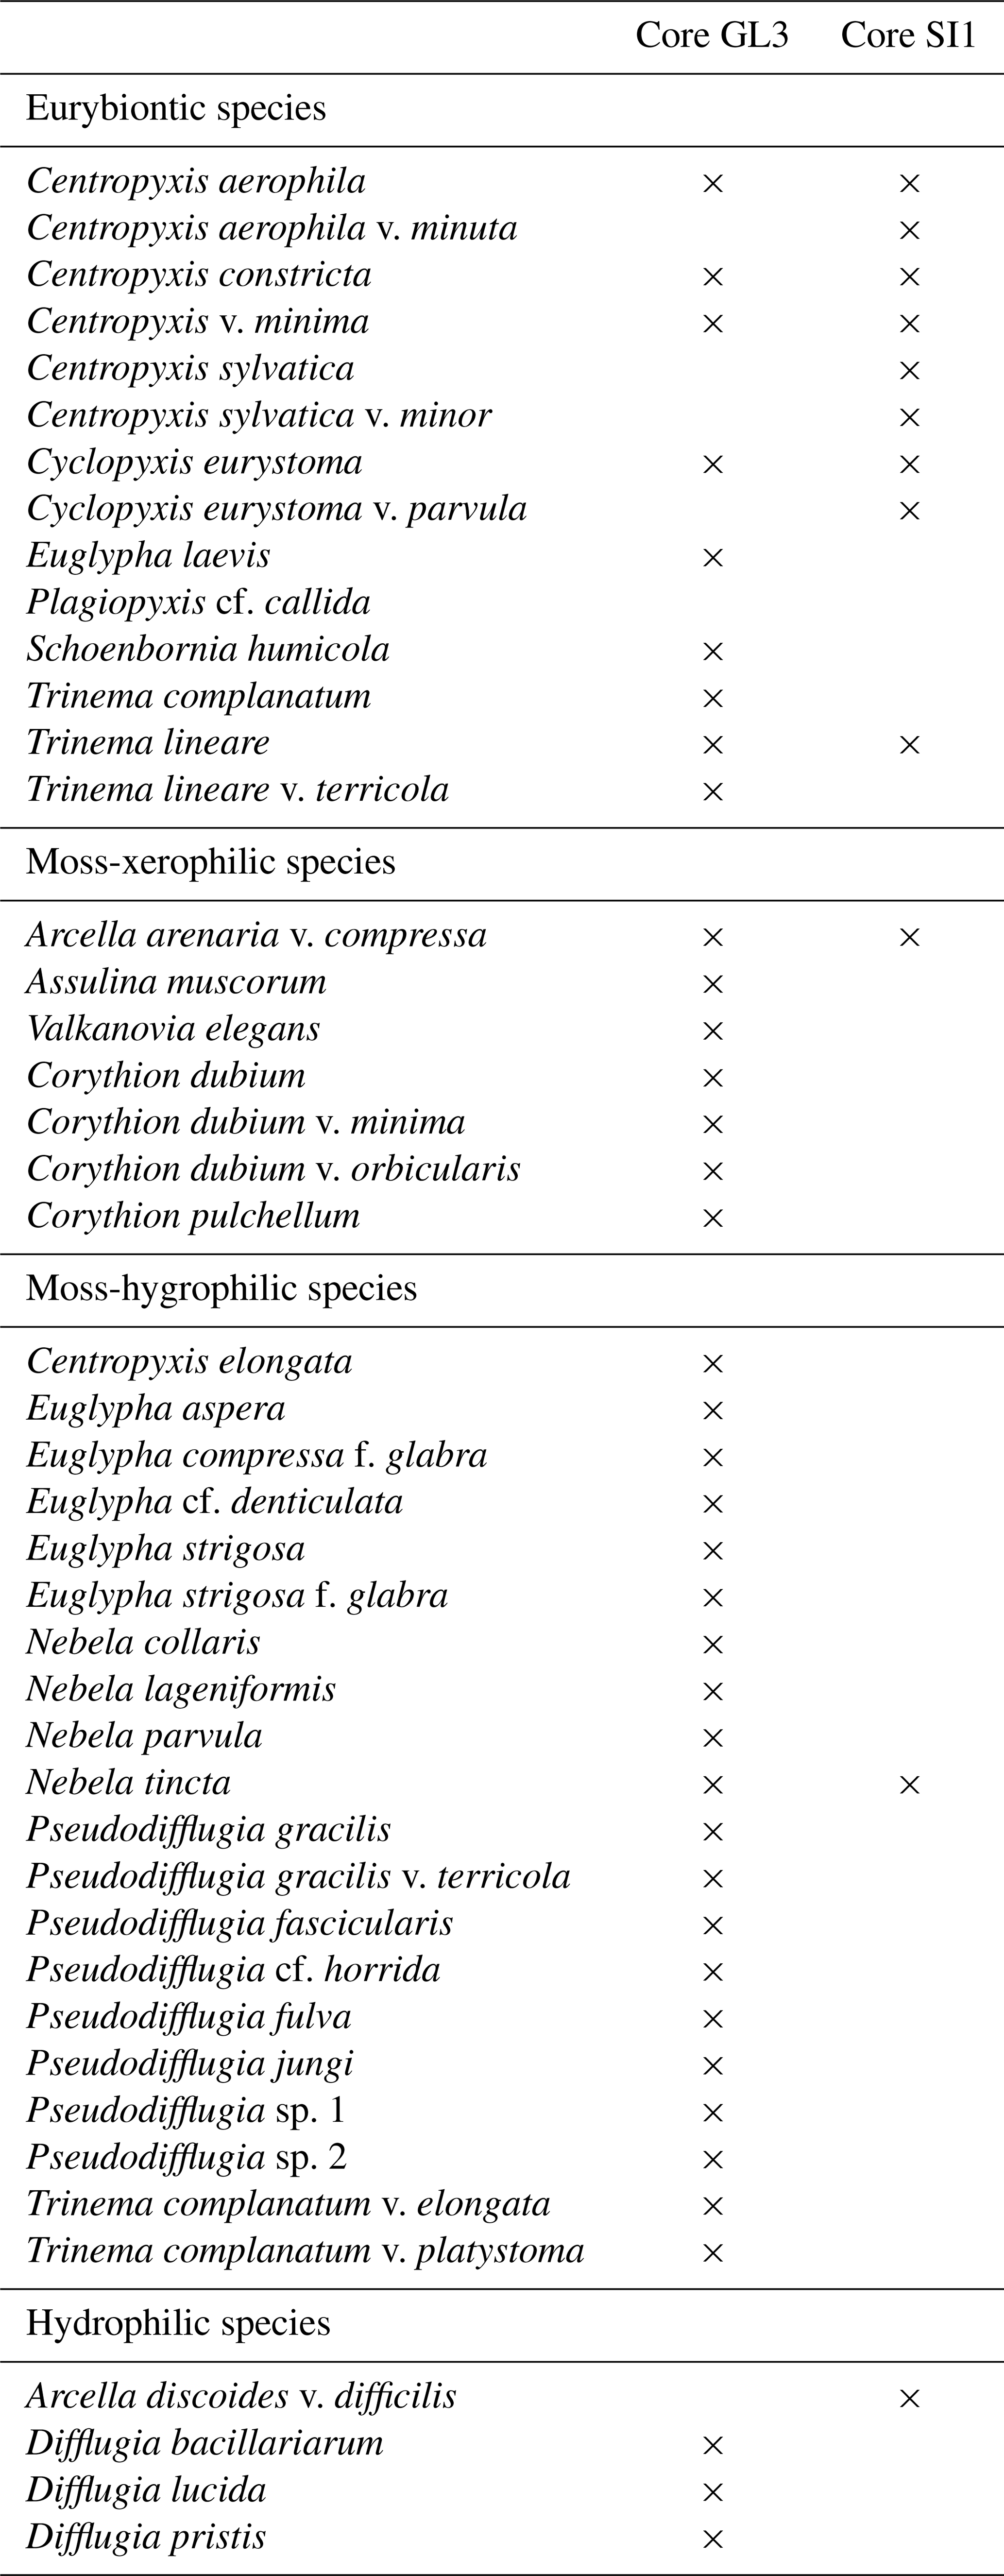
The testacean record of core GL3 comprises 39 taxa (Table 3). Of those, 20 belong to the moss-inhabiting hygrophilic group, including mainly the genera Euglypha, Nebela, and Pseudodifflugia. Moss-inhabiting xerophilic testaceans mainly of the genus Corythion amount to seven species. Eurybiontic species mainly of the genera Centropyxis, Cyclopyxis, and Trinema are present with nine species. Three hydrophilic species of the genus Difflugia are rare and occur solely in zone GL3-I.
Table 3Presence of testacean species and their ecological indication in core GL3 from Annikitisoq and core SI1 from Appat (Saunders Island).
In zone GL3-I, varying soil moisture at the rim and the center of the developing low-center polygon is mirrored by xerophilic and hygrophilic species, while the episodical presence of hydrophilic species indicates open water conditions (Fig. 4). Constant wet conditions continue in zone GL3-II where hygrophilic species dominate. In zone GL3-III, xerophilic and eurybiontic species reoccur with the continued presence of hygrophilic species, indicating moisture changes and occasional dry out.
The wedge ice sampled in a trench at the GL3 polygon exhibited visible vertical ice veins and numerous air bubbles <1 mm in diameter, causing a whitish appearance. At the left edge of the exposure (Fig. 3a), the wedge ice was in direct contact with the peat and clear ice above (Fig. 3b). The clear ice included single, vertically elongated air bubbles <1 mm in diameter and up to 10 mm long and very few larger air bubbles about 1 mm in diameter. Wedge ice and clear ice differ in appearance and isotopic composition. The wedge ice shows mean δ18O of ‰, mean δD of ‰, and mean d excess of 7.7±0.7 ‰ with low variation. The clear ice shows mean δ18O of ‰, mean δD of ‰, and mean d excess of 2.2±0.8 ‰. The slopes in the δ18O–δD cross plot are close to the global meteoric water line (GMWL) for the wedge ice with 7.27 but more deviated for the clear ice with 6.09 (Fig. 3c).
4.2 Appat – core SI1 data
The SI1 core covers the period from 5650 to −60 cal BP and was divided into four periods of polygon development: SI1-I (5650 to 4670 cal BP, 193 to 105 cm b.s.), SI1-II (4670 to 3030 cal BP, 105 to 66 cm b.s.), SI1-III (3030 to 1340 cal BP, 66 to 48 cm b.s.), and SI1-IV (1340 to −60 cal BP, 48 to 0 cm b.s.) (Table 2).
The entire SI1 core is rather homogeneous and is composed of clayish gray-brown peat including single pebbles. The cryostructures are not visible except for vertical ice veins about 10 cm long and <1 mm thick at 130 to 120 cm b.s. and at 80 to 70 cm b.s. The ice content shows some variations with a slight decrease over time and a mean value of 69±7 wt %. The active layer (10 cm thick) had a moisture content of 49 wt %.
As in the GL3 core, core SI1 shows a stepwise decrease in accumulation rates over time from SI1-I to SI1-III, while the uppermost zone, SI1-IV, returned to higher accumulation rates at 28±3 yr cm−1 (Fig. 5, Table 2).
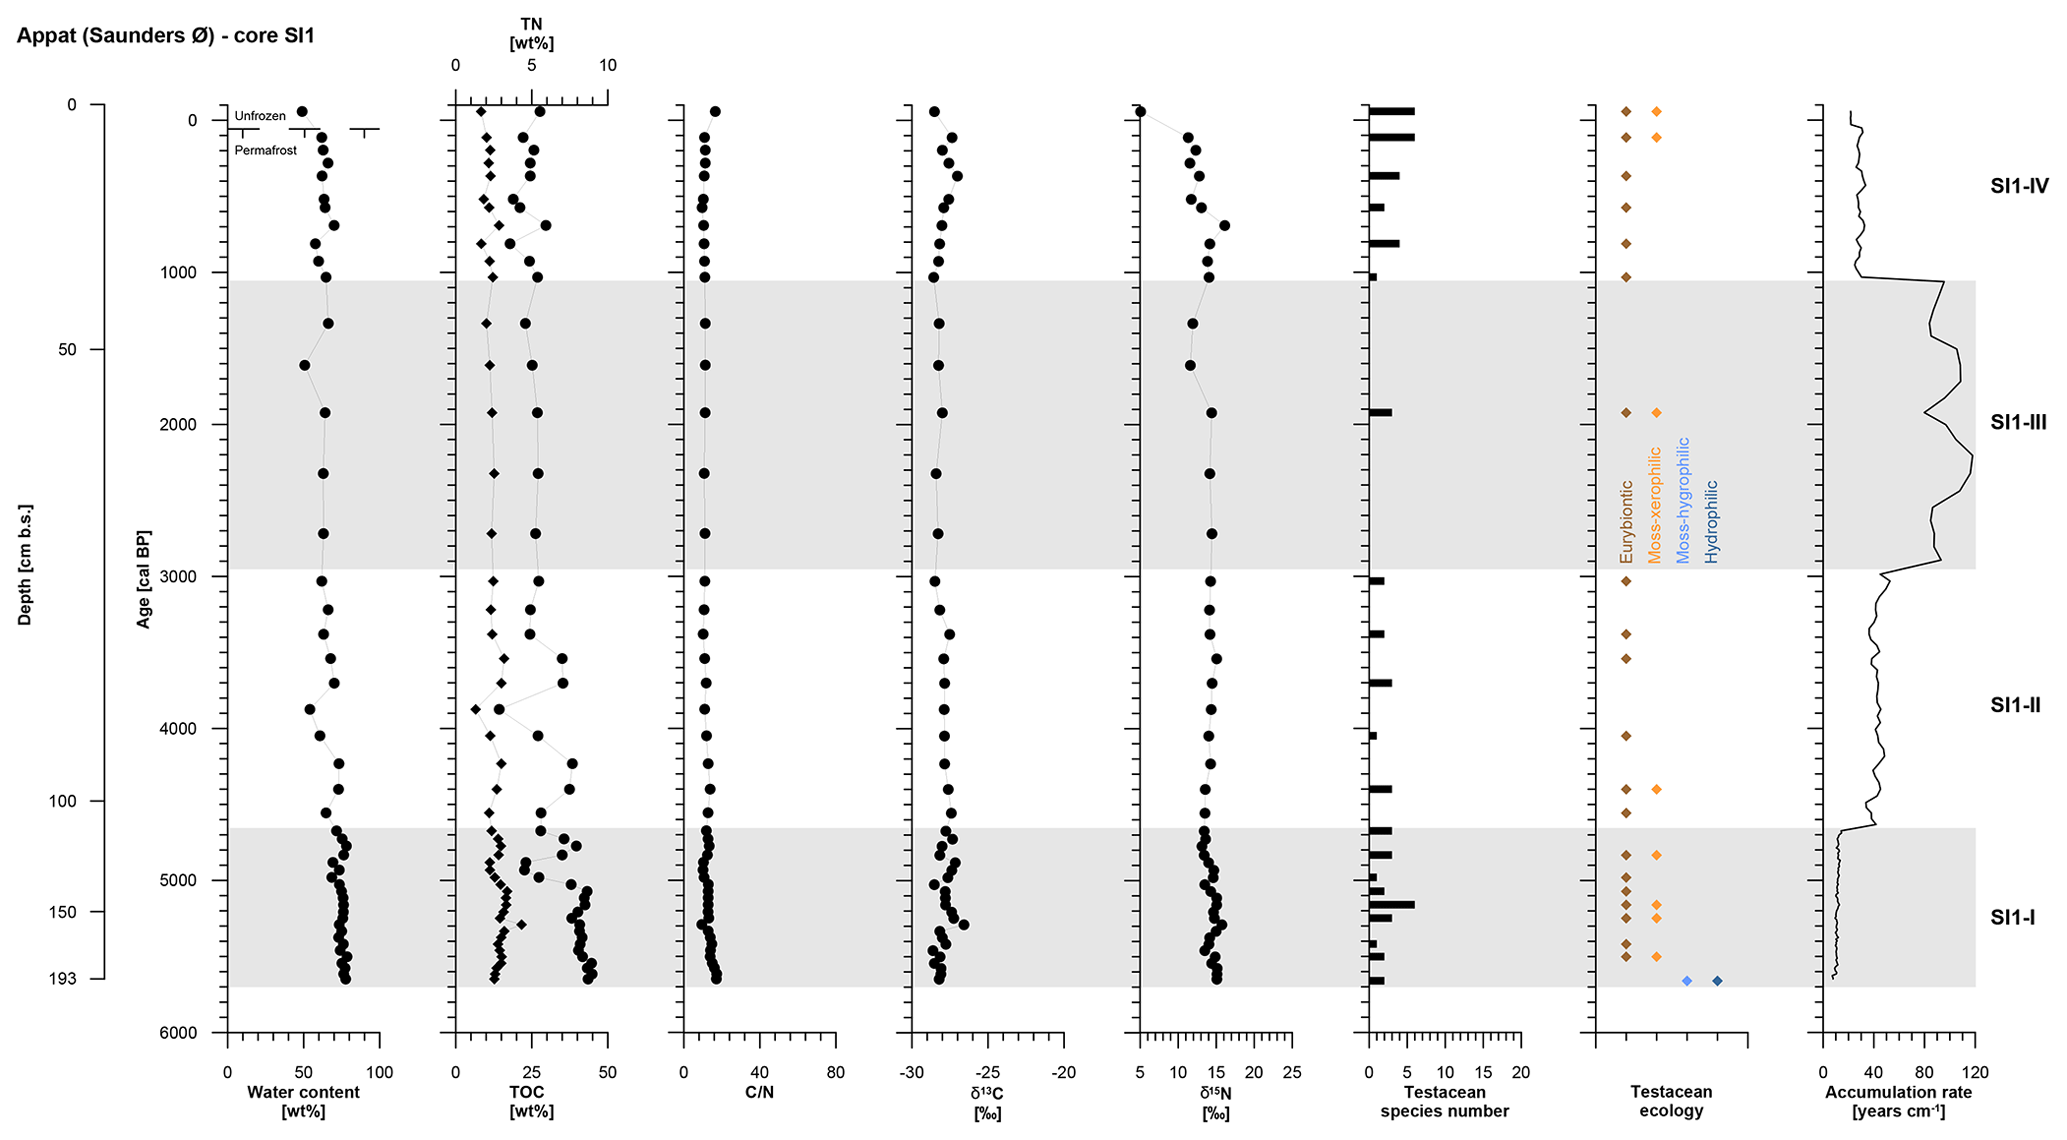
Figure 5OM data and age information according to Davidson et al. (2018) as well as testacean ecological groups and zonation of core SI1 from Appat. TN data are given as black diamonds and refer to the upper x axis.
Both TN and TOC contents exhibit an overall slight decrease over time in mean values per zone. The C∕N and δ13C vary very little along the entire SI1 core with mean values of 12±2 and ‰, respectively. The δ15N record of core SI1 reflects a decrease in mean values per zone of 2 ‰ between SI1-I and SI1-IV (Fig. 5, Table 2).
Testaceans are rare and not diverse in core SI1 with only 12 species present (Table 3). Nine of these belong to the eurybiontic group. The wet onset of polygon evolution is reflected by hydrophilic Arcella discoides v. difficilis and hygrophilic Nebela tincta in the lowermost zone, SI1-I, while rather dry conditions are indicated by xerophilic and eurybiontic species through most of the core (Fig. 5).
5.1 Regional Holocene climate history and ice wedge polygon development
The abrupt warming at the Younger Dryas–Holocene transition promoted intense deglaciation in the Canadian Arctic and Greenland (Briner et al., 2016) and left large parts of the northern Baffin Bay coastlines free of glacial ice from the Early Holocene (Bennike and Björck, 2002). Early Holocene deglaciation of the Wolstenholme Fjord area was dated to 11.2 and 10.6 ka cal BP (Bennike and Björck, 2002). Radiocarbon-dated marine bivalves in raised marine deposits on Appat, although at a different location as our study site, show ages between about 9.9 and 9.2 ka cal BP (Farnsworth et al., 2018) in agreement with modeled deglaciation data for the Greenland ice sheet according to which both Appat and Annikitisoq became ice free around 10 to 9 ka cal BP (Lecavalier et al., 2014). Epigenetic freezing of the areas newly exposed by ice sheet retreat and glacio-isostatic rebound is assumed, while the setup of syngenetic permafrost aggradation as recorded in the lowermost peat zones above bedrock is dated to 5.7 ka cal BP on Appat and to 4.4 ka cal BP at Annikitisoq (Davidson et al., 2018). Thus, the deglaciation preceded the formation of peat and ice wedge polygon development by several thousands of years. The syngenetic permafrost onset falls into the neoglacial cooling period with declining summer insolation after about 7.8 ka cal BP (e.g., Briner et al., 2016; Lecavalier et al., 2017). However, the formation of ice wedge polygons is closely related to the presence of seabird colonies, which provide MDNs that fertilize the vegetation and initiate peat accumulation, and the presence of breeding seabirds is in turn dependent on the formation of the NOW (Davidson et al., 2018). The polynya formation results from the development of an ice arch during winter in the southern part of Kane Basin in Nares Strait (Barber et al., 2001; Barber and Massom, 2007). The ice arch blocks the inflow of drift ice from the north and the prevailing northerly winds and currents sweep the area south of the ice arch free from the new ice that continuously forms on the sea surface, keeping the polynya open. Wind-driven upwelling in the eastern part of the polynya provides heat and nutrients from deeper waters, and the combination of open water (light) and a steady supply of nutrients to the photic zone creates the conditions for the exceptional productivity of the NOW (Stirling, 1980), and in turn the basis for the large seabird breeding populations (Møller et al., 2018).
To reconstruct Holocene temperature changes, Lasher et al. (2017) employed δ18O of chironomid head capsules from Secret Lake in the Thule District as a proxy for the δ18O of precipitation, which is further related to surface air temperature. This proxy approach yields maximum estimates of Holocene temperature changes but is, as the study states, biased in summer and early autumn. The inferred summer season temperatures that were up to 4 ∘C warmer than today decreased from about 7.7 until about 2.3 ka cal BP before reaching colder than today temperatures, including the coldest period after about 1.2 ka cal BP (Lasher et al., 2017). The reconstructed period of decreasing summer temperatures covers the onset of permafrost aggradation at both sites, on Appat and at Annikitisoq, and likely relates to the dynamics of the NOW as reflected in sea surface temperature (SST), sea surface salinity (SSS), and sea ice cover (SIC) proxy data from marine sediments such as dinocyst records (Levac et al., 2001). After the breakup of perennial sea ice cover in the northern Baffin Bay around 10.5 ka cal BP, Holocene minima in SIC with up to 4–5 ice-free months per year occurred between about 7.4 and 4 ka cal BP accompanied by maxima in August SST and SSS (Levac et al., 2001). The same interval is represented in benthic foraminifera records of species composition and δ13C, indicating occasional upwelling between 7.3 and 4 ka cal BP and maximum upwelling between 4 and 3.1 ka cal BP (Knudsen et al., 2008).
The exceptional setting of climate and oceanographic conditions maintained the polynya that attracted seabirds to colonize the shores of the northern Baffin Bay and controlled, by doing so, the onset of peat accumulation and syngenetic ice wedge polygon growth. The spatial distribution of the polygonal peat development is related to seabird colonies. Peat records published by Malaurie et al. (1972) from a little auk colony site at Iita at the northern edge of the NOW indicate continuous peat growth since 1795 cal BP (Delibrias et al., 1972; calibrated using INTCAL, CALIB REV7.1.0; Stuiver and Reimer, 1993; Reimer et al., 2013) at a mean accumulation rate of 37 yr cm−1 over the entire section of 52 cm. This rate is similar to the value of 38±12 yr cm−1 obtained from the uppermost GL3-III core zone of the Annikitisoq core dated from 2620 to 540 cal BP (Table 2). Malaurie et al. (1972) interpreted their data as “the rate of growth of the peat deposits shows high degree of dependence upon local conditions”. This is supported by the present study, which also emphasizes variation in peat accumulation over time dependent on local conditions. The control of peat by birds and thus permafrost accumulation is further altered by internal polygon dynamics that are traceable by testacean records (Bobrov et al., 2013). The onset of polygon formation in rapidly aggrading peat above bedrock since 4400 cal BP is likely indicated by the presence of xerophilic Corythion species in the lowermost part of GL3-I. These species build their shells from silicate, and their presence might thus point to bedrock weathering during initial polygon mire formation. The change to stagnant water in a low-center polygon is mirrored by the occurrence of hydrophilic Difflugia species within zone GL3-I. The even presence of hygrophilic species such as Nebela tincta and Pseudodifflugia gracilis in zones GL3-I and GL3-II further mirrors constantly wet conditions during the formation of these zones until about 2620 cal BP. In zone GL3-III, xerophilic species such as Assulina muscorum and Corythion dubium point to varying moisture conditions with drier periods. The latter likely indicates dry-up of degrading polygons when low-center polygons transform into high-center polygons due to starting wedge ice meltout and concurrent inversion of the polygonal micro-topography during the GL3-III deposition. Today, the polygons are present in their degradation stages as high-center polygons when the initially grown ice wedges melt out and form trenches between the polygon centers.
An ice wedge remnant was sampled at Annikitisoq (Fig. 3) at about 1.2 m depth below the GL3 polygon surface. This position suggests that the wedge ice formed mainly during accumulation of the GL3-II core zone, i.e., after 3520 cal BP although direct dating of the ice is not available. The wedge ice shows low variation in δ18O, δD, and deuterium excess. The slope of 7.27 of the wedge ice data fits that of the modern Thule (local) meteoric water line (7.33; Fig. 3c), indicating the meteoric moisture source of the wedge ice. The offset between mean values of the modern cold season (October–May) precipitation in Thule (−27 ‰ in δ18O, −207 ‰ in δD; GNIP database, 2018) and the Holocene wedge ice (−18 ‰ in δ18O, −136 ‰ in δD) data is obvious. Comparable observations are known from studies in Siberia (e.g., Opel et al., 2011) and Canada (e.g., Grinter et al., 2018) and explained by isotopic changes within the snow cover prior to melting (Opel et al., 2018) as well as exchange between liquid water, snow and ice during snowmelt and refreezing. Thus, the wedge ice data are seen as the Late Holocene cold season precipitation signal. In contrast, the water building up the clear ice underwent evaporation before freezing as shown by the lower slope of 6.09 (Fig. 3c). The clear ice likely originated from summertime runoff water that ponded in the trench above the degrading ice wedge. It shows values of about −13 ‰ in δ18O and −98 ‰ in δD, which, if compared with warm season precipitation (June–September, −19 ‰ in δ18O and −142 ‰ in δD; GNIP database, 2018), is isotopically heavier, most likely due to evaporation (Fig. 3c). The Late Holocene wedge ice data from Annikitisoq are the first of such records from Greenland, while comparable stable water isotope records of the High Arctic are rare and limited to Svalbard (Vasil'chuk et al., 2015; Vittinghus et al., 2008).
In summary, the Holocene NOW dynamics controlled by oceanographic and climate variation enabled bird colonization of shores of the Thule District. The recorded onset of bird presence and thus of ice wedge polygon development at about 4400 cal BP at Annikitisoq and at about 5650 cal BP on Appat (Davidson et al., 2018) falls within the period of decreasing temperatures and decreasing SIC, and SST and SSS maxima and the deduced establishment of the NOW (Levac et al., 2011). Thus, the syngenetic permafrost formation directly depending on peat deposition (controlled by bird activity) indirectly follows the Holocene climate trends.
5.2 Organic matter signatures as a reflection of bird presence
A study by Zwolicki et al. (2013) compared the impact of a little auk and a mixed thick-billed murre and kittiwake (Rissa tridactyla) colony on soil physical and chemical properties at the northern coast of Hornsund Fjord, Spitsbergen. The study emphasizes that bird presence generally enhances nutrient content and soil conductivity and lowers pH. However, the different food sources of the birds, i.e., planktivorous little auk vs. piscivorous thick-billed murre and kittiwake, affect the colony surroundings in different ways. The main differences between the little auk colony at Annikitisoq and the thick-billed murre colony on Appat are apparent in TOC, TN, and C∕N data in the uppermost active layer samples of the respective core units, GL3-III and SI1-IV. They comprise about 2-fold higher TOC and 2-fold lower TN in the GL3-III active layer (with little auk) compared with the SI1-IV active layer (thick-billed murre), resulting in a large difference in C∕N (40 in GL3-III compared to 17 in SI1-IV).
The OM input from bird colonies with 15N-enriched isotopic composition (i.e., higher δ15N) is traceable in the developing peat below the colonies (González-Bergonzoni et al., 2017; Gąsiorowski and Sienkiewicz, 2019). The magnitude of the fertilizing influence by the little auks on the colony surroundings can be considerable, ranging from 1.2 g m−2 direct deposition of dry faeces per day in a little auk colony in Spitsbergen to 0.5 g m−2 d−1 at a distance of 200 m from the bird colony towards the sea (Zwolicki et al., 2013). In the NOW area, little auks are estimated to deposit >3500 t of N in the terrestrial environment each year and to affect vegetation productivity over an area of >200 km2 (Mosbech et al., 2018). If the δ15N signature of peat below colonies is taken as a rough proxy of the number of birds in the colony, the peat accumulation rates and δ15N should relate to each other. In the GL3 core from Annikitisoq, three zones can be differentiated with accumulation rates decreasing from 5±1 yr cm−1 in GL3-I to 13±3 yr cm−1 in GL3-II and 38±12 yr cm−1 in GL3-III, while the δ15N becomes more depleted from 15.3±3.0 ‰ in GL3-I to 10.6±0.7 ‰ in GL3-II and 10.3±0.8 ‰ in GL3-III (Table 2). The ice content of the frozen peat in the GL3 core constitutes most of the material and is comparably high for all three units, the only decrease occurring in the uppermost part of GL3-III (Fig. 4). Thus, the variation in the accumulation rate is related to past vegetation growth and peat formation rather than to permafrost (ice) aggradation. The relation between δ15N as a tracer of colony productivity and peat accumulation is not linear; it undoubtedly further depends on the N turnover and isotopic fractionation along the pathway from source (food) to faeces via the birds' metabolism, further to vegetation, and finally to peat via microbial metabolism. However, the thick-billed murre core, SI1, from Appat shows no relation between peat accumulation rates, which are generally lower than the GL3 core, and OM signatures, which are much less variable than the GL3 core (Fig. 5, Table 2). The difference in peat accumulation rates between the sites might relate to the different colony sizes, the little auk colony being much larger than the thick-billed murre colony, as well as to the different preferences of the two bird species with regard to location of breeding sites. While the little auk commonly breeds on the coastal fringe in screes continuing somewhat inland (Mosbech et al., 2018), most thick-billed murre colonies are on steep cliffs directly facing the coast (Kampp, 1990). Thus, MDN input of the latter on terrestrial colony surroundings is reduced if compared with those of little auk.
When comparing the C∕N ratios with δ13C, both sites exhibit a clear marine source of the bird-derived OM as seen in similar signatures in food and faeces for little auk and in faeces of thick-billed murre (Fig. 6). Both peat cores show clear terrestrial signatures in the C∕N-δ13C relation,; however, the GL3 core shows a large shift from the marine source in C∕N at relatively stable δ13C (Fig. 6a), while the SI1 core shows a large shift in δ13C at relatively stable but low C∕N (Fig. 6b).
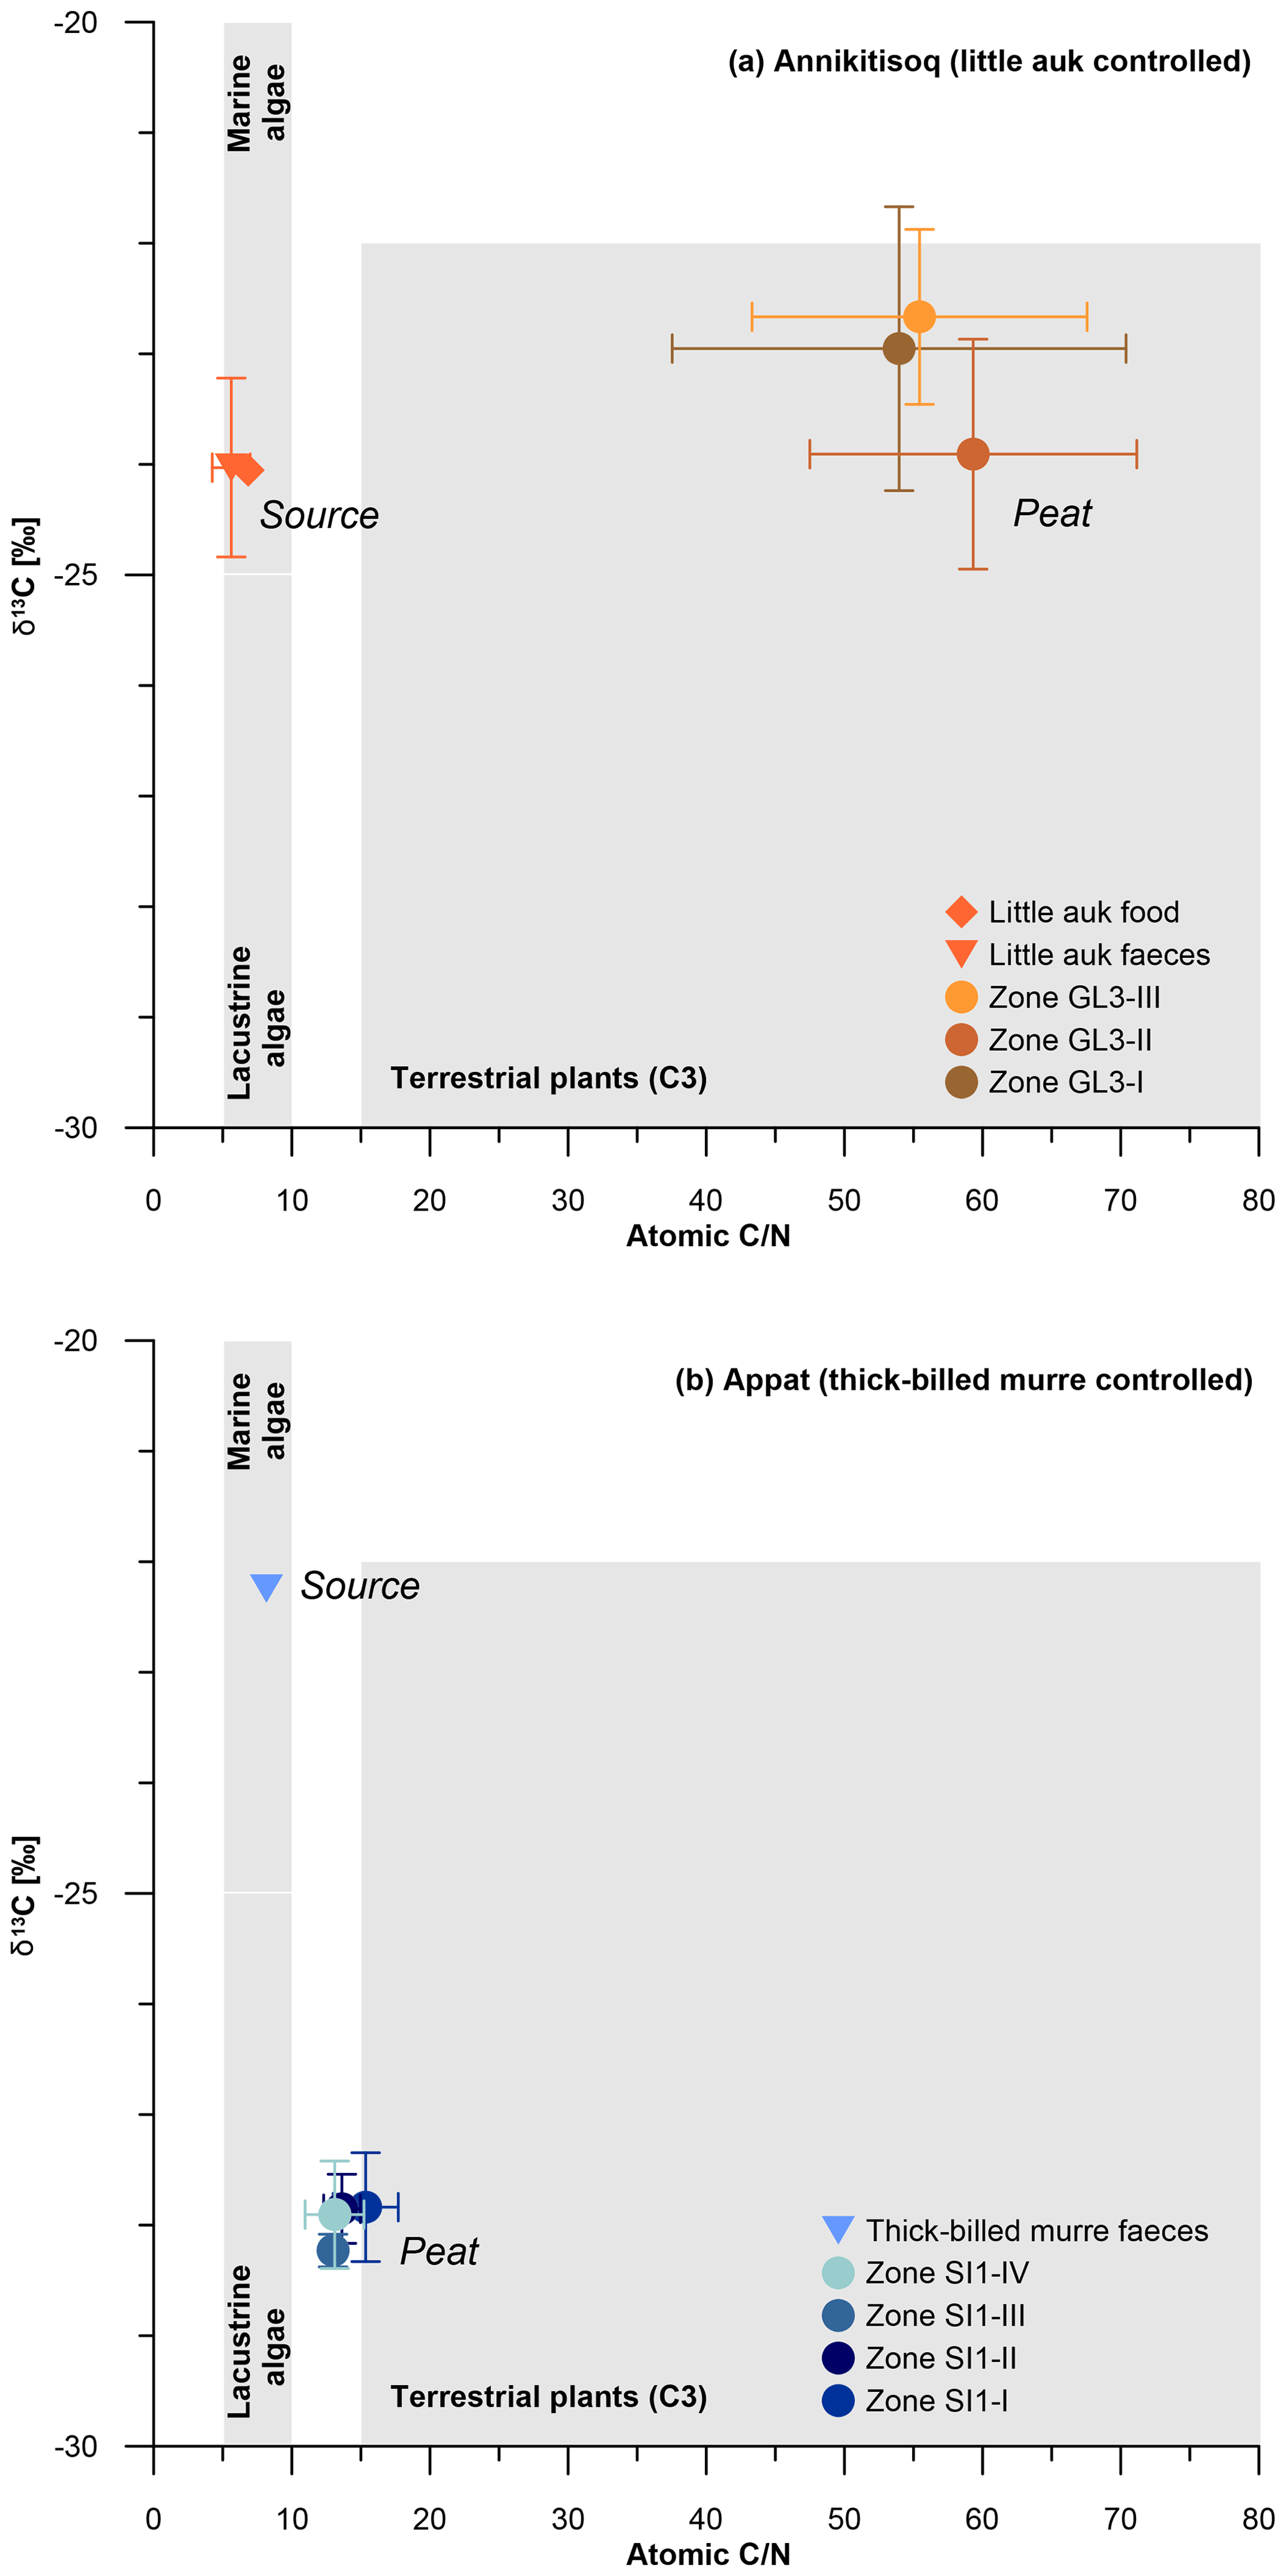
Figure 6C∕N and δ13C composition of bird-controlled permafrost areas (a) at Annikitisoq and (b) on Appat, compiling data from MDN sources such as bird food (diamonds) and bird faeces (triangles), and the peat core zones of GL3 and SI1 (circles). Data are given in Table 2. Gray shaded areas refer to Meyers (1997).
This pattern reflects the temporal dimension of OM decomposition when high accumulation rates as observed in the GL3 core (12±13 yr cm−1) induce less time for decomposition in the uppermost active layer before becoming permafrost. This is seen in high C∕N (core mean of 47.5±12.7), indicating a low degree of decomposition (Kuhry and Vitt, 1996) and almost unaltered δ13C. Compared with the food and faeces signatures, the latter shows only a small variation of about 1 ‰ between the mean δ13C of −24 ‰ in both food and faeces and the mean δ13C of ‰ in the GL3 core (Fig. 6a). In contrast, the SI1 core shows a more than 2-fold lower accumulation rate (core mean of 30±26 yr cm−1) than core GL3 (core mean of 12±13 yr cm−1) and low C∕N (core mean of 12.3±2.0), indicating a higher degree of OM decomposition if compared with the GL3 core. The δ13C source signal (δ13C of −22.2 ‰) is over 5 ‰ less depleted than the SI1 peat (core mean δ13C of ‰), which further supports a stronger OM alternation in the SI1 peat than in the GL3 peat (Fig. 6b).
Nitrogen distribution and turnover influenced by little auk have been studied at the northern shore of Hornsund Fjord in Spitsbergen (Skrzypek et al., 2015). There, the major N sources have been examined by means of δ15N and quantified as atmospheric deposition (38 %), primary N2 fixation from the atmosphere (26 %) and bird faeces deposition (36 %). Thus, the impact of bird presence is notable as also shown by González-Bergonzoni et al. (2017) in samples from NW Greenland. While tracking the pathway of δ15N from the marine realm to land via little auks, Skrzypek et al. (2015) found similar signatures in the birds' food of 7.0±0.9 ‰ (Wold et al., 2011) and in the faeces of 8.1±0.5 ‰. In the little auk data from Annikitisoq, the shift from food (δ15N of 7.3±0.0 ‰) to faeces (δ15N of 6.2±1.0 ‰) is comparably small and almost within the standard deviation ranges of each other. Substantial parts of the N provided by bird presence likely spread in the area by outwash after snowmelt and become altered by microbial turnover (ammonia volatilization), resulting in a 15N-enriched substrate with a comparably heavier δ15N composition (Skrzypek et al., 2015).
The microbial-biased fractionation from bird faeces to plant-available substrate amounts to about 5 ‰ (Fig. 7) and is seen in the isotopic composition of the uppermost sample (δ15N of 10.8 ‰ at 0–5 cm b.s.) of the GL3 core. We assume that the GL3 core is affected both by numerous droppings on the surface, as observed, and additional outwash from the colony situated close by, upslope from the coring site, which is a similar setting as in the ornithocoprophilous and wet moss tundra types studied by Skrzypek et al. (2015) at Hornsund, Spitsbergen. There, the share of bird-related N input used by plants reaches up to 100 %. The δ15N of Polytrichastrum alpinum moss, which is present in the GL3 core, reaches values between 9.2 ‰ and 11.4 ‰ in the ornithocoprophilous tundra (bulk soil 11.4±1.4 ‰) and between 10.1 ‰ and 10.8 ‰ in the wet moss tundra (bulk soil 8.8±3.4 ‰ to 13.1±1 ‰). Thus, the shift in the Spitsbergen data of up to 4 ‰ between little auk faeces and moss and up to 5 ‰ between little auk faeces and bulk soil is of the same extent as that demonstrated from the Annikitisoq data.
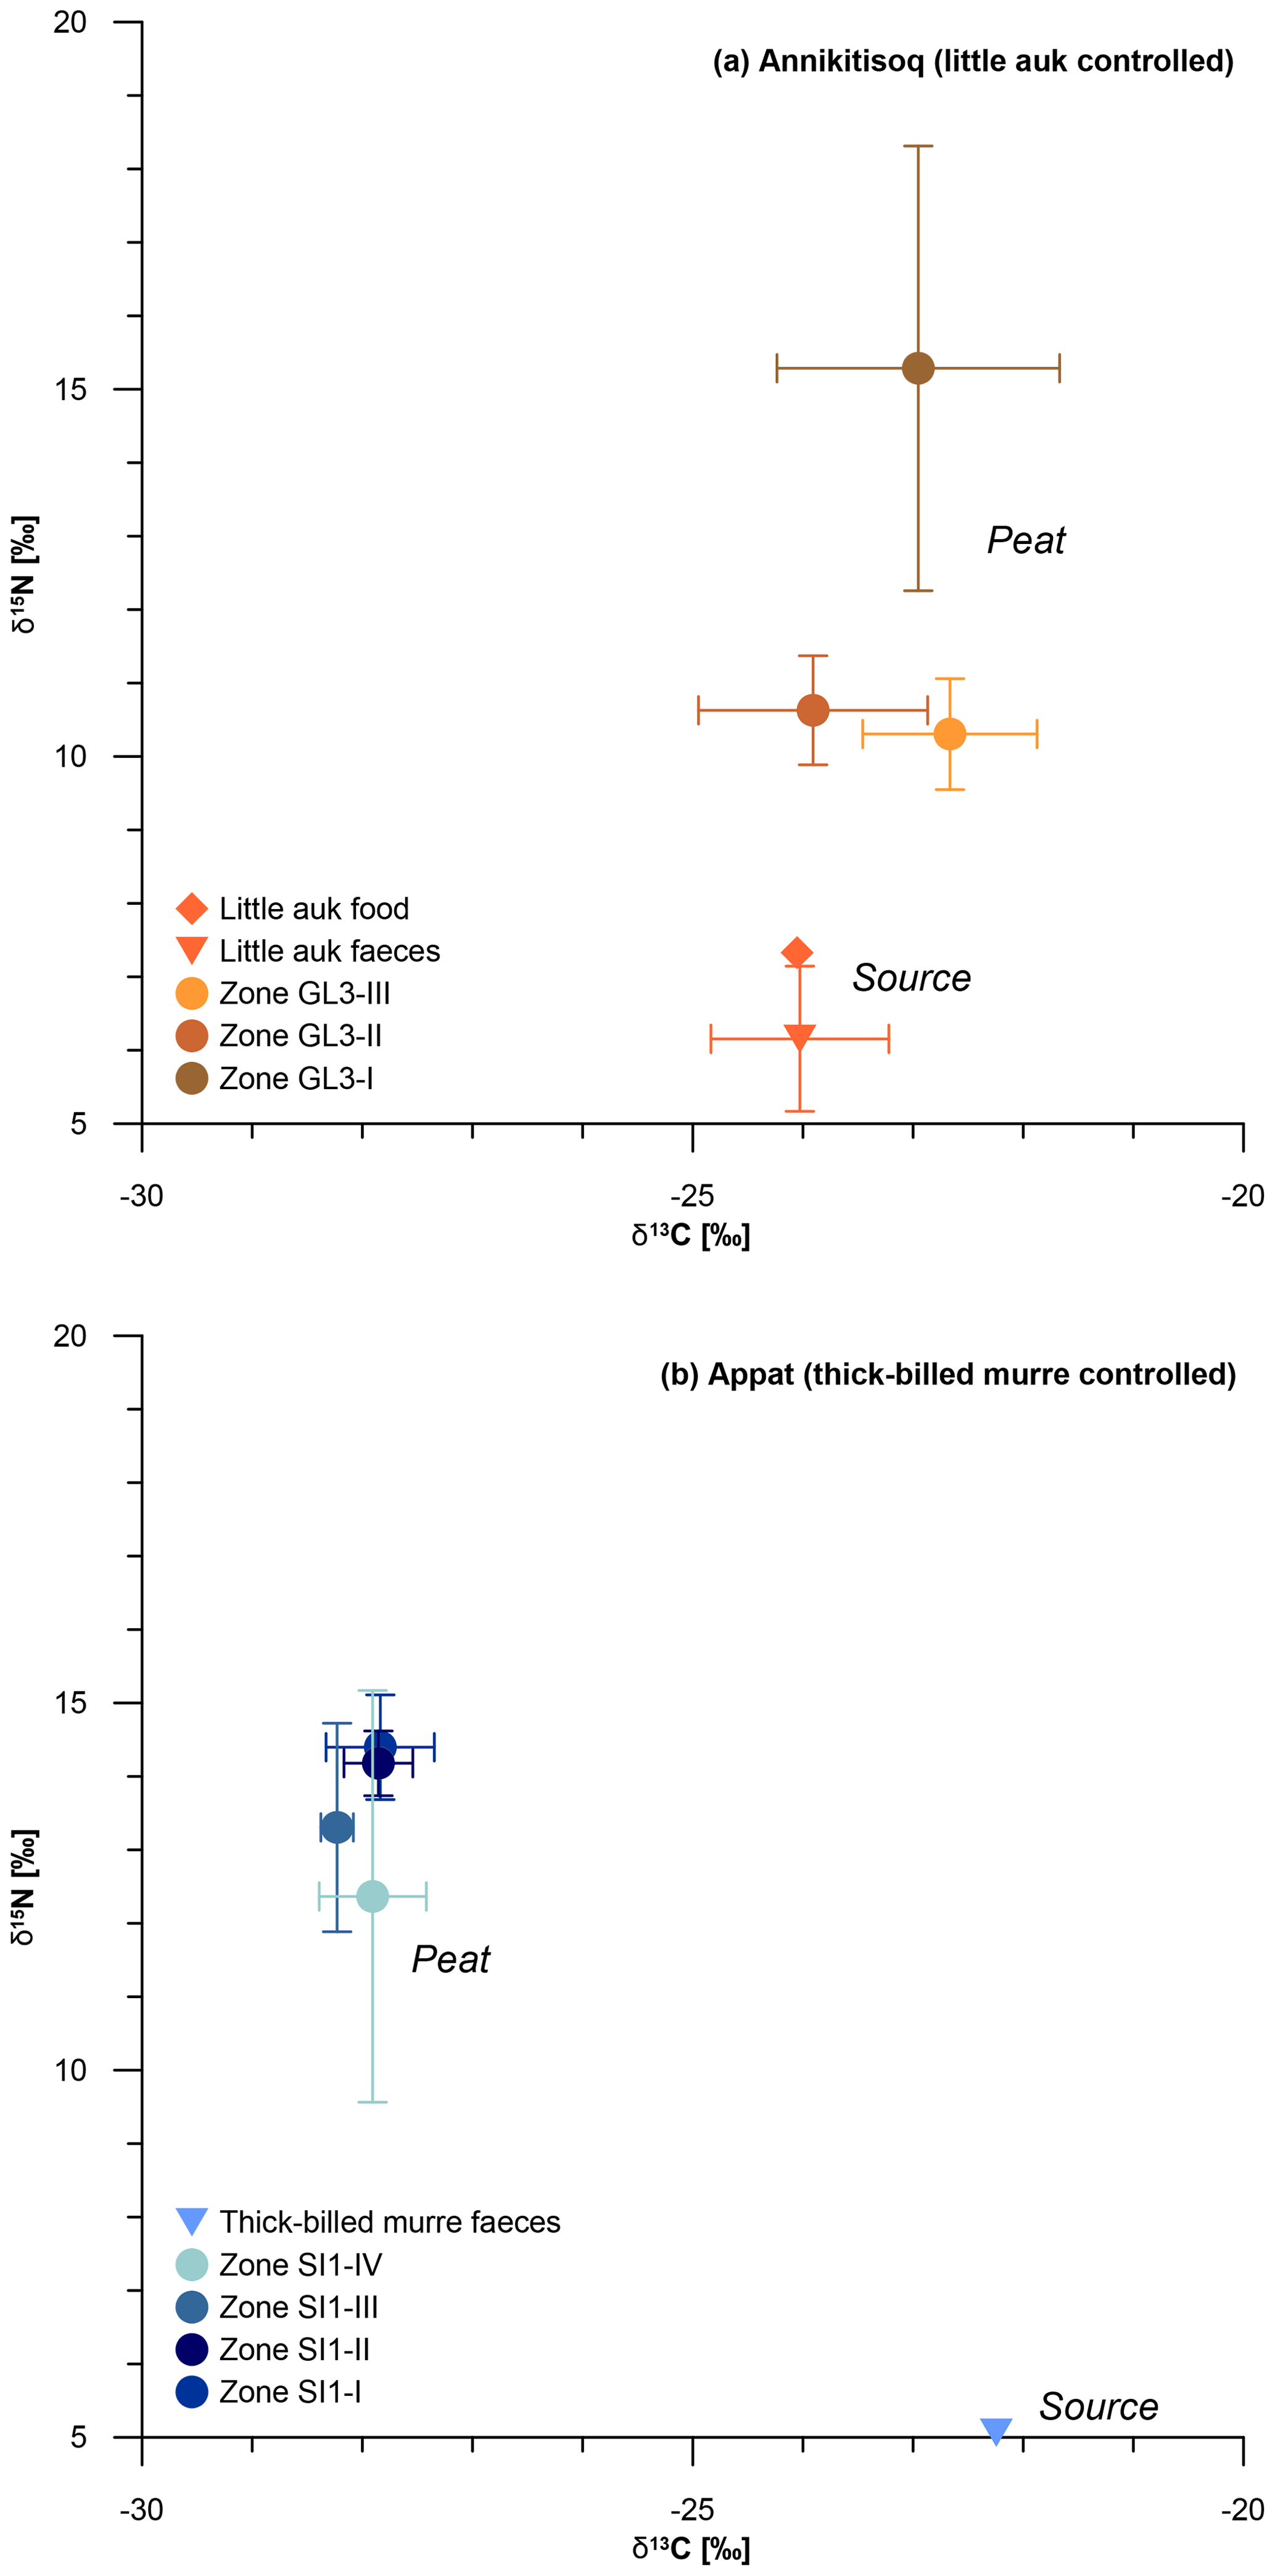
Figure 7δ13C and δ15N composition of bird-controlled permafrost areas (a) at Annikitisoq and (b) on Appat, compiling data from MDN sources such as bird food (diamonds) and bird faeces (triangles) and the peat core zones of GL3 and SI1 (circles). Data are given in Table 2.
Comparable stable isotope data of piscivorous thick-billed murre food have not yet been obtained. The information presented here shows no shift between faeces (δ15N of 5.1 ‰) and surface (δ15N of 5.1 ‰ at 0–10 cm b.s.) and a shift of about 7 ‰ between faeces and the uppermost zone SI1-IV (mean δ15N of 12.4±2.8 ‰, Table 2). It is notable in both the GL3 and SI1 cores that the mean δ15N per zone decreases from the bottom upwards, i.e., from old via young to modern sources (Fig. 7, Table 2).
In summary, the impact of seabird colony presence is evidenced for both studied species and these results are comparable with previous studies (e.g., González-Bergonzoni et al., 2017; Skrzypek et al., 2015; Zwolicki et al., 2013). The δ15N signature of permafrost OM preserves the bird-induced MDN input and might serve as a tracer of colony size over time, although δ15N fractionation by microbial turnover alters the signal by about 5 ‰ in the little-auk-related data and by about 7 ‰ in the thick-billed-murre-related data from bird faeces to plant-available substrate. Peat accumulation rates driven by vegetation growth correspond to the observed δ15N trends where decreasing peat accumulation leads to increasing depletion of δ15N as seen in the little-auk-related data of core GL3, while thick-billed-murre-related data of core SI1 show more than 2-fold lower accumulation rates, a much higher degree of OM decomposition, and an almost stable δ15N.
The impact of seabird colonies on High Arctic terrestrial environments is seen in the input of marine-derived nutrients that is traceable by geochemical signatures of organic matter in C∕N to δ13C relations. The resulting fertilization facilitated Late Holocene vegetation growth and subsequent peat accumulation and permafrost aggradation in otherwise barren areas. In the study area in NW Greenland, ice wedge polygons developed during the Late Holocene in the vicinity of both planktivorous little auk and mainly piscivorous thick-billed murre colonies. The two bird species affect the surroundings of their colonies in different ways as reflected by the about 2-fold higher TOC and 2-fold lower TN in the uppermost samples of the little-auk-affected peat compared with the samples of thick-billed-murre-affected peat, resulting in a large difference in C∕N. The little-auk-affected peat core shows decreasing accumulation rates and decreasing δ15N (in mean values per core zone) from old to young, while variations in accumulation rates of thick-billed-murre-affected peat are not concurrent with the almost stable δ15N. The concurrent onset of seabird colonies and syngenetic ice wedge polygon formation after the establishment of the NOW during the neoglacial cooling highlights the complex response of biologic and permafrost dynamics to climatic and oceanographic conditions of the Late Holocene.
Original data are available at https://doi.org/10.1594/PANGAEA.907403 (Wetterich et al., 2019).
The supplement related to this article is available online at: https://doi.org/10.5194/bg-16-4261-2019-supplement.
AM and TAD initiated and designed the present study. SW, TAD, and IGB drilled and documented the cores supported by KLJ and AM. TW and IGB carried out stable isotope and OM analyses. AB carried out testacean analysis and interpretation. TO and EJ supported the overall data analysis and interpretation. SW and TAD wrote the paper with contributions from the other co-authors, who contributed equally to the final discussion of the results and interpretations.
The authors declare that they have no conflict of interest.
This study is part of The NOW Project (https://www.NOW.KU.DK, last access: 5 January 2019) funded by the Velux Foundations and the Carlsberg Foundation of Denmark. The base commander at Thule Air Base kindly gave us permission to use the base for transit, while the Danish liaison officer helped with arranging our stay. We are indebted to Frank Landkildehus, Department of Bioscience and Arctic Research Centre, Aarhus University and Tony Rønne Pedersen, Greenland Contractors (GC), for extensive logistic and practical help, and to Erland Søndergård (GC) and Hans Otzen (GC) for boat transport on Blue Jay and Hot Totty. We are also very grateful to the communities in Qaanaaq and Siorapaluk for their hospitality. Laboratory analyses were expertly undertaken by Hanno Meyer, Mikaela Weiner, and Dyke Scheidemann (AWI, Potsdam). We thank Anne Mette Poulsen (Aarhus University) for manuscript editing as well as two anonymous reviewers.
Thomas Opel and Sebastian Wetterich acknowledge funding from the
German Research Foundation (grant nos. OP217/4-1 and WE4390/7-1, respectively).
The article processing charges for this open-access
publication were covered by a Research
Centre of the Helmholtz Association.
This paper was edited by Anja Rammig and reviewed by two anonymous referees.
Barber, D. G. and Massom, R. A.: The role of sea ice in arctic and antarctic polynyas, in: Polynyas, edited by: Walker, O. S. and Barber, D. G., Windows to the World, Elsevier Oceanography Series, 74, 1–54, 2007.
Barber, D. G., Hanesiak, J. M., Chan, W., and Piwowar, J.: Sea ice and meteorological conditions in northern Baffin Bay and the North Water polynya between 1979 and 1996, Atmos. Ocean, 39, 343–359, https://doi.org/10.1080/07055900.2001.9649685, 2001.
Bennike, O. and Björck, S.: Chronology of the last recession of the Greenland Ice Sheet, J. Quaternary Sci., 17, 211–219, https://doi.org/10.1002/jqs.670, 2002.
Beyens, L. and Bobrov, A.: Evidence supporting the concept of a regionalized distribution of testate amoebae in the Arctic, Acta Protozool., 55, 197–209, https://doi.org/10.4467/16890027AP.16.019.6006, 2016.
Bjella, K.: Thule Air Base Airfield White Painting and Permafrost Investigation, Phases I–IV. Cold Regions Research and Engineering Laboratory, US Army Engineer Research and Development Center, Hanover, NH, ERDC/CRREL TR-13-8, 2013.
Blaauw, M. and Christen, J. A.: Flexible paleoclimate age-depth models using an autoregressive gamma process, Bayesian Anal., 6, 457–474, https://doi.org/10.1214/11-BA618, 2011.
Bobrov, A. A., Wetterich, S., Beermann, F., Schneider, A., Kokhanova, L., Schirrmeister, L., Pestryakova, L., and Herzschuh, U.: Testate amoebae and environmental features of polygon tundra in the Indigirka lowland (East Siberia), Polar Biol., 36, 857–870, https://doi.org/10.1007/s00300-013-1311-y, 2013.
Boertmann, D. and Mosbech, A.: Distribution of Little Auk (Alle alle) breeding colonies in the Thule District, Northwest Greenland, Polar Biol., 19, 206–210, https://doi.org/10.1007/s003000050236, 1998.
Briner, J. P., McKay, N. P., Axford, Y., Bennike, O., Bradley, R. S., de Vernal, A., Fisher, D., Francus, P., Frechette, B., Gajewski, K., Jennings, A., Kaufman, D. S., Miller, G., Rouston, C., and Wagner, B.: Holocene climate change in Arctic Canada and Greenland, Quaternary Sci. Rev., 147, 340–364, https://doi.org/10.1016/j.quascirev.2016.02.010, 2016.
Brown, J., Ferrians Jr., O. J., Heginbottom, J. A., and Melnikov, E. S. (Eds.): Circum-Arctic map of permafrost and ground-ice conditions. Washington, DC: U.S. Geological Survey in Cooperation with the Circum-Pacific Council for Energy and Mineral Resources, Circum-Pacific Map Series CP-45, scale 1 : 10 000 000, 1 sheet, 1997.
Cappelen, J. (Ed.): Greenland – DMI Historical Climate Data Collection 1784–2013, Technical Report 14-04, Danish Meteorological Institute, Copenhagen, Denmark, 2014.
CAVM Team: Circumpolar Arctic Vegetation Map, 1 : 7 500 000 scale, Conservation of Arctic Flora and Fauna (CAFF) Map No. 1. U.S. Fish and Wildlife Service, Anchorage, Alaska, 2003.
Chardez, D.: Ecologie générale des Thécamoebiens, Bulletin de l'Institut Agronomique et des Stations de Recherche de Gembloux, 33, 307–341, 1965 (in French).
Craig, H.: Isotopic variations in meteoric waters, Science, 133, 1702–1703, https://doi.org/10.1126/science.133.3465.1702, 1961.
Dansgaard, W.: Stable isotopes in precipitation, Tellus, 16, 436–468, https://doi.org/10.1111/j.2153-3490.1964.tb00181.x, 1964.
Davidson, T. A., Wetterich, S., Johansen, K. L., Grønnow, B., Windirsch, T., Jeppesen, E., Syvyränta, J., Olsen, J., González-Bergonzoni, I., Strunk, A., Larsen, N. K., Meyer, H., Søndergard, J., Dietz, R., Eulears, I., and Mosbech, A.: The history of seabird colonies and the North Water ecosystem: Contributions from palaeoecological and archaeological evidence, Ambio, 47, 175–192, https://doi.org/10.1007/s13280-018-1031-1, 2018.
Delibrias, G., Guillier, M. T., and Labeyrie, J.: Gif natural radiocarbon measurements VII, Radiocarbon, 14, 280–320, https://doi.org/10.1017/S0033822200059373, 1972.
DMI: Danish Meteorological Institute, available at: http://www.dmi.dk/groenland/arkiver/klimanormaler/, last access: 15 May 2018.
Egevang, C., Boertmann, D., Mosbech, A., and Tamstorf, M. P.: Estimating colony area and population size of Little Auk (Alle alle) at Northumberland Island using aerial images, Polar Biol., 26, 8–13, https://doi.org/10.1007/s00300-002-0448-x, 2003.
Farnsworth, L. B., Kelly, M. A., Bromley, G. R. M., Axford, Y., Osterberg, E. C., Howley, J. A., Jackson, M. S., and Zimmerman, S. R.: Holocene history of the Greenland Ice-Sheet margin in Northern Nunatarssuaq, Northwest Greenland, Arktos, 4, 10, https://doi.org/10.1007/s41063-018-0044-0, 2018.
French, H. and Shur, Y.: The principles of cryostratigraphy, Earth-Sci. Rev., 101, 190–206, https://doi.org/10.1016/j.earscirev.2010.04.002, 2010.
Gąsiorowski, M. and Sienkiewicz, E.: Bird population changes reconstructed from isotopic signals of peat developed in a nutrient enriched tundra, Sci. Total Environ., 646, 1359–1366, https://doi.org/10.1016/j.scitotenv.2018.07.453, 2019.
GNIP Database: Global Network of Isotopes in Precipitation, available at: https://www.iaea.org/services/networks/gnip, last access: 20 May 2018.
González-Bergonzoni, I., Johansen, K. L., Mosbech, A., Landkildehus, F., Jeppesen, E., and Davidson, T. A.: Small birds, big effects: The little auk (Alle alle) transforms high Arctic ecosystems, P. R. Soc. B, 284, 20162572, https://doi.org/10.1098/rspb.2016.2572, 2017.
Grinter, M., Lacelle, D., Baranova, N., Murseli, S., and Clark, I. D.: Late Pleistocene and Holocene ice-wedge activity on the Blackstone Plateau, central Yukon, Canada, Quaternary Res., 91, 179–193, https://doi.org/10.1017/qua.2018.65, 2018.
Horwath, J. L., Sletten, R. S., Hagedorn, B., and Hallet, B.: Spatial and temporal distribution of soil organic carbon in nonsorted striped patterned ground of the High Arctic, J. Geophys. Res., 113, G03S07, https://doi.org/10.1029/2007JG000511, 2008.
Howat, I. M., Negrete, A., and Smith, B. E.: The Greenland Ice Mapping Project (GIMP) land classification and surface elevation data sets, The Cryosphere, 8, 1509–1518, https://doi.org/10.5194/tc-8-1509-2014, 2014.
Hughes, O. L. and Terasmae, J.: SIPRE ice-corer for obtaining samples from permanently frozen bogs, Arctic, 16, 270–272, https://doi.org/10.14430/arctic3547, 1963.
Kampp, K.: The thick-billed murre population of the Thule District, Greenland, Arctic, 43, 115–120, https://doi.org/10.14430/arctic1600, 1990.
Kampp, K., Falk, K., and Pedersen, C. E.: Breeding density and population of little auks (Alle alle) in a northwest Greenland colony, Polar Biol., 23, 517–521, https://doi.org/10.1007/s003000000115, 2000.
Knudsen, K. L., Stabell, B., Seidenkrantz, M.-S., Eiriksson, J., and Blake Jr., W.: Deglacial and Holocene conditions in northernmost Baffin Bay: sediments, foraminifera, diatoms and stable isotopes, Boreas, 37, 346–376, https://doi.org/10.1111/j.1502-3885.2008.00035.x, 2008.
Kuhry, P. and Vitt, D. H.: Fossil Carbon/Nitrogen ratios as a measure of peat decomposition, Ecology, 77, 271–275, https://doi.org/10.2307/2265676, 1996.
Lasher, G. E., Axford, Y., McFarlin, J. M., Meredith, A., Kelly, M. A., Osterberg, E. C., and Berkelhammer, M. B.: Holocene temperatures and isotopes of precipitation in Northwest Greenland recorded in lacustrine organic materials, Quaternary Sci. Rev., 170, 45–55, https://doi.org/10.1016/j.quascirev.2017.06.016, 2017.
Lecavalier, B. S., Milne, G. A., Simpson, M. J. R., Wake, L., Huybrechts, P., Tarasov, L., Kjeldsen, K. K., Funder, S., Long, A. J., Woodroffe, S., Dyke, A. S., and Larsen, N. K.: A model of Greenland ice sheet deglaciation constrained by observations of relative sea level and ice extent, Quaternary Sci. Rev., 102, 54–84, https://doi.org/10.1016/j.quascirev.2014.07.018, 2014.
Lecavalier, B. S., Fisher, D. A., Milne, G. A, Vinther, B. M., Tarasov, L., Huybrechts, P., Lacelle, D., Main, B., Zheng, J., Bourgeois, J., and Dyke, A. S.: High Arctic Holocene temperature record from the Agassiz ice cap and Greenland ice sheet evolution, P. Natl. Acad. Sci. USA, 114, 5952–5957, https://doi.org/10.1073/pnas.1616287114, 2017.
Leffingwell, E. d. K.: Ground-ice wedges: The dominant form of ground-ice on the north coast of Alaska, J. Geol., 23, 635–654, https://doi.org/10.1086/622281, 1915.
Levac, E., Vernal, A. D., and Blake Jr., W.: Sea-surface conditions in northernmost Baffin Bay during the Holocene: palynological evidence, J. Quaternary Sci., 16, 353–363, https://doi.org/10.1002/jqs.614, 2001.
Mazei, V. A., Lebedeva, N. V., Taskaeva, A. A., Ivanovsky, A. A., Chernyshov, V. A., Tsyganov, A. N., and Payne, R. J.: Potential influence of birds on soil testate amoebae in the Arctic, Polar Sci., 16, 78–85, https://doi.org/10.1016/j.polar.2018.03.001, 2018.
Malaurie, J., Vasari, Y., Hyvarinen, H., Delibrias, G., and Labeyrie, J.: Preliminary remarks on Holocene paleoclimates in the regions of Thule and Inglefield Land, above all since the beginning of our own era, Acta Universitatis Ouluensis, Series A, Scientiae Rerum Naturalium 3, Geologica, 1, 105–136, 1972.
Merkel, F. R., Labansen, A. L., Boertmann, D. M., Mosbech, A., Egevang, C., Falk, K., Linnebjerg, J. F., Frederiksen, M., and Kampp, K.: Declining trends in the majority of Greenland's thick-billed murre (Uria lomvia) colonies 1981–2011, Polar Biol., 37, 1061–1071, https://doi.org/10.1007/s00300-014-1500-3, 2014.
Meyer, H., Schönicke, L., Wand, U., Hubberten, H. W., and Friedrichsen, H.: Isotope studies of hydrogen and oxygen in ground ice – Experiences with the equilibration technique, Isot. Environ. Healt. S., 36, 133–149, https://doi.org/10.1080/10256010008032939, 2000.
Meyers, P. A.: Organic geochemical proxies of paleoceanographic, paleolimnologic, and paleoclimatic processes, Org. Geochem., 27, 213–250, https://doi.org/10.1016/S0146-6380(97)00049-1, 1997.
Møller, E. F., Lambert Johansen, K., Agersted, M. D., Rigét, F., Clausen, D. S., Larsen, J., Lyngs, P., Middelbo, A., and Mosbech, A.: Zooplankton phenology may explain the North Water polynya's importance as a breeding area for little auks, Mar. Ecol.-Prog. Ser., 605, 207–223, https://doi.org/10.3354/meps12745, 2018.
Mosbech, A., Johansen, K. L., Davidson, T. A., Appelt, M., Grønnow, B., Cuyler, C., Lyngs, P., and Flora, J.: On the crucial importance of a small bird: The ecosystem services of the little auk (Alle alle) population in Northwest Greenland in a long-term perspective, Ambio, 47, 226–243, https://doi.org/10.1007/s13280-018-1035-x, 2018.
Opel, T., Dereviagin, A. Y., Meyer, H., Schirrmeister, L., and Wetterich, S.: Palaeoclimatic information from stable water isotopes of Holocene ice wedges on the Dmitrii Laptev Strait, Northeast Siberia, Russia, Permafrost Periglac., 22, 84–100, https://doi.org/10.1002/ppp.667, 2011.
Opel, T., Meyer, H., Wetterich, S., Laepple, T., Dereviagin, A., and Murton, J.: Ice wedges as archives of winter palaeoclimate: a review, Permafrost Periglac., 29, 199–209, https://doi.org/10.1002/ppp.1980, 2018.
Reimer, P. J., Bard, E., Bayliss, A., Beck, J. W., Blackwell, P. G., Bronk Ramsey, C., Buck, C. E., Cheng, H., Edwards, R. L., Friedrich, M., Grootes, P. M., Guilderson, T. P., Haflidason, H., Hajdas, I., Hatte, C., Heaton, T. J., Hoffmann, D. L., Hogg, A. G., Hughen, K. A., Kaiser, K. F., Kromer, B., Manning, S. W., Niu, M., Reimer, R. W., Richards, D. A., Scott, E. M., Southon, J. R., Staff, R. A., Turney, C. S. M., and van der Plicht, J.: IntCal13 and Marine13 radiocarbon age calibration curves 0–50,000 years cal BP, Radiocarbon, 55, 1869–1887, https://doi.org/10.2458/azu_js_rc.55.16947, 2013.
Roethlisberger, H.: The applicability of seismic refraction soundings in permafrost near Thule, Greenland, CREEL Technical Report, 81, 19 pp., 1961.
Skrzypek, G., Wojtuń, B., Richter, D., Jakubas, D., Wojczulanis-Jakubas, K., and Samecka-Cymerman, A.: Diversification of nitrogen sources in various tundra vegetation types in the High Arctic, PLoS ONE, 10, e0136536. https://doi.org/10.1371/journal.pone.0136536, 2015.
Stirling, I.: The biological importance of polynyas in the Canadian Arctic, Arctic, 33, 303–315, 1980.
Stuiver, M. and Reimer, P. J.: Extended 14C Data Base and Revised CALIB 3.0 14C Age Calibration Program, Radiocarbon, 35, 215–230, https://doi.org/10.1017/S0033822200013904, 1993.
Vasil'chuk, Yu. K., Budantseva, N. A., Christiansen, H. H., Chizhova, J. N., Vasil'chuk, A. C., and Zemskova, A. M.: Oxygen stable isotope variation in late Holocene ice wedges in Yamal Peninsula and Svalbard, Geography, Environment, Sustainability, 8, 36–54, 2015.
Vincke, S., van de Vijver, B., Ledeganck, P., Nijs, I., and Beyens, L.: Testacean communities in perturbed soils: the influence of the wandering albatross, Polar Biol., 30, 395–406, https://doi.org/10.1007/s00300-006-0196-4, 2007.
Vittinghus, H., Christiansen, H. H., Meyer, H., and Elberling, B.: Hydrogen and oxygen isotope studies from an ice wedge in Svalbard, Extended abstracts, Ninth International Conference on Permafrost (NICOP), 29 June–3 July 2008, University of Alaska Fairbanks, 333–334, 2008.
Wetterich, S., Davidson, T. A., and Meyer, H.: Stable isotope signatures of Holocene syngenetic permafrost in the Thule District (NW Greenland), PANGAEA, https://doi.org/10.1594/PANGAEA.907403, 2019.
Wold, A., Jæger, I., Hop, H., Gabrielsen, G. W., and Falk-Petersen, S.: Arctic seabird food chains explored by fatty acid composition and stable isotopes in Kongsfjorden, Svalbard, Polar Biol., 34, 1147–1155, https://doi.org/10.1007/s00300-011-0975-4, 2011.
Zwolicki, A., Zmudczyńska-Skarbek, K. M., Iliszko, L., and Stempniewicz, L.: Guano deposition and nutrient enrichment in the vicinity of planktivorous and piscivorous seabird colonies in Spitsbergen, Polar Biol., 36, 363–372, https://doi.org/10.1007/s00300-012-1265-5, 2013.