the Creative Commons Attribution 4.0 License.
the Creative Commons Attribution 4.0 License.
 | 25 Jan 2019
Large-scale predictions of salt-marsh carbon stock based on simple observations of plant community and soil type
Angus Garbutt
Mollie Duggan-Edwards
Jordi F. Pagès
Rachel Harvey
Cai Ladd
Martin W. Skov
Carbon stored in coastal wetland ecosystems is of global relevance to climate regulation. Broadscale inventories of this “blue” carbon store are currently lacking and labour intensive. Sampling 23 salt marshes in the United Kingdom, we developed a Saltmarsh Carbon Stock Predictor (SCSP) with the capacity to predict up to 44 % of spatial variation in surface soil organic carbon (SOC) stock (0–10 cm) from simple observations of plant community and soil type. Classification of soils into two types (sandy or not-sandy) explained 32 % of variation in SOC stock. Plant community type (five vegetation classes) explained 37 % of variation. Combined information on soil and plant community types explained 44 % of variation in SOC stock. GIS maps of surface SOC stock were produced for all salt marshes in Wales (∼4000 ha), using existing soil maps and governmental vegetation data and demonstrating the application of the SCSP for large-scale predictions of blue carbon stores and the use of plant community traits for predicting ecosystem services.
- Article
(1943 KB) -
Supplement
(4871 KB) - BibTeX
- EndNote


Implementation of environmental policy and management via “the ecosystem approach” requires a broadscale knowledge of the distribution of natural stocks and ecosystem services (McKenzie et al., 2014; Meiner et al., 2013; TEEB, 2010; UK National Ecosystem Assessment, 2014). Spatial information is often patchy and for some ecosystem stocks and services it is almost entirely lacking. The “predictive tool” approach, based on mathematical modelling, was traditionally used in population and resource distributional mapping (Cuddington et al., 2013) and has recently been applied to the predictive mapping of ecosystem services (McHenry et al., 2017). Significant advances have been made in predicting ecosystem service provision in terrestrial systems, such as agricultural landscapes, freshwater habitats, and forests (Ding and Nunes, 2014; Emmett et al., 2016; Vigerstol and Aukema, 2011). In contrast, there are few predictive tools for coastal systems, which, combined with a shortage of baseline data for many environmental variables (Robins et al., 2016), means that distributional maps of ecosystem services and stocks are lacking for global coastlines (Meiner et al., 2013).
Coastal wetlands (mangroves, tidal marshes, and seagrasses) sequester significant amounts of “blue carbon”, particularly below ground, in long-lived soil organic carbon (SOC) stores (Chmura et al., 2003; Howard et al., 2017; Luisetti et al., 2013). Global strategies for integrating blue carbon storage into greenhouse-gas accounting have been proposed (IPCC, 2014). However, a global inventory of blue carbon remains a challenge, as empirical observations of SOC stocks in coastal wetlands are expensive, scarce, and unevenly distributed, with few records even for relatively well-studied areas such as Europe (Beaumont et al., 2014). Ecosystem service maps for the UK National Ecosystem Assessment (NEA) for Wales, the focal region of the present study, characterised salt marshes as coastal margin habitat, assigned the lowest category of carbon storage relative to all other terrestrial habitats (Scholefield, 2013). SOC stocks in Welsh salt marshes may be underestimated due to incomplete habitat mapping of intertidal areas. Rolling out empirical observations of below-ground SOC stock across large scales of blue carbon systems is not a practicable and affordable short-term solution to the lag between management ambition and carbon inventorying. Predictive mapping of carbon stocks holds great promise; it has been extensively trialled for terrestrial systems (Emmett et al., 2016; Gray et al., 2013; Rossel et al., 2014), but rarely applied to blue carbon ecosystems (Gress et al., 2017; Meiner et al., 2013).
Predictive models of ecosystem services typically use a combination of predictor variables (Posner et al., 2016). For carbon storage, predictors such as climate, soil type, sedimentary classification, and habitat or land management type are commonly used (Chaplin-Kramer et al., 2015; Jardine and Siikamäki, 2014; Kelleway et al., 2016). Many ecosystem service models that include carbon storage predictions are computationally sophisticated and operationally time consuming and require specialists for their operation and interpretation (Posner et al., 2016), all of which reduces the scope for their use by landscape managers. Simple predictive tools that incorporate readily available spatial information with ground-truthed field measurements might be a more attractive option for use in the field. For example, a recent study by Emmett et al. (2016) proposed soil pH as a potential metric for ecosystem service provision, at the catchment scale, accounting for 45 % of variation in ecosystem service supply.
Recent work has explicitly linked SOC stock to both soil properties and plant community parameters for terrestrial and coastal grasslands (Bai et al., 2016; Manning et al., 2015). In addition, these SOC stores are further mediated by climatic factors (e.g. precipitation) and land-use management (e.g. livestock grazing intensity) (Ford et al., 2012; Tanentzap and Coomes, 2012; Yang et al., 2010). Classification of soils by texture can be useful for quantifying soil organic matter (SOM) content and therefore indicating SOC stock (O'Brien et al., 2015). In particular, a strong positive correlation between clay content and SOC stock is apparent due to the adsorption of organics to clay particles (Arrouays et al., 2006; Hassink, 1997; Oades, 1988). The composition of the plant community, presence of dominant species, and plant diversity largely determine root properties (e.g. biomass, turnover, and exudates), which further influence SOM content and SOC stock (De Deyn et al., 2008; Ford et al., 2016). Species-rich plant communities are also often functionally diverse, with differing root strategies leading to enhanced root biomass (Loreau et al., 2001) and consequent impacts on SOC stock (Jones and Donnelly, 2004). Moreover, particular life history strategies or plant traits can also be associated with enhanced carbon capture and storage, for example fast growth rates or the production of recalcitrant litter that is slow to break down (Yapp et al., 2010). The ability to easily and quickly predict salt-marsh SOC stock from plant community assemblages and/or soil type would provide the potential to update the current inventory (IPCC, 2014) of blue carbon on a regional, biogeographical, or national scale. This would be of interest to a wide group of stakeholders including academics, the IPCC, the Blue Carbon Initiative (http://thebluecarboninitiative.org/, last access: 8 January 2019), and governmental and non-governmental land managers. Here we present a range of predictive models for surface SOC stock (0–10 cm) based on plant (vegetation type, class, species richness, root biomass) and soil (simplified type or texture category) parameters measured across 23 salt marshes in Wales, UK. In addition, we used a subset of these models to create a novel tool for practitioners – the Saltmarsh Carbon Stock Predictor (SCSP) – for predicting and mapping the SOC stock of Welsh salt marshes (https://www.saltmarshapp.com/saltmarsh-tool/, last access: 8 January 2019), alongside a simplified version designed for use by the general public – the Saltmarsh App (https://www.saltmarshapp.com/, last access: 8 January 2019).
2.1 Site selection
A total of 23 salt-marsh sites were sampled for vegetation and soil properties in July 2015: 10 in north or mid-Wales and 13 in south Wales, UK (Fig. 1), representing a range of marsh typologies. The Severn Estuary in the south-east was excluded due to nesting bird restrictions. The British National Vegetation Classification (NVC) scheme was used to characterise vegetation communities (Rodwell, 2000). Four of the most common vegetation types (five NVC classes) were assessed in this study (Table 1); they were chosen as they are widespread and common the UK and present at all study sites according to governmental (Natural Resources Wales, NRW) NVC maps (e.g. Fig. S1, Supplement). At each study site, four 1×1 m quadrat areas were sampled per vegetation type (each quadrat ca. 10 m apart along a transect line). In some specific locations, where extent was limited, only two quadrats per vegetation type were assessed. Note that the four vegetation types equate to five NVC classes as the Juncus maritimus community is divided into two distinct classes (Table 1). The four vegetation types focused on in this study were located using governmental maps based on vegetation surveys from 1996 to 2003 (detailed in Sect. 2.6). Vegetation type was therefore validated on the ground as species extent could have altered between the survey date and the present day.
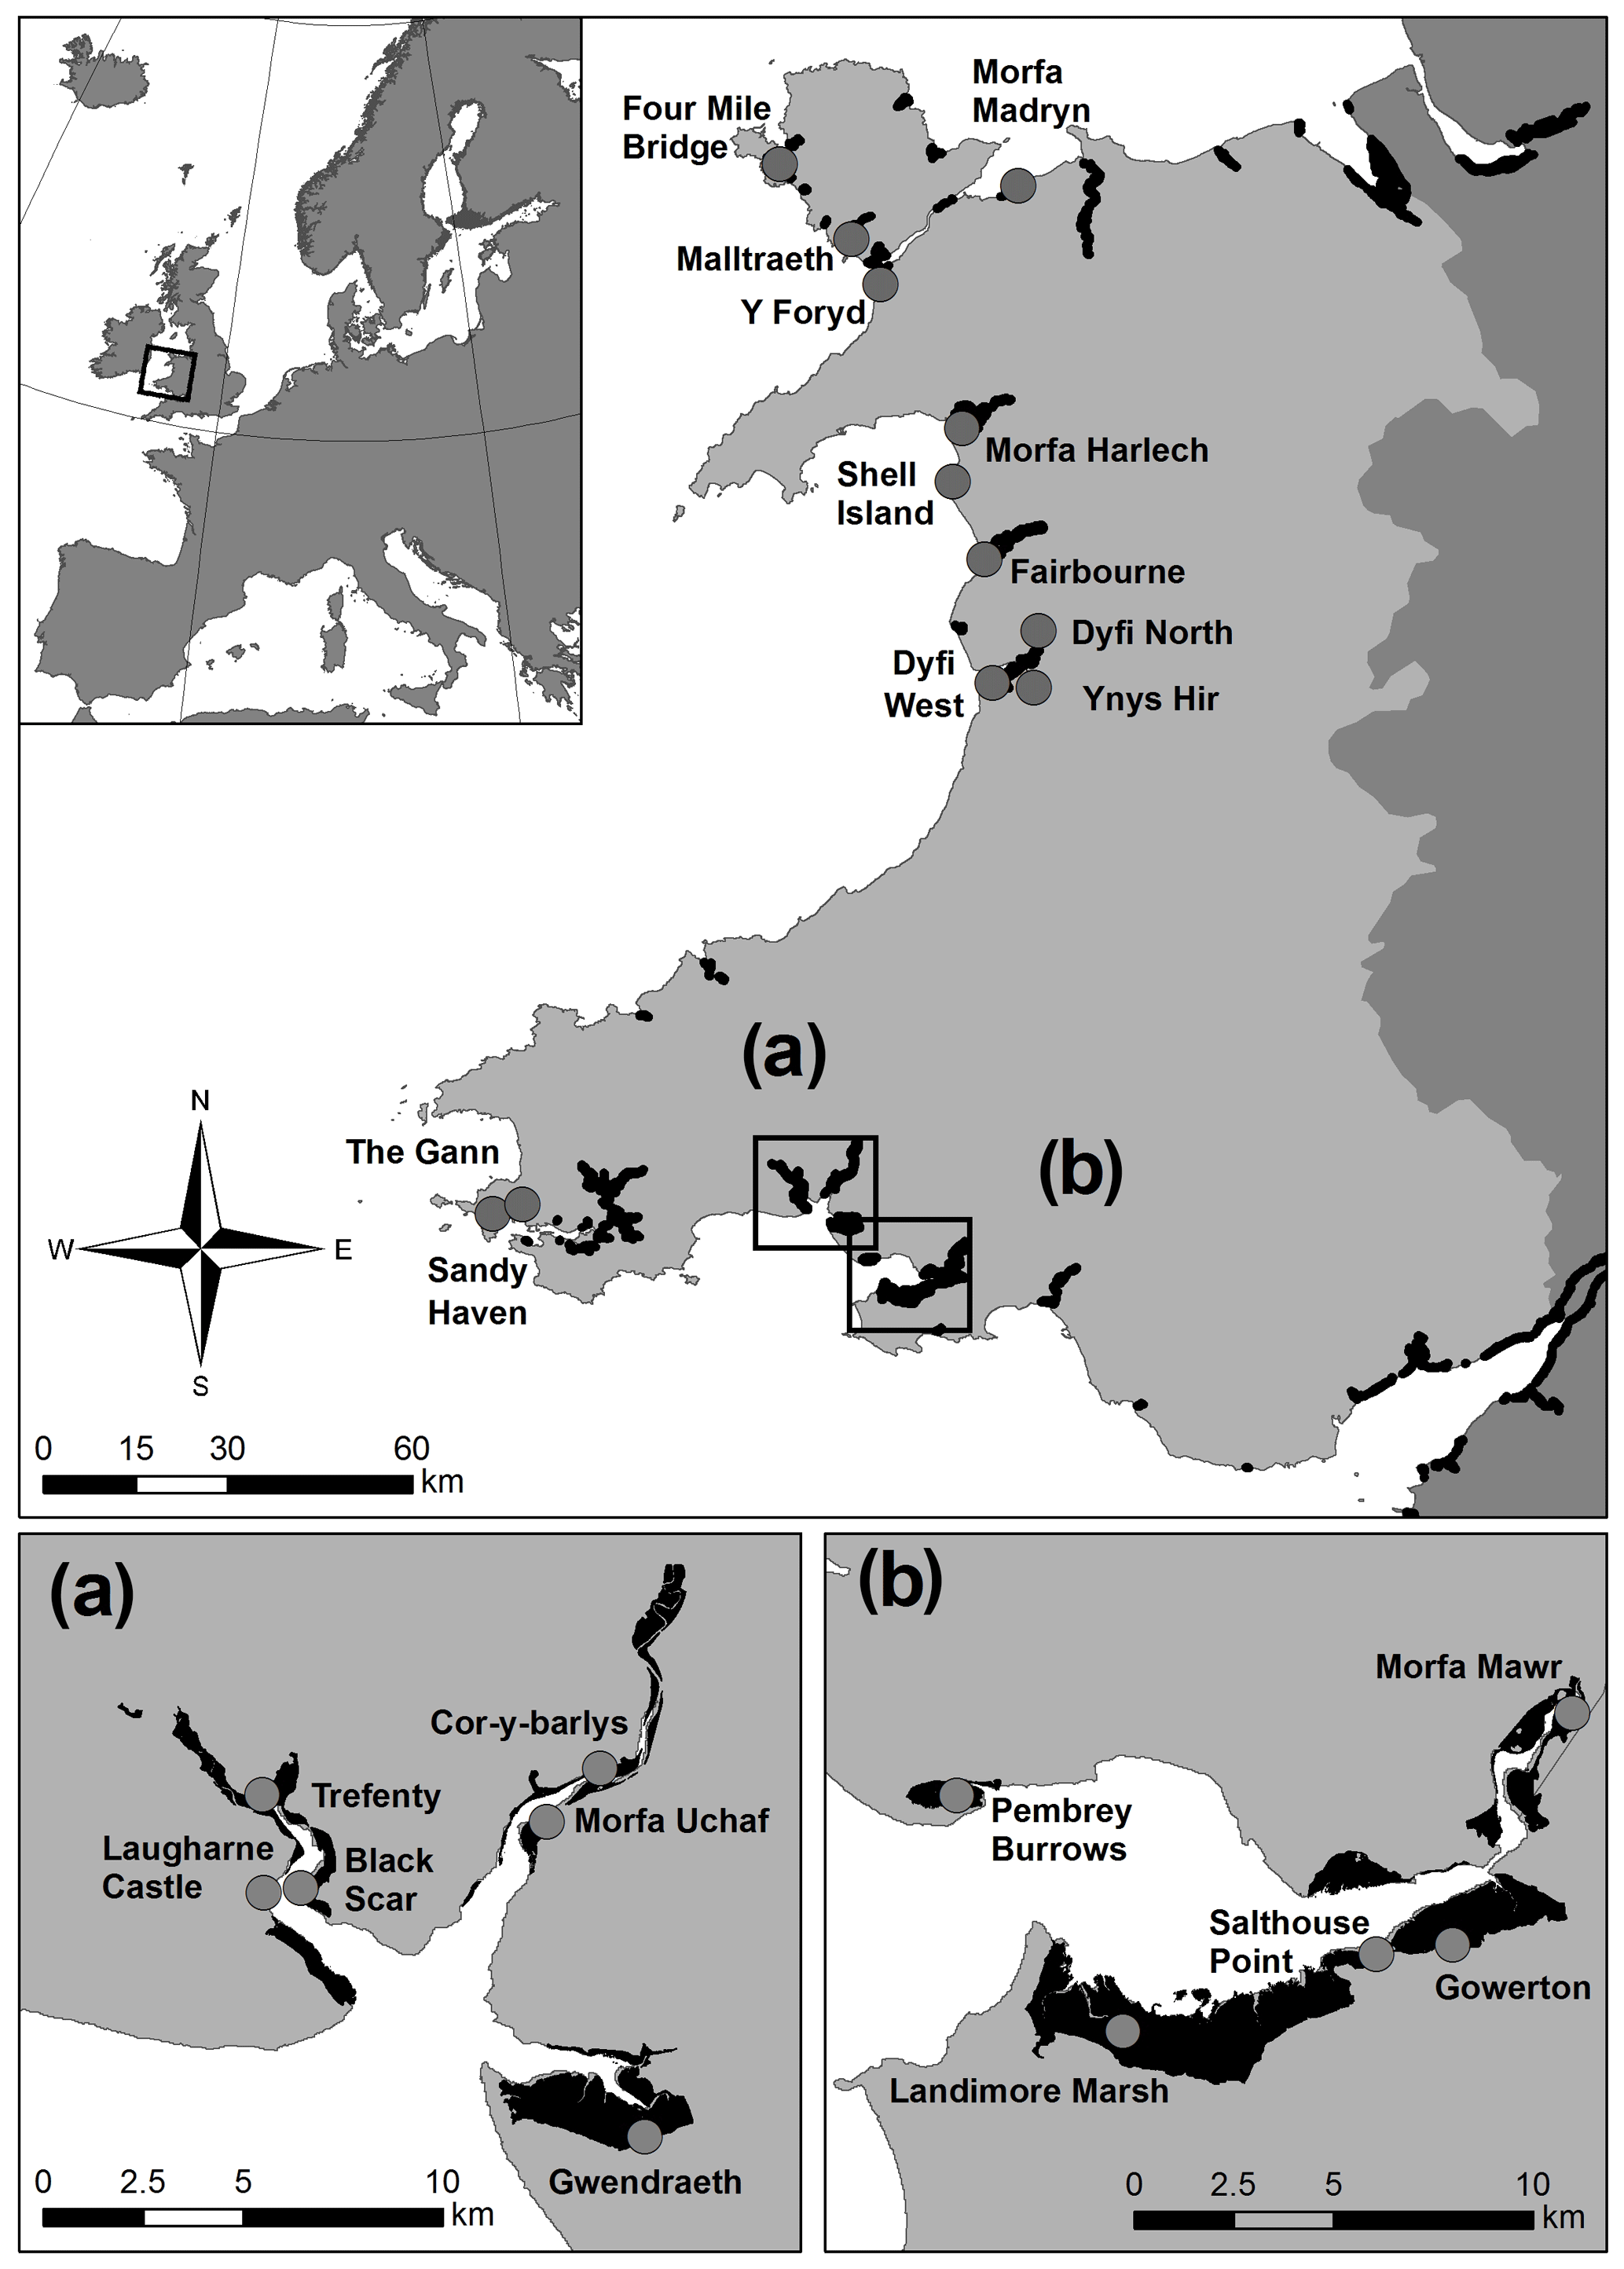
Table 1Salt-marsh vegetation types, associated National Vegetation Classification (NVC) class, and marsh intertidal position (zone) (http://jncc.defra.gov.uk/pdf/Salt-marsh_Comms.pdf, last access: 8 January 2019).

2.2 Plant community and root biomass
Above-ground vegetation characteristics were measured within each 1× 1 m quadrat. Percentage cover of each plant species was estimated by eye. Plant species richness was recorded as the number of species present per quadrat. Shannon–Wiener index (S–W index, H′) was calculated as a measure of plant diversity based on species cover. NVC classes associated with each vegetation type (Table 1) were verified for each quadrat using the TABLEFIT v1.1 software (Hill, 2011). Root dry biomass was determined for 0–10 cm in depth using a 2.6 cm diameter corer: roots were removed from sediment, washed, and then dried at 60 ∘C for 72 h. All plant nomenclature followed Stace (2010).
2.3 Soil characteristics, SOC stock, and field texture test
Soil characteristics were measured from within each 1×1 m quadrat. Soil samples, of ∼10 g (fresh mass) from the top 10 cm, were taken from within each quadrat, diluted to a ratio of 1:2.5 by volume with deionised water, and measured for electrical conductivity (EC) and pH (Jenway 4320 conductivity meter, Hanna pH 209 pH meter). EC was used as a proxy for salinity. Soil bulk density samples were taken using a stainless-steel ring (3.1 cm height, 7.5 cm diameter) inserted horizontally into the soil (from a depth of 2 to 9.5 cm deep) to quantify the top 10 cm of soil (Fig. S2). Samples were dried at 105 ∘C for 72 h to assess soil moisture content and soil bulk density. The dried samples were ground and subsampled for loss-on-ignition analysis (375 ∘C, 16 h) to estimate SOM content (Ball, 1964). SOC stock was calculated from bulk density and SOM with SOC content estimated as 55 % of SOM, as determined with an elemental analyser (Emmett et al., 2010).
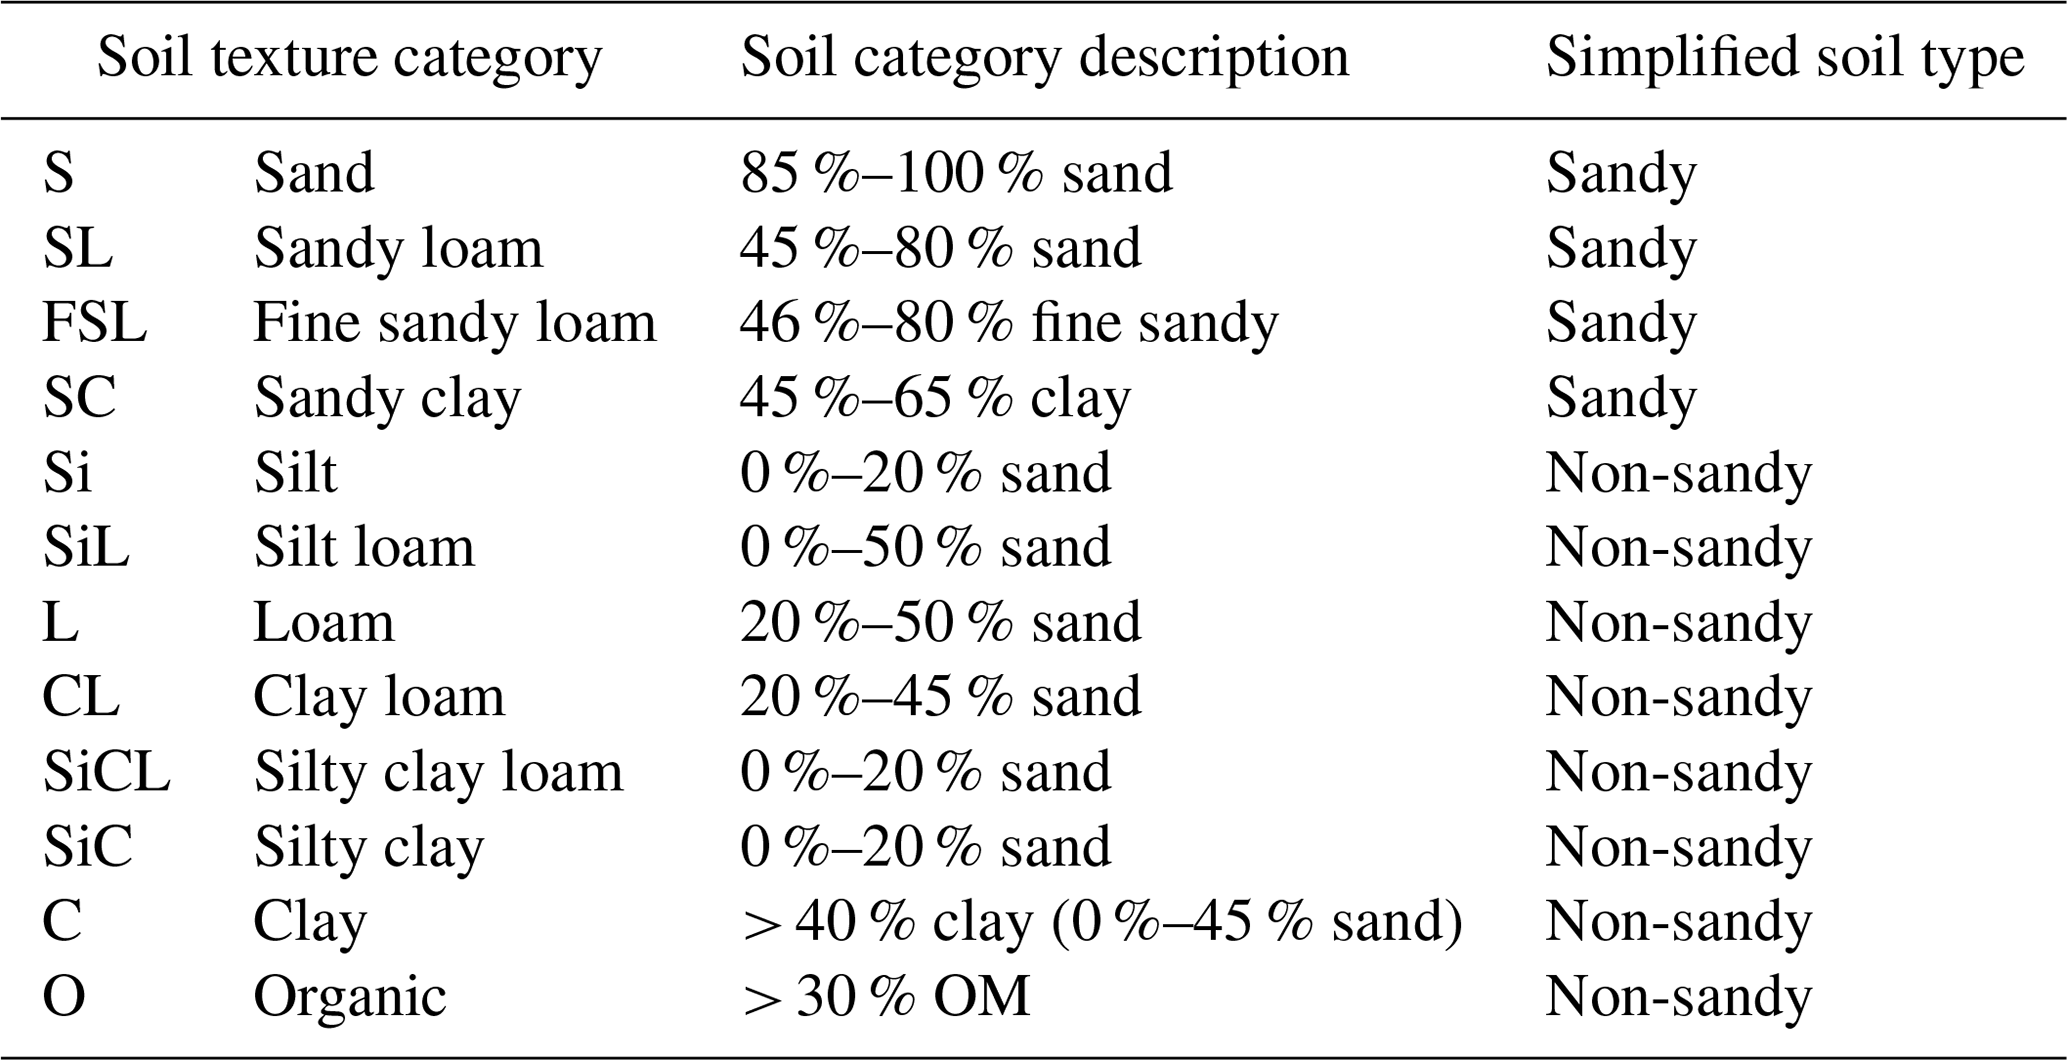
Root-free soil samples (one per quadrat at 5 cm in depth) were classified into 12 soil texture categories using the British Columbia protocol for estimating soil texture in the field (https://www.for.gov.bc.ca/isb/forms/lib/fs238.pdf, last access: 8 January 2019) based on graininess, moistness, stickiness, and ability to hold a form without breaking apart when rolled. Soil was also assigned a simplified soil type of sandy or non-sandy (Table 2). These approaches were chosen over conventional soil grain-size assessment as they facilitate inexpensive broadscale observations in which soils can be classified by non-experts in a few minutes in the field.
Table 2Soil texture categories (British Columbia protocol for estimating soil texture in the field (https://www.for.gov.bc.ca/isb/forms/lib/fs238.pdf)) and simplified soil type.
2.4 Analysis: explanatory variables and prediction of SOC stock
The relationship between the response variable “surface SOC stock” and the explanatory variables was determined using uni- or bivariate linear mixed-effect models. This was performed in order to keep the models as simple as possible, to be able to scale the results up to the landscape-scale using available GIS layers (see Sect. 2.6) and with the final aim of being of direct use for practitioners. The explanatory variables we entered in the models were the fixed categorical variables “vegetation type” (four levels: P. maritima community, A. portulacoides community, J. gerardii community, J. maritimus community), “NVC class” (five levels: SM13, SM14, SM16, SM15, SM18), “simplified soil type” (two levels: sandy, non-sandy), “soil texture” (12 levels: sand, sandy loam, fine sandy loam, sandy clay, silt, silt loam, loam, clay loam, silty clay loam, silty clay, clay, organic), and the continuous variables “root biomass” and “plant species richness”. Livestock-grazing intensity (two levels: grazed versus un-grazed), EC, and pH were not used as explanatory variables in the uni- or bivariate models presented here as they were not found to be significant explanatory variables of surface SOC stock, nor are they easily assessed by practitioners. The categorical variable vegetation type was nested within salt-marsh site to take into account data structure and avoid pseudo replication. Inspection of residuals and Bartlett's test detected a clear violation of the assumption of homoscedasticity. We addressed this issue by adding a constant variance function to the linear mixed-effect models to take into account the differences in variance across groups (e.g. vegetation type, NVC class, simplified soil type). Final models were selected on the basis of the lowest Akaike's information criterion (AIC) (Zuur et al., 2009). Likelihood-ratio-based pseudo R2 values were calculated for final models (Grömping, 2006). The final uni- and bivariate models we tested were the following: (i) NVC_model (NVC class only), (ii) Soil_model (simplified soil type only), (iii) Veg_soil_model (vegetation type and simplified soil type combined), and (iv) NVC_soil_ model (NVC class and simplified soil type combined). Surface SOC stock predictions were calculated from the coefficients of the final linear mixed-effect models. For example, the NVC_soil_model values for each explanatory variable for coefficient 1 (i.e. simplified soil type: sandy, non-sandy) and coefficient 2 (i.e. NVC class: SM13, SM14, SM15, SM16, SM18) were summed and added to the model intercept, giving a model prediction of surface SOC stock for each model in tonnes of carbon per hectare (t C ha−1) for the top 10 cm of soil. All analysis was carried out in R (R Core Team, 2016).
2.5 Model selection justification for the SCSP tool and the Saltmarsh App
The SCSP tool (Skov et al., 2016; https://www.saltmarshapp.com/saltmarsh-tool/) was designed to be used primarily by expert practitioners whereas the Saltmarsh App (https://www.saltmarshapp.com/, last access: 8 January 2019) was aimed at the general public. Therefore the models they utilise to predict salt-marsh SOC stock (0–10 cm) differ based on access to data sources. The SCSP tool offers two types of information: (i) a lookup table for predicted surface SOC stock (t C ha−1) provided NVC class (NVC_model), simplified soil type (Soil_model), or both (NVC_ soil_model) are known and (ii) a GIS map layer and series of maps (see Sect. 2.6). The NVC_soil_model was used for the SCSP tool as existing governmental maps are already categorised by NVC class. The carbon calculator component of the Saltmarsh App was based on the Veg_soil_model. This model was selected as vegetation type was assessed as easier to determine than NVC class by non-experts (e.g. citizen scientists) in the field. For both the SCSP tool and the Saltmarsh App simplified soil type was used instead of soil texture category as simplified soil type was both easier to assess in the field by non-experts and more straightforward to map using existing soil maps. For both the SCSP tool and the Saltmarsh App, surface SOC stock predictions are provided, either directly or via lookup tables, without the need for the user to carry out their own analysis.
2.6 Scaling-up: SOC stock mapping
As part of the SCSP tool, a GIS shapefile (referred to as the SCSP shapefile) was developed to illustrate how information on NVC class and simplified soil types (sandy vs. non-sandy) can be integrated into broadscale mapping of surface SOC stocks in salt marshes across Wales, UK. The SCSP shapefile illustrated surface SOC stocks for marshes across Wales utilising the predictive power of the linear mixed effects models obtained in the statistical analyses (Sect. 2.4) for (a) “NVC class” only (NVC_model); (b) “Simplified soil type” only (Soil_model); (c) “NVC and simplified soil type” combined, (NVC_soil_model); (d) “NVC and simplified soil type” combined (NVC_soil_model) plus predictions based on “simplified soil type” (Soil_model) where SOC predictions for NVC pioneer communities were not known. Estimates of the total amount of salt-marsh carbon stock (t C), present within the top 10 cm of soil, for the area of the salt marsh (%) for which we had the necessary information to make predictions were calculated for each map. For example, Laugharne marsh (Fig. 2) included NVC classes for which the study did not have predictive SOC to NVC relationships; hence, shapefiles (a) and (c) (detail above) included areas without surface SOC stock predictions so the percentage of the marsh area for which SOC predictions were made was < 100 %.
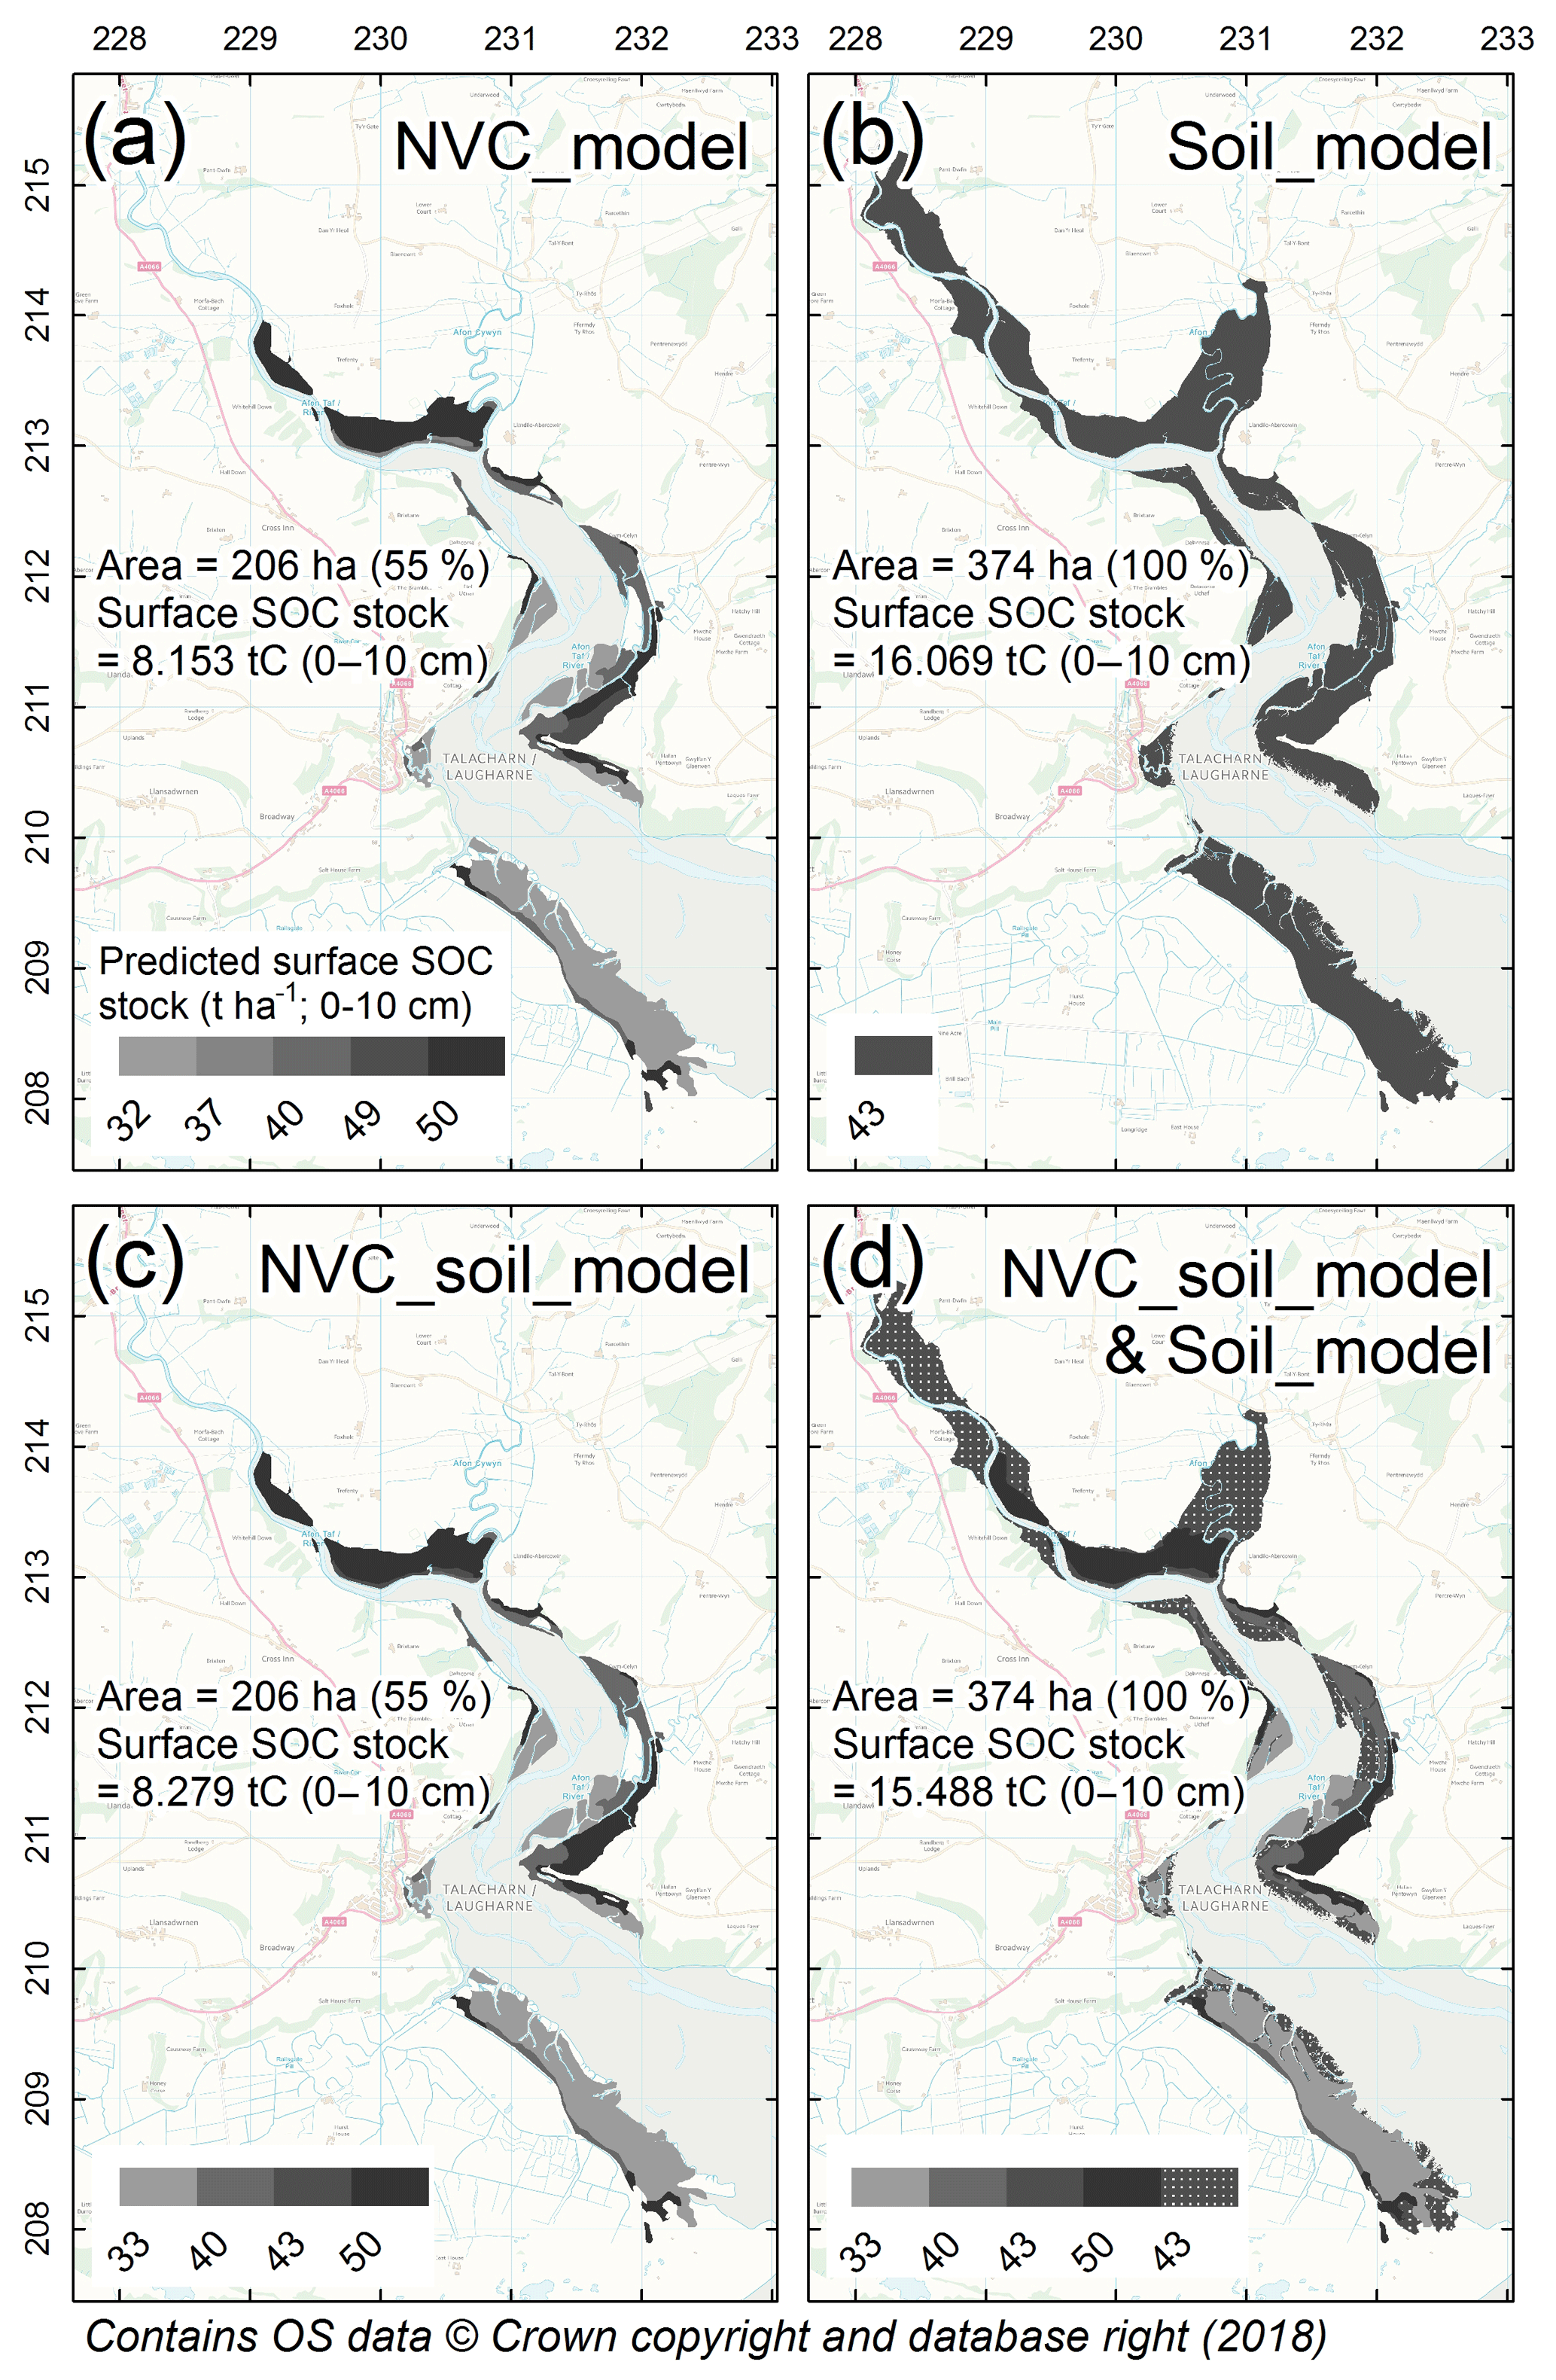
Figure 2Predictions of surface SOC stock (t C ha−1; 0–10 cm) for salt marshes at Laugharne in south Wales. SOC stock was predicted by (a) NVC class only (NVC_model), (b) simplified soil type only (Soil_model), (c) NVC and simplified soil type combined (NVC_soil_model), and (d) NVC_soil_model (used where NVC communities were mapped), combined with Soil_model (remaining salt-marsh area where NVC community information was not available). Inserted into maps are estimates of the total amount of surface SOC (t C) (0–10 cm) for the area of the salt marsh (%) for which we had the necessary information to make predictions, with panel (d) illustrating best practice. Laugharne marsh included NVC communities for which the study did not have predictive surface SOC stock-to-NVC relationships; hence, panels (a) and (c) include areas without SOC predictions (white colour) and the percentage of the marsh area for which SOC predictions were made is < 100 %.
The SCSP shapefile was built by combining three GIS layers: (i) the first layer provided the distribution of salt-marsh areas in England and Wales, and is distributed by the Environmental Agency (EA) (available at https://data.gov.uk/dataset/saltmarsh-extents1, last access: 8 January 2019); (ii) the second layer gave the distribution of NVC classes in Welsh salt marshes, and was provided by Natural Resources Wales (“Intertidal Phase-2” shapefile); and (iii) the third layer provided simplified soil type information, and was obtained from “Soilscapes”, a 1:250 000 scale, soil map covering England and Wales, and developed by LandIS (http://www.landis.org.uk/, last access: 8 January 2019). The EA shapefile (i) represented salt-marsh areal extent as measured between 2006 and 2009 across England and Wales (Phelan et al., 2011). The phase-2 survey data of NVC communities (ii) were derived from 1996–2003 surveys of salt-marsh plant carried out for all of Wales (Brazier et al., 2007). Soils of the Soilscapes map (iii) were simplified into the two types used in surface SOC stock predicting algorithms: sandy or non-sandy soil. Comparison between mapped soil types and simplified soil types measured in the field are shown in Table S1 (Supplement). The SCSP shapefile and instructions on how to use it are available at https://www.saltmarshapp.com/saltmarsh-tool/.
3.1 Site characterisation
Plant and soil characteristics for each vegetation type of the 23 salt-marsh sites are shown in Table S2. Surface SOC stock (to 10 cm depth) was often greater in both J. gerardii (SM16) and J. maritimus (SM15; SM18) plant communities (40–60 t C ha−1) than in the Atriplex (SM14) and Puccinellia (SM13) communities (20–50 t C ha−1). Soil pH of 6–7.5 was common throughout, but EC (a proxy for soil salinity) was more variable, depending on specific position and elevation relative to the tidal frame. Plant species richness was consistent across P. maritima, J. gerardii, and J. maritimus communities (4–10 species m−2) with only A. portulacoides occurring commonly as a monoculture. Plant height was variable, between 3 and 30 cm for P. maritima and J. gerardii, with shorter swards when grazers were present. A. portulacoides shrubs were consistently 20–30 cm high, with J. maritimus tussocks 40–70 cm tall. Root biomass of between 1 and 5 kg DW m−2 was common, with J. gerardii and J. maritimus communities typically having greater root biomass than the other two community types.
3.2 Surface SOC stock: explanatory variables and model predictions
The relationship between the response variable surface SOC stock and the plant and soil explanatory variables was quantified by six uni- and four bivariate models (Table 3). Assessment of vegetation type (Veg_model) or NVC class (NVC_model) alone accounted for 36 %–37 % of the variation in surface SOC stock. Root biomass alone (Root_model) explained 32 % of variation. Simplified soil type alone (Soil_model), for which soil was divided into sandy or non-sandy groups, explained 32 % of variation, rising to 45 % when texture categories (Text_model) were considered. Plant species richness alone (Species_model) explained 41 % of variation in surface SOC stock (Fig. S3). Bivariate models including plant community variables (vegetation type or NVC class) and simplified soil type (Veg_soil_model and NVC_soil_model) explained 40 %–44 % of surface SOC stock, rising to 51 %–52 % when plant variables were coupled with soil texture category (Veg_text_model and NVC_text_model).
Table 3Six explanatory variables of surface SOC stock (t C ha−1; top 10 cm of soil) in Welsh salt marshes, based on ANOVA output from mixed-effect models, with F statistic values presented.
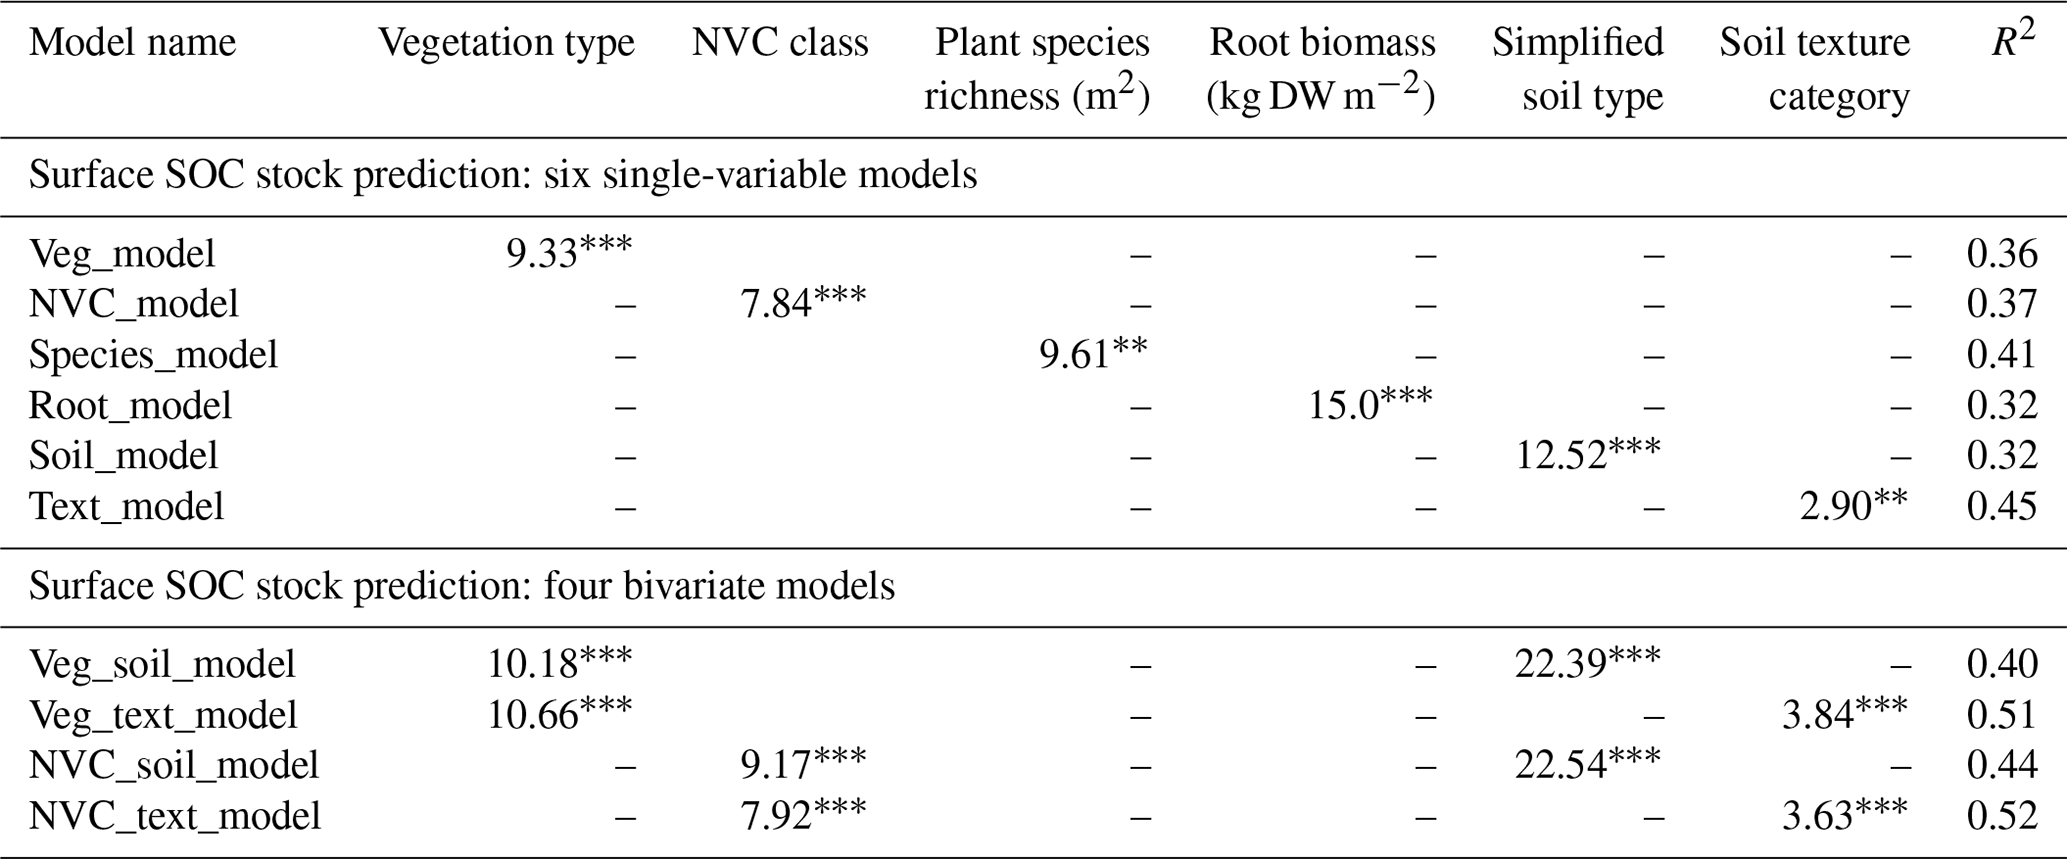
Significance (. ). Vegetation type (four levels: P. maritima; A. portulacoides; J. maritimus; J. gerardii). NVC class (five levels: SM13; SM14; SM15; SM16; SM18). Simplified soil type (two levels: sandy soil with ≥45 % sand; non-sandy soils with < 45 % sand including loam, clay, organic soils). Soil texture category (12 levels; see Table 2).
3.3 Prediction of surface SOC stock: the SCSP tool and Saltmarsh App
The SCSP tool lookup table (Table 4) provides a straightforward way to determine surface SOC stock (top 10 cm of soil) in a UK salt marsh based on information on simplified soil type, plant community (NVC class or vegetation type), or both. For convenience the SCSP lookup table also contains the model used in the carbon calculator component of the Saltmarsh App (Veg_soil_model). Predictions of surface SOC stock based on plant NVC communities (five classes) produced SOC stock predictions (top 10 cm of soil) varying from 32 t C ha−1 for the A. portulacoides NVC class to 50 t C ha−1 for the J. gerardii NVC class (Table 4). Predictions based on simplified soil types (two types) predicted that sandy soils store less SOC (29 t C ha−1) than non-sandy soils (43 t C ha−1). A series of GIS-based maps, illustrating surface SOC stock (t C ha−1; top 10 cm of soil) and total surface SOC stored per marsh (t C) for all Welsh salt marshes (based on three models: NVC_model; Soil_model; NVC_soil_model) can be viewed in the Supplement, Figs. S7–S29 inclusive (exemplar Fig. 2) or online at https://www.saltmarshapp.com/saltmarsh-tool/.
Table 4SCSP tool lookup table based on models of surface SOC stock (t C ha−1; top 10 cm of soil) prediction in Welsh salt marshes (using output of a subset of models from Table 3).

Variables not in model denoted by “–”. Variables related to vegetation type or NVC class but not included in analysis in parentheses “()”. Vegetation type (four levels: P. maritima; A. portulacoides; J. maritimus; J. gerardii). NVC class (five levels: SM13; SM14; SM15; SM16; SM18). Simplified soil type (two levels: sandy soil with ≥45 % sand; non-sandy soils with < 45 % sand including loam, clay, organic soils).
The accurate prediction of blue carbon stock is of interest to a wide range of stakeholders including the IPCC (2014). This study has demonstrated that a large proportion of the variation in surface layers of SOC stock in salt-marsh habitats can be predicted from just two easy-to-measure variables, plant community (vegetation type or NVC class) and simplified soil type, which together accounted for close to half of the variation in SOC stock in 23 Welsh salt marshes. Associations of SOC with plant and soil characteristics have been demonstrated in other ecosystems (Amundson, 2001; Bai et al., 2016; Manning et al., 2015), although this study is the first to use such relationships to produce a national inventory of blue carbon storage in surface soil layers.
4.1 Ecological observations
Whilst surface SOC stock in UK salt marshes was broadly predicted by soil type, with non-sandy soils being more carbon rich, there remained a clear association between SOC stock and plant community type, with rush-dominated J. maritimus and J. gerardii communities associated with greater surface SOC stocks than either A. portulacoides or P. maritima communities. The deep-rooted salt-marsh shrub A. portulacoides (Decuyper et al., 2014) occurred predominantly as a near monoculture (Ford et al., 2016), with the shallow-rooted salt-marsh grass P. maritima community found alongside simple-rooted plants such as Plantago maritima. In contrast, the rushes J. gerardii and J. maritimus, characterised by extensive laterally creeping rhizomes with thick anchors and many shallow fine roots, commonly grew alongside the grasses Festuca rubra and Agrostis stolonifera and various other forbs. The diverse Juncus communities are known to have a wide variety of rooting strategies (Minden et al., 2012) that lead to greater root biomass and consequently greater SOC stock (Jones and Donnelly, 2004; Loreau et al., 2001). Higher SOC stock in Juncus areas might also arise as these species grow in waterlogged conditions that limit aerobic breakdown of organic material (Ford et al., 2012), while A. portulacoides is known to colonise relatively well-aerated and drained areas (Armstrong et al., 1985). We did not find an effect of grazing occurrence on SOC stocks in this study, despite a significant interaction between plant community type (a clear indicator of surface SOC stock) and livestock grazing. Our results are, therefore, in line with the subset of European salt-marsh studies (n=75) from a recent meta-analysis that only found an effect of grazing on SOC stock in North American salt marshes (Davidson et al., 2017).
4.2 Tools for broadscale predictions of salt-marsh SOC stock
The study findings were used to develop two practical tools for predicting the surface SOC stocks of salt marshes: the SCSP tool for expert stakeholders (i.e. IPCC, blue carbon initiatives, academics, policy makers, and land managers) and the Saltmarsh App for the general public (find both at https://www.saltmarshapp.com, last access: 8 January 2019). All of the univariate and bivariate models tested in this study explained ≥32 % of the variation in salt-marsh surface SOC stocks; however not all were of practical use for the tool or app, which required variables that were either easy to measure or readily available as GIS layers. For example, the characterisation of soils into 12 soil texture categories produced consistently better univariate and bivariate predictions of SOC (∼50 % of variation explained) than simple classification into sandy or non-sandy soils (∼33 %), as texture classification allowed a more accurate assessment of the clay-to-sand ratio, a key indicator of SOC (Arrouays et al., 2006; O'Brien et al., 2015). However, the two-class simplified soil type classification was selected for use in the tools, as existing UK soil maps categorised salt-marsh soils in these terms and because non-specialists can distinguish sandy from non-sandy soils in the field. For plant community type, predictions by vegetation type or NVC class performed equally well, both explaining over a third of variation in surface SOC stock in univariate models, rising to nearly half when combined with either simplified soil type or texture classification. NVC class was selected as a key variable for SCSP as it is often mapped at the UK level by national agencies, whereas the easier to identify vegetation type was chosen for the Saltmarsh App. In summary, the SCSP tool generates predictions and maps of saltmarsh SOC stock from existing mapped information on soil type, NVC classification, or both. The Saltmarsh App predicts SOC stock from field-based information on vegetation type and simplified soil type combined.
4.3 Advantages and limitations of predicting blue carbon from vegetation and soil types
Coastal vegetated habitats are now increasingly acknowledged as important carbon sinks (Howard et al., 2017), based on their high primary production, sediment trapping capacity, and the biogeochemical conditions of their sediments, which slow the decay of organic material (Kelleway et al., 2016, McLeod et al., 2011). The contribution of coastal habitats, such as salt marshes, to climate change mitigation had previously been underestimated (Scholefield et al., 2013), mainly due to their relatively small area cover relative to the open ocean or terrestrial vegetated ecosystems. However, on a per area basis, coastal wetlands are more efficient carbon sinks than most terrestrial forests (McLeod et al., 2011; Pan et al., 2011) due to their ability to accrete vertically in response to sea level rise. Indeed, this study shows Welsh marshes hold up to 50 t C ha−1 in the top 10 cm of soil, equivalent to carbon densities in habitats such as freshwater wetlands, semi-natural grasslands, and woodlands (Ostle et al., 2009). The SOC predictive models and associated tool presented in this paper are widely applicable to other UK salt marshes (Fig. S4), but also throughout north-western European salt marshes (from Portugal to the Baltic), due to the similarity of common and widespread vegetation types (Adam, 1990). However, for use in other biogeographical regions, particularly North America, where salt marshes are dominated by large Spartina species that produce organogenic soils (Adam, 1990), the methods would need further ground-truthing.
IPCC (2014) guidelines suggest that the accurate assessment of blue carbon stocks involves measurement to a depth of 1 m. However, as this study focused on the principal of predicting salt-marsh SOC stock from easy-to-measure metrics, only the surface layer (top 10 cm) of soil was considered. Although this approach does not allow direct prediction of total SOC stock throughout the soil profile, it is in line with reviews from terrestrial habitats that tend to focus on shallow soil layers (top 10–15 cm of soil; Ostle et al., 2009). For minerogenic salt marshes, SOC stock in the top layer of soil is generally indicative of SOC stock in deeper soil layers (Bai et al., 2016; Drake et al., 2015), with nearly three-quarters of total SOC and over half of the total root biomass in UK salt marshes captured by sampling to a depth of 10 cm (based on measurement to 45 cm, Figs. S5–S6). We therefore argue that surface SOC stock can provide a reliable predictor of deeper carbon stores and is therefore a useful indicator of total SOC stock for UK salt marshes.
The SCSP tool provides surface SOC stock predictions for salt-marsh plant communities indicative of the low marsh, mid-marsh, and high marsh zones, representing around two-thirds of the total Welsh salt-marsh area, calculated directly from map summary data (Figs. S7–S29). However, future work could boost the scope of the SCSP by validating SOC stock predictions for pioneer communities common across Europe (Spartina and Salicornia), which may differ markedly in biotic indicators of SOC stock such as root biomass (Keiffer and Ungar, 2002; Schwarz et al., 2015). At present, pioneer communities are defined by simplified soil type alone (see Fig. 2d). Common to many ecosystem service mapping tools, the SCSP tool assumes linearity of the relationship between area and ecosystem service; this however is uncertain (Barbier et al., 2008; Koch et al., 2009) and should be the next frontier of ecosystem service research.
While the SCSP tool has advantages in terms of translating ecology into practitioner-ready information, something that is increasingly being demanded of ecologists (see Chapin, 2017, and the special issue on “translational ecology” in Frontiers in Ecology and Environment, December 2017), such an approach also has some limitations. Namely, in the process of translating ground-level observations of ecosystem benefits (e.g. SOC stocks) into large-scale maps, there is some information that gets “lost in translation” (sensu Jackson et al., 2017). In the case of this study, we were inherently limited by the need to use a reduced number of the simplest variables available to any practitioner (e.g. vegetation community type), and at the same time, variables that feature in national cartographic programmes (e.g. coarse soil category maps). Even so, the simple models selected for the SCSP tool explained ∼50 % of the variation in surface SOC stock in the studied salt marshes. However, there is still another 50 % that we do not account for in this work. We know some of this variation is explained by the need to use simplified soil categories (instead of soil texture) and the inability to use root biomass and plant species richness as variables in the final tool (as these variables need more expertise to estimate and do not feature in an available GIS layer). The rest of the variation in surface SOC stock might be attributed to differences in marsh elevation within the tidal frame or in the geomorphological context of the marsh (e.g. fringing or estuarine, and if estuarine, near the mouth of the estuary or towards the head of the estuary) (Arriola and Cable, 2017), level of urbanisation of the catchment (Deegan et al., 2012), past history of the marsh (Kelleway et al., 2016), whether the marsh sits in a dynamic or stable area, a level of disturbance or exposure it is being subjected to (Macreadie et al. 2013), among other factors. Despite the caveats listed above, this study has demonstrated the ability to predict up to half the variation in salt-marsh surface SOC stock from very simple environmental metrics.
The data are available by request from the corresponding author.
The supplement related to this article is available online at: https://doi.org/10.5194/bg-16-425-2019-supplement.
MS, AG, and HF designed the experiment. HF, MDE, JP, and RH carried out the experiment. HF and CL analysed data and created GIS maps. HF prepared the paper with contributions from all co-authors.
The authors declare that they have no conflict of interest.
This study presents data collected as part of the Coastal Biodiversity and
Ecosystem Service Sustainability project (CBESS: NE/J015644/1), part of the
BESS programme, a 6-year programme (2011–2017) funded by the Natural
Environment Research Council (Bangor University grant reference:
NE/J015350/1) and the Biotechnology and Biological Sciences Research Council
(BBSRC) as part of the UK's Living with Environmental Change (LWEC)
programme. The views expressed are those of the authors and do not reflect
the views of BESS Directorate or NERC. The authors also acknowledge
financial support from the Welsh Government and Higher Education Funding
Council for Wales through the Sêr Cymru National Research Network for
Low Carbon, Energy and Environment. Thanks also to the National Trust,
Natural Resources Wales, the Ministry of Defence, county councils, private
estates, and farmers for access to their land.
Edited by: Steven Bouillon
Reviewed by: two anonymous referees
Adam, P.: Saltmarsh Ecology, Cambridge University Press, Cambridge, UK, 1990.
Amundson, R.: The carbon budget in soils, Annu. Rev. Earth Planet. Sc., 29, 535–562, 2001.
Armstrong, W., Wright, E. J., Lythe, S., and Gaynard, T. J.: Plant Zonation and the Effects of the Spring-Neap Tidal Cycle on Soil Aeration in a Humber Salt Marsh, J. Ecol., 73, 323–339, 1985.
Arriola, J. M. and Cable, J. E.: Variations in carbon burial and sediment accretion along a tidal creek in a Florida salt marsh, Limnol. Oceanogr., 62, S15–S28, 2017.
Arrouays, D., Saby, N., Walter, C., Lemercier, B., and Schvartz, C.: Relationships between particle-size distribution and organic carbon in French arable topsoils, Soil. Use. Manage., 22, 48–51, 2006.
Bai, J., Zhang, G., Zhao, Q., Lu, Q., Jia, J., Cui, B., and Liu, X.: Depth-distribution patterns and control of soil organic carbon in coastal salt marshes with different plant covers, Sci. Rep.-UK, 6, 34835, https://doi.org/10.1038/srep34835, 2016.
Ball, D. F.: Loss on ignition as an estimate of organic matter and organic carbon in non-calcareous soils, J. Soil. Sci., 15, 84–92, 1964.
Barbier, E. B., Koch, E. W., Silliman, B. R., Hacker, S. D., Wolanski, E., Primavera, J., Granek, E. F., Polasky, S., Aswani, S., Cramer, L. A., Stoms, D. M., Kennedy, C. J., Bael, D., Kappel, C. V., Perillo, G. M. E., and Reed, D. J.: Coastal ecosystem-based management with nonlinear ecological functions and values – supporting material, Science, 319, 321–323, 2008.
Beaumont, N. J., Jones, L., Garbutt, A., Hansom, J. D., and Toberman, M.: The value of carbon sequestration and storage in coastal habitats, Estuar. Coast. Shelf S., 137, 32–40, 2014.
Brazier, P., Birch, K., Brunstrom, A., Bunker, A., Jones, M., Lough, N., Salmon, L., and Wyn, G.: When the tide goes out. The biodiversity and conservation of the shores of Wales: results from a 10 year intertidal survey of Wales, Countryside Council for Wales, UK, 2007.
Chapin, F. S.: Now is the time for translational ecology, Front. Ecol. Environ., 15, p. 539, https://doi.org/10.1002/fee.1737, 2017.
Chaplin-Kramer, R., Sharp, R. P., Mandle, L., Sim, S., Johnson, J., Butnar, I., Milà i Canals, L., Eichelberger, B. A., Ramler, I., Mueller, C., McLachlan, N., Yousefi, A., King, H., and Kareiva, P. M.: Spatial patterns of agricultural expansion determine impacts on biodiversity and carbon storage, P. Natl. Acad. Sci. USA, 112, 7402–7407, 2015.
Chmura, G. L., Anisfeld, S. C., Cahoon, D. R., and Lynch, J. C.: Global carbon sequestration in tidal, saline wetland soils, Global Biogeochem. Cy., 17, 1111, https://doi.org/10.1029/2002GB001917, 2003.
Cuddington, K., Fortin, M. J., Gerber, L. R., Hastings, A., Liebhold, A., O'Connor, M., and Ray, C.: Process-based models are required to manage ecological systems in a changing world, Ecosphere, 4, 20, https://doi.org/10.1890/ES12-00178.1, 2013.
Davidson, K. E., Fowler, M. S., Skov, M. W., Doerr, S. H., Beaumont, N., and Griffin, J. N.: Livestock grazing alters multiple ecosystem properties and services in salt marshes: a meta-analysis, J. Appl. Ecol., 54, 1395–1405, 2017.
Decuyper, M., Slim, P. A. , and Van Loon-Steensma, J. M.: Dendrochronology of Atriplex portulacoides and Artemisia maritima in Wadden Sea salt marshes, J. Coast Conserv., 18, 279–284, 2014.
De Deyn, G. B., Conelissen, J. H. C., and Bardgett, R. D.: Plant functional traits and soil carbon sequestration in contrasting biomes, Ecol. Lett., 11, 516–531, 2008.
Deegan, L. A., Johnson, D. S., Warren, R. S., Peterson, B. J., Fleeger, J. W., Fagherazzi, S., and Wollheim, W. M: Coastal eutrophication as a driver of salt marsh loss, Nature, 490, 388–392, 2012.
Ding, H. and Nunes, P. A. L. D.: Modelling the links between biodiversity, ecosystem services and human wellbeing in the context of climate change: results from an econometric analysis of the European forest ecosystems, Ecol. Econ., 97, 60–73, 2014.
Drake, K., Halifax, H., Adamowicz, S. C., and Craft, C.: Carbon sequestration in tidal salt marshes of the Northeast United States, Environ. Manage., 56, 998–1008, 2015.
Emmett, B. A., Reynolds, G., Chamberlain, P. M., Rowe, E., Spurgeon, D., Brittain, S. A., Frogbrook, Z., Hughes, S., Lawlor, A. J., Poskitt, J., Potter, E., Robinson, D. A., Scott, A., Wood, C., and Woods, C.: Countryside Survey: Soils Report from 2007. Technical Report No. 9/07 NERC/Centre for Ecology & Hydrology, CEH Project Number: CO3259, 192 pp., available at: http://www.countrysidesurvey.org.uk/sites/default/files/CS_UK_2007_TR9-revised - Soils Report.pdf (last access: 22 January 2019), 2010.
Emmett, B. A., Cooper, D., Smart, S., Jackson, B., Thomas, A., Cosby, J., Evans, C., Glanville, H., McDonald, J. E., Malham, S. K., Marshall, M., Jarvis, S., Rajko-Nenow, P., Webb, G. P., Ward, S., Rowe, E., Jones, L., Vanbergen, A. J., Keith, A., Carter, H., Pereira, M. G., Hughes, S., Lebron, I., Wade, A., and Jones, D. L.: Spatial patterns and environmental constraints on ecosystem services at a catchment scale, Sci. Total Environ., 572, 1586–1600, 2016.
Ford, H., Garbutt, A., Jones, L., and Jones, D. L.: Methane, carbon dioxide and nitrous oxide fluxes from a temperate salt marsh: Grazing management does not alter Global Warming Potential, Estuar. Coast. Shelf S., 113, 182–191, 2012.
Ford, H., Garbutt, A., Ladd, C., Malarkey, J., and Skov, M. W.: Soil stabilization linked to plant diversity and environmental context in coastal wetlands, J. Veg. Sci., 27, 259–268, 2016.
Gray, A., Levy, P. E., Cooper, M. D. A., Jones, T., Gaiawyn, J., Leeson, S. R., Ward, S. E., Dinsmore, K. J., Drewer, J., Sheppard, L. J., Ostle, N. J., Evans, C. D., Burden, A., and Zieliński, P.: Methane indicator values for peatlands: a comparison of species and functional groups, Glob. Change Biol., 19, 1141–1150, 2013.
Gress, S. K., Huxham, M., Kairo, J. G., Mugi, L. M., and Briers, R. A.: Evaluating, predicting and mapping belowground carbon stores in Kenyan mangroves, Glob. Change Biol., 23, 224–234, 2017.
Grömping, U.: Relative Importance for Linear Regression in R: The Package relaimpo, J. Stat. Softw., 17, 1–27, 2006.
Hassink, J.: The capacity of soils to preserve organic C and N by their association with clay and silt particles, Plant Soil., 191, 77–87, 1997.
Hill, M. O.: TABLEFIT version 1.1, for identification of vegetation types, Centre for Ecology and Hydrology, Wallingford, UK, 2011.
Howard, J., Sutton-Grier, A., Herr, D., Kleypas, J., Landis, E., Mcleod, E., Pidgeon, E., and Simpson, S.: Clarifying the role of coastal and marine systems in climate mitigation, Front. Ecol. Environ., 15, 42–50, 2017.
IPCC: 2013 Supplement to the 2006 IPCC Guidelines for National Greenhouse Gas Inventories: Wetlands, edited by: Hiraishi, T., Krug, T., Tanabe, K., Srivastava, N., Baasansuren, J., Fukuda, M., and Troxler, T. G., IPCC, Switzerland, 2014.
Jackson, S. T., Garfin, G. M., and Enquist, C. A.: Toward an effective practice of translational ecology, Front. Ecol. Environ., 15, 541–550, 2017.
Jardine, S. L. and Siikamäki, J. V.: A global predictive model of carbon in mangrove soils, Environ. Res. Lett., 9, 104013, https://doi.org/10.1088/1748-9326/9/10/104013, 2014.
Jones, M. B. and Donnelly, A.: Carbon sequestration in temperate grassland ecosystems and the influence of management, climate and elevated CO2, New. Phytol., 164, 423–439, 2004.
Keiffer, C. H. and Ungar, I. A.: Germination and establishment of halophytes on brine-affected soils, J. Appl. Ecol., 39, 402–415, 2002.
Kelleway, J. J., Saintilan, N., Macreadie, P. I., and Ralph, P. J.: Sedimentary Factors are Key Predictors of Carbon Storage in SE Australian Saltmarshes, Ecosystems, 19, 865–880, 2016.
Koch, E. W., Barbier, E. B., Silliman, B. R., Reed, D. J., Perillo, G. M., Hacker, S. D., Granek, E. F., Primavera, J. H., Muthiga, N., Polasky, S., Halpern, B. S., Kennedy, C. J., Kappel, C. V., and Wolanski, E.: Non-linearity in ecosystem services: temporal and spatial variability in coastal protection, Front. Ecol. Environ., 7, 29–37, 2009.
Loreau, M., Naeem, S., Inchausti, P., Bengtsson, J., Grime, J. P., Hector, A., Hooper, D. U., Huston, M. A., Raffaelli, D., Schmid, B., Tilman, D., and Wardle, D. A.: Biodiversity and Ecosystem Functioning: Current Knowledge and Future Challenges, Science, 294, 804–808, 2001.
Luisetti, T., Jackson, E. L., and Turner, R. K.: Valuing the European “coastal blue carbon” storage benefit, Mar. Pollut. Bull., 71, 101–106, 2013.
Macreadie, P. I., Hughes, A. R., and Kimbro, D. L.: Loss of “Blue Carbon” from Coastal Salt Marshes Following Habitat Disturbance, PLoS One, 8, 1–8, 2013.
Manning, P., de Vries, F. T., Tallowin, J. R. B., Smith, R., Mortimer, S. R., Pilgrim, E. S., Harrison, K. A., Wright, D. G., Quirk, H., Benson, J., Shipley, B., Cornelissen, J. H. C., Kattge, J., Bönisch, G., Wirth, C., and Bardgett, R. D.: Simple measures of climate, soil properties and plant traits predict national-scale grassland soil carbon stocks, J. Appl. Ecol., 52, 1188–1196, 2015.
McHenry, J., Steneck, R. S., and Brady, D. C.: Abiotic proxies for predictive mapping of nearshore benthic assemblages: implications for marine spatial planning, Ecol. Appl., 27, 603–618, 2017.
McLeod, E., Chmura, G. L., Bouillon, S., Salm, R., Björk, M., Duarte, C. M., Lovelock, C. E., Schlesinger, W. H., and Silliman, B. R.: A blueprint for blue carbon: Toward an improved understanding of the role of vegetated coastal habitats in sequestering CO2, Front. Ecol. Environ., 9, 552–560, 2011.
McKenzie, E., Posner, S., Tillmann, P., Bernhardt, J. R., Howard, K., and Rosenthal, A.: Understanding the use of ecosystem service knowledge in decision making: lessons from international experiences of spatial planning, Environ. Plann. C, 32, 320–340, 2014.
Meiner, A., Reker, J., Hildén, M., and O'Doherty, J. J.: Balancing the future of Europe's coasts: knowledge base for integrated management, Luxembourg: Publications Office of the European Union, 2013.
Minden, V., Andratschke, S., Spalke, J., Timmermann, H., and Kleyer, M.: Plant trait–environmental relationships in salt marshes: deviations from predictions by ecological concepts, Perspectives in PPEES, 14, 183–192, 2012.
Oades, J. M.: The retention of organic matter in soils, Biogeochemistry, 5, 35–79, 1988.
O'Brien, S. L., Jastrow, J. D., Grimley, D. A., and Gonzalez-Meler, M. A.: Edaphic controls on soil organic carbon stocks in restored grasslands, Geoderma, 251–252, 2015.
Ostle, N. J., Levy, P. E., Evans, C. D., and Smith, P.: UK land use and soil carbon sequestration, Land Use Policy, 26, S274–S283, 2009.
Pan, Y., Birdsey, R. A., Fang, J., Houghton, R., Kauppi, P. E., Kurz, W. A., Phillips, O. L., Shvidenko, A., Lewis, S. L., CAnadell, J. G., Ciais, P., Jackson, R. B., Pacala, S. W., McGuire, A. D., Piao, S., Rautiainen, A., Sitch, S., and Hayes, D.: A large and persistent carbon sink in the world's forests, Science, 333, 988–993, 2011.
Phelan, N., Shaw, A., and Baylis, A.: The extent of saltmarsh in England and Wales: 2006–2009, Environmental Agency, Bristol, UK, 2011.
Posner, S., Verutes, G., Koh, I., Denu, D., and Ricketts, T.: Global use of ecosystem service models, Ecosyst. Serv., 17, 131–141, 2016.
R Core Team.: R: A language and environment for statistical computing. R Foundation for Statistical Computing, Vienna, Austria, available at: https://www.R-project.org/, last access: 8 January 2019, 2016.
Robins, P. E., Skov, M. W., Lewis, M. J., Giménez, L., Davies, A. G., Malham, S. K., Neill, S. P., McDonald, J. E., Whitton, T. A., Jackson, S. E., and Jago, C. F.: Impact of climate change on UK estuaries: A review of past trends and potential projections, Estuar. Coast. Shelf S., 169, 119–135, 2016.
Rodwell, J. S.: British plant communities, Maritime Communities and Vegetation of Open Habitats, Cambridge University Press, Cambridge, UK, vol. 5, 2000.
Rossel, R. A. V., Webster, R., Bui, E. N., and Baldock, J. A.: Baseline map of organic carbon in Australian soil to support national carbon accounting and monitoring under climate changem, Glob. Change Biol., 20, 2953–2970, 2014.
Scholefield, P.: Case study: WALES, from Mapping of Ecosystems and their Services in the EU and its Member States (MESEU), ENV.B.2./SER/2012/0016, 2013.
Schwarz, C., Bouma, T. J., Zhang, L. Q., Temmerman, S., Ysebaert, T., and Herman, P. M. J.: Interactions between plant traits and sediment characteristics influencing species establishment and scale-dependent feedbacks in salt marsh ecosystems, Geomorphology, 250, 298–307, 2015.
Skov, M. W., Ford, H., Webb, J., Kayoueche-Reeve, M., Hockley, N., Paterson, D., and Garbutt, A.: The Saltmarsh Carbon Stock Predictor: a tool for predicting carbon stocks of Welsh and English and salt marshes, UK. CBESS, Biodiversity and Ecosystem Service Sustainability programme (NERC NE/J015350/1), Bangor University, UK, 2016.
Stace, C.: New Flora of the British Isles, third edition, Cambridge University Press, Cambridge, UK, 2010.
Tanentzap, A. J. and Coomes, D. A.: Carbon storage in terrestrial ecosystems: do browsing and grazing herbivores matter?, Biol. Rev. Camb. Philos., 87, 72–94, 2012.
TEEB.: The Economics of Ecosystems and Biodiversity Ecological and Economic Foundations, edited by: Pushpam Kumar, Earthscan, London and Washington, 2010.
UK National Ecosystem Assessment: The UK National Ecosystem Assessment: Synthesis of the Key Findings, UNEP-WCMC, LWEC, UK, 2014.
Vigerstol, K. L. and Aukema, J. E.: A comparison of tools for modelling freshwater ecosystem services, J. Environ. Manage., 92, 2403–2409, 2011.
Yang, Y., Fant, J., Ji, C., Ma, W., Su, S., and Tang, Z.: Soil inorganic carbon stock in the Tibetan alpine grasslands, Global Biogeochem. Cy., 24, GB4022, https://doi.org/10.1029/2010GB003804, 2010.
Yapp, G., Walker, J., and Thackway, R.: Linking vegetation type and condition to ecosystem goods and services, Ecol. Complex., 7, 292–301, 2010.
Zuur, A. F., Ieno, E. N., Walker, N. J., Saveliev, A. A., and Smith, G. H.: Mixed Effects Models and Extensions in Ecology with R. Springer-Verlag, New York, 2009.