the Creative Commons Attribution 4.0 License.
the Creative Commons Attribution 4.0 License.
 | 18 Oct 2019
Insights from mercury stable isotopes on terrestrial–atmosphere exchange of Hg(0) in the Arctic tundra
Jeroen E. Sonke
Yannick Agnan
Detlev Helmig
Daniel Obrist
The tundra plays a pivotal role in the Arctic mercury (Hg) cycle by storing atmospheric Hg deposition and shuttling it to the Arctic Ocean. A recent study revealed that 70 % of the atmospheric Hg deposition to the tundra occurs through gaseous elemental mercury (GEM or Hg(0)) uptake by vegetation and soils. Processes controlling land–atmosphere exchange of Hg(0) in the Arctic tundra are central, but remain understudied. Here, we combine Hg stable isotope analysis of Hg(0) in the atmosphere, interstitial snow air, and soil pore air, with Hg(0) flux measurements in a tundra ecosystem at Toolik Field Station in northern Alaska (USA). In the dark winter months, planetary boundary layer (PBL) conditions and Hg(0) concentrations were generally stable throughout the day and small Hg(0) net deposition occurred. In spring, halogen-induced atmospheric mercury depletion events (AMDEs) occurred, with the fast re-emission of Hg(0) after AMDEs resulting in net emission fluxes of Hg(0). During the short snow-free growing season in summer, vegetation uptake of atmospheric Hg(0) enhanced atmospheric Hg(0) net deposition to the Arctic tundra. At night, when PBL conditions were stable, ecosystem uptake of atmospheric Hg(0) led to a depletion of atmospheric Hg(0). The night-time decline of atmospheric Hg(0) was concomitant with a depletion of lighter Hg(0) isotopes in the atmospheric Hg pool. The enrichment factor, ε202Hg ‰ (±1.0 ‰) was consistent with the preferential uptake of light Hg(0) isotopes by vegetation. Hg(0) flux measurements indicated a partial re-emission of Hg(0) during daytime, when solar radiation was strongest. Hg(0) concentrations in soil pore air were depleted relative to atmospheric Hg(0) concentrations, concomitant with an enrichment of lighter Hg(0) isotopes in the soil pore air, ε202Hg ‰ (±0.25 ‰) and E199Hg ‰ (±0.04 ‰). These first Hg stable isotope measurements of Hg(0) in soil pore air are consistent with the fractionation previously observed during Hg(0) oxidation by natural humic acids, suggesting abiotic oxidation as a cause for observed soil Hg(0) uptake. The combination of Hg stable isotope fingerprints with Hg(0) flux measurements and PBL stability assessment confirmed a dominant role of Hg(0) uptake by vegetation in the terrestrial–atmosphere exchange of Hg(0) in the Arctic tundra.
- Article
(3480 KB) -
Supplement
(1932 KB) - BibTeX
- EndNote


Mercury (Hg) is a high priority pollutant that causes neurodevelopmental deficits in children and cardiovascular disease in adults (Budtz-Jørgensen et al., 2000; Roman et al., 2011). Arctic populations are particularly exposed to high Hg levels, despite few local anthropogenic Hg emission sources, due to their traditional diet consisting of high trophic level seafood (Sheehan et al., 2014). Anthropogenic Hg emissions from midlatitudes reach remote ecosystems, such as the Arctic, via the long-range transport of gaseous elemental mercury (GEM or Hg(0)) (Douglas et al., 2012). It has long been thought that springtime oxidation of Hg(0) driven by photochemically produced bromine radicals Br• on surface snow, referred to as “atmospheric mercury depletion events” (AMDEs), leads to enhanced deposition of divalent mercury (Hg(II)) in Arctic regions (Steffen et al., 2008). Such Hg(II) deposition to the snowpack during AMDEs, however, can be subject to photoreduction and fast re-emission back into the atmosphere, minimising the net load of Hg by AMDEs to snow (Douglas et al., 2012; Johnson et al., 2008).
Tundra soils play a central role in the Arctic Hg cycle by storing atmospheric Hg deposition from where it can then be mobilised and transported to the Arctic Ocean (Obrist et al., 2017; Sonke and Heimburger, 2012; Sonke et al., 2018). Over millennia, tundra vegetation and soils have drawn Hg(0) out of the atmosphere, resulting in one of the largest pools of Hg (408–863 Gg Hg, top 1 m) stored at the Earth's surface (Obrist et al., 2017; Olson et al., 2018; Schuster et al., 2018). Arctic rivers deliver 44–50 Mg a−1 of Hg to the Arctic Ocean (Dastoor and Durnford, 2014; Sonke et al., 2018). In aquatic ecosystems, Hg can be transformed to methyl mercury that bioaccumulates in the aquatic food chain, resulting in elevated Hg concentrations in high trophic level fishes and mammals (Outridge et al., 2009; Douglas et al., 2012).
On a global scale, vegetation uptake of atmospheric Hg(0) represents the dominant pathway of atmospheric Hg deposition to terrestrial surfaces, resulting in strong seasonal variation of atmospheric Hg(0) concentrations, with minima in summer when vegetation activity is highest (Jiskra et al., 2018). Direct Hg(0) flux measurements over selected surfaces (e.g. soil, snow, or leaves), however, do not always provide conclusive answers about the direction and magnitude of Hg exchange between terrestrial ecosystems and the atmosphere. For example, a review of 132 terrestrial–atmosphere Hg(0) flux studies conducted over various surfaces over the last 30 years estimated a wide range of net fluxes in the range of −513 to 1650 Mg a−1 (37.5th to 62.5th percentile) (Agnan et al., 2016). In recent years, a number of studies using Hg(0) flux measurements based on micrometeorological methods directly quantified net ecosystem exchange fluxes of Hg(0) over terrestrial ecosystems (i.e. at the ecosystem level), including atmosphere–vegetation exchange and underlying soil/litter contributions (Lindberg et al., 1998; Fritsche et al., 2008; Bash and Miller, 2009; Castro and Moore, 2016; Osterwalder et al., 2017). Measurements of multi-level Hg(0) gradients and interstitial snow air and soil pore air provided additional constraints on the terrestrial surface exchange flux (Sigler and Lee, 2006; Moore and Castro, 2012; Faïn et al., 2013; Obrist et al., 2014; Fu et al., 2016b; Agnan et al., 2018).
Hg stable isotopes are a powerful tool to study the deposition and re-emission pathways of Hg to terrestrial ecosystems. The Hg stable isotope fingerprint of soil samples reflects the source contribution of atmospheric Hg(0) dry deposition, Hg(II) wet deposition, and Hg from geogenic origin, as well as processes fractionating Hg isotopes during post-deposition processes, e.g. re-emission (Demers et al., 2013; Jiskra et al., 2015; Enrico et al., 2016). Mercury has seven stable isotopes, which can undergo mass-dependent fractionation (MDF, described by δ202Hg), mass-independent fractionation of odd-mass-number isotopes (odd-MIF, described by Δ199Hg and Δ201Hg), and mass-independent fractionation of even-mass-number isotopes (even-MIF, described by Δ200Hg and Δ204Hg), thereby producing a multidimensional isotopic fingerprint (Obrist et al., 2018). Atmospheric Hg(0) and Hg(II) in wet deposition exhibit distinct Δ199Hg and Δ200Hg signatures (Gratz et al., 2010; Chen et al., 2012; Sherman et al., 2012b; Demers et al., 2013; Enrico et al., 2016). Foliar uptake of atmospheric Hg0 discriminates heavier Hg isotopes, leading to consistently lower δ202Hg values reported in foliage compared with atmospheric Hg(0) (Demers et al., 2013; Enrico et al., 2016; Obrist et al., 2017; Yu et al., 2018; Yuan et al., 2018). Using the triple isotopic fingerprint to distinguish between Hg(0) and Hg(II) deposition, an increasing number of studies around the globe have revealed that 60 %–90 % of Hg in soils is derived from Hg(0) uptake by vegetation (Demers et al., 2013; Jiskra et al., 2015; Enrico et al., 2016; Zheng et al., 2016; Obrist et al., 2017).
This paper is part of a larger study aiming to better understand the fate of Hg in Arctic tundra ecosystems, centred around a 2-year field campaign on the Arctic Coastal Plain of Alaska. In Obrist et al. (2017), we performed a 2-year mass balance of terrestrial–atmosphere exchange over the Arctic tundra. We also investigated the spatial distribution of Hg in tundra soils (Olson et al., 2018), and spatial and temporal patterns of Hg in snow (Agnan et al., 2018) and in vegetation (Olson et al., 2019). In our previous work, we showed that the uptake of atmospheric Hg(0) by vegetation and soil represents 70 % of total atmospheric deposition and has led to high Hg levels in Arctic soils (Obrist et al., 2017, 2018). In this study, we explore the use of novel Hg stable isotope measurements of Hg(0) in interstitial snow air and soil pore air to identify the processes driving tundra Hg(0) deposition. We further discuss the effects of terrestrial–atmosphere exchange processes and planetary boundary layer stability on the Hg(0) concentration and Hg stable isotope signature measured in the atmosphere.
2.1 Study site
The study was conducted at Toolik Field Station (68∘38′ N, 149∘36′ W) on the Arctic Coastal Plain in northern Alaska, USA, 180 km inland from the Arctic Ocean coast. All measurements were conducted on an acidic tussock tundra, on Aquiturbels soils with an active layer of 60–100 cm (Obrist et al., 2017). The climate of Toolik Field Station is characterised by low mean annual temperatures of −8.5 ∘C and a mean annual precipitation of 312 mm a−1 (Cherry et al., 2014). During the 1-year Hg isotope campaign from October 2015 to September 2016, the tundra was snow-covered for a total of 248 d (Agnan et al., 2018), leading to a relatively short snow-free growing season.
2.2 Hg stable isotope sampling and measurement
Hg(0) was continuously sampled in the atmosphere (0.3 and 2 m above ground), in interstitial air of surface snow (0 and 0.1 m above ground), and in soil pore air (0.4 m below ground) at low flow rates of 0.2 L min−1. Interstitial snow air for Hg(0) stable isotope measurements was sampled from a dedicated snow tower adapted from Seok et al. (2009), consisting of an aluminium construction with three gas inlets on horizontal bars at 0, 0.1, and 0.3 m above ground (Fig. S1a in the Supplement). Two soil wells as described in Obrist et al. (2017) were dedicated to Hg(0) stable isotope sampling of soil air. Each soil well had two gas inlets, positioned 1.5 m apart at 0.4 m depth, each inlet consisting of a 47 mm single stage filter assembly (Savillex, Eden Prairie, USA) with a Teflon® filter membrane (Fig. S1b).
Hg(0) was trapped on iodated activated carbon (IAC) traps (Brooks Rand, 0.1 g in custom made 12 cm long glass tubes with an inner diameter of 4 mm, Fu et al., 2014) and samples were changed manually during site visits every 6 to 8 weeks. During site visits in March and June 2016, higher temporal resolution (2–4 d) sampling was conducted with higher flow rates of 1.5–2 L min−1. Overall, total volumes of sampled air per sample ranged from 5.7 to 17.7 m3 (Table S1 in the Supplement). During the growing season (June to September 2016), diel variation of atmospheric Hg(0) was assessed using two parallel sampling lines operated with a time switch. Daytime samples were collected from 06:00 to 22:00 AKST (Alaska standard time – used for all times referenced throughout the paper), and night-time samples were collected from 22:00 to 06:00. Of the 14 soil pore air samples taken during the 1-year Hg isotope campaign, only three samples contained sufficient Hg (>2.5 ng) for isotopic analysis. The reason for this was that the Hg(0) in soil pore air was largely depleted (below the detection limit of ≈0.1 ng m−3) (Obrist et al., 2017; Agnan et al., 2018), in particular during winter months, making isotopic characterisation of the soil pore air Hg(0) pool impossible during this time period.
The protocol for Hg stable isotope measurements of Hg(0) was adapted from Fu et al. (2014). We used lower amounts of IAC trap material (0.1 g) to reduce possible matrix effects during cold-vapour generation. Breakthrough was tested in the lab and under field conditions by connecting a Tekran 2537 after the IAC trap, and Hg(0) measurements were always below the detection limit (<0.1 ng m−3). IAC traps were combusted in a two-stage oven system and Hg was recovered in a 4.2 N HNO3, 1.2 N HCl oxidising acid trap. Hg stable isotope ratios of trap solutions were measured by cold-vapour separation multi-collector inductively coupled plasma mass spectrometry (CV MC-ICP/MS) at the Observatory Midi-Pyrénées, Toulouse, France (Jiskra et al., 2019; Sun et al., 2013). Six process blanks and one field blank were measured during the sample processing and were 0.25 ng Hg/trap (max 0.85 ng Hg/trap) on average, representing 1 %–2 % of the typical Hg amounts collected during sampling periods. The amounts of Hg collected on IAC-traps sampling atmospheric Hg(0) were compared to Hg(0) concentration measurements using a Tekran 2537 and revealed sample yields of 107±23 % (mean ± 1 SD, n=22).
Mass-dependent fractionation (MDF) of Hg stable isotopes is reported in small delta notation (δ) in per mille (‰) deviation from to the reference NIST 3133 Hg standard:
where “xxx” refers to measured isotope masses: 199, 200, 201, 202, and 204. Mass-independent fractionation (MIF) is reported in capital delta notation (Δ), which is defined as the difference between the measured δ199Hg, δ200Hg, δ201Hg, and δ204Hg values and those predicted for MDF relative to δ202Hg using the kinetic MDF law:
where SFxxx is the mass-dependent scaling factor of 0.252 for 199Hg, 0.502 for 200Hg, 0.752 for 201Hg, and 1.493 for 204Hg (Blum and Bergquist, 2007). Hg isotope enrichment factors associated with two pools (εxxxHgpool 1−pool 2 and ExxxHgpool 1−pool 2) were calculated from the difference in the MDF and MIF signatures between two pools (pool 1 and pool 2) as follows:
The MDF enrichment factors of a reaction (εxxxHgreaction) were determined by fitting a linear regression model (lm function of R) to the observational data following Mariotti et al. (1981):
where δxxxHgresidual corresponds to the Hg isotope signature of the residual Hg(0), δxxxHg0 corresponds to the initial Hg(0) isotope signature, and f corresponds to the fraction of Hg(0) remaining in the gas phase. Note that for high f>0.4 the systematic error of this simplified approach is minimal. The MIF enrichment factor (ExxxHgreaction) was calculated as follows:
The long-term precision was assessed through repeated analysis of the ETH-Fluka Hg standard, which yielded values of ‰, 0.08±0.1 ‰, 0.02±0.1 ‰, 0.02±0.09 ‰, and ‰ (2σ, n=73) for δ202Hg, Δ199Hg, Δ200Hg, Δ201Hg, and Δ204Hg, respectively, which is in agreement with published values (Jiskra et al., 2015; Smith et al., 2015). The UM-Almaden standard, now available as NIST-8610, was measured less frequently and results were ‰, ‰, 0.00±0.1 ‰, ‰, and ‰ (2 SD, n=21) for δ202Hg, Δ199Hg, Δ200Hg, Δ201Hg, and Δ204Hg, which is in agreement with previously reported values (Demers et al., 2013; Jiskra et al., 2015; Enrico et al., 2016).
2.3 Hg(0) flux measurements
Micrometeorological flux measurements to quantify Hg(0) exchange at the ecosystem level were conducted using the aerodynamic gradient flux method. Surface–atmosphere flux was calculated by measurement of concentration gradients in the atmosphere above the tundra in conjunction with atmospheric turbulence parameters as follows:
where k denotes the von Kármán constant (0.4), u∗ is the friction velocity, z is the measurement height, ϕh is the Monin–Obukhov scaling coefficient (dimensionless) (Monson and Baldocchi, 2014), and is the vertical Hg(0) gas concentration gradient. Hg(0) concentrations at heights of 61 and 363 cm above the soil surface were measured through 0.2 µm Teflon® inlet filters connected to ∼35 m of perfluoroalkoxy polymer (PFA) lines. A valve control system with three-way solenoid valves (NResearch, West Caldwell, NJ, USA) allowed switching between the gradient inlets to take place every 10 min. A set of trace gas analysers with a total sampling flow of 1.5 L min−1 was connected to the gradient inlets by solenoid valves. The trace analysers included an air mercury analyser (Model 2537A, Tekran Inc. Toronto, Canada) and a cavity ring-down (CRD) greenhouse gas analyser to measure CO2, H2O, and CH4 (Los Gatos Research, San Jose, USA). Fluxes were only calculated during periods of appropriate turbulence following Edwards et al. (2005) and as described in Obrist et al. (2017). Gradient data recorded during very stable (ζ>2) and very unstable (ζ>2) periods were removed from the dataset (4 %). The overall data coverage was 79 %. Only flux data with wind directions from the tundra (40–300∘ N) were considered (73 %). No gap filling was performed. For quality control, sampling line blanks and line intercomparisons, where the two gradient lines were put on the same height, were performed approximately every 6 to 8 weeks (Obrist et al., 2017). The planetary boundary layer (PBL) stability was assessed via the stability index (ζ, dimensionless), defined as
In the above-mentioned equation, z represents the height of the Metek USA-1 sonic anemometer (Metek GmbH, Elmshorn, Germany), i.e. 236 cm above ground, and L represents the Monin–Obukhov length. The PBL was considered stable when ζ>0.1, unstable when , and neutral when (Peichl et al., 2013). During the sampling period, auxiliary variables showed the following daily average values: air temperature of −7.4 ∘C (from −40.6 to 20.4 ∘C), relative humidity of 74 % (from 37 % to 98 %), and a wind speed of 2.36 m s−1 (from 0 to 7.82 m s−1).
2.4 Backward trajectory modelling
Backward trajectories of air masses were modelled using the HYSPLIT transport and dispersion model (Stein et al., 2015) from the NOAA Air Resources Laboratory, which is accessible via the READY website (Rolph et al., 2017).
We divide the presentation and discussion of results into three seasons of the year. In winter (20 October 2015 to 17 March 2016), the tundra site was continuously snow-covered and the climatic conditions were characterised by low temperatures (mean = −17.8 ∘C, hourly max = 1.2 ∘C) and low solar radiation (mean = 0.02 kW m−2, hourly max = 0.41 kW m−2). In spring (17 March–5 April 2016), temperatures were low (mean = −19.2 ∘C, hourly max = −2.4 ∘C) and the tundra was still snow-covered; however, solar radiation increased (mean = 0.13 kW m−2, max = 0.54 kW m−2) and occasional atmospheric mercury depletion events (AMDEs) were detected at the study site (Obrist et al., 2017; Agnan et al., 2018). During summer (3 May–9 September 2016), the air temperature was above freezing (mean = 6.7 ∘C, hourly max = 25.1 ∘C), solar radiation was high (mean = 0.19 kW m−2, hourly max = 0.80 kW m−2), and the study site was predominantly free of snow.
3.1 Winter
Over the winter period, atmospheric Hg(0) concentrations and CO2 mixing ratios were relatively constant and there was little diel variation (Figs. 1a, S2). Low solar radiation led to relatively stable PBL conditions throughout the day (Fig. 1b). Hg(0) flux measurements revealed a small deposition ( ng m−2 h−1, mean ±1 SD, median = −0.2 ng m−2 h−1) (Obrist et al., 2017). The Hg(0) net deposition flux is supported by observed depletions of atmospheric Hg(0) in interstitial snow air (0.69±0.22 ng m−3, mean ±1 SD, 0 and 0.1 m sampling height) relative to atmospheric levels (1.07±0.04 ng m−3 – mean ±1 SD) (p=0.02, two-sided t test), implying a net sink of atmospheric Hg(0) in the ecosystem (Fig. 2c). A wintertime Hg(0) sink can either occur due to (i) Hg(0) deposition to Arctic snow, (ii) uptake by soil or litter, or (iii) assimilation by vegetation still active under the snowpack. Depletion of atmospheric Hg(0) in interstitial snow air was associated with an increase in δ202Hg (1.08 ‰ ± 0.20 ‰ versus 0.77 ‰ ± 0.16 ‰ in ambient Hg(0), mean ± 1 SD, p=0.02, two-sided t test) (Fig. 2a) and a decrease in Δ199Hg (−0.31 ‰ ± 0.05 ‰ versus −0.23 ‰ ± 0.06 ‰ in ambient Hg(0), mean ± 1 SD, p=0.04, two-sided t test) (Fig. 2b). Both Hg(0) dry deposition to surface snow (Douglas and Blum, 2019) and by vegetation uptake (Demers et al., 2013; Enrico et al., 2016; Obrist et al., 2017) have been reported to discriminate heavier Hg(0) isotopes, consistent with these observations in the interstitial snow air. From a mass balance perspective, however, Hg(0) dry deposition to snow is considered to only play a minor role in the interior Arctic tundra. For example, using snow data in Agnan et al. (2018), we calculated a total seasonal snow Hg pool of only 50 ng m−2 at Toolik Field Station. Assuming that all this Hg in the snow was originating from the dry deposition of Hg(0), this would account for <10 % of the Hg(0) deposition during the snow-covered period (total of 2.4 µg m−1 a−1; Obrist et al., 2017). In contrast, Douglas and Blum (2019) recently suggested that Hg(0) dry deposition to snow was the major source of Hg in meltwater collected on the coast of the Arctic Ocean close to Utqiagvik (former Barrow), ∼400 km north-west of Toolik Field Station. In snow on the coast of the Arctic Ocean, concentrations of halogens, which are considered to mediate reactive Hg(0) uptake, are elevated compared with inland sites (Douglas and Sturm, 2004; Agnan et al., 2018; Douglas et al., 2017), leading to much higher snow Hg pools (>2000 ng m−2) in coastal snowpacks (Douglas et al., 2017).
A major wintertime Hg(0) deposition pathway to soils would be inconsistent with the observed enrichment in heavier Hg(0) isotopes in the interstitial snow air (Fig. 2a), as Hg(0) oxidation by humic acids in soils would lead to more negative δ202Hg values (Zheng et al., 2018) (see discussion below in Sect. 3.3.3). Hg(0) re-emission from snow was insignificant in winter due to the absence of sunlight, as indicated by lower Hg(0) concentrations in interstitial snow air than in the atmosphere. By excluding snow and soil uptake as dominant deposition pathway, we infer that the uptake of Hg(0) by ground vegetation and/or litter on the soil surface may be driving Hg(0) deposition during the winter months. MDF and MIF signatures observed in interstitial snow air Hg(0) would be consistent with Hg(0) uptake by lichen. Hg isotope signatures of lichen measured at the same site (δ202Hg = −0.80 ‰ ± 0.20 ‰, Δ199Hg = 0.20 ‰ ± 0.21 ‰, mean ± 1 SD, n=12) were in the opposite direction of interstitial snow air Hg(0) (Olson et al., 2019). Lichen have been reported to actively exchange CO2 for photosynthesis under snow cover (Kappen, 1993), and could possibly also take up atmospheric Hg(0) during winter months.
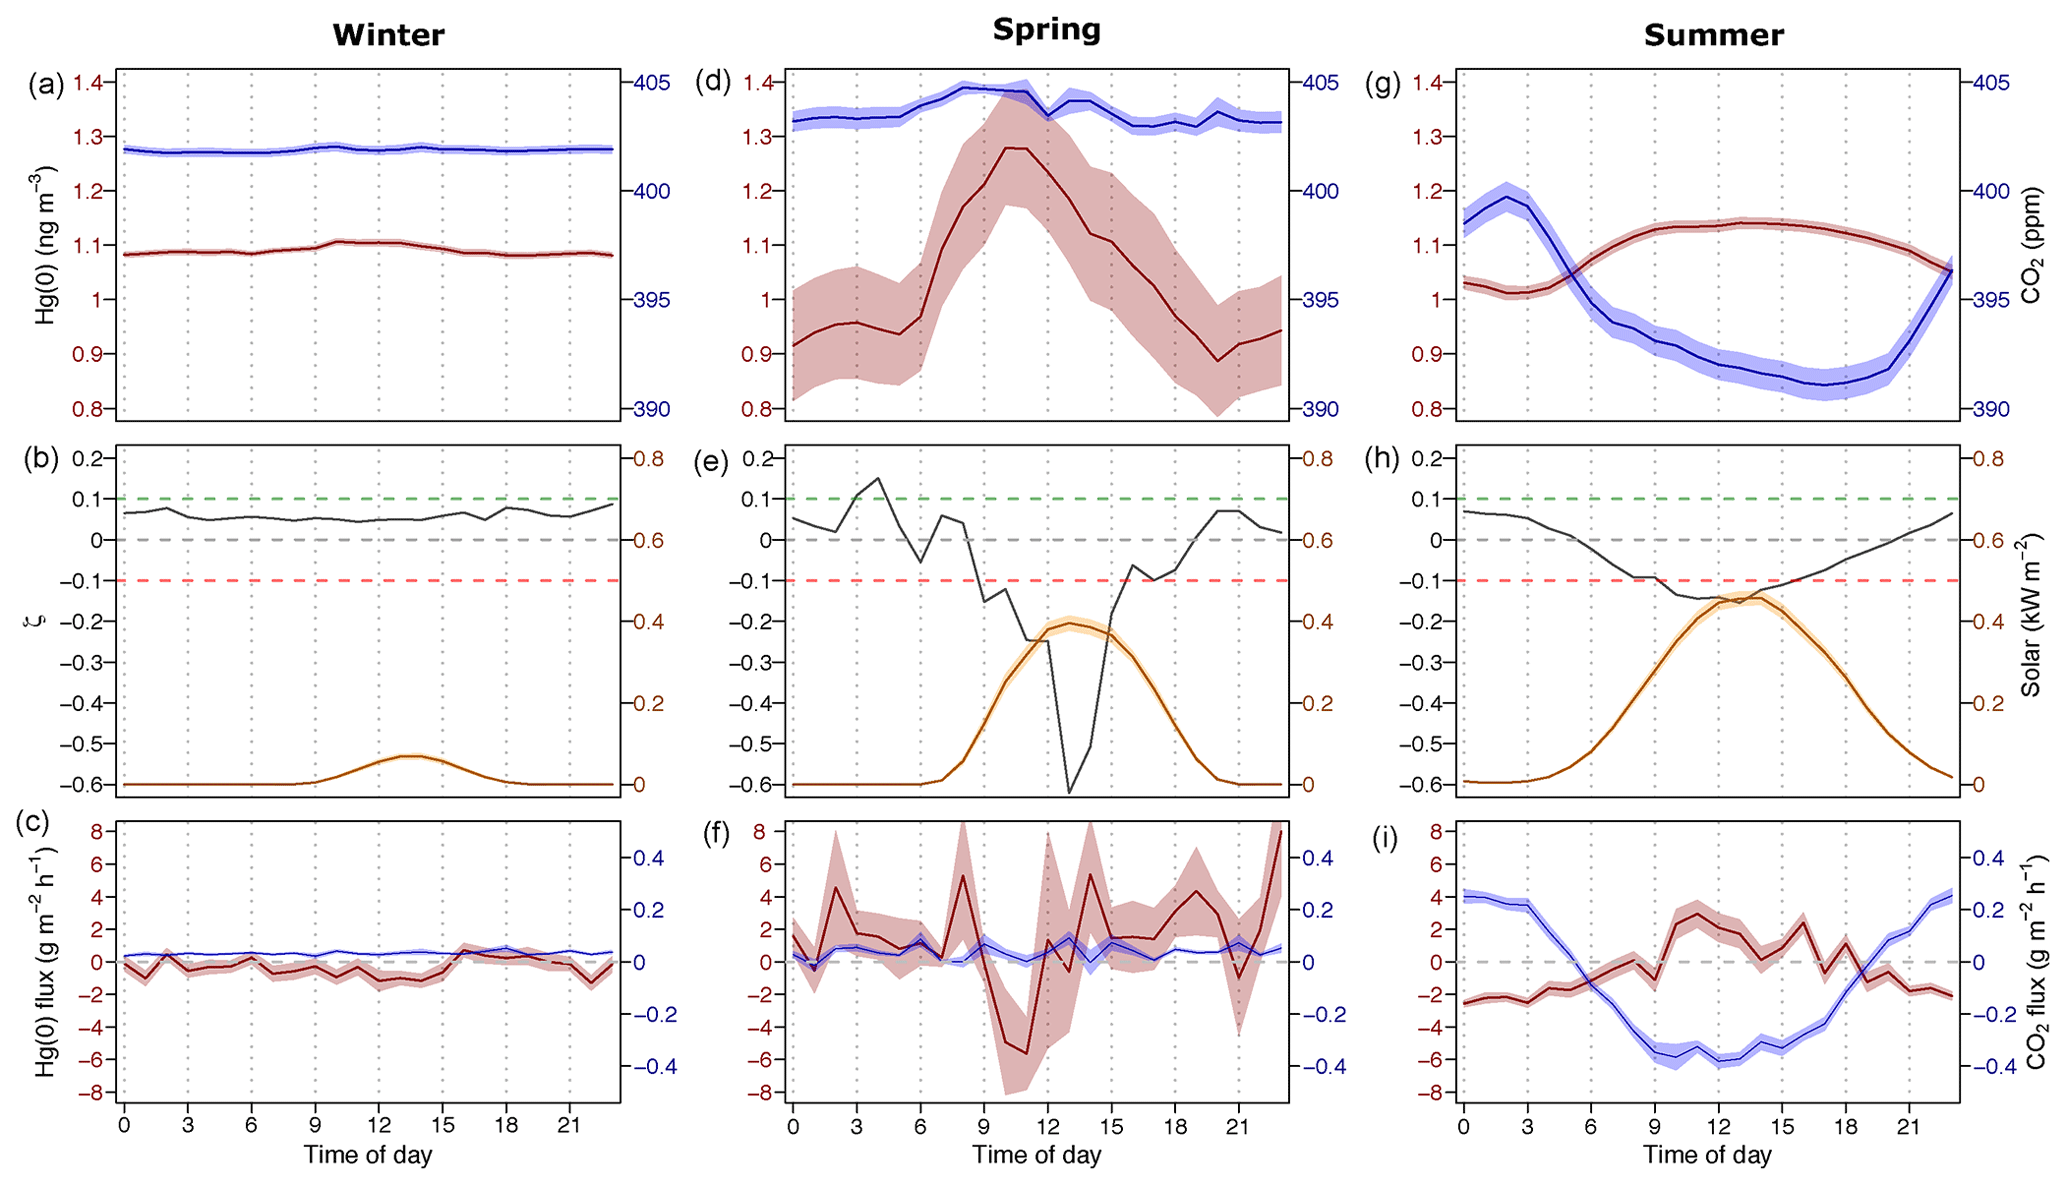
Figure 1Diel variation during winter (a, b, c), spring (d, e, f), and summer (g, h, i): (a, d, g) average Hg(0) concentration (in red) and the CO2 mixing ratio (in blue) in the atmosphere (2 m height). (b, e, h) The median planetary boundary layer stability parameter (ζ, grey), where positive values represent stable conditions, and solar radiation is shown in yellow. (c, f, i) The average Hg(0) flux (in red) and the average CO2 flux (in blue). The shaded areas in (a) and (c) represent the mean ± 1 SD interval of concentration and flux measurements, respectively.
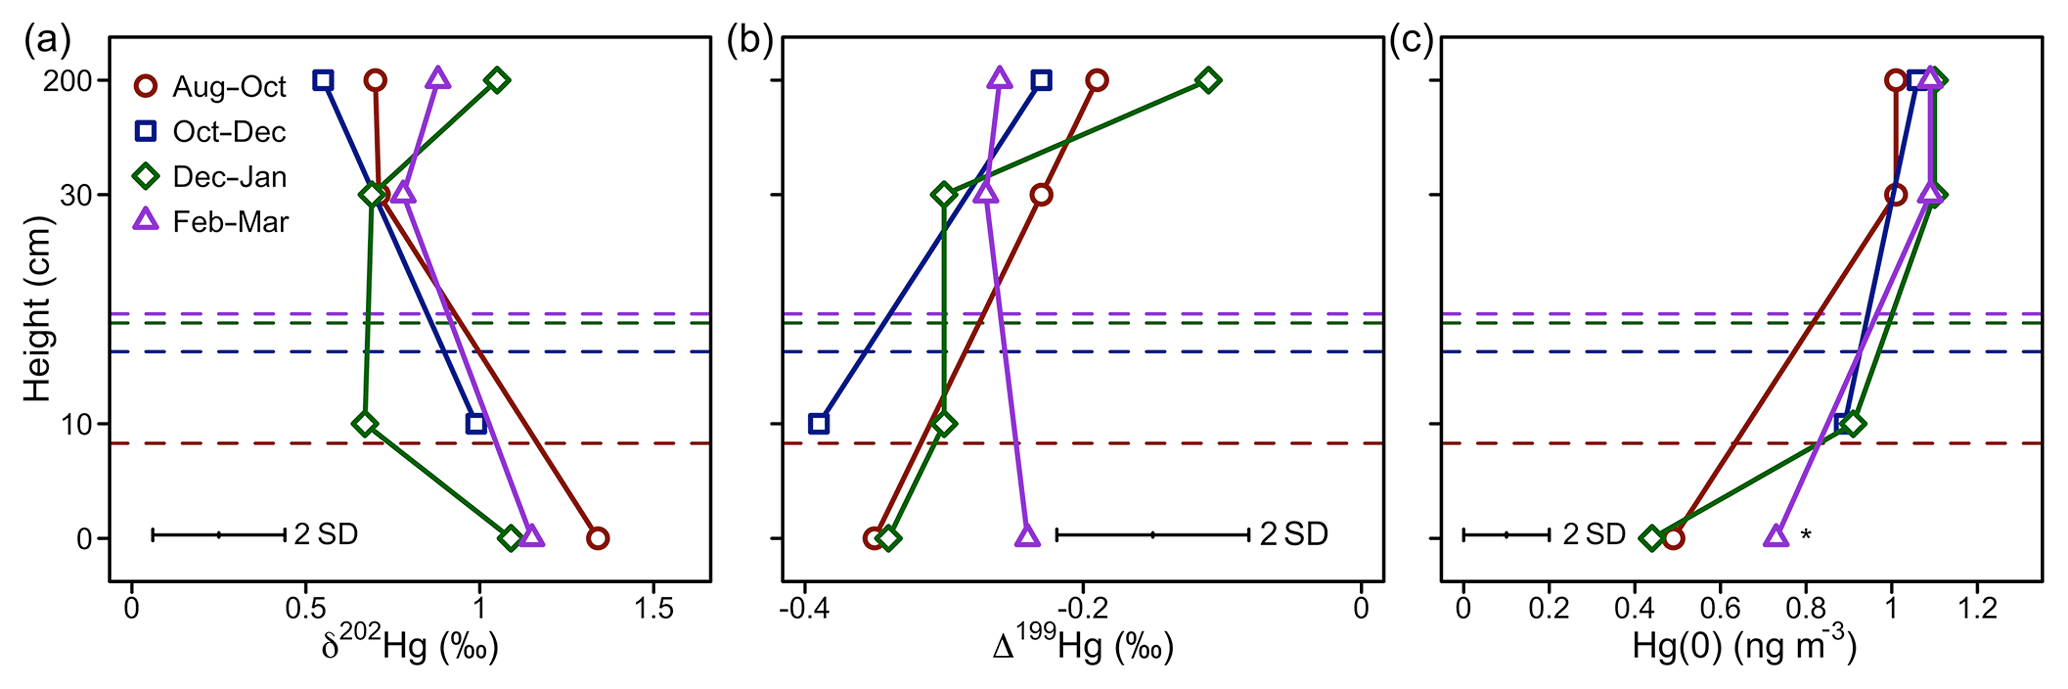
Figure 2Hg(0) measurements in interstitial snow air profiles. (a) Mass-dependent fractionation stable isotope signature of Hg(0) (δ202Hg), (b) mass-independent fractionation stable isotope signature of Hg(0) (Δ199Hg), and (c) mean Hg(0) concentration. Note that the Hg(0) concentration marked with an asterisk (*) was calculated from Hg recovered on the IAC traps, whereas other Hg(0) concentration profiles were measured by an automated trace gas system deployed in the snowpack (Agnan et al., 2018). The dashed horizontal lines represent the average snow height during the respective period.
3.2 Spring
During spring 2016, two major AMDEs occurred (events 1 and 3; Fig. 3). During both events air masses were transported from the Arctic coast or the Arctic Ocean to Toolik Field Station, as inferred from HYSPLIT backward trajectory modelling. During the 19 March–20 March 2016 period (event 1 in Fig. 3), atmospheric Hg(0) concentrations dropped below the detection limit (<0.1 ng m−3), while atmospheric Hg(II) concentrations remained low (<0.1 ng m−3), with the exception of individual spikes of up to 0.4 ng m−3. During the 1–3 April 2016 period (event 3 in Fig. 3), atmospheric Hg(0) concentrations decreased below the detection limit at times, while Hg(II) concentrations remained high (around 0.4 ng m−3) for 2 days. During the similar AMDEs 1 and 3, O3 mixing ratios dropped below 10 ppb. Van Dam et al. (2013) previously reported that during AMDEs ozone depletion events (ODEs) also occurred at Toolik Field Station, concurrent AMDEs and ODEs were also observed on the coast at Utqiagvik ∼400 km to the north-west. Van Dam et al. (2013) suggested that AMDEs and ODEs were driven by bromine emissions from the Arctic Ocean and transported to different extents to the interior tundra. During event 1, no elevated Hg(II) concentrations were observed; thus, we assume that air depleted in Hg(0) was transported to Toolik Field Station, while the deposition of Hg(II) likely occurred closer to the coast. During the 26–29 March 2016 period (event 2 in Fig. 3), when air masses were coming from the south, atmospheric Hg(0) concentrations temporally decreased to 0.75 ng m−3, O3 remained high (>30 ppb), and Hg(II) concentrations remained enhanced around 0.2 ng m−3 for 2 days while turbulent PBL conditions prevailed. The source of these enhanced Hg(II) levels transported from the Brooks Range mountains remains unknown.
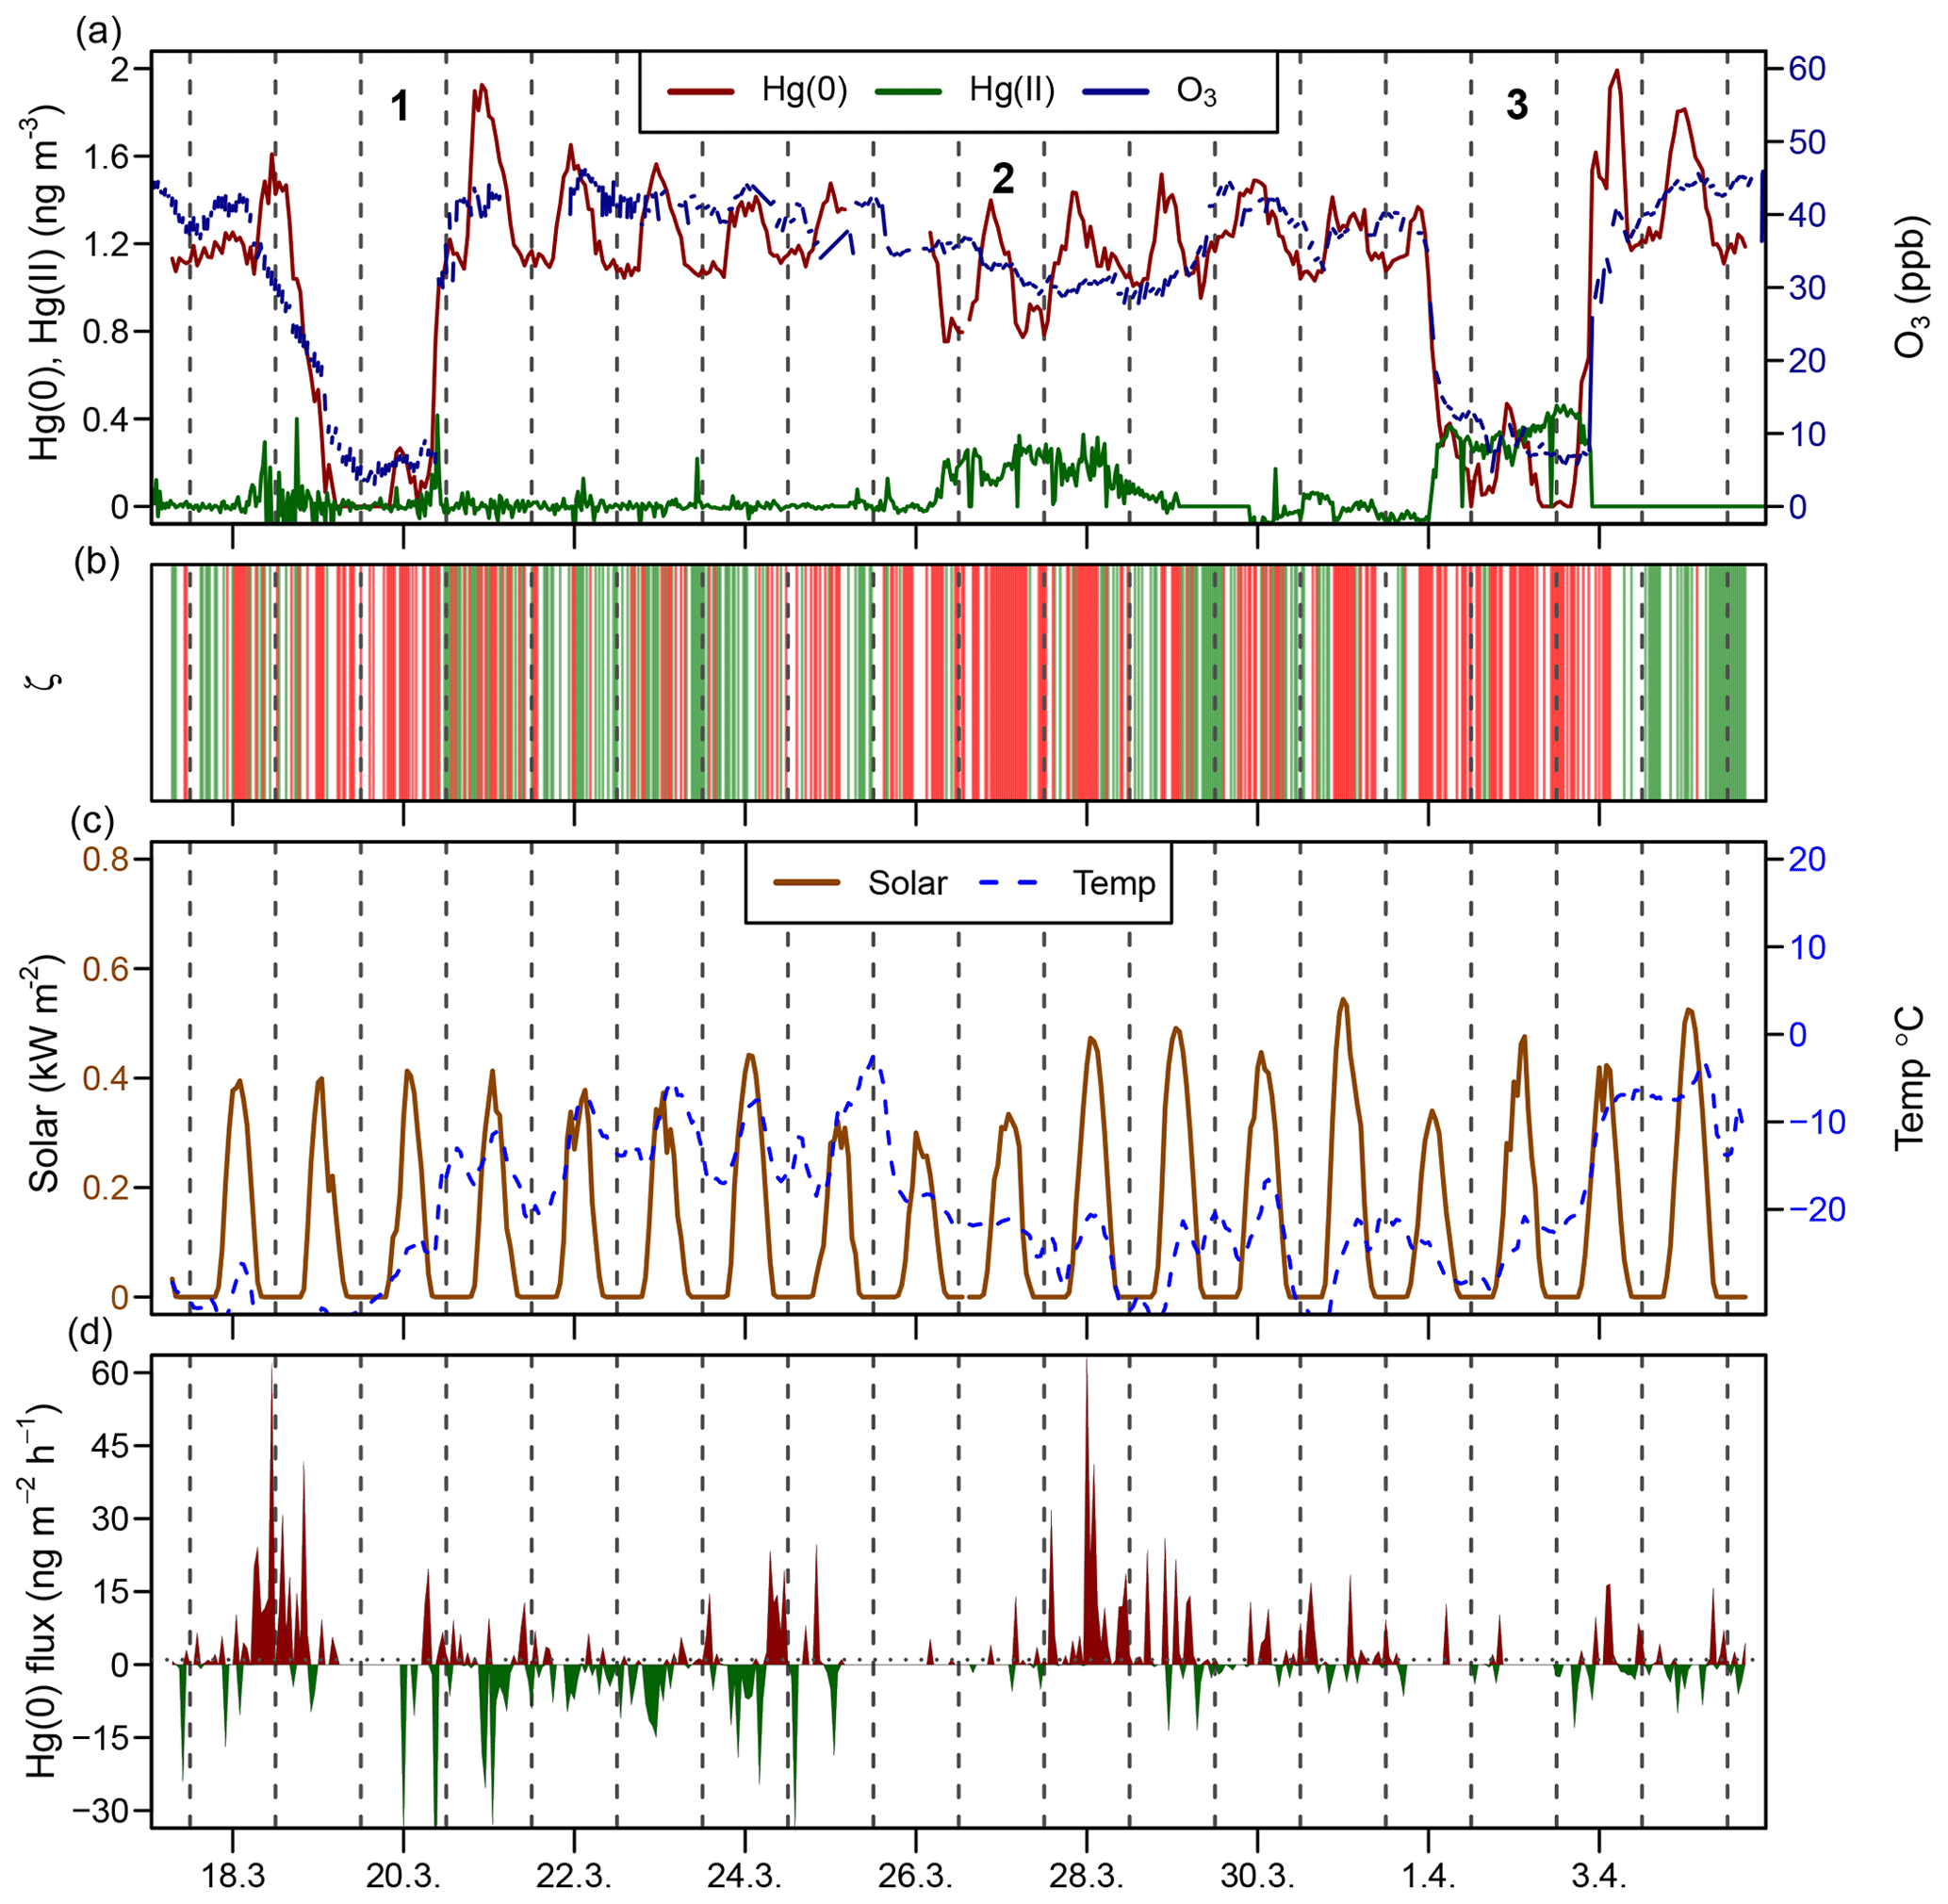
Figure 3Time series during the springtime AMDE period (18 March–4 April 2016) for (a) the atmospheric Hg(0) concentration (red), the atmospheric Hg(II) concentration (green), and the O3 mixing ratio (blue); (b) planetary boundary layer stability (ζ), where the shaded areas in green represent stable conditions (ζ>0.1) and shaded areas in red represent turbulent conditions (); (c) solar radiation and air temperature; and (d) Hg(0) flux, where Hg(0) deposition is shown using green and Hg(0) re-emission is shown using red. Midnight is indicated by dashed lines. Strong AMDEs when Hg(0) concentrations dropped (1, 3) or Hg(II) concentrations increased (2) are marked using numbers.
During the AMDE period (17 March–5 April 2016) an overall net Hg(0) re-emission (1.6±11 ng m−2 h−1, mean ± 1 SD, median = 0.28 ng m−2 h−1) was measured which peaked after the Hg(II) deposition, making the AMDE period the only time of the year when net Hg(0) re-emission occurred (Obrist et al., 2017). Strong Hg(0) re-emission from the snowpack has been reported during and after AMDEs due to the fast reduction of Hg(II) deposition (Johnson et al., 2008; Douglas et al., 2012).
Snowmelt occurred in May in 2016, during which the snow height declined rapidly between 7 May (24 cm) and 13 May (0 cm) and a small Hg(0) deposition possibly occurred ( ng m−2 h−1, mean ± 1 SD, median: 0.08 ng m−2 h−1). In contrast to wintertime patterns, the interstitial snow air Hg(0) during snowmelt showed low Δ199Hg values of −0.62 ‰ and −0.44 ‰ (n=2) versus −0.23 ‰ ± 0.06 ‰ in ambient Hg(0) (Fig. S3b). The negative Δ199Hg values in Hg(0) suggest a substantial contribution of Hg(0) re-emission after photoreduction of Hg(II) in snow, which exhibited negative Δ199Hg values with a minimum of −1.37 ‰ (Obrist et al., 2017). This observation is consistent with previous chamber experiments, where a negative Δ199Hg value of −2.08 ‰ was reported for Hg(0) re-emission from snow (Sherman et al., 2010).
Even-MIF (Δ200Hg) is considered to be unaffected by post-deposition processes such as re-emission (Sherman et al., 2010; Enrico et al., 2016), providing a conservative tracer for the pathway of atmospheric Hg deposition. Δ200Hg values measured in snow impacted by AMDEs at Toolik Field Station and other sites in Alaska (Obrist et al., 2017; Sherman et al., 2010, 2012a) are similar to the Δ200Hg values of atmospheric Hg(0) (Fig. 4) (−0.06 ‰ ± 0.06 ‰ versus −0.05 ‰ ± 0.04 ‰, mean ± 1 SD). This similarity can be explained by a quantitative oxidation of atmospheric Hg(0) to Hg(II) (e.g. event 1 in Fig. 3) that is deposited to snow. Thus, Hg(II) in snow inherits the isotopic composition of the source Hg(0) due to conservation of mass, irrespective of the isotopic fractionation factor associated with Hg(0) oxidation. Several samples exhibited Δ200Hg values between that of atmospheric Hg(0) and Hg(II) in precipitation measured in temperate regions (Fig. 4). This intermediate Δ200Hg signature can be explained by either AMDEs with non-quantitative oxidation due to limited Br oxidant availability (e.g. event 2 in Fig. 3), or a mixing of AMDE-derived Hg(II) with Hg(II) present in the overlying Arctic free troposphere. Even-MIF (Δ200Hg) has been suggested as a promising tracer to distinguish between atmospheric deposition of Hg(II) in precipitation, which exhibits positive Δ200Hg anomalies, and direct Hg(0) deposition (e.g. uptake by vegetation), which exhibits small negative Δ200Hg (Enrico et al., 2016; Sun et al., 2019). We caution that the presence of AMDEs complicates the use of Δ200Hg for mixing model-based Hg deposition calculations in the Arctic (Obrist et al., 2017).
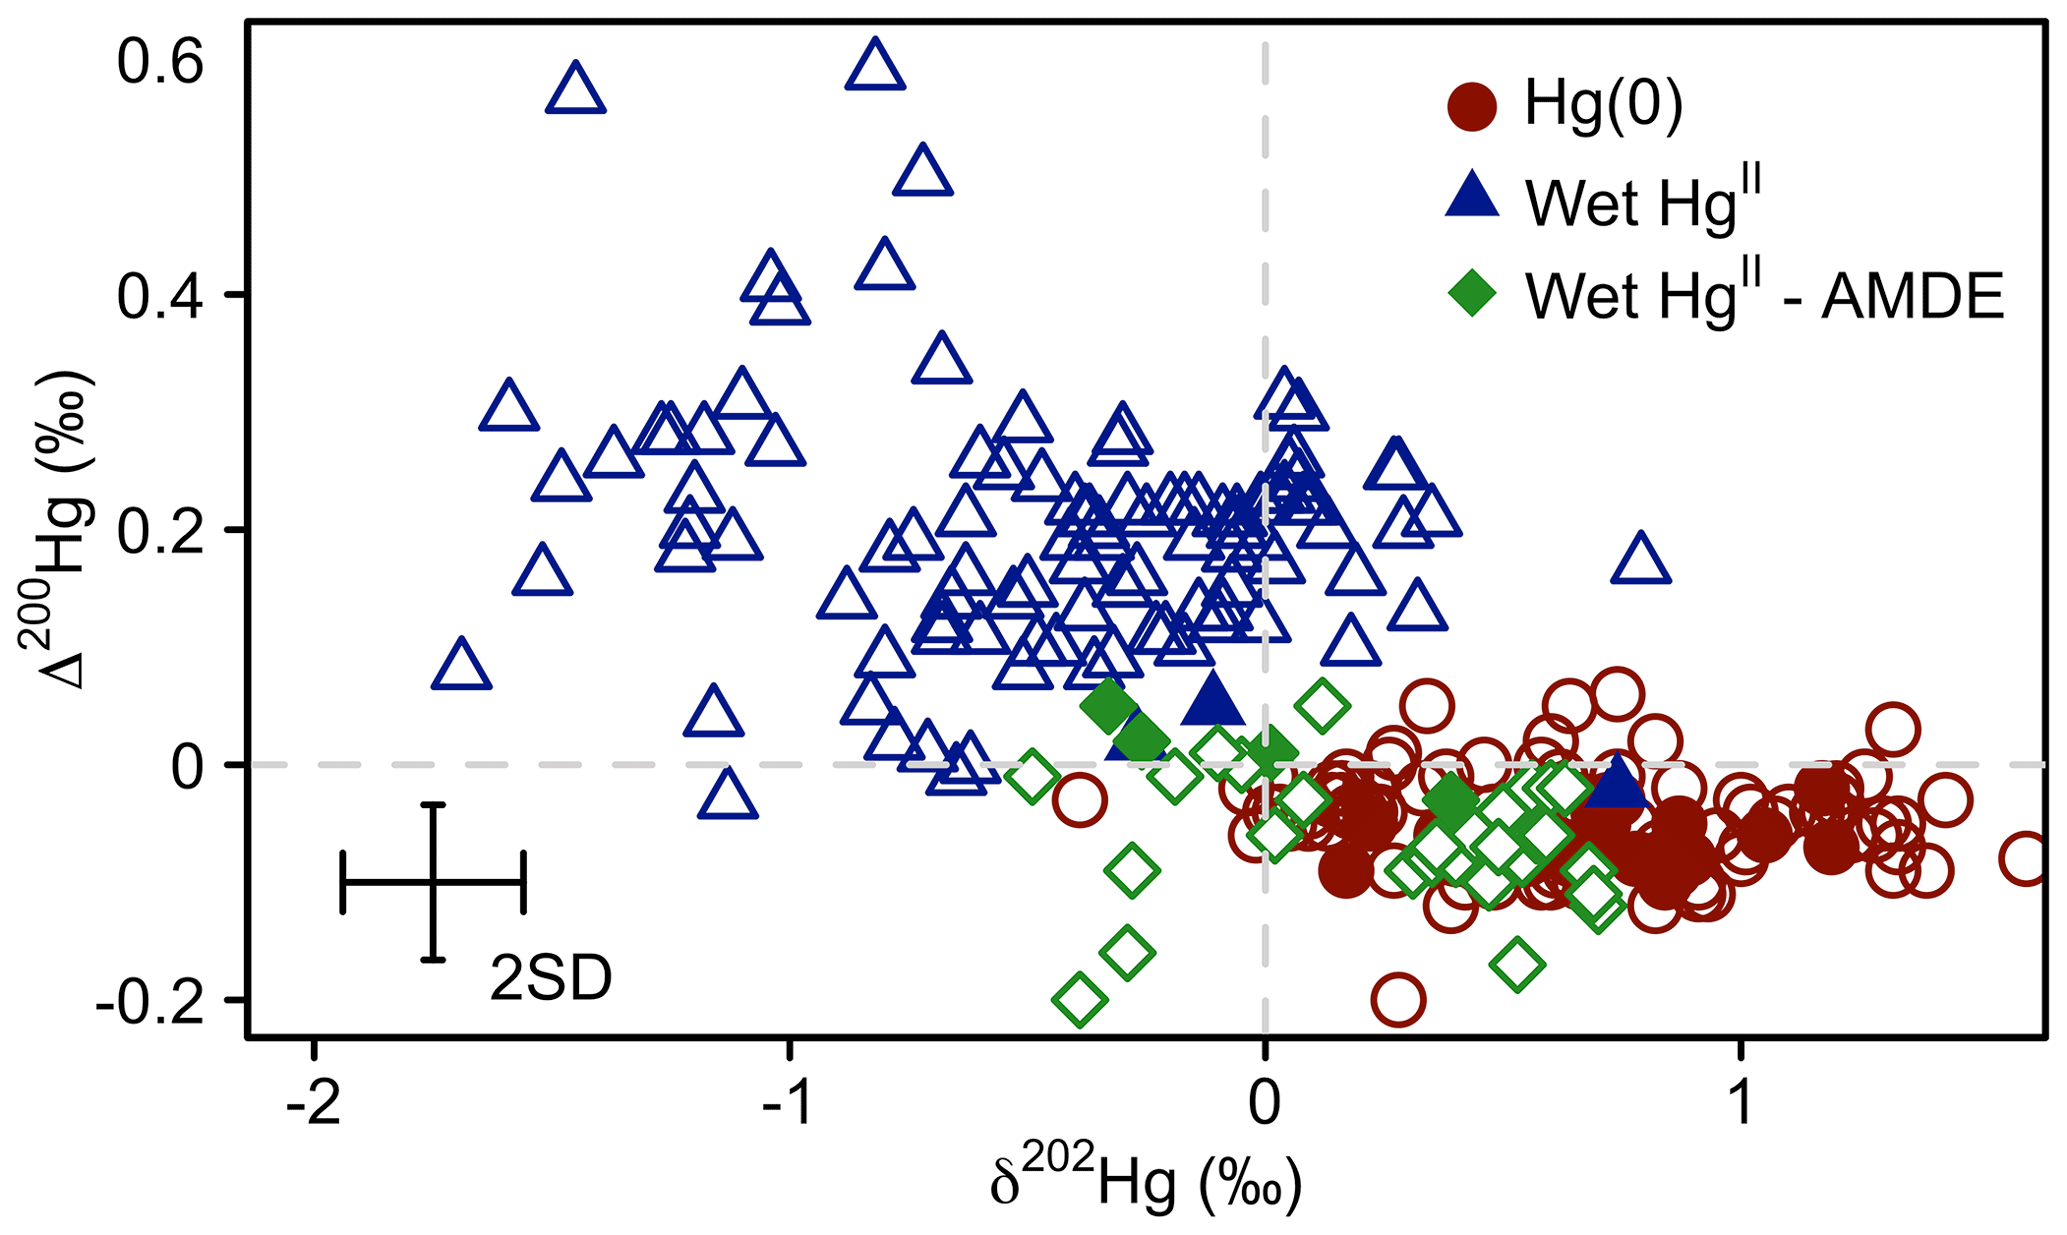
Figure 4Mass-dependent fractionation (δ202Hg) versus even mass-independent fractionation (Δ200Hg) of atmospheric Hg(0) (red circles), Hg(II) in wet deposition sampled at locations or during seasons when no AMDEs occurred (blue triangles), and Hg(II) in Arctic show sampled during the springtime AMDE season (green diamonds) for the Arctic tundra at Toolik Field Station (filled symbols), and reported from elsewhere (empty symbols). Atmospheric Hg(0) data are from Gratz et al. (2010), Demers et al. (2013, 2015), Fu et al. (2016a), Enrico et al. (2016), and Obrist et al. (2017); Hg(II) in wet deposition are from Demers et al. (2013), Sherman et al. (2015), Chen et al. (2012), and Gratz et al. (2010); and Hg(II) in snow from AMDEs are from Obrist et al. (2017) and Sherman et al. (2010, 2012a). Error bars represent the analytical precision determined by the 2 SD from multiple measurements of an in-house standard.
3.3 Summer
3.3.1 Drivers of diel cycling in atmospheric Hg(0)
Figure 5 represents a time series of the atmospheric Hg(0) concentration, the CO2 mixing ratio, the PBL stability, and Hg(0) fluxes during midsummer (15–28 July 2016). Atmospheric Hg(0) concentrations generally declined during each night, and the strongest Hg(0) depletions (Hg(0) <1 ng m−3) were observed when the PBL was stable (ζ>0.1, events 2 and 3 and green bars in Fig. 5b). These Hg(0) night-time minima coincided with maxima of atmospheric CO2 mixing ratios of 410 to 420 ppm. These patterns are consistent with measured Hg(0) deposition fluxes during nights (daily minima at 00:00, ng m−2 h−1 (mean ± 1 SD), Fig. 1i), under corresponding CO2 accumulation in the PBL driven by night-time CO2 soil respiration (Wofsy et al., 1993; Schlesinger and Andrews, 2000; Grant and Omonode, 2018). On nights with unstable PBL conditions (e.g. event 1 in Fig. 5), diel Hg(0) and CO2 variations were lower or absent due to increased mixing with free tropospheric air containing background levels of Hg(0) and CO2. During late summer (Fig. S4, 20–31 August 2016), the longer duration of stable nocturnal PBL conditions led to even more pronounced night-time depletions in Hg(0). During daytime under strong solar radiation, flux measurements showed a net Hg(0) emission around noon (daily maxima at 11:00, 2.9±0.92 ng m−2 h−1, mean ± 1 SD, Fig. 1i). Daytime Hg(0) re-emission, however, did not lead to a build-up of atmospheric Hg(0) above the surface due to prevailing turbulent conditions, allowing for the efficient mixing with background free tropospheric air. These patterns demonstrate how atmospheric Hg(0) and CO2 are both controlled by the magnitude and direction of the net ecosystem exchange fluxes in conjunction with the PBL stability. Overall, flux measurements showed the tundra ecosystem to be a net sink of atmospheric Hg(0) over the duration of the growing season ( ng m−2 h−1 – mean ±1 SD, median: −1.2 ng m−2 h−1).
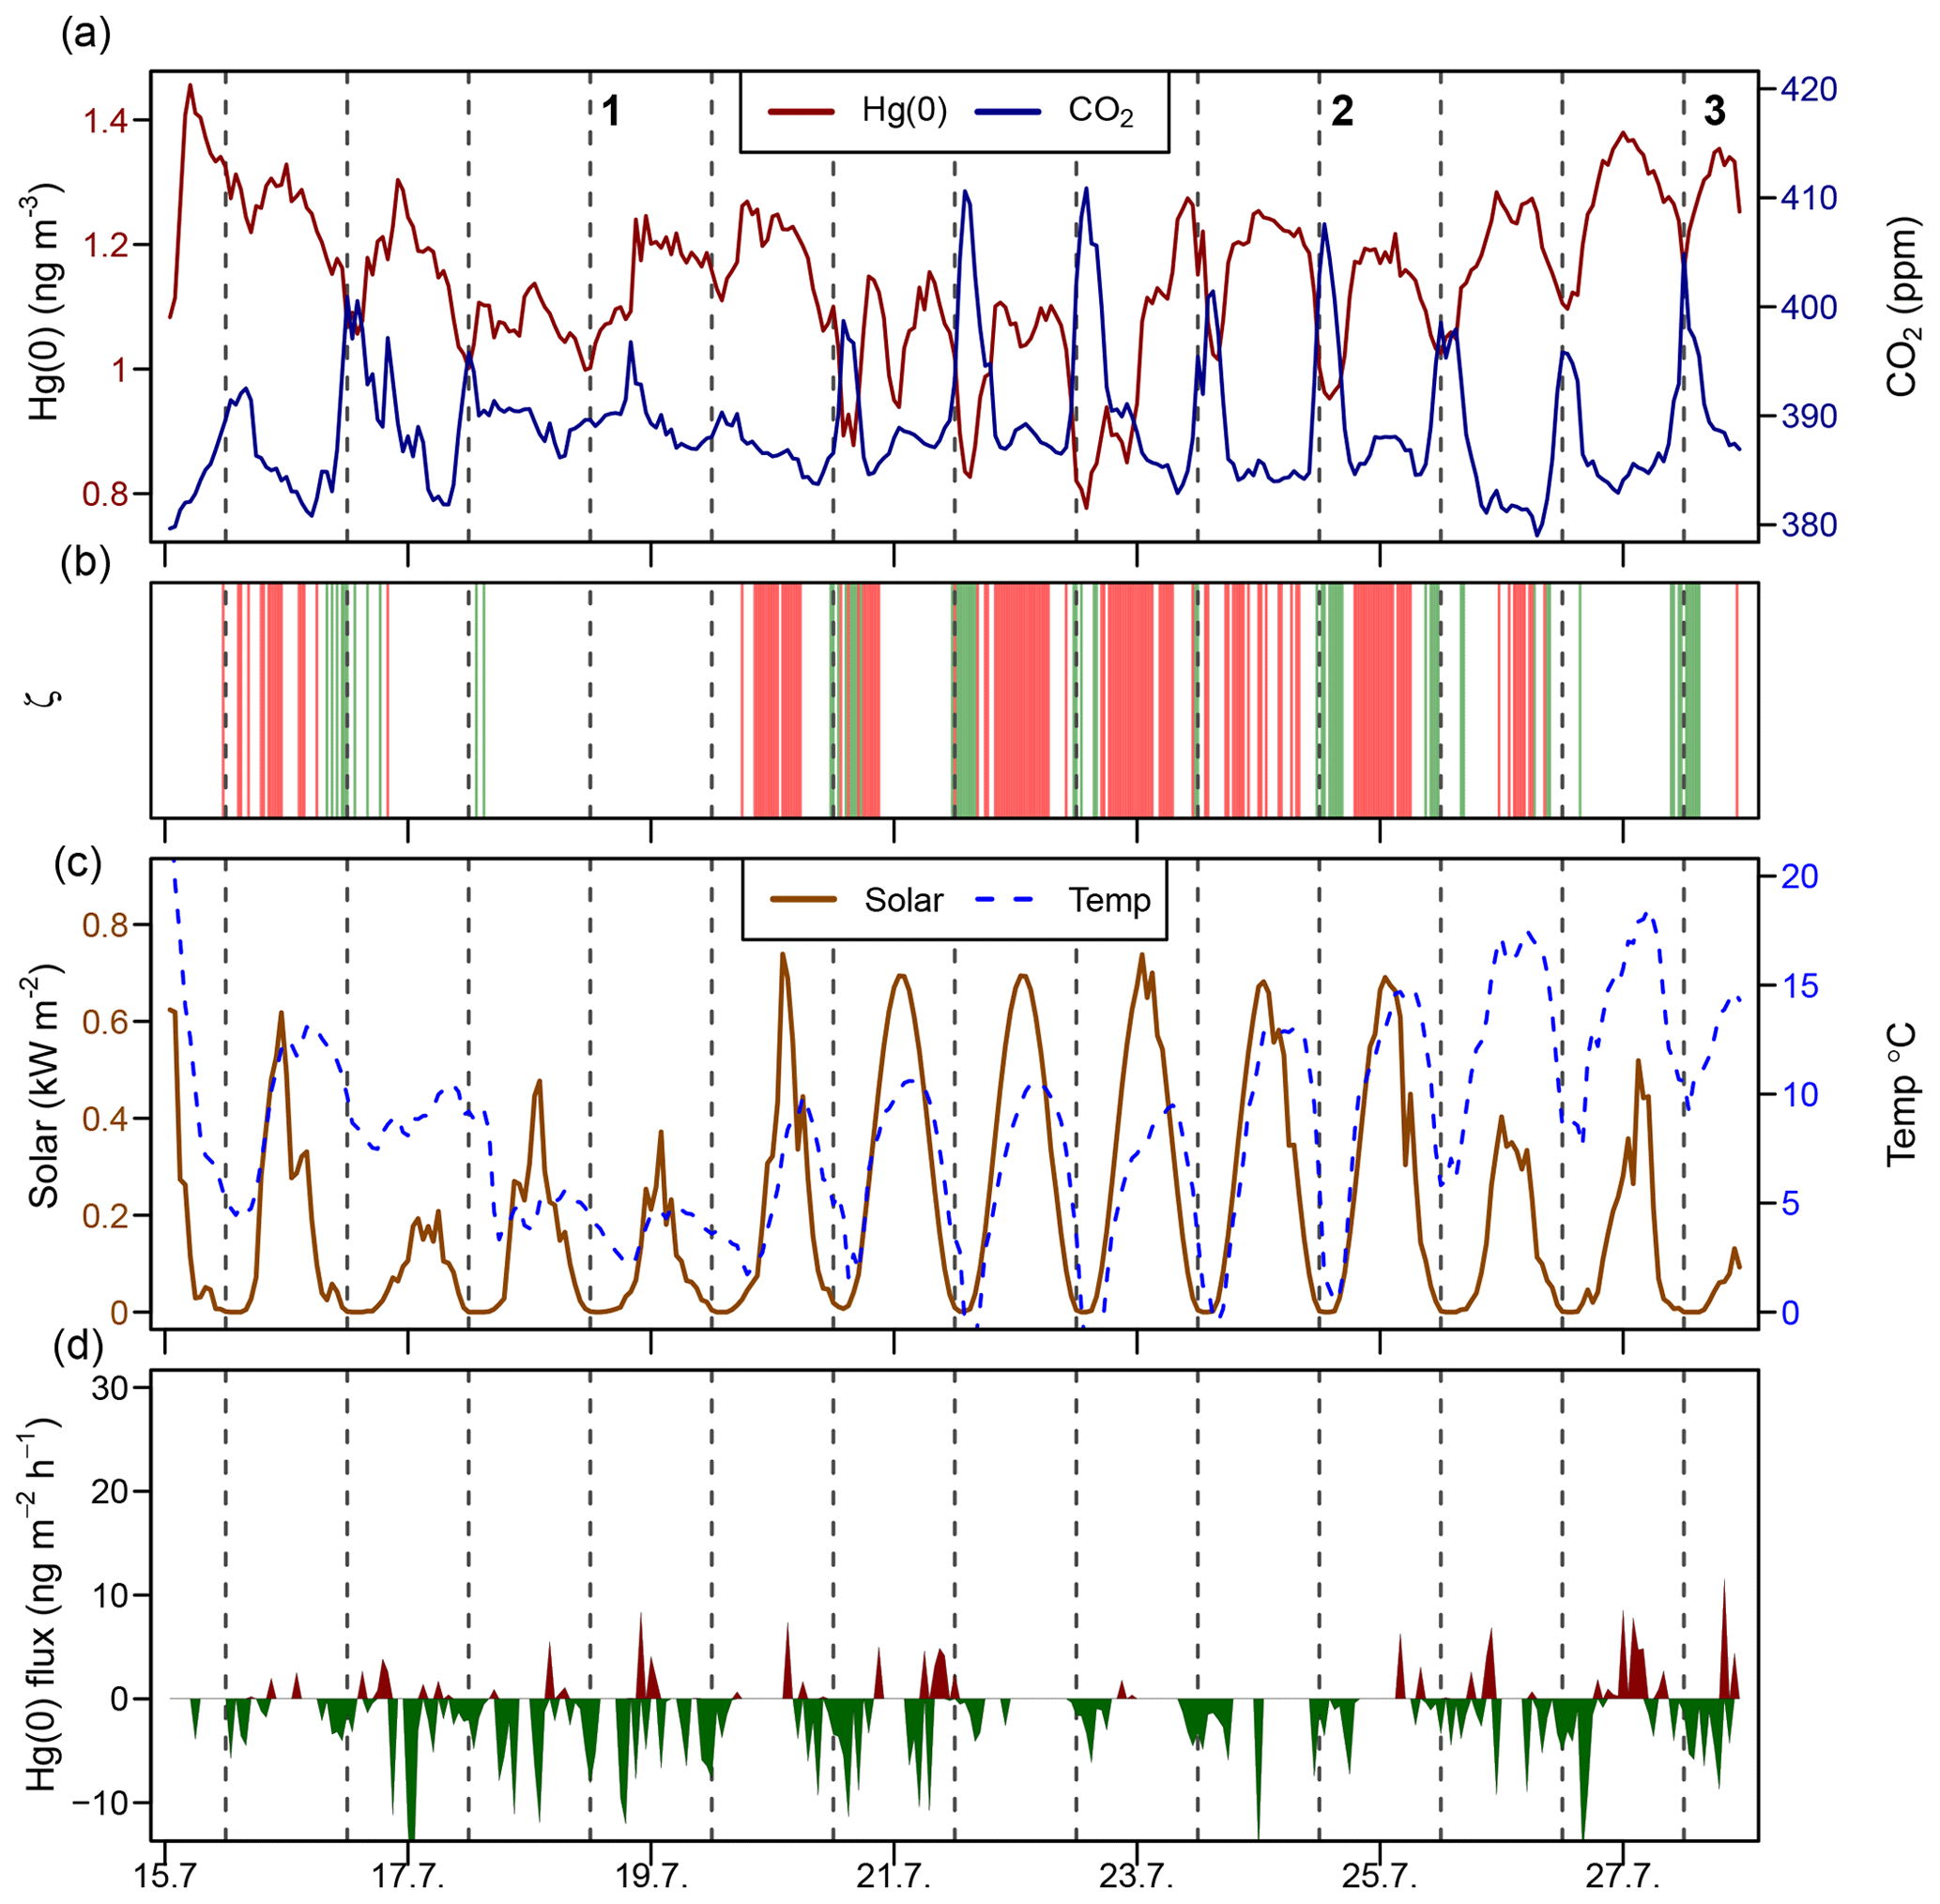
Figure 5Time series during a midsummer period (15–28 July 2016) of the (a) atmospheric Hg(0) concentration and CO2 mixing ratio; (b) median planetary boundary layer stability (ζ), where the shaded areas in green represents stable conditions (ζ>0.1) and shaded areas in red represent turbulent conditions (); (c) solar radiation and air temperature; and (d) Hg(0) flux, with Hg(0) deposition in green and Hg(0) re-emission in red. Midnight is indicated by dashed lines.
3.3.2 Hg isotope fractionation during foliar uptake of atmospheric Hg(0)
Figure 6 shows a scatterplot of atmospheric Hg(0) concentrations and the δ202Hg values sampled during different times of the day in summer 2016. Hg(0) sampled during the night was characterised by lower Hg(0) concentrations (1.06±0.13 ng m−3), higher δ202Hg (1.31 ‰ ± 0.15 ‰), and similar Δ199Hg values (−0.28 ‰ ± 0.08 ‰) (22:00–06:00, mean ± 1 SD, n=4), compared with Hg(0) sampled during the day (Hg(0) = 1.16±0.11 ng m−3, p=0.001; δ202Hg = 0.95 ‰ ± 0.22 ‰, p=0.01; Δ199Hg = −0.26 ‰ ± 0.05 ‰, p=0.70, mean ± 1 SD, 06:00–22:00, n=2; 24 h, n=4; p values based on two-sided t tests). An enrichment of heavy atmospheric Hg(0) isotopes during the night is consistent with the preferential uptake of light Hg(0) isotopes by vegetation (Demers et al., 2013; Enrico et al., 2016; Obrist et al., 2017; Olson et al., 2019; Yuan et al., 2018; Yu et al., 2016), which is the dominant Hg(0) deposition pathway at the study site (Obrist et al., 2017). Attributing the diurnal concentration and δ202Hg variation of Hg(0) to vegetation uptake, we calculated an enrichment factor of vegetation uptake, ε202Hgvegetation uptake, of −4.22 ‰ ± 1.01 ‰ (mean ± 1 SE, R2=0.68, p=0.003) (Fig. S5) using a Rayleigh model. Enrico et al. (2016) estimated an ε202Hgplant−air of −2.6 ‰ for foliar uptake by sphagnum moss, using a Rayleigh model to fit the atmospheric Hg(0) concentration and δ202Hg measured at two locations, a mountain site unaffected by local terrestrial–atmosphere exchange and a peat bog where Hg(0) in air was depleted by foliar uptake. Similarly, observations of the difference in δ202Hg between plants and atmospheric Hg(0) suggested a ε202Hgplant−air value between −1 and −3 ‰ (Demers et al., 2013; Enrico et al., 2016; Obrist et al., 2017; Olson et al., 2019; Yuan et al., 2018; Yu et al., 2016).
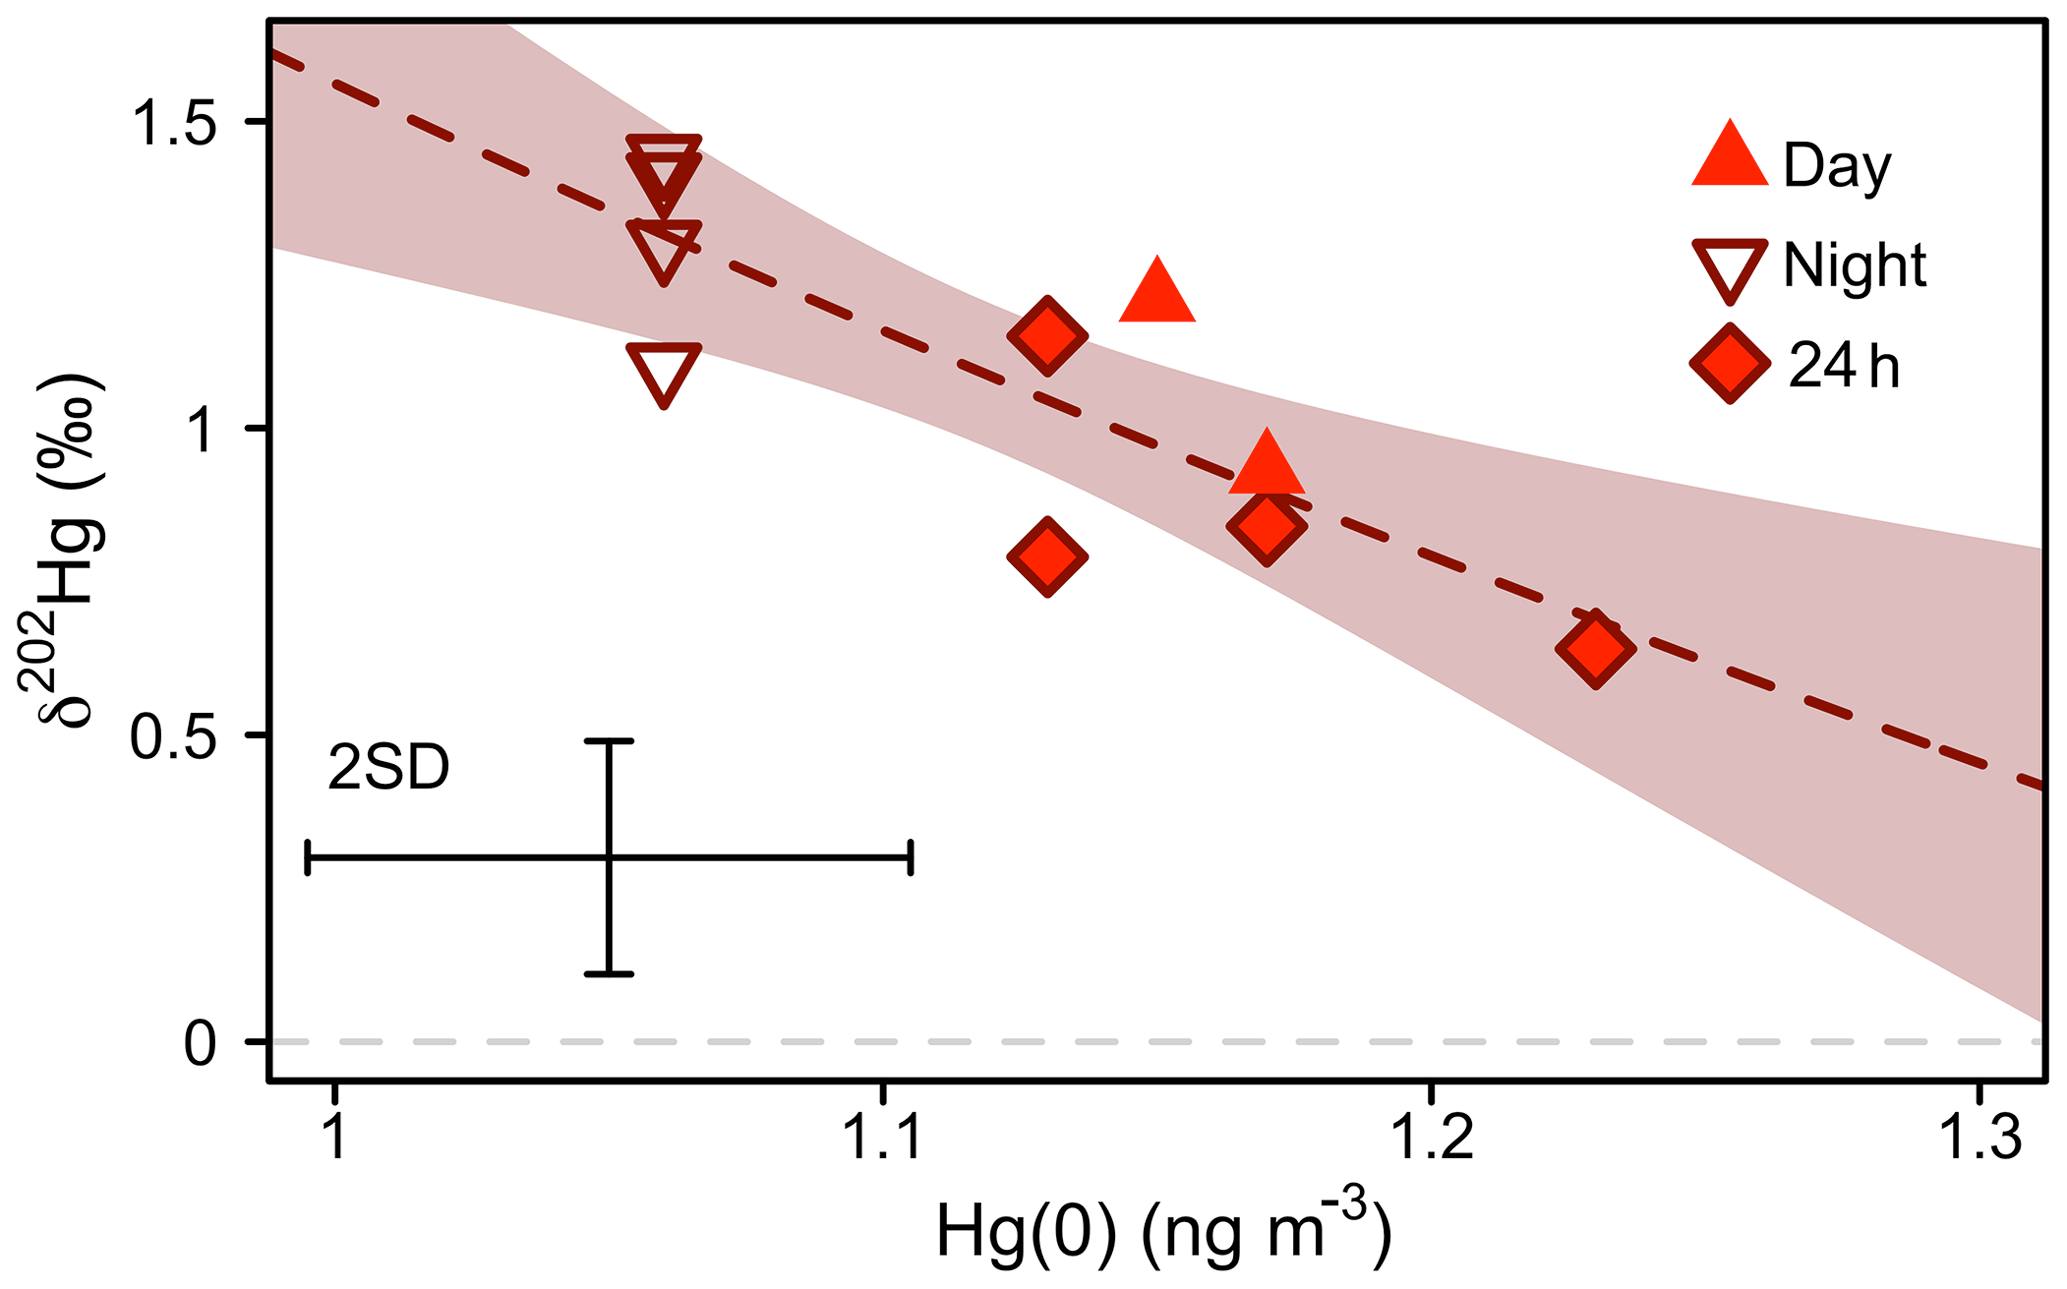
Figure 6Mass-dependent Hg isotope signature (δ202Hg) of atmospheric Hg(0) versus Hg(0) concentration during the snow-free growing period (11 June–10 September 2016). The dashed line represents a non-linear Rayleigh fit and the shaded area is the 95 % confidence interval (see main text). Error bars represent the analytical precision determined by the 2 SD from multiple measurements of an in-house standard.
At Toolik Field Station, the difference between δ202Hg in vegetation relative to atmospheric Hg(0) was also considerably lower (range of −1.29 ‰ to −2.09 ‰, depending on vegetation species; Olson et al., 2019) than the fractionation factor derived from the atmospheric pattern. This discrepancy can be explained by the fact that δ202Hg signatures measured in vegetation not only reflect the isotopic fractionation during foliar uptake, but also contain a re-emission component. Hg(II) reduction is expected to lead to more positive δ202Hg values in the residual, foliar Hg(II) fraction, irrespective of the reduction mechanism (Bergquist and Blum, 2007; Zheng and Hintelmann, 2010; Kritee et al., 2007; Jiskra et al., 2015). Re-emission of foliar Hg is supported by the observed negative shifts in odd-mass isotope MIF (Δ199Hg) in vegetation relative to Δ199Hg of atmospheric Hg(0), which have been observed at Toolik Field Station (Olson et al., 2019) and elsewhere (Enrico et al., 2016; Demers et al., 2013). Positive Δ199Hg in atmospheric Hg(0) re-emitted from foliage has recently been constrained by flux bag experiments (Yuan et al., 2018). Therefore, it is expected that the fractionation factor of foliar uptake is larger than just the difference between δ202Hg in foliage and Hg(0) in the atmosphere. Instead, the difference reflects a net fractionation consisting of the isotopic fractionation during foliar uptake, as well as during foliar reduction and re-emission. Our observation that the fractionation factor derived from δ202Hg of atmospheric Hg(0) (Fig. 6) is larger than the difference of δ202Hg between vegetation and the atmosphere could also be associated with the diel variation of Hg(0) fluxes and PBL dynamics. During daytime, atmospheric turbulence is higher and, therefore, local signals of terrestrial re-emission are expected to be diluted by mixing with background Hg(0). At night, when the PBL is stable, foliar uptake of lighter Hg(0) isotopes is imprinted on the residual atmospheric Hg(0).
3.3.3 Sink of Hg(0) in soil inferred from Hg stable isotopes
At our study site, soil pore air Hg(0) concentrations were below ambient levels measured in the atmosphere all year (Obrist et al., 2017), with an average concentration of 0.54±0.14 ng m−3, indicating a consistent sink of Hg(0) in soils. Hg(0) in soil pore air showed a lower δ202Hg (−0.01 ‰ ± 0.39 ‰) and a higher Δ199Hg (−0.18 ‰ ± 0.07 ‰) (mean ± 1 SD, n=3) compared with ambient atmospheric Hg(0) (Hg(0) = 1.1±0.09 ng m−3, p=0.001, δ202Hg = 0.81 ‰ ± 0.18 ‰, p=0.057, Δ199Hg = −0.25 ‰ ± 0.04 ‰, p=0.27; 24 h, mean ± 1 SD, p value of two-sided t test, n=6) during the summer and fall periods, when we were able to quantify soil pore air isotope patterns. Fitting the Hg stable isotope fractionation trajectory for MDF and MIF of three data points of soil pore air samples and the atmospheric Hg(0) samples resulted in enrichment factors of ε202Hg ‰ ± 0.25 ‰ (mean ± 1 SE, R2=0.69, p=0.005; Fig. 7a) and E199Hg ‰ ± 0.04 (mean ± 1 SE, R2=0.32, p=0.11; Fig. 7b). Recently, (Zheng et al., 2018) investigated Hg stable isotope fractionation during the oxidation of dissolved Hg(0) by low molecular weight thiol compounds and natural humic acids (HAs). For oxidation by HAs, they reported an enrichment of light Hg(0) isotopes (ε202Hg ‰ ± 0.05 ‰, mean ± 1 SE) and a positive odd-mass Hg MIF (E199Hg ‰ ± 0.03 ‰, mean ± 1 SE) in the residual Hg(0) fraction (Zheng et al., 2018). Our limited number of soil air measurements (n=3) agree with the fractionation trajectory for HA oxidation (red straight lines in Fig. 7), suggesting abiotic oxidation in soils as a cause of the observed soil Hg(0) uptake. In spite of a consistent soil Hg(0) sink in soils, Obrist et al. (2014) estimated that the soil Hg(0) sink results in small Hg(0) fluxes ( ng m−2 h−1) due to low diffusivity. Comparing the soil Hg(0) uptake flux reported by Obrist et al. (2014) to the net ecosystem flux measured at Toolik Field Station, we estimate that such a soil Hg(0) sink would only account for <5 % of the total Hg(0) deposition. Soil air δ202Hg is enriched in light isotopes relative to wintertime atmospheric Hg(0), whereas interstitial snow air Hg(0) is enriched in heavier isotopes, in the opposite direction of soil air (Fig. 8), suggesting that soil uptake of Hg(0) has a minor effect on interstitial Hg(0) patterns in the snowpack above.
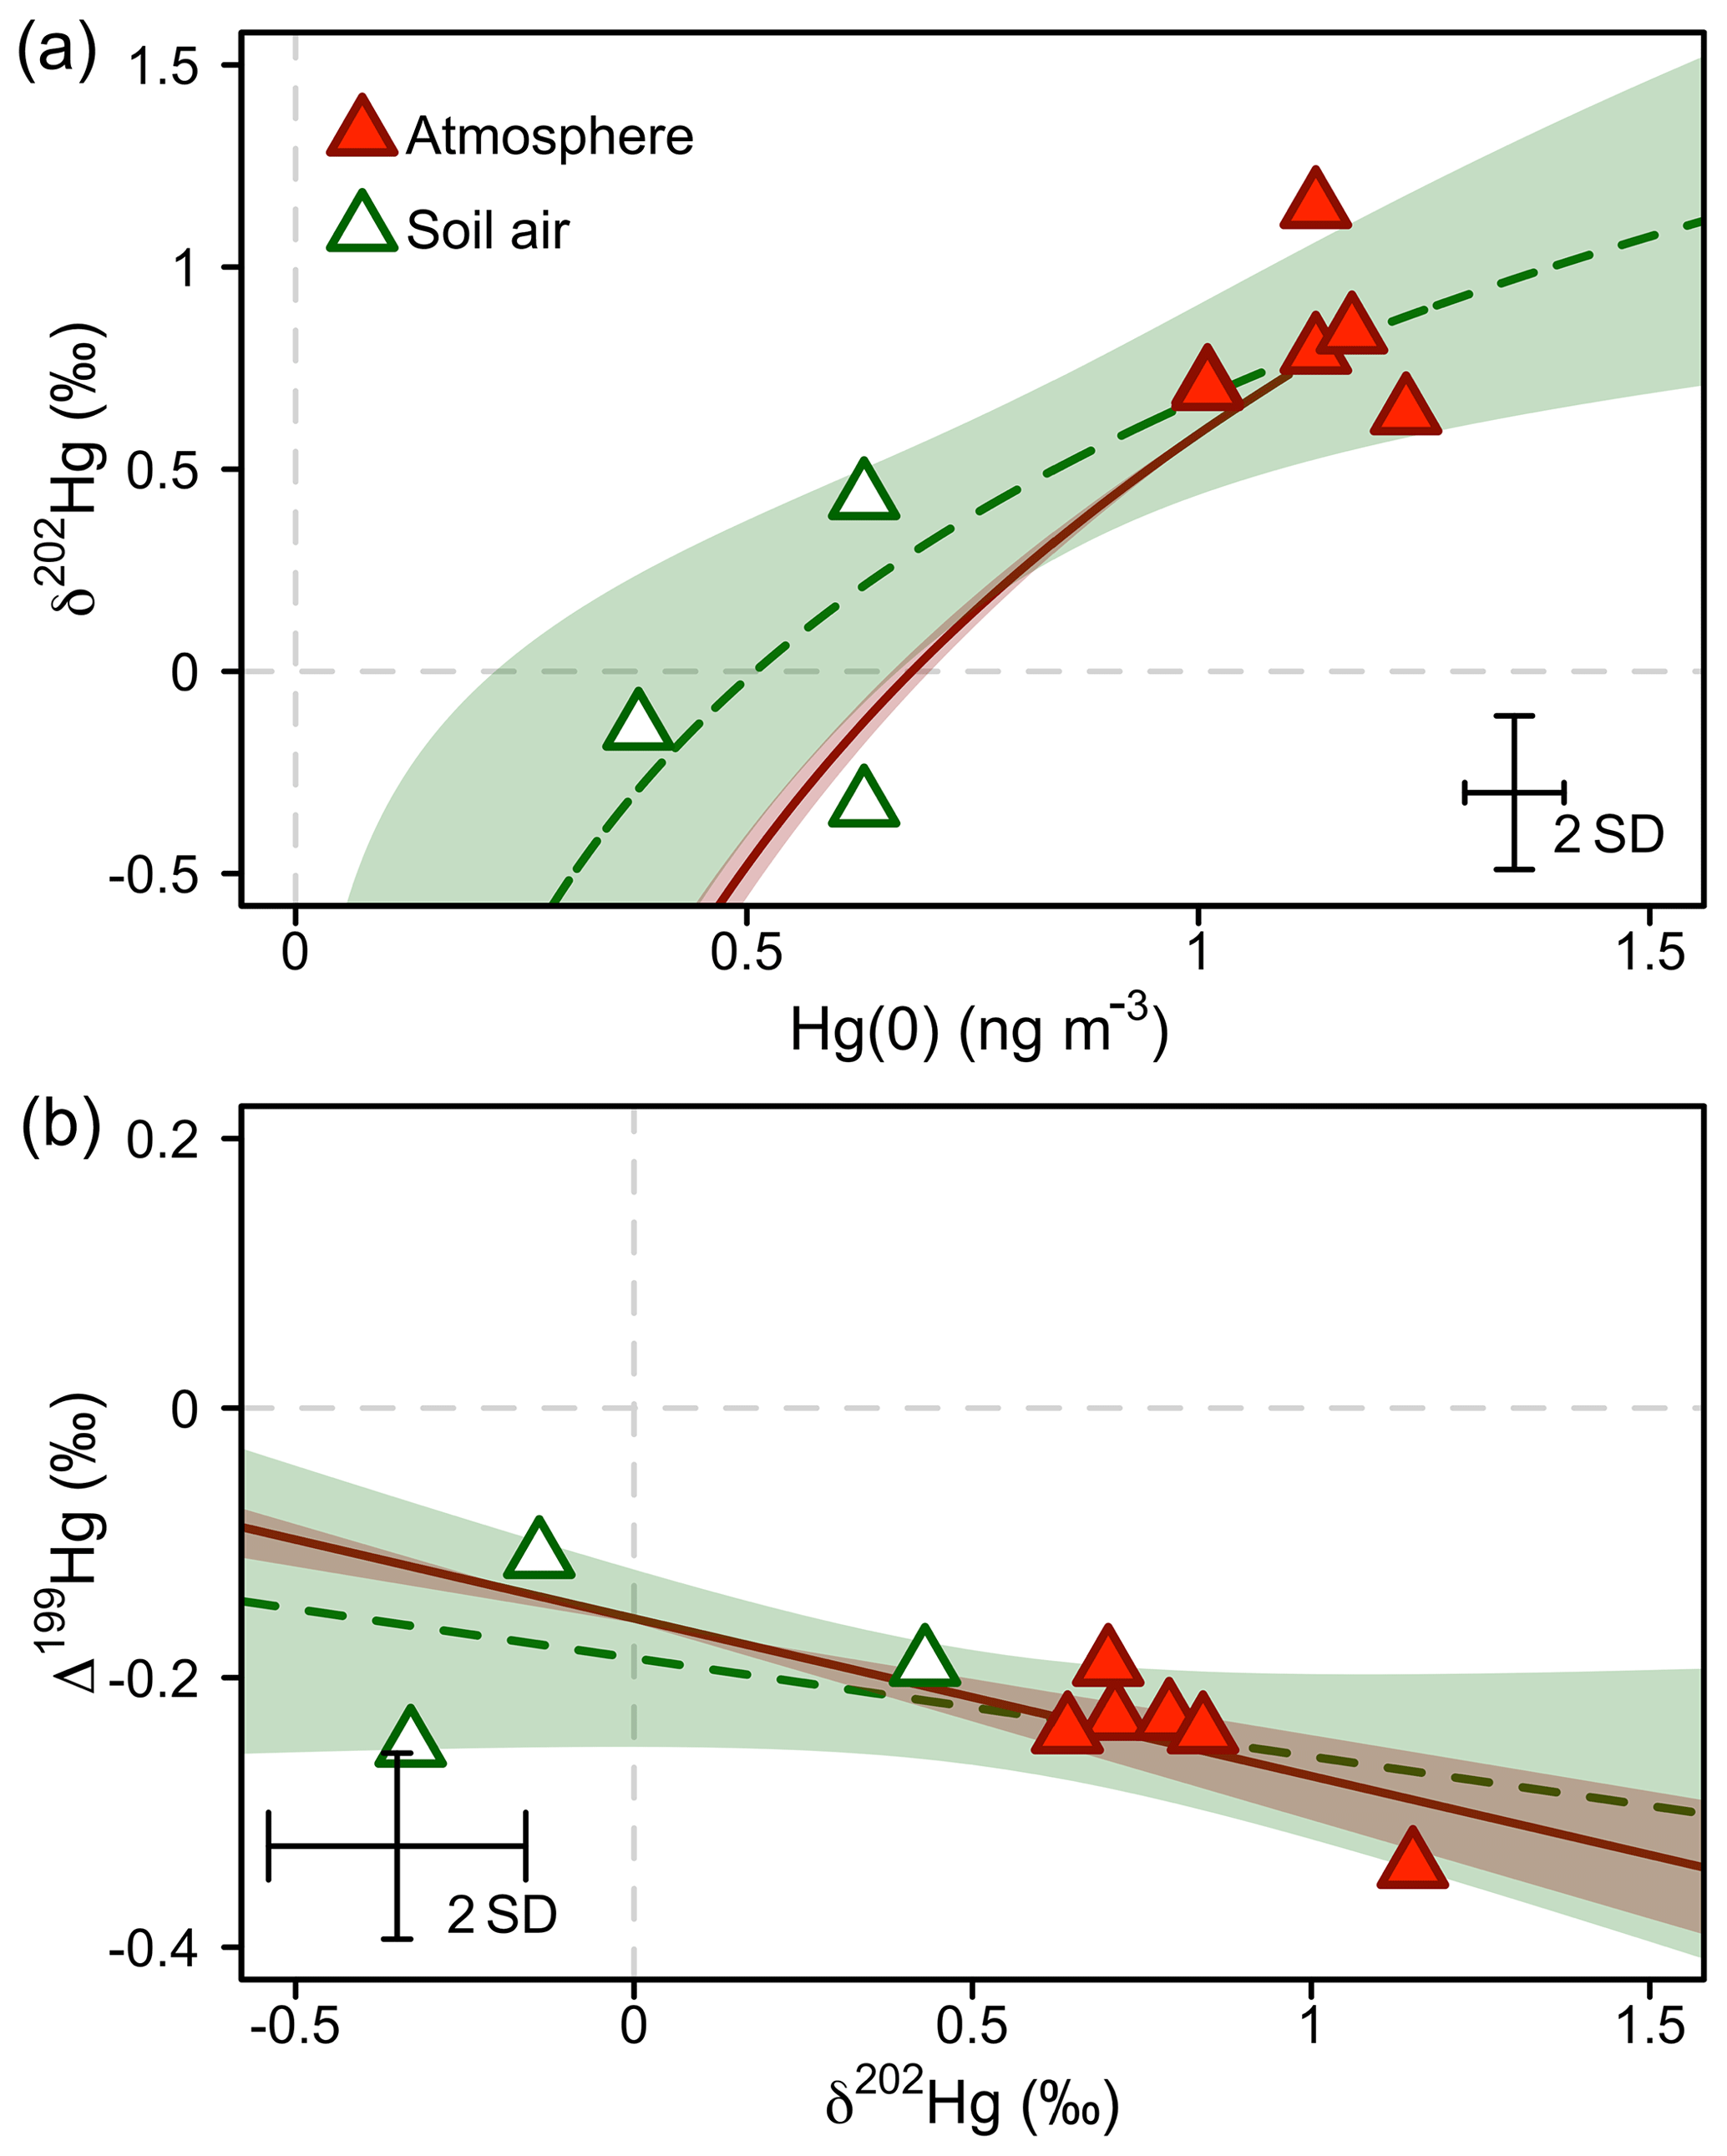
Figure 7Hg stable isotope systematics of Hg(0) in the atmosphere during summer/fall and in soil pore air measured during the same time period. (a) Mass-dependent Hg isotope signature (δ202Hg) against Hg(0) concentration. (b) Mass-independent Hg isotope signature (Δ199Hg) against mass-dependent Hg isotope signature (δ202Hg). The dashed green lines represent the regression of a Rayleigh model (a) and a linear model (b). The straight red lines represent the trajectories for abiotic dark oxidation of Hg(0) by natural humic acids (HAs) from Zheng et al. (2018). For comparison with observations, the intercept of the linear regressions was adjusted to fit through the average of atmospheric Hg(0). The shaded areas represent the 95 % confidence interval. Error bars represent the analytical precision determined by the 2 SD from multiple measurements of an in-house standard.
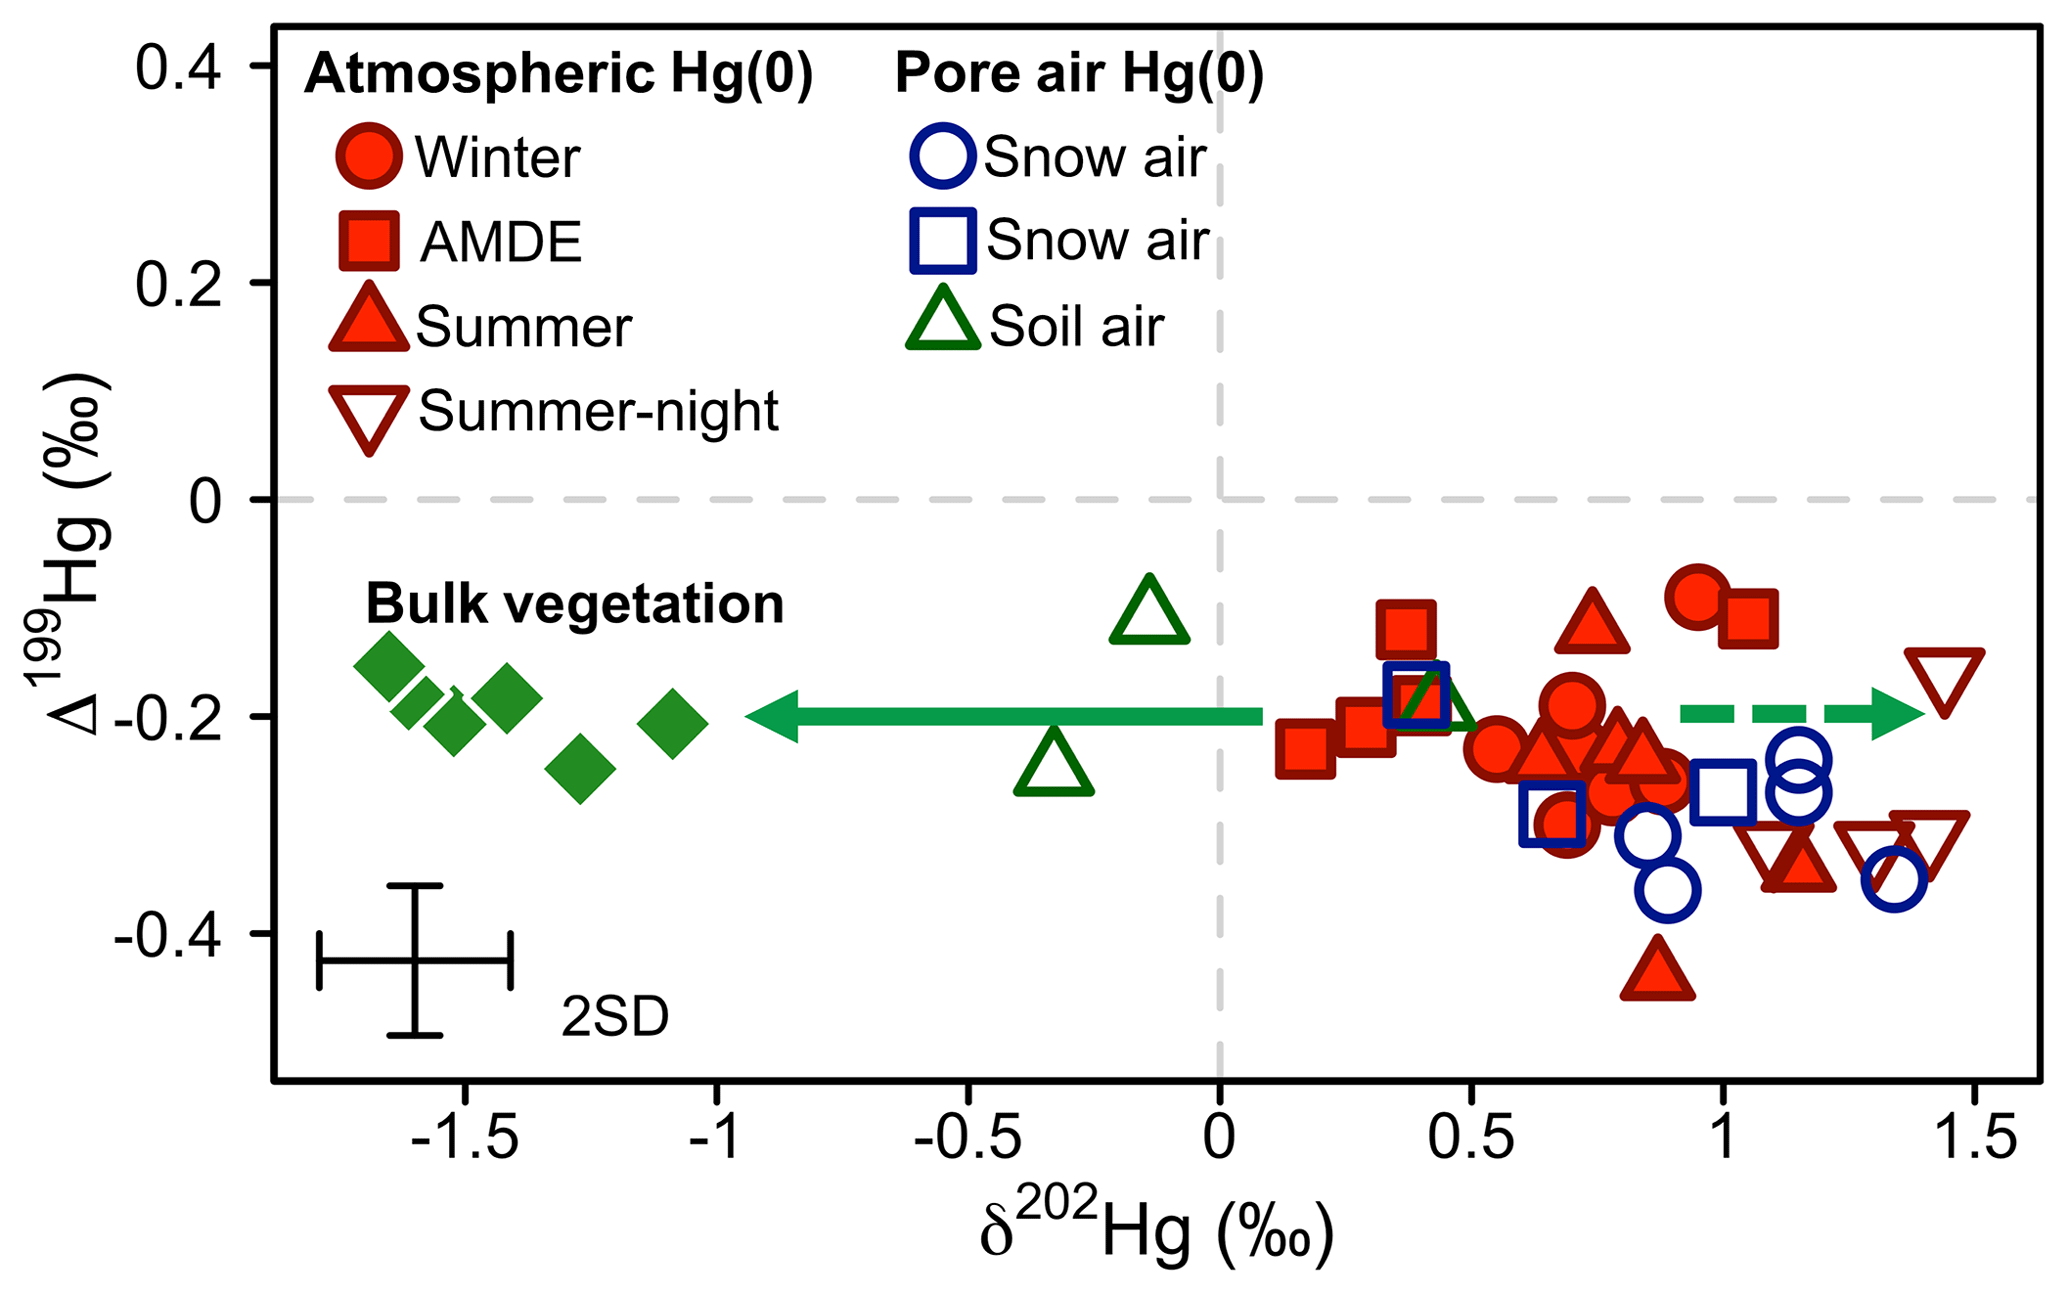
Figure 8Overview of the mass-independent Hg isotope signature (Δ199Hg) against the mass-dependent Hg isotope signature (δ202Hg) of atmospheric Hg(0) (red) and Hg(0) in the pore air of snow (blue) and soil (green) during winter (circles), the AMDE season (squares), and summer/fall (triangles). Bulk vegetation measurements (green diamonds) are reproduced from Obrist et al. (2017). The straight arrow represents the fractionation during Hg(0) uptake by vegetation, and the dashed arrow represents the expected development of the corresponding residual Hg(0) pool. Error bars represent the analytical precision determined by the 2 SD from multiple measurements of an in-house standard.
We document that the concentrations and the isotopic composition of atmospheric Hg(0) are strongly affected by terrestrial–atmosphere exchange, in particular by vegetation uptake, of Hg(0). While directions and magnitudes of the terrestrial–atmosphere exchange vary with season and time of the day, atmospheric stability and the dynamics of the PBL strongly affect atmospheric Hg(0) concentrations. During the vegetation period, atmospheric Hg(0) isotope systematics were dominated by vegetation uptake of Hg(0) discriminating heavy Hg(0) isotopes in the residual atmospheric pool, which manifested itself most strongly during stable PBL conditions at night. We found a larger discrimination of heavier Hg(0) isotopes during foliar uptake when deriving a fractionation factor from atmospheric Hg(0) observations, compared with deriving this factor based on the difference measured between bulk Hg in vegetation and atmospheric Hg(0). While this discrepancy is not fully understood, it may be attributed to photoreduction and re-emission of lighter Hg(0) isotopes during the day. Hg(0) concentrations were continuously depleted in interstitial snow and soil pore air. Hg stable isotope measurements of Hg(0) in soil air indicated that the soil Hg(0) sink was driven by Hg(0) oxidation by natural organic matter. However, we observed no isotopic traces of this Hg(0) soil sink in interstitial snow air and the atmosphere above and concluded that soil uptake of Hg(0) made only a minor contribution to the net ecosystem exchange of Hg(0). Based on the stable isotope signatures of Hg(0) in soil and snow pore air and mass balance considerations, we infer that the uptake of Hg(0) by ground vegetation and/or litter on the soil surface was likely responsible for Hg(0) deposition during the winter months. The combination of stable isotope fingerprints with Hg(0) flux measurements and PBL stability assessment confirmed a dominant role of Hg(0) uptake by vegetation in Arctic tundra Hg cycling.
Atmospheric temperatures have increased twice as fast in the Arctic as in temperate regions over the last 2 decades (Cohen et al., 2014). The increase in Arctic temperatures has been accompanied by an earlier snowmelt in spring and, thus, a longer vegetation period and higher maximal greenness of Arctic vegetation (Box et al., 2019). Vegetation uptake is estimated to currently drive the deposition of 210 Mg Hg a−1 of atmospheric Hg(0) to the Arctic tundra (Obrist et al., 2017; Sonke et al., 2018). With an ongoing warming and greening trend associated with climate change, an amplification of the Arctic tundra Hg(0) vegetation pump can be expected. Contrarily, higher soil temperatures, leading to permafrost thaw and degradation and development of thermokarsts, increase the risk of the re-mobilisation of large amounts of Hg that is currently stored in Arctic tundra soils (St. Pierre et al., 2018; Olson et al., 2018; Schuster et al., 2018). The net effect of these complex alterations in Arctic Hg cycling driven by climate change is currently poorly understood and the risk needs to be assessed.
Hg stable isotope data are available in the Supplement. Metadata and atmospheric concentration data are available from the NSF Arctic Data Center (urn:uuid:e58b2369-0701-4dac-b3c6-b8e15a0cd187, https://arcticdata.io/catalog/view/urn:uuid:e58b2369-0701-4dac-b3c6-b8e15a0cd187, last access: 16 October 2019; Helmig et al., 2018). Flux data are available from Daniel Obrist (daniel_obrist@uml.edu) upon request.
The supplement related to this article is available online at: https://doi.org/10.5194/bg-16-4051-2019-supplement.
MJ conceived the study and led the Hg stable isotope sampling and analysis with support from JES and DO. YA led the data analysis of flux data. MJ wrote the paper with input from all authors.
The authors declare that they have no conflict of interest.
We thank Toolik Field Station and Polar Field Services staff for their support in setting up the field site and maintaining its operation for 2 years, with special thanks to Jeb Timm. We thank Christine L. Olson, Dominique P. Colgrove, Jacques Hueber, and Christopher W. Moore for assistance in the field and Jerome Chmeleff for support with Hg stable isotope measurements. The authors gratefully acknowledge the NOAA Air Resources Laboratory (ARL) for the provision of the HYSPLIT transport and dispersion model and READY website (http://www.ready.noaa.gov, last access: 5 August 2019) used in this publication.
This research has been supported by the Swiss National Science Foundation (grant no. PZ00P2_174101), the H2020 European Research Council (MEROXRE; grant no. 657195), the US National Science Foundation (grant nos. 1304305, 1739567, and 1848212), and the European Research Council (MERCURY ISOTOPES; grant no. 258537).
This paper was edited by Michael Weintraub and reviewed by five anonymous referees.
Agnan, Y., Le Dantec, T., Moore, C. W., Edwards, G. C., and Obrist, D.: New Constraints on Terrestrial Surface-Atmosphere Fluxes of Gaseous Elemental Mercury Using a Global Database, Environ. Sci. Technol., 50, 507–524, https://doi.org/10.1021/acs.est.5b04013, 2016.
Agnan, Y., Douglas, T. A., Helmig, D., Hueber, J., and Obrist, D.: Mercury in the Arctic tundra snowpack: temporal and spatial concentration patterns and trace gas exchanges, The Cryosphere, 12, 1939–1956, https://doi.org/10.5194/tc-12-1939-2018, 2018.
Bash, J. O. and Miller, D. R.: Growing season total gaseous mercury (TGM) flux measurements over an Acer rubrum L. stand, Atmos. Environ., 43, 5953–5961, https://doi.org/10.1016/j.atmosenv.2009.08.008, 2009.
Bergquist, B. A. and Blum, J. D.: Mass-dependent and -independent fractionation of Hg isotopes by photoreduction in aquatic systems, Science, 318, 417–420, https://doi.org/10.1126/science.1148050, 2007.
Blum, J. and Bergquist, B.: Reporting of variations in the natural isotopic composition of mercury, Anal. Bioanal. Chem., 388, 353–359, https://doi.org/10.1007/s00216-007-1236-9, 2007.
Box, J. E., Colgan, W. T., Christensen, T. R., Schmidt, N. M., Lund, M., Parmentier, F.-J. W., Brown, R., Bhatt, U. S., Euskirchen, E. S., Romanovsky, V. E., Walsh, J. E., Overland, J. E., Wang, M., Corell, R. W., Meier, W. N., Wouters, B., Mernild, S., Mård, J., Pawlak, J., and Olsen, M. S.: Key indicators of Arctic climate change: 1971–2017, Environ. Res. Lett., 14, 045010, https://doi.org/10.1088/1748-9326/aafc1b, 2019.
Budtz-Jørgensen, E., Grandjean, P., Keiding, N., White, R. F., and Weihe, P.: Benchmark dose calculations of methylmercury-associated neurobehavioural deficits, Toxicol. Lett., 112–113, 193–199, https://doi.org/10.1016/S0378-4274(99)00283-0, 2000.
Castro, M. and Moore, C.: Importance of Gaseous Elemental Mercury Fluxes in Western Maryland, Atmosphere, 7, 110, https://doi.org/10.3390/atmos7090110, 2016.
Chen, J., Hintelmann, H., Feng, X., and Dimock, B.: Unusual fractionation of both odd and even mercury isotopes in precipitation from Peterborough, ON, Canada, Geochim. Cosmochim. Ac., 90, 33–46, https://doi.org/10.1016/j.gca.2012.05.005, 2012.
Cherry, J. E., Déry, S. J., Cheng, Y., Stieglitz, M., Jacobs, A. S., and and Pan, F.: Climate and hydrometeorology of the Toolik Lake region and the Kuparuk River basin, in: Alaska's Changing Arctic: Ecological Consequences for Tundra, Streams, and Lakes, edited by: Hobbie, J. E. and Kling, G. W., Oxford University Press, New York, 2014.
Cohen, J., Screen, J. A., Furtado, J. C., Barlow, M., Whittleston, D., Coumou, D., Francis, J., Dethloff, K., Entekhabi, D., Overland, J., and Jones, J.: Recent Arctic amplification and extreme mid-latitude weather, Nat. Geosci., 7, 627, https://doi.org/10.1038/ngeo2234, 2014.
Dastoor, A. P. and Durnford, D. A.: Arctic Ocean: Is It a Sink or a Source of Atmospheric Mercury?, Environ. Sci. Technol., 48, 1707–1717, https://doi.org/10.1021/es404473e, 2014.
Demers, J. D., Blum, J. D., and Zak, D. R.: Mercury isotopes in a forested ecosystem: Implications for air-surface exchange dynamics and the global mercury cycle, Global Biogeochem. Cy., 27, 222–238, https://doi.org/10.1002/Gbc.20021, 2013.
Demers, J. D., Sherman, L. S., Blum, J. D., Marsik, F. J., and Dvonch, J. T.: Coupling atmospheric mercury isotope ratios and meteorology to identify sources of mercury impacting a coastal urban-industrial region near Pensacola, Florida, USA, Global Biogeochem. Cy., 29, 1689–1705, https://doi.org/10.1002/2015gb005146, 2015.
Douglas, T. A. and Blum, J. D.: Mercury isotopes reveal atmospheric gaseous mercury deposition directly to the Arctic coastal snowpack, Environ. Sci. Tech. Let., 6, 235–242, https://doi.org/10.1021/acs.estlett.9b00131, 2019.
Douglas, T. A. and Sturm, M.: Arctic haze, mercury and the chemical composition of snow across northwestern Alaska, Atmos. Environ., 38, 805–820, https://doi.org/10.1016/j.atmosenv.2003.10.042, 2004.
Douglas, T. A., Loseto, L. L., Macdonald, R. W., Outridge, P., Dommergue, A., Poulain, A., Amyot, M., Barkay, T., Berg, T., Chetelat, J., Constant, P., Evans, M., Ferrari, C., Gantner, N., Johnson, M. S., Kirk, J., Kroer, N., Larose, C., Lean, D., Nielsen, T. G., Poissant, L., Rognerud, S., Skov, H., Sorensen, S., Wang, F. Y., Wilson, S., and Zdanowicz, C. M.: The fate of mercury in Arctic terrestrial and aquatic ecosystems, a review, Environ. Chem., 9, 321–355, https://doi.org/10.1071/en11140, 2012.
Douglas, T. A., Sturm, M., Blum, J. D., Polashenski, C., Stuefer, S., Hiemstra, C., Steffen, A., Filhol, S., and Prevost, R.: A Pulse of Mercury and Major Ions in Snowmelt Runoff from a Small Arctic Alaska Watershed, Environ. Sci. Technol., 51, 11145–11155, https://doi.org/10.1021/acs.est.7b03683, 2017.
Edwards, G. C., Rasmussen, P. E., Schroeder, W. H., Wallace, D. M., Halfpenny-Mitchell, L., Dias, G. M., Kemp, R. J., and Ausma, S.: Development and evaluation of a sampling system to determine gaseous Mercury fluxes using an aerodynamic micrometeorological gradient method, J. Geophys. Res.-Atmos., 110, D10306, https://doi.org/10.1029/2004jd005187, 2005.
Enrico, M., Roux, G. L., Marusczak, N., Heimburger, L. E., Claustres, A., Fu, X., Sun, R., and Sonke, J. E.: Atmospheric mercury transfer to peat bogs dominated by gaseous elemental mercury dry deposition, Environ. Sci. Technol., 50, 2405–2412, https://doi.org/10.1021/acs.est.5b06058, 2016.
Faïn, X., Helmig, D., Hueber, J., Obrist, D., and Williams, M. W.: Mercury dynamics in the Rocky Mountain, Colorado, snowpack, Biogeosciences, 10, 3793–3807, https://doi.org/10.5194/bg-10-3793-2013, 2013.
Fritsche, J., Obrist, D., Zeeman, M. J., Conen, F., Eugster, W., and Alewell, C.: Elemental mercury fluxes over a sub-alpine grassland determined with two micrometeorological methods, Atmos. Environ., 42, 2922–2933, https://doi.org/10.1016/j.atmosenv.2007.12.055, 2008.
Fu, X., Heimburger, L.-E., and Sonke, J. E.: Collection of atmospheric gaseous mercury for stable isotope analysis using iodine- and chlorine-impregnated activated carbon traps, J. Anal. Atom. Spectrom., 29, 841–852, https://doi.org/10.1039/c3ja50356a, 2014.
Fu, X., Marusczak, N., Wang, X., Gheusi, F., and Sonke, J. E.: Isotopic Composition of Gaseous Elemental Mercury in the Free Troposphere of the Pic du Midi Observatory, France, Environ. Sci. Technol., 50, 5641–5650, https://doi.org/10.1021/acs.est.6b00033, 2016a.
Fu, X., Zhu, W., Zhang, H., Sommar, J., Yu, B., Yang, X., Wang, X., Lin, C.-J., and Feng, X.: Depletion of atmospheric gaseous elemental mercury by plant uptake at Mt. Changbai, Northeast China, Atmos. Chem. Phys., 16, 12861–12873, https://doi.org/10.5194/acp-16-12861-2016, 2016b.
Grant, R. H. and Omonode, R. A.: Estimation of nocturnal CO2 and N2O soil emissions from changes in surface boundary layer mass storage, Atmos. Meas. Tech., 11, 2119–2133, https://doi.org/10.5194/amt-11-2119-2018, 2018.
Gratz, L. E., Keeler, G. J., Blum, J. D., and Sherman, L. S.: Isotopic composition and fractionation of mercury in great lakes precipitation and ambient air, Environ. Sci. Technol., 44, 7764–7770, https://doi.org/10.1021/es100383w, 2010.
Helmig, D., Blanchard, B., and Obrist, D.: Soil, snow, and atmosphere exchanges of mercury in the interior Arctic tundra, Alaska, Arctic Data Center, urn:uuid:e58b2369-0701-4dac-b3c6-b8e15a0cd187, available at: https://arcticdata.io/catalog/view/urn:uuid:e58b2369-0701-4dac-b3c6-b8e15a0cd187 (last access: 16 October 2019), 2018.
Jiskra, M., Wiederhold, J. G., Skyllberg, U., Kronberg, R. M., Hajdas, I., and Kretzschmar, R.: Mercury deposition and re-emission pathways in boreal forest soils investigated with Hg isotope signatures, Environ. Sci. Technol., 49, 7188–7196, https://doi.org/10.1021/acs.est.5b00742, 2015.
Jiskra, M., Sonke, J. E., Obrist, D., Bieser, J., Ebinghaus, R., Myhre, C. L., Pfaffhuber, K. A., Wangberg, I., Kyllonen, K., Worthy, D., Martin, L. G., Labuschagne, C., Mkololo, T., Ramonet, M., Magand, O., and Dommergue, A.: A vegetation control on seasonal variations in global atmospheric mercury concentrations, Nat. Geosci., 11, 244–250, https://doi.org/10.1038/s41561-018-0078-8, 2018.
Jiskra, M., Marusczak, N., Leung, K. H., Hawkins, L., Prestbo, E., and Sonke, J. E.: Automated Stable Isotope Sampling of Gaseous Elemental Mercury (ISO-GEM): Insights into GEM Emissions from Building Surfaces, Environ. Sci. Technol., 53, 4346–4354, https://doi.org/10.1021/acs.est.8b06381, 2019.
Johnson, K. P., Blum, J. D., Keeler, G. J., and Douglas, T. A.: Investigation of the deposition and emission of mercury in arctic snow during an atmospheric mercury depletion event, J. Geophys. Res.-Atmos., 113, D17304, https://doi.org/10.1029/2008JD009893, 2008.
Kappen, L.: Plant Activity under Snow and Ice, with Particular Reference to Lichens, Arctic, 46, 297–302, 1993.
Kritee, K., Blum, J. D., Johnson, M. W., Bergquist, B. A., and Barkay, T.: Mercury stable isotope fractionation during reduction of Hg(II) to Hg(0) by mercury resistant microorganisms, Environ. Sci. Technol., 41, 1889–1895, https://doi.org/10.1021/es062019t, 2007.
Lindberg, S. E., Hanson, P. J., Meyers, T. P., and Kim, K. H.: Air/surface exchange of mercury vapor over forests – the need for a reassessment of continental biogenic emissions, Atmos. Environ., 32, 895–908, https://doi.org/10.1016/s1352-2310(97)00173-8, 1998.
Mariotti, A., Germon, J. C., Hubert, P., Kaiser, P., Letolle, R., Tardieux, A., and Tardieux, P.: Experimental determination of nitrogen kinetic isotope fractionation: Some principles; illustration for the denitrification and nitrification processes, Plant Soil, 62, 413–430, https://doi.org/10.1007/BF02374138, 1981.
Monson, R. and Baldocchi, D.: Terrestrial Biosphere-Atmosphere Fluxes, Terrestrial Biosphere-Atmosphere Fluxes, Cambridge Univ. Press, Cambridge, 1–487, 2014.
Moore, C. W. and Castro, M. S.: Investigation of factors affecting gaseous mercury concentrations in soils, Sci. Total Environ., 419, 136–143, https://doi.org/10.1016/j.scitotenv.2011.12.068, 2012.
Obrist, D., Pokharel, A. K., and Moore, C.: Vertical profile measurements of soil air suggest immobilization of gaseous elemental mercury in mineral soil, Environ. Sci. Technol., 48, 2242–2252, https://doi.org/10.1021/es4048297, 2014.
Obrist, D., Agnan, Y., Jiskra, M., Olson, C. L., Colegrove, D. P., Hueber, J., Moore, C. W., Sonke, J. E., and Helmig, D.: Tundra uptake of atmospheric elemental mercury drives Arctic mercury pollution, Nature, 547, 201–204, https://doi.org/10.1038/nature22997, 2017.
Obrist, D., Kirk, J. L., Zhang, L., Sunderland, E. M., Jiskra, M., and Selin, N. E.: A review of global environmental mercury processes in response to human and natural perturbations: Changes of emissions, climate, and land use, Ambio, 47, 116–140, https://doi.org/10.1007/s13280-017-1004-9, 2018.
Olson, C., Jiskra, M., Biester, H., Chow, J., and Obrist, D.: Mercury in Active-Layer Tundra Soils of Alaska: Concentrations, Pools, Origins, and Spatial Distribution, Global Biogeochem. Cy., 32, 1058–1073, https://doi.org/10.1029/2017gb005840, 2018.
Olson, C. L., Jiskra, M., Sonke, J. E., and Obrist, D.: Mercury in tundra vegetation of Alaska: Spatial and temporal dynamics and stable isotope patterns, Sci. Total Environ., 660, 1502–1512, https://doi.org/10.1016/j.scitotenv.2019.01.058, 2019.
Osterwalder, S., Bishop, K., Alewell, C., Fritsche, J., Laudon, H., Åkerblom, S., and Nilsson, M. B.: Mercury evasion from a boreal peatland shortens the timeline for recovery from legacy pollution, Sci. Rep.-UK, 7, 16022, https://doi.org/10.1038/s41598-017-16141-7, 2017.
Outridge, P. M., Hobson, K. A., and Savelle, J.: Long-term changes of mercury levels in ringed seal (Phoca hispida) from Amundsen Gulf, and beluga (Delphinapterus leucas) from the Beaufort Sea, western Canadian Arctic, Sci. Total Environ., 407, 6044–6051, https://doi.org/10.1016/j.scitotenv.2009.08.018, 2009.
Peichl, M., Sagerfors, J., Lindroth, A., Buffam, I., Grelle, A., Klemedtsson, L., Laudon, H., and Nilsson, M. B.: Energy exchange and water budget partitioning in a boreal minerogenic mire, J. Geophys. Res.-Biogeo., 118, 1–13, https://doi.org/10.1029/2012JG002073, 2013.
Rolph, G., Stein, A., and Stunder, B.: Real-time Environmental Applications and Display sYstem: READY, Environ. Model. Softw., 95, 210–228, https://doi.org/10.1016/j.envsoft.2017.06.025, 2017.
Roman, H. A., Walsh, T. L., Coull, B. A., Dewailly, É., Guallar, E., Hattis, D., Mariën, K., Schwartz, J., Stern, A. H., Virtanen, J. K., and Rice, G.: Evaluation of the Cardiovascular Effects of Methylmercury Exposures: Current Evidence Supports Development of a Dose–Response Function for Regulatory Benefits Analysis, Environ. Health Perspect., 119, 607–614, https://doi.org/10.1289/ehp.1003012, 2011.
Schlesinger, W. H. and Andrews, J. A.: Soil respiration and the global carbon cycle, Biogeochemistry, 48, 7–20, https://doi.org/10.1023/A:1006247623877, 2000.
Schuster, P. F., Schaefer, K. M., Aiken, G. R., Antweiler, R. C., Dewild, J. F., Gryziec, J. D., Gusmeroli, A., Hugelius, G., Jafarov, E., Krabbenhoft, D. P., Liu, L., Herman-Mercer, N., Mu, C. C., Roth, D. A., Schaefer, T., Striegl, R. G., Wickland, K. P., and Zhang, T. J.: Permafrost Stores a Globally Significant Amount of Mercury, Geophys. Res. Lett., 45, 1463–1471, https://doi.org/10.1002/2017gl075571, 2018.
Seok, B., Helmig, D., Williams, M. W., Liptzin, D., Chowanski, K., and Hueber, J.: An automated system for continuous measurements of trace gas fluxes through snow: an evaluation of the gas diffusion method at a subalpine forest site, Niwot Ridge, Colorado, Biogeochemistry, 95, 95–113, https://doi.org/10.1007/s10533-009-9302-3, 2009.
Sheehan, M. C., Burke, T. A., Navas-Acien, A., Breysse, P. N., McGready, J., and Fox, M. A.: Global methylmercury exposure from seafood consumption and risk of developmental neurotoxicity: a systematic review, B. World Health Organ., 92, 254–269, https://doi.org/10.2471/BLT.12.116152, 2014.
Sherman, L. S., Blum, J. D., Johnson, K. P., Keeler, G. J., Barres, J. A., and Douglas, T. A.: Mass-independent fractionation of mercury isotopes in Arctic snow driven by sunlight, Nat. Geosci., 3, 173–177, https://doi.org/10.1038/ngeo758, 2010.
Sherman, L. S., Blum, J. D., Douglas, T. A., and Steffen, A.: Frost flowers growing in the Arctic ocean–atmosphere–sea ice–snow interface: 2. Mercury exchange between the atmosphere, snow, and frost flowers, J. Geophys. Res., 117, D00R10, https://doi.org/10.1029/2011jd016186, 2012a.
Sherman, L. S., Blum, J. D., Keeler, G. J., Demers, J. D., and Dvonch, J. T.: Investigation of local mercury deposition from a coal-fired power plant using mercury isotopes, Environ. Sci. Technol., 46, 382–390, https://doi.org/10.1021/es202793c, 2012b.
Sherman, L. S., Blum, J. D., Dvonch, J. T., Gratz, L. E., and Landis, M. S.: The use of Pb, Sr, and Hg isotopes in Great Lakes precipitation as a tool for pollution source attribution, Sci. Total Environ., 502, 362–374, https://doi.org/10.1016/j.scitotenv.2014.09.034, 2015.
Sigler, J. M. and Lee, X.: Gaseous mercury in background forest soil in the northeastern United States, J. Geophys. Res.-Biogeo., 111, G02007, https://doi.org/10.1029/2005jg000106, 2006.
Smith, R. S., Wiederhold, J. G., Jew, A. D., Brown, G. E., Bourdon, B., and Kretzschmar, R.: Stable Hg Isotope Signatures in Creek Sediments Impacted by a Former Hg Mine, Environ. Sci. Technol., 49, 767–776, https://doi.org/10.1021/es503442p, 2015.
Sonke, J. E. and Heimburger, L. E.: ENVIRONMENTAL SCIENCE Mercury in flux, Nat. Geosci., 5, 447–448, https://doi.org/10.1038/ngeo1508, 2012.
Sonke, J. E., Teisserenc, R., Heimburger-Boavida, L. E., Petrova, M. V., Marusczak, N., Le Dantec, T., Chupakov, A. V., Li, C., Thackray, C. P., Sunderland, E. M., Tananaev, N., and Pokrovsky, O. S.: Eurasian river spring flood observations support net Arctic Ocean mercury export to the atmosphere and Atlantic Ocean, P. Natl. Acad. Sci. USA, 115, E11586–E11594, https://doi.org/10.1073/pnas.1811957115, 2018.
St. Pierre, K. A., Zolkos, S., Shakil, S., Tank, S. E., St. Louis, V. L., and Kokelj, S. V.: Unprecedented increases in total and methyl mercury concentrations downstream of retrogressive thaw slumps in the western Canadian Arctic, Environ. Sci. Technol., 52, 14099–14109, https://doi.org/10.1021/acs.est.8b05348, 2018.
Steffen, A., Douglas, T., Amyot, M., Ariya, P., Aspmo, K., Berg, T., Bottenheim, J., Brooks, S., Cobbett, F., Dastoor, A., Dommergue, A., Ebinghaus, R., Ferrari, C., Gardfeldt, K., Goodsite, M. E., Lean, D., Poulain, A. J., Scherz, C., Skov, H., Sommar, J., and Temme, C.: A synthesis of atmospheric mercury depletion event chemistry in the atmosphere and snow, Atmos. Chem. Phys., 8, 1445–1482, https://doi.org/10.5194/acp-8-1445-2008, 2008.
Stein, A. F., Draxler, R. R., Rolph, G. D., Stunder, B. J. B., Cohen, M. D., and Ngan, F.: NOAA's HYSPLIT Atmospheric Transport and Dispersion Modeling System, B. Am. Meteorol. Soc., 96, 2059–2077, https://doi.org/10.1175/bams-d-14-00110.1, 2015.
Sun, R., Jiskra, M., Amos, H. M., Zhang, Y., Sunderland, E. M., and Sonke, J. E.: Modelling the mercury stable isotope distribution of Earth surface reservoirs: Implications for global Hg cycling, Geochim. Cosmochim. Ac., 246, 156–173, https://doi.org/10.1016/j.gca.2018.11.036, 2019.
Sun, R. Y., Enrico, M., Heimburger, L. E., Scott, C., and Sonke, J. E.: A double-stage tube furnace-acid-trapping protocol for the pre-concentration of mercury from solid samples for isotopic analysis, Anal. Bioanal. Chem., 405, 6771–6781, https://doi.org/10.1007/s00216-013-7152-2, 2013.
Van Dam, B., Helmig, D., Burkhart, J. F., Obrist, D., and Oltmans, S. J.: Springtime boundary layer O3 and GEM depletion at Toolik Lake, Alaska, J. Geophys. Res.-Atmos., 118, 3382–3391, https://doi.org/10.1002/jgrd.50213, 2013.
Wofsy, S. C., Goulden, M. L., Munger, J. W., Fan, S. M., Bakwin, P. S., Daube, B. C., Bassow, S. L., and Bazzaz, F. A.: Net Exchange of CO2 in a Mid-Latitude Forest, Science, 260, 1314, https://doi.org/10.1126/science.260.5112.1314, 1993.
Yu, B., Fu, X., Yin, R., Zhang, H., Wang, X., Lin, C. J., Wu, C., Zhang, Y., He, N., Fu, P., Wang, Z., Shang, L., Sommar, J., Sonke, J. E., Maurice, L., Guinot, B., and Feng, X.: Isotopic Composition of Atmospheric Mercury in China: New Evidence for Sources and Transformation Processes in Air and in Vegetation, Environ. Sci. Technol., 50, 9262–9269, https://doi.org/10.1021/acs.est.6b01782, 2016.
Yu, Q., Luo, Y., Wang, S., Wang, Z., Hao, J., and Duan, L.: Gaseous elemental mercury (GEM) fluxes over canopy of two typical subtropical forests in south China, Atmos. Chem. Phys., 18, 495–509, https://doi.org/10.5194/acp-18-495-2018, 2018.
Yuan, W., Sommar, J., Lin, C.-J., Wang, X., Li, K., Liu, Y., Zhang, H., Lu, Z., Wu, C., and Feng, X.: Stable isotope evidence shows re-emission of elemental mercury vapor occurring after reductive loss from foliage, Environ. Sci. Technol., 53, 651–660, https://doi.org/10.1021/acs.est.8b04865, 2018.
Zheng, W. and Hintelmann, H.: Nuclear field shift effect in isotope fractionation of mercury during abiotic reduction in the absence of light, J. Phys. Chem. A, 114, 4238–4245, https://doi.org/10.1021/jp910353y, 2010.
Zheng, W., Obrist, D., Weis, D., and Bergquist, B. A.: Mercury isotope compositions across North American forests, Global Biogeochem. Cy., 30, 1475–1492, https://doi.org/10.1002/2015gb005323, 2016.
Zheng, W., Demers, J., Lu, X., Bergquist, B. A., Anbar, A. D., Blum, J. D., and Gu, B.: Mercury stable isotope fractionation during abiotic dark oxidation in the presence of thiols and natural organic matter, Environ. Sci. Technol., 53, 1853–1862, https://doi.org/10.1021/acs.est.8b05047, 2018.