the Creative Commons Attribution 4.0 License.
the Creative Commons Attribution 4.0 License.
 | 24 Jan 2019
The export flux of particulate organic carbon derived from 210Po∕210Pb disequilibria along the North Atlantic GEOTRACES GA01 transect: GEOVIDE cruise
Nolwenn Lemaitre
Maxi Castrillejo
Montserrat Roca-Martí
Pere Masqué
Gillian Stewart
The disequilibrium between 210Po activity and 210Pb activity in seawater samples was determined along the GEOTRACES GA01 transect in the North Atlantic during the GEOVIDE cruise (May–June 2014). A steady-state model was used to quantify vertical export of particulate 210Po. Vertical advection was incorporated into one version of the model using time-averaged vertical velocity, which had substantial variance. This resulted in large uncertainties for the 210Po export flux in this model, suggesting that those calculations of 210Po export fluxes should be used with great care. Despite the large uncertainties, there is no question that the deficits of 210Po in the Iberian Basin and at the Greenland Shelf have been strongly affected by vertical advection. Using the export flux of 210Po and the particulate organic carbon (POC) to 210Po ratio of total (> 1 µm) particles, we determined the POC export fluxes along the transect. Both the magnitude and efficiency of the estimated POC export flux from the surface ocean varied spatially within our study region. Export fluxes of POC ranged from negligible to 10 mmol C m−2 d−1, with enhanced POC export in the Labrador Sea. The cruise track was characterized by overall low POC export relative to net primary production (export efficiency < 1 %–15 %), but relatively high export efficiencies were seen in the basins where diatoms dominated the phytoplankton community. The particularly low export efficiencies in the Iberian Basin, on the other hand, were explained by the dominance of smaller phytoplankton, such as cyanobacteria or coccolithophores. POC fluxes estimated from the 210Po∕210Pb and 234Th∕238U disequilibria agreed within a factor of 3 along the transect, with higher POC estimates generally derived from 234Th. The differences were attributed to integration timescales and the history of bloom events.
Please read the corrigendum first before continuing.
-
Notice on corrigendum
The requested paper has a corresponding corrigendum published. Please read the corrigendum first before downloading the article.
-
Article
(4048 KB)
-
The requested paper has a corresponding corrigendum published. Please read the corrigendum first before downloading the article.
- Article
(4048 KB) - Corrigendum
- Companion paper
- BibTeX
- EndNote


The oceans play an essential role in the regulation of atmospheric CO2 and the buffering of the global climate system (e.g., Sabine, 2004) by removing carbon from the atmosphere via dissolution and photosynthesis in the surface ocean, and storing it in the dissolved or particulate forms. An important component of this oceanic sequestration is the biological carbon pump, driven by sinking particles from the surface to the deep ocean (e.g., Falkowski et al., 1998; Ducklow et al., 2001).
The magnitude of particulate organic carbon (POC) export flux from the upper ocean was traditionally obtained from time-series sediment traps (e.g., Honjo et al., 2008) and the natural radiotracer pair, 234Th∕238U (e.g., Bhat et al., 1968; Buesseler et al., 1992). Here we focus on the application of another natural radionuclide pair: polonium-210 (210Po, days) and its progenitor lead-210 (210Pb, years). The 210Po∕210Pb pair has a different particle-binding dynamic compared to the 234Th∕238U pair since both isotopes are particle reactive, whereas 238U is conservative and remains dissolved in seawater (Djogic et al., 1986). However, the nature of the particle association differs between the isotopes. Lead-210 and 234Th are only adsorbed to particle surfaces, whereas 210Po is both adsorbed to surfaces and biologically reactive so it can be assimilated by organisms and even bioaccumulated (Fisher et al., 1983; Cherrier et al., 1995; Stewart and Fisher, 2003a, b). This behavior leads to a higher partitioning coefficient (relative association between the isotope and the particulate vs. the dissolved phase) of 210Po compared to that of 210Pb (e.g., Masqué et al., 2002; Wei et al., 2014; Tang et al., 2017).
Lead-210 in the water column comes both from atmospheric deposition and in situ production via the decay of 226Ra. The residence time of 210Pb in the atmosphere is only of days to weeks (Moore et al., 1974; Turekian et al., 1977). Polonium-210 (produced by decay of 210Pb via 210Bi) activity in aerosols, and the subsequent fluxes to the surface ocean, are only about 10 %–20 % of those of 210Pb (Masqué et al., 2002). The large difference in their particle reactivity and half-lives often leads to a disequilibrium between 210Po and 210Pb activities in the upper water column as particles sink.
This deviation from secular equilibrium, often in the form of a deficit of 210Po activity with respect to 210Pb activity, can be used to estimate POC export in a similar manner to the application of the 234Th∕238U disequilibrium (Friedrich and Rutgers van der Loeff, 2002; Verdeny et al., 2009; Wei et al., 2011). Particle export fluxes estimated from the 234Th∕238U and the 210Po∕210Pb disequilibria integrate export that has occurred on timescales of weeks to months prior to the sampling time, respectively. The use of both isotope pairs could provide complementary information on the causes, timing, and efficiency of export fluxes of POC (e.g., Murray et al., 2005; Stewart et al., 2007; Roca-Martí et al., 2016).
In this study along the GEOTRACES GA01 transect in the North Atlantic, we first used a traditional scavenging model with the assumptions of steady-state and negligible physical transport to derive 210Po fluxes over different depths of the water column at 11 stations. Then, vertical advection (primarily upwelling) was considered, and its impact on 210Po flux was assessed. Using the POC concentration, and particulate 210Po activity in the particles collected by in situ pumps, sinking fluxes of POC were then calculated. The magnitude and efficiency of carbon export derived from the 210Po∕210Pb disequilibrium was considered in relation to the composition of the phytoplankton community. Finally, the POC export fluxes estimated from 210Po∕210Pb disequilibria were compared with those derived from 234Th∕238U disequilibria.
2.1 Cruise track and hydrographic setting
The GEOVIDE cruise (GEOTRACES GA01 transect) was carried out in May–June 2014 from Lisbon to Newfoundland (Fig. 1). Seawater and particulate samples for 210Po and 210Pb activity analysis were collected from the water column at 11 stations (Fig. 1). The GA01 transect can be separated into five sections according to its biogeochemical characteristics, described in detail by Lemaitre et al. (2018). From east to west, these are the Iberian Basin (stations 1, 13), the Western European Basin (stations 21, 26), the Iceland Basin (stations 32, 38), the Irminger Basin (stations 44, 60), and the Labrador Basin (stations 64, 69, 77).
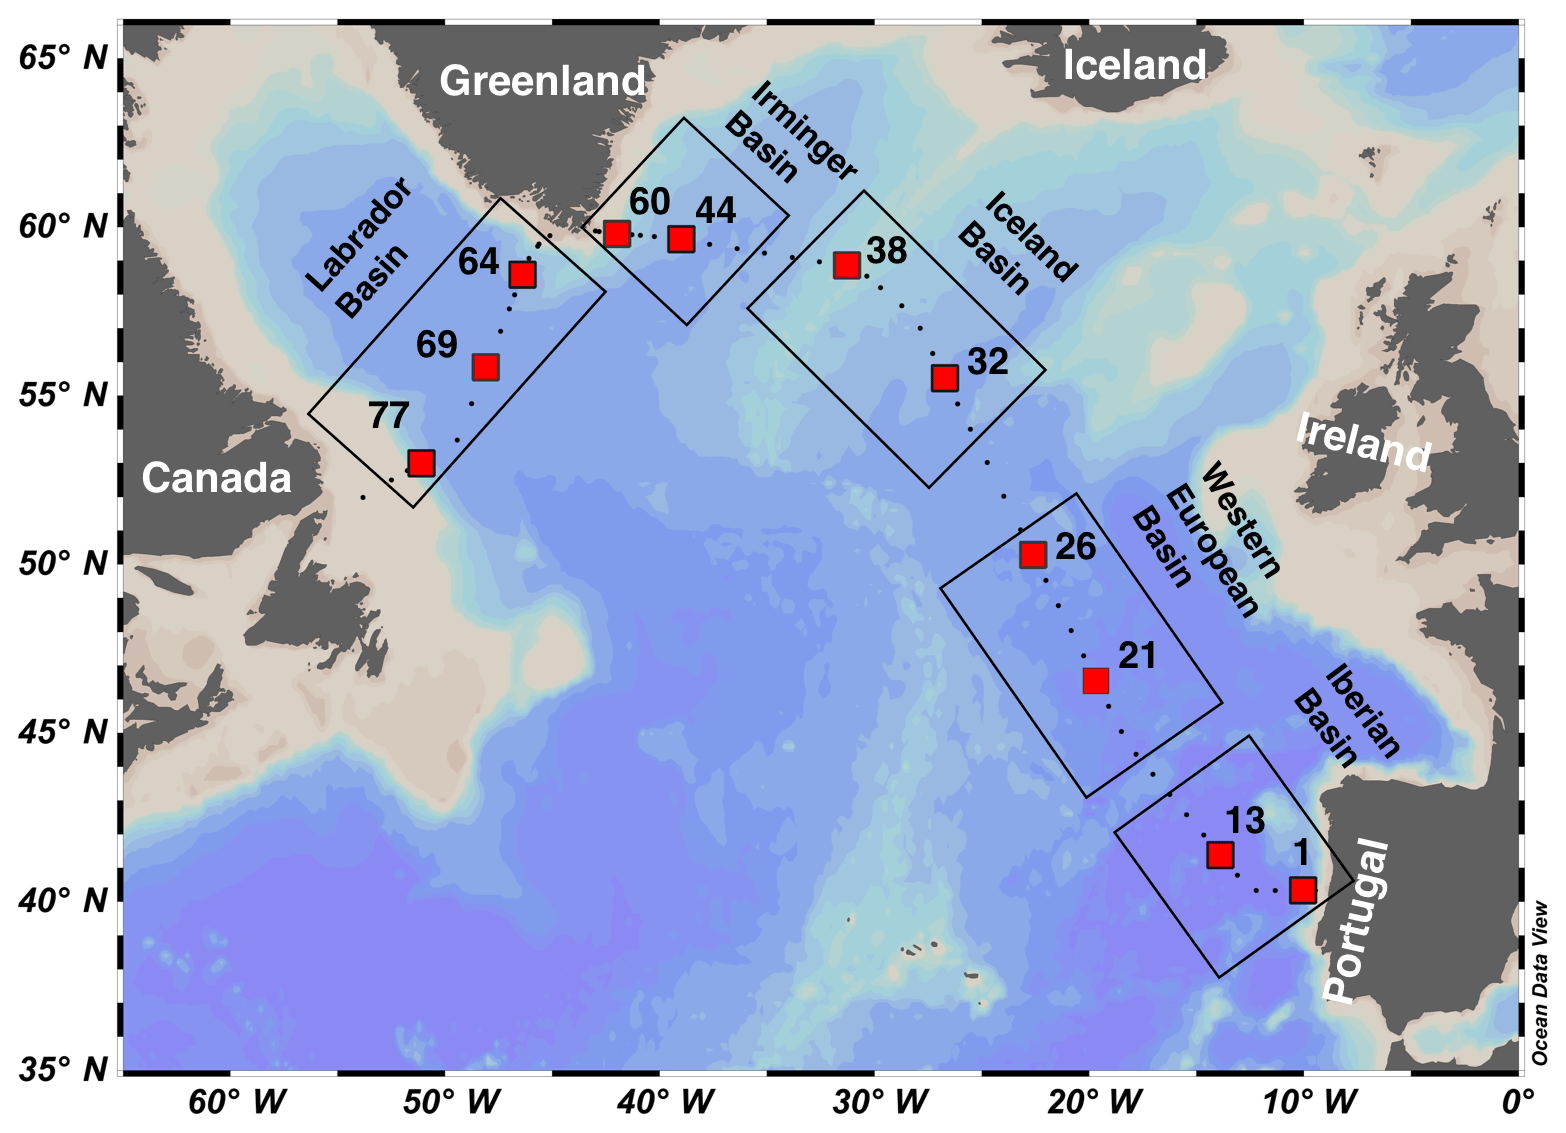
Figure 1Map of stations occupied during the GA01 transect in the North Atlantic. The red squares indicate the stations where 210Po and 210Pb activities were measured, as discussed in this study. The transect is divided into the Iberian Basin (stations 1, 13), the Western European Basin (stations 21, 26), the Iceland Basin (stations 32, 38), the Irminger Basin (stations 44, 60), and the Labrador Basin (stations 64, 69, 77).
2.2 Radionuclides sampling and analysis
Radionuclide data were produced by two collaborating laboratories to ensure higher counting statistics for 210Po activity in the samples: the Laboratori de Radioactivitat Ambiental at Universitat Autònoma de Barcelona (UAB) (samples from stations 1, 13, and 21) and the Stewart Laboratory at Queens College (QC) (samples from stations 26, 32, 38, 44, 60, 69, and 77). The sampling method for total and particulate 210Po and 210Pb samples and the determination of the radionuclide activity was described in Tang et al. (2018). In brief, water samples (5–10 L each) for total 210Po and 210Pb activity were collected using Niskin bottles at 10 full water column stations (16–22 depths/station) and at 1 station to 1000 m (9 depths), for a total of 200 samples. Particulate 210Po and 210Pb were collected at 3–10 depths per station between 15 and 800 m by using McLane in situ pumps equipped with a 53 µm PETEX screen to capture the large-size particles and a 1 µm quartz fiber QMA filter to capture small particles. The average equivalent volume filtered for particulate 210Po and 210Pb samples through the PETEX screen was 200 L and through the QMA filter was 70 L.
For water samples, Po and Pb isotopes (including the added chemical yield tracers of 209Po and stable lead) were co-precipitated with cobalt–ammonium pyrrolidine dithiocarbamate (Co-APDC) (Fleer and Bacon, 1984) at sea, but digested using concentrated HCl and HNO3 back at the home laboratories. Particulate samples were spiked with 209Po and stable lead before acid digestion (UAB: , QC: HNO3∕HCl). Polonium isotopes (209Po and 210Po) were plated by deposition onto a sliver disc (Flynn, 1968) and their activity was determined by alpha spectrometry. After removing any remaining Po isotopes by running the plating solution through an anion exchange column, the solution was respiked with 209Po and stored for at least 6 months. Lead-210 activity was determined by plating the ingrowth of 210Po from 210Pb.
The activities of 210Po and 210Pb at the sampling date were determined by correcting for nuclide decay, ingrowth, chemical recoveries, detector backgrounds, and blank contamination (Rigaud et al., 2013).
2.3 The 210Po flux method
The export flux of 210Po was estimated from total 210Po and 210Pb activities using a one-box model (Broecker et al., 1973; Matsumoto, 1975; Savoye et al., 2006). The 210Po activity in the surface ocean is the result of a balance between atmospheric input, continuous production from the decay of 210Pb in seawater, radioactive decay of 210Po, removal onto sinking particles, and transport into or out of the box by advection and diffusion. Therefore, the general form of the mass balance equation for 210Po between sources and sinks is as follows:
where is the change in 210Po activity with time, FPo (dpm m−2 d−1) is the atmospheric flux of 210Po to the sea surface, λPo is the decay constant of 210Po (0.005 d−1), IPb and IPo (dpm m−2) are the inventories of 210Pb and 210Po activities, P (dpm m−2 d−1) is the removal flux of 210Po via sinking particles, and V (dpm m−2 d−1) is the sum of the advective and diffusive fluxes.
The atmospheric flux of 210Po is usually ignored as it represents only ∼2 % of the in situ production of 210Po from 210Pb in the upper water column of the open ocean (e.g., Cochran, 1992; Masqué et al., 2002; Murray et al., 2005; Verdeny et al., 2008). We first used a steady-state (SS) model that assumes the negligible atmospheric input of 210Po activity and ignores advection and diffusion. In this case, the 210Po flux (P) can be simplified as follows:
The influences of advection and non-steady-state (NSS) processes on the overall 210Po activity balance are discussed below in Sect. 4.1 and 4.2.
Table 1The mixed-layer depth (MLD, defined as a change in potential density of 0.03 kg m−3 relative to the potential density at 10 m), the depth of the euphotic zone (Z1 %, defined as the depth at which photosynthetic available radiation was 1 % of its surface value), the primary production zone (PPZ, at which the fluorescence reaches 10 % of its maximum), and the 234Th-238U equilibrium depth (ThEq) at each station along the GA01 transect. Together with the 30-day (30 days prior to the sampling date) average vertical velocity within the 20 m under the corresponding depths (w20, 10−6 m s−1, downwards as positive direction). Primary production (PP) and net primary production (NPP) rates derived from 24 h bottle incubations (Fonseca-Batista et al., 2018; Lemaitre et al., 2018) and from the VGPM products, respectively, are also presented. Note that the NPP rates were averaged for the previous 138 days (210Po half-life) prior to the sampling date. Dates are in mm/dd/yy format.
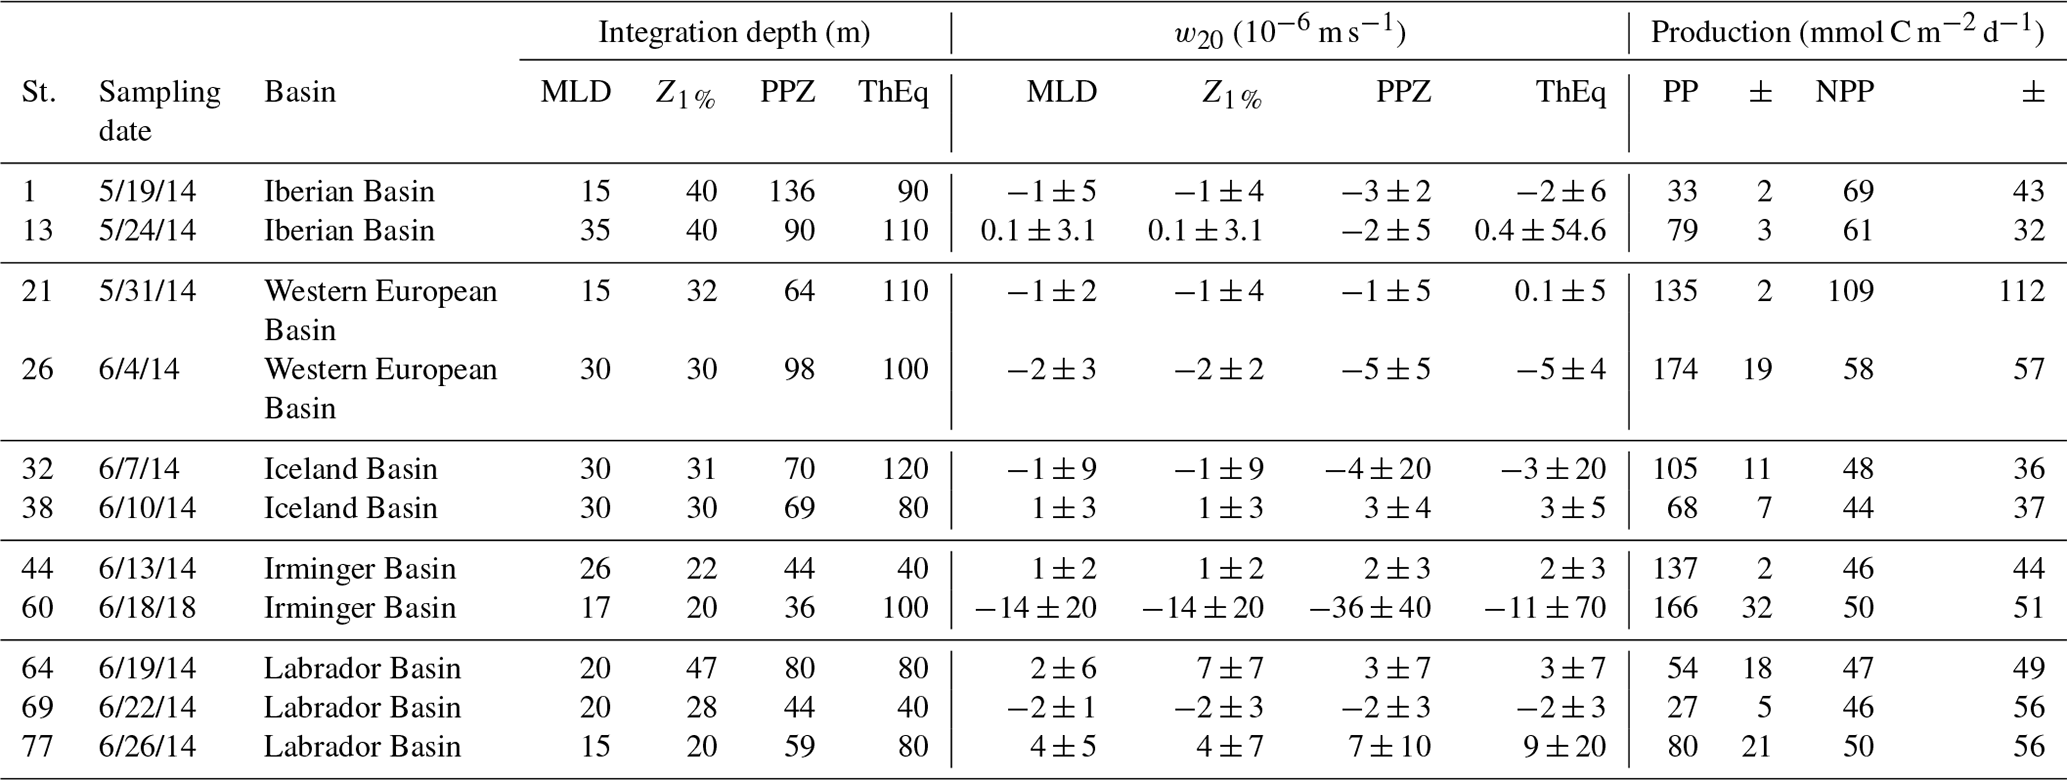
Many previous studies have used a single fixed integration depth for export calculations at all sampling locations (e.g., 100 m in the Antarctic Circumpolar Current, Rutgers van der Loeff et al., 1997; 120 m in the central equatorial Pacific, Murray et al., 2005). The GA01 transect, however, crossed diverse physical and biogeochemical conditions. Thus, investigating export at a single fixed depth for every station may bias the spatial comparisons of particle export. In this study, four site-specific integration depths were used for each station: the mixed-layer depth (MLD), the depth of the euphotic zone (Z1 %), the primary production zone (PPZ), and the 234Th-238U equilibrium depth (ThEq). The MLD was defined as a change in potential density of 0.03 kg m−3 relative to the potential density at 10 m (Weller and Plueddemann, 1996). Z1 % was defined as the depth at which photosynthetic available radiation was 1 % of its surface value (Jerlov, 1968). PPZ was the depth at which the fluorescence reaches 10 % of its maximum (Owens et al., 2015). ThEq was the depth at the bottom of the total 234Th water column deficit, where the activity of 234Th equals that of 238U (data from Lemaitre et al., 2018). These depths were used both to calculate 210Po and POC export and in order to compare the POC export fluxes estimated from the 210Po∕210Pb disequilibria to those derived from the 234Th∕238U disequilibria. Among the 11 stations, the depths of the MLD (23±7 m) were similar to those at Z1 % (31±9 m), whereas the depths of the PPZ (72±29 m) and ThEq (95±43 m) were deeper and comparable to each other. For the depths of MLD, Z1 %, PPZ, and ThEq at which total radionuclides data are not available, the measured values of total 210Po and 210Pb activities were linearly interpolated (Table 1).
The 210Po flux was then used to derive the flux of POC by multiplying the deficit of 210Po by the ratio of POC concentration to 210Po activity (POC∕210Po) of the total and large particulate material. Particulate 210Po and POC data were not always available at the depths of the MLD, Z1 %, PPZ, and ThEq at our study sites. To estimate POC∕210Po ratios at these depths, a regression was performed between the measured POC∕210Po ratios and depth for each basin using a single power law function.
2.4 Quantification of the influence of the vertical advection on 210Po export
Cyclonic or anticyclonic eddies constantly impact the horizontal velocity fields at our study sites (Zunino et al., 2017), changing the current directions and making it difficult to estimate the magnitude of horizontal velocities. This constant variability, together with the patchiness of sampling resolution, meant we could not assess the influence of horizontal advective processes on 210Po export estimates.
However, because we had relatively high depth resolution at each station, we did attempt to assess the influences of vertical advection on 210Po inventories at all the investigated depths by measuring the vertical gradient of 210Po activity and multiplying it by a time-averaged vertical velocity. Because the water column inventory of 210Po represents an integration of the changes over approximately the mean life of the isotope, we did not use the vertical velocity measured by the acoustic doppler current profiler (ADCP) at the sampling time, but a time-averaged vertical velocity from the Estimating the Circulation and Climate of the Ocean, Phase II (ECCO2). The activity gradient of 210Po below the depth z (i.e., the MLD, Z1 %, PPZ, and ThEq) at each station was calculated from the depth z (using the average activity in the layer of 0-z m) as starting point ( and linearly interpolated through the measurements 20 m below z ( at each station. A positive gradient ( > 0) was defined as higher activity at the depth of (z+20 m) than the starting point. We labeled the vertical velocity w20, which was the 30-day (30 days prior to the sampling date) average vertical velocity between the depths of z and (z+20 m). The flux of 210Po due to vertical advection (Fw) was calculated as the following:
Total 210Po fluxes at each depth, therefore, are the sum of the steady-state values based only on the 210Po deficit (Eq. 2), λPo(IPb−IPo), and vertical advective flux (Eq. 3), .
The ECCO2 vertical velocities were obtained from the Asia-Pacific Data-Research Center (APDRC, http://apdrc.soest.hawaii.edu/las/v6/dataset?catitem=1, last access: 18 January 2019). The ECCO2 model configuration uses a cube–sphere grid projection with 18 km horizontal grid spacing and 50 vertical levels among which there are 12 equal vertical layers from the surface to 120 m (Menemenlis et al., 2008). We selected the ECCO2 grid points closest to the station and extracted vertical velocities from the depths between z and (z+20 m) during 30 days prior to the sampling date at each station. Because the deficit of 210Po activity in the water column weighs the changes that occurred shortly prior to the sampling time more heavily than those that occurred further back in time (Verdeny et al., 2009), we chose to average the vertical velocity over 1 month rather than over the mean life of 210Po (200 days). The 30-day averaged vertical velocity was then used to calculate vertical advective 210Po export flux via Eq. (3) at each station.
2.5 Satellite-based net primary production and phytoplankton composition
The 8-day net primary production (NPP) data with a spatial resolution of 0.083 by 0.083∘ were obtained from the Oregon State University Ocean Productivity standard products (http://www.science.oregonstate.edu/ocean.productivity/, last access: 18 January 2019), wherein NPP was estimated by the Vertically Generalized Production Model (VGPM) (Behrenfeld and Falkowski, 1997). Due to some missing data between November 2013 and February 2014, NPP for each station was averaged for the previous 138 days (210Po half-life) instead of 200 days (210Po mean life).
Monthly average concentrations of diatoms, coccolithophores, cyanobacteria, chlorophytes, and total chlorophyll with the spatial resolution of 0.67×1.25∘ were obtained from the Goddard Earth Science Data and Information Services Center Interactive Online Visualization and Analysis Infrastructure (Giovanni) (https://giovanni.gsfc.nasa.gov/giovanni/ last access: 18 January 2019, Acker and Leptoukh, 2007). Time-series (October 2013–July 2014, covering > 200 days before sampling) data are averages over longitude for each month. We extracted data for the five basins individually and calculated the fraction of each phytoplankton group at each station as the ratio of their concentration to total chlorophyll concentration.
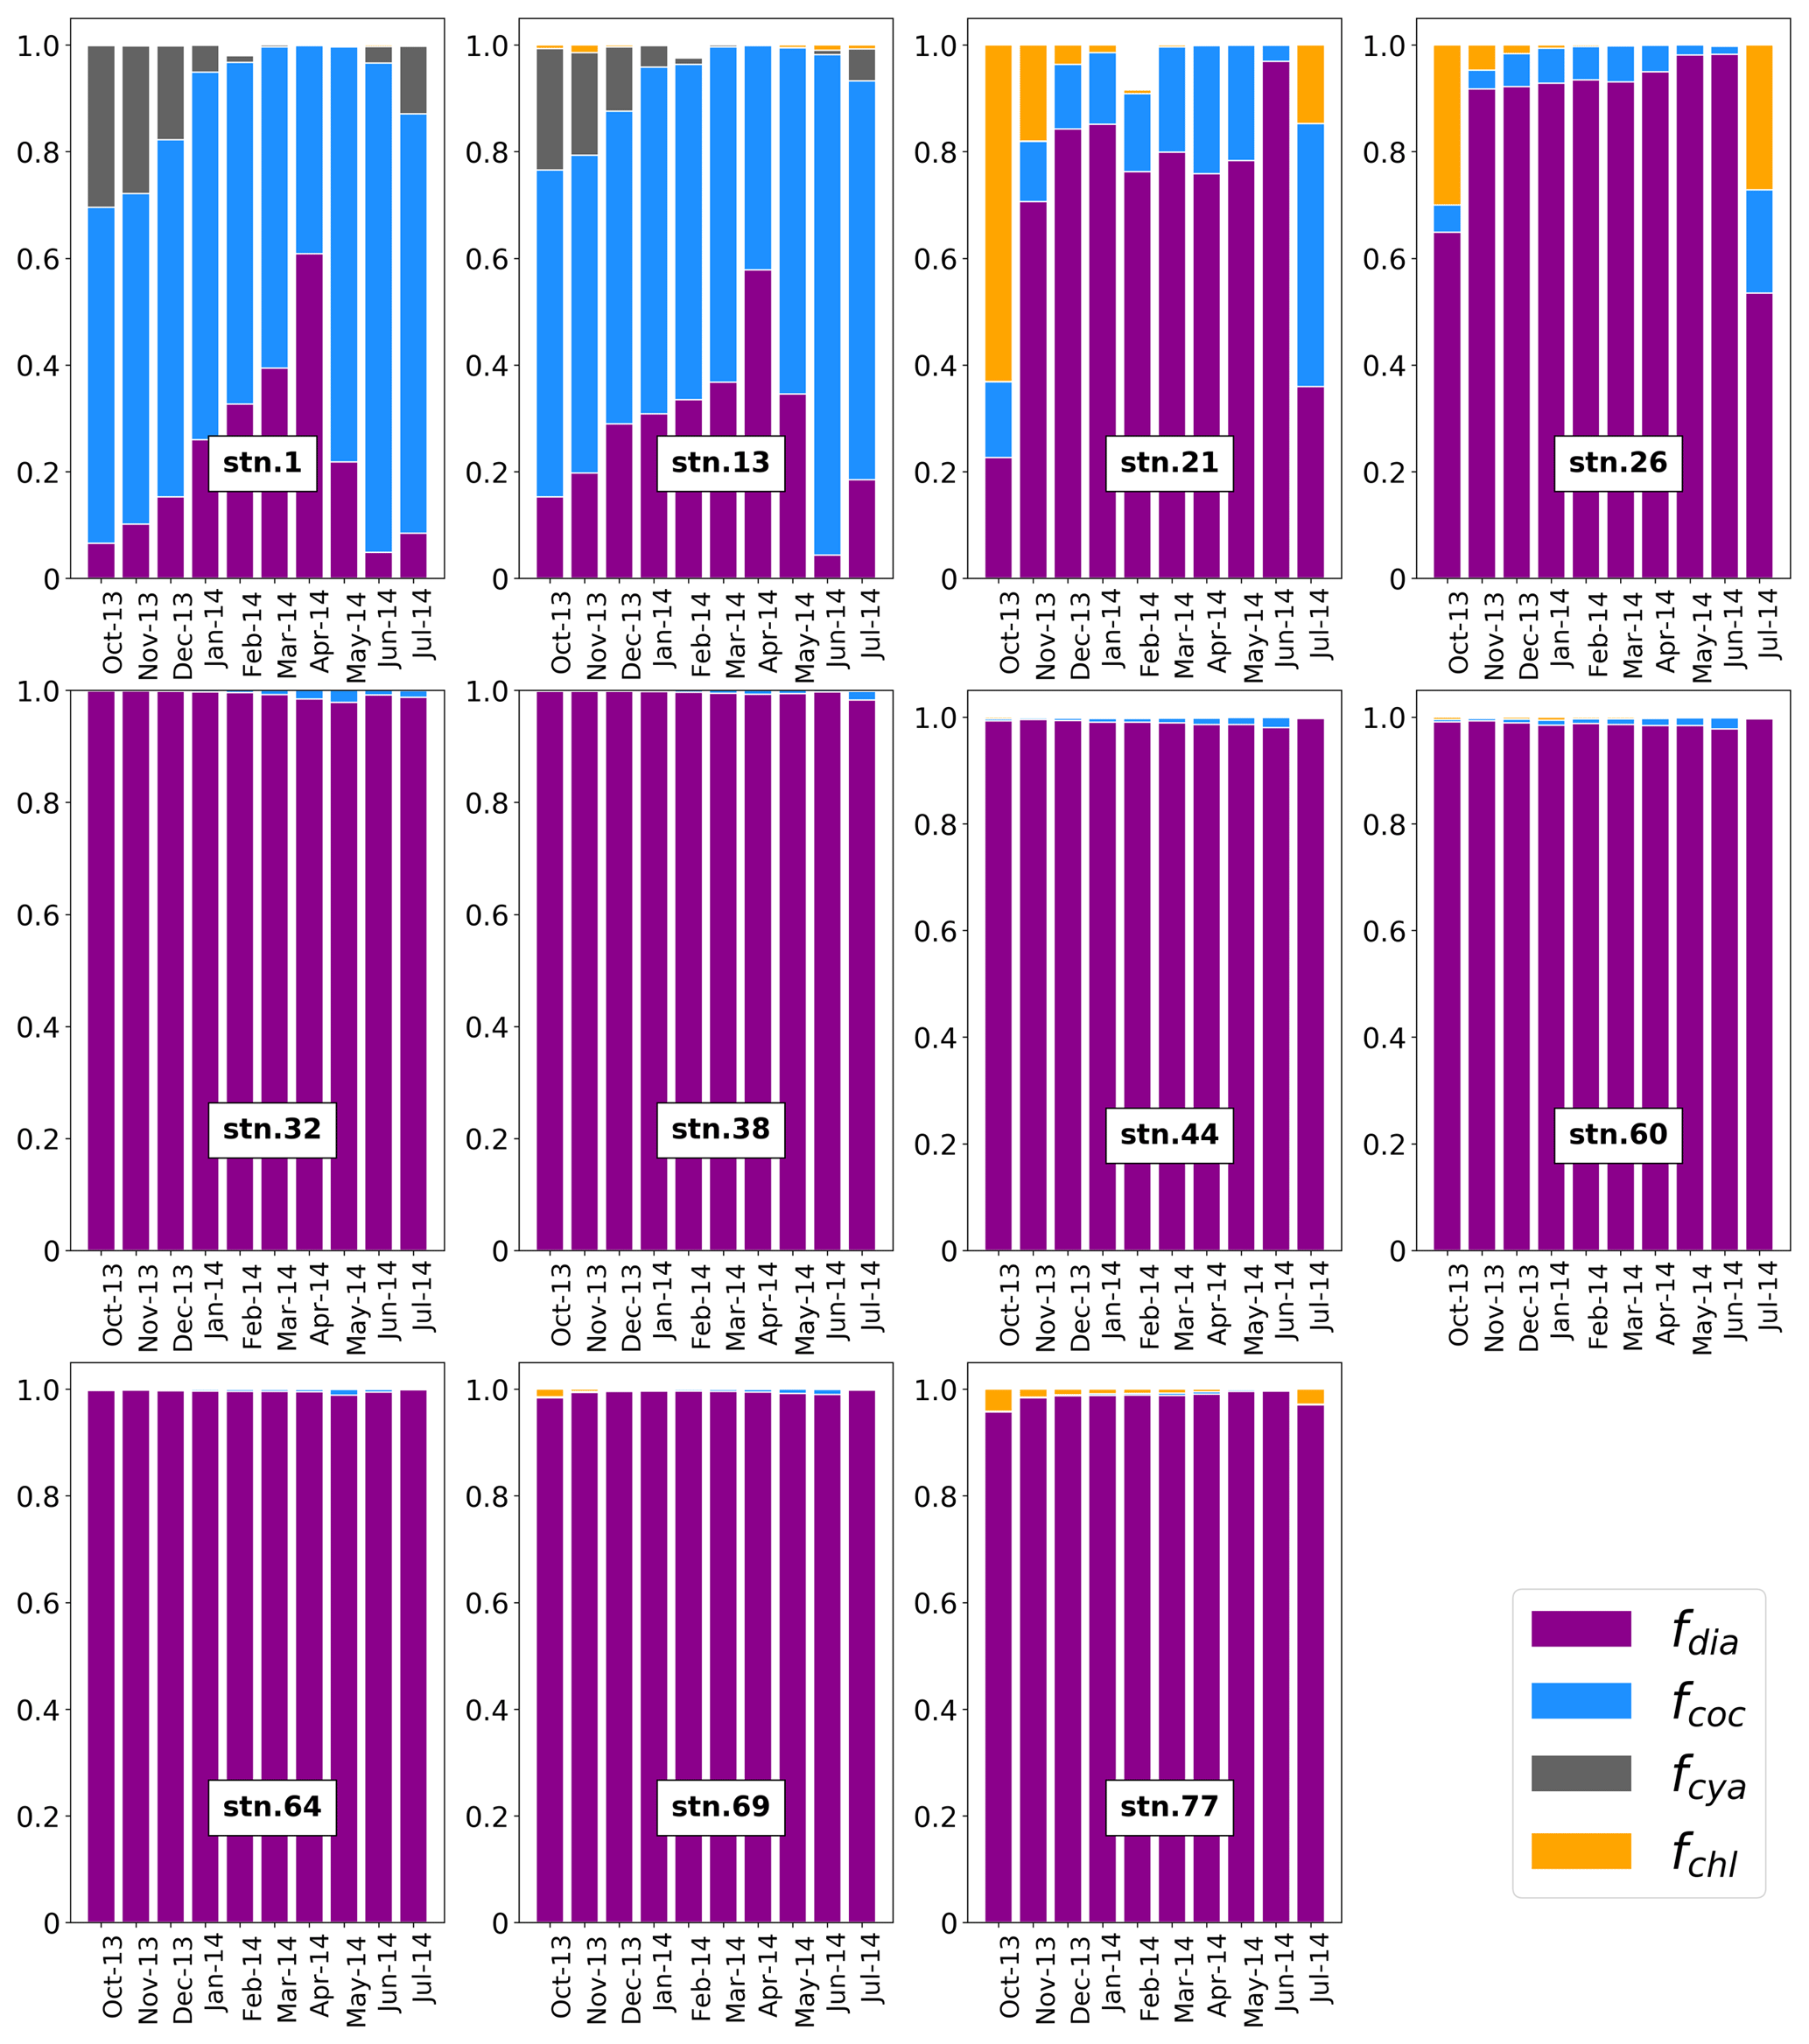
Figure 2Satellite-derived monthly average fraction of major phytoplankton groups from October 2013 to July 2014 along the GA01 transect: fdia, fcoc, fcya, and fchl are the fractions of diatoms (purple), coccolithophores (blue), cyanobacteria (gray), and chlorophytes (orange), respectively. Data are from the Giovanni online data system https://giovanni.gsfc.nasa.gov/giovanni/ (last access: 18 January 2019).
3.1 Satellite-derived seasonal NPP and phytoplankton composition
The VGPM modeled NPP data along the GA01 transect was averaged over ∼138 days prior to the sampling date (see Sect. 2.5, Table 1). Seasonal NPP at each station varied from low values of 44–79 to a maximum value of 109 mmol C m−2 d−1 at station 21. The Western European Basin had the highest seasonal NPP, followed by the Iberian Basin, while the Iceland Basin, the Irminger Basin, and the Labrador Basin all had similar NPP values in the range of 45–49 mmol C m−2 d−1. There was a shift in the biological community towards larger phytoplankton (e.g., diatoms) from east to west along the transect (Fig. 2). The basins for which diatoms were the dominant phytoplankton group did not necessarily have higher seasonal production relative to the basins where smaller phytoplankton (e.g., coccolithophores) were more abundant. Indeed, the Iberian Basin had the second highest seasonal NPP, despite the fact that the majority of chlorophyll was produced by coccolithophores. Despite the evidence that earlier blooms may have been driven by diatoms (see Sect. 4.2), these observations highlight the possible contribution of small particles to production, and possibly to export (proportional to their role in production according to Richardson and Jackson, 2007), along the transect. Moreover, this could also be due to shorter blooms in the Irminger and Labrador basins where the phytoplankton growth was light-limited during winter compared to the conditions in the Iberian and Western European basins.
The satellite-derived phytoplankton species composition demonstrated unique features within the basins (Fig. 2). The Iberian Basin was dominated (> 60 %) by coccolithophores between October 2013 and July 2014, but had a gradual increase in the contribution of diatoms until April 2014 and a decreasing contribution after that. In the Western European Basin, station 26 was dominated by diatoms all year round, while station 21 was dominated by diatoms, except in October 2013 and July 2014 when the combination of chlorophytes and coccolithophores contributed 35 %–77 % to the total chlorophyll concentration. The stations in the Iceland, Irminger, and Labrador basins were all dominated (> 98 %) by diatoms between October 2013 and July 2014.
3.2 One-month averaged vertical velocity w20
The 1-month averaged vertical velocities w20 ranged from to m s−1 along the transect (negative is upwelling, positive is downwelling, Table 1). The standard deviations of w20 were generally of the same order as the values of w20. Particularly large standard deviations, which exceed the typical values of the vertical velocity by a full order of magnitude, were found at stations 13 (35–55, 110–130 m) and 21 (110–130 m). These high standard deviations suggest that the data on w20 should be used with great care. Downwelling was seen at stations 38, 44, 64, and 77 with the velocities in the range of to m s−1. Upwelling was seen at the remaining stations, with highest intensity at station 60 near Greenland (absolute value: 11– m s−1). The upwelling velocities were roughly equivalent at stations 1, 13, 21, 26, 32, and 69 (absolute value: 1– m s−1).
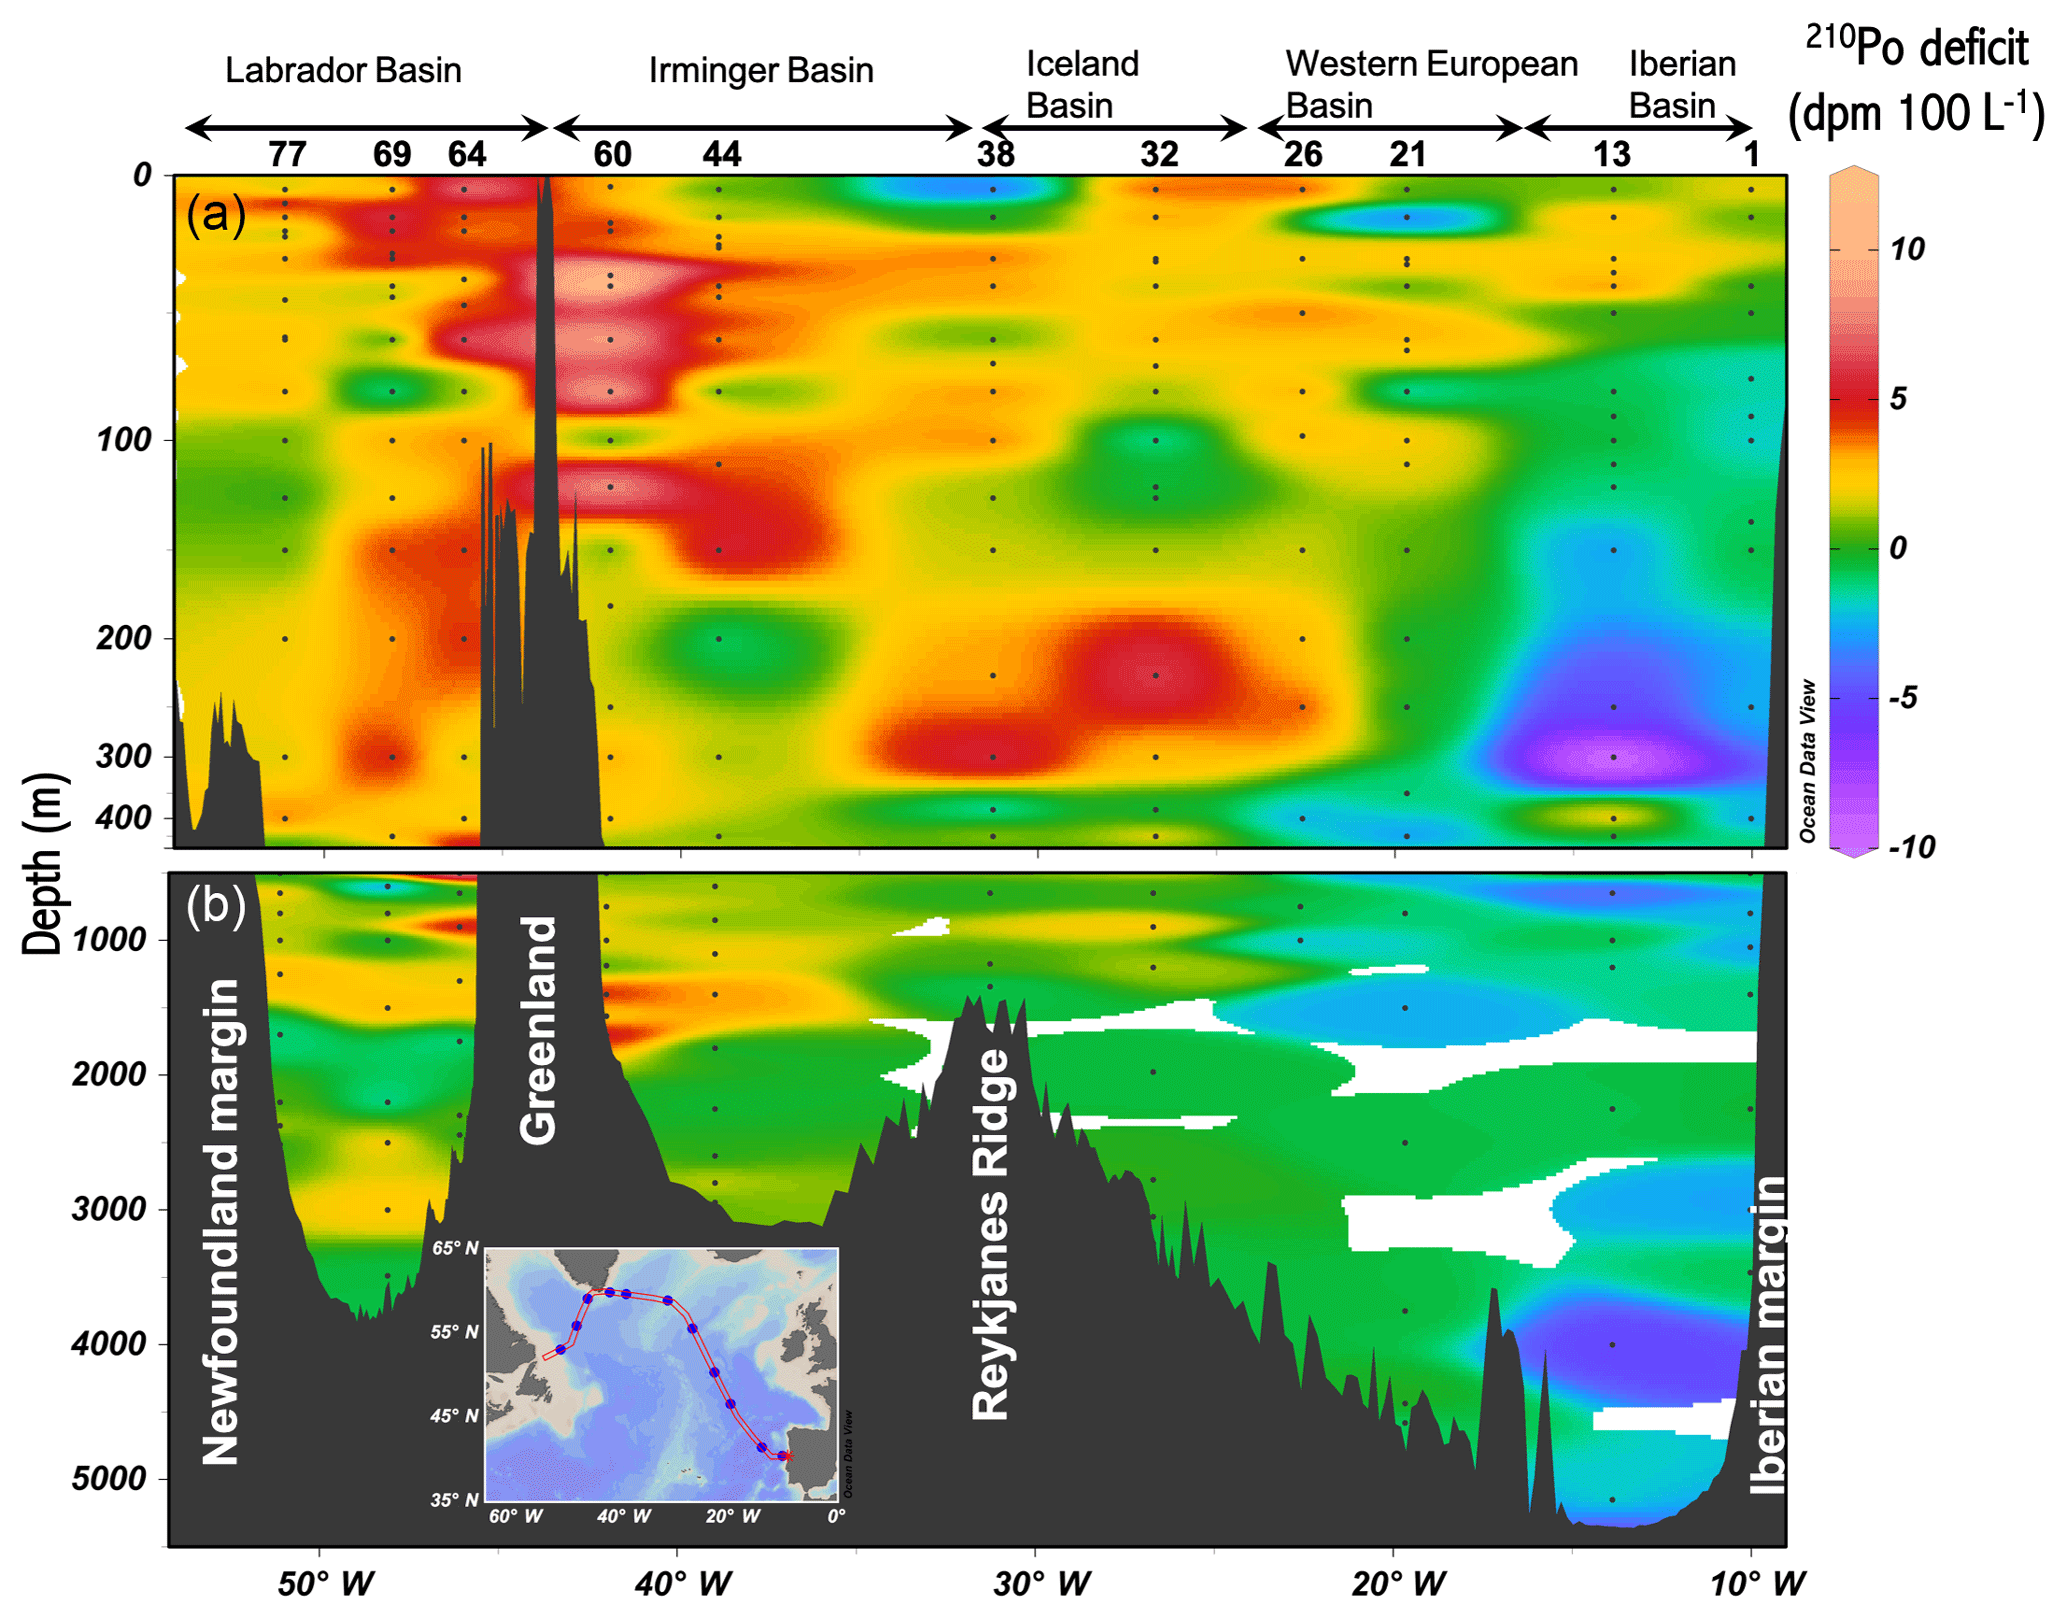
Figure 3Section plots of water column 210Po deficits (dpm 100 L−1, total 210Pb activity minus total 210Po activity) across the GA01 transect. Panel (a) is the upper 500 m. Panel (b) is 500–5500 m. Station numbers and basins are shown at the top of the upper panel.
3.3 Total 210Po deficits
The vertical profiles of total 210Po and 210Pb activity at each station have been described in a companion article (Tang et al., 2018). Here we show the section view of the water column 210Po deficit (dpm 100 L−1), which was calculated as total 210Pb activity minus total 210Po activity (Fig. 3). There were small 210Po deficits in the upper 100 m (including the majority of the depths of MLD, Z1 %, PPZ, and ThEq at all stations) at stations 1, 13, and 21, whereas a relatively large excess of 210Po was observed at 100–400 m depth. Station 60 had the highest deficits of 210Po (∼8 dpm 100 L−1, n=5) at 40–120 m depth. A large surface deficit of 210Po was found at station 64 (8 dpm 100 L−1) and a surface excess was found at station 38 (−3.5 dpm 100 L−1). There were positive 210Po deficits throughout most of the water column at stations in the Irminger and Labrador basins, whereas large 210Po excesses (negative deficits) below 100 m were generally seen in the Iberian Basin and Western European basins. Such 210Po excess was likely related to the Iberian upwelling, which may have provided a source of 210Po activity.
Table 2The total 210Po flux as the sum of the flux calculated from the deficit and vertical advection, together with POC∕210Po ratios in particles > 1 µm (derived from the power law function in Fig. 5) and POC fluxes derived from 210Po at the corresponding depths. The uncertainties of 210Po export flux are associated with the activity uncertainty of the radionuclides. The error for the calculated particulate POC∕210Po ratio in each basin is the standard error of regression. The uncertainties of the 210Po-derived POC flux were estimated based on the propagation of error.
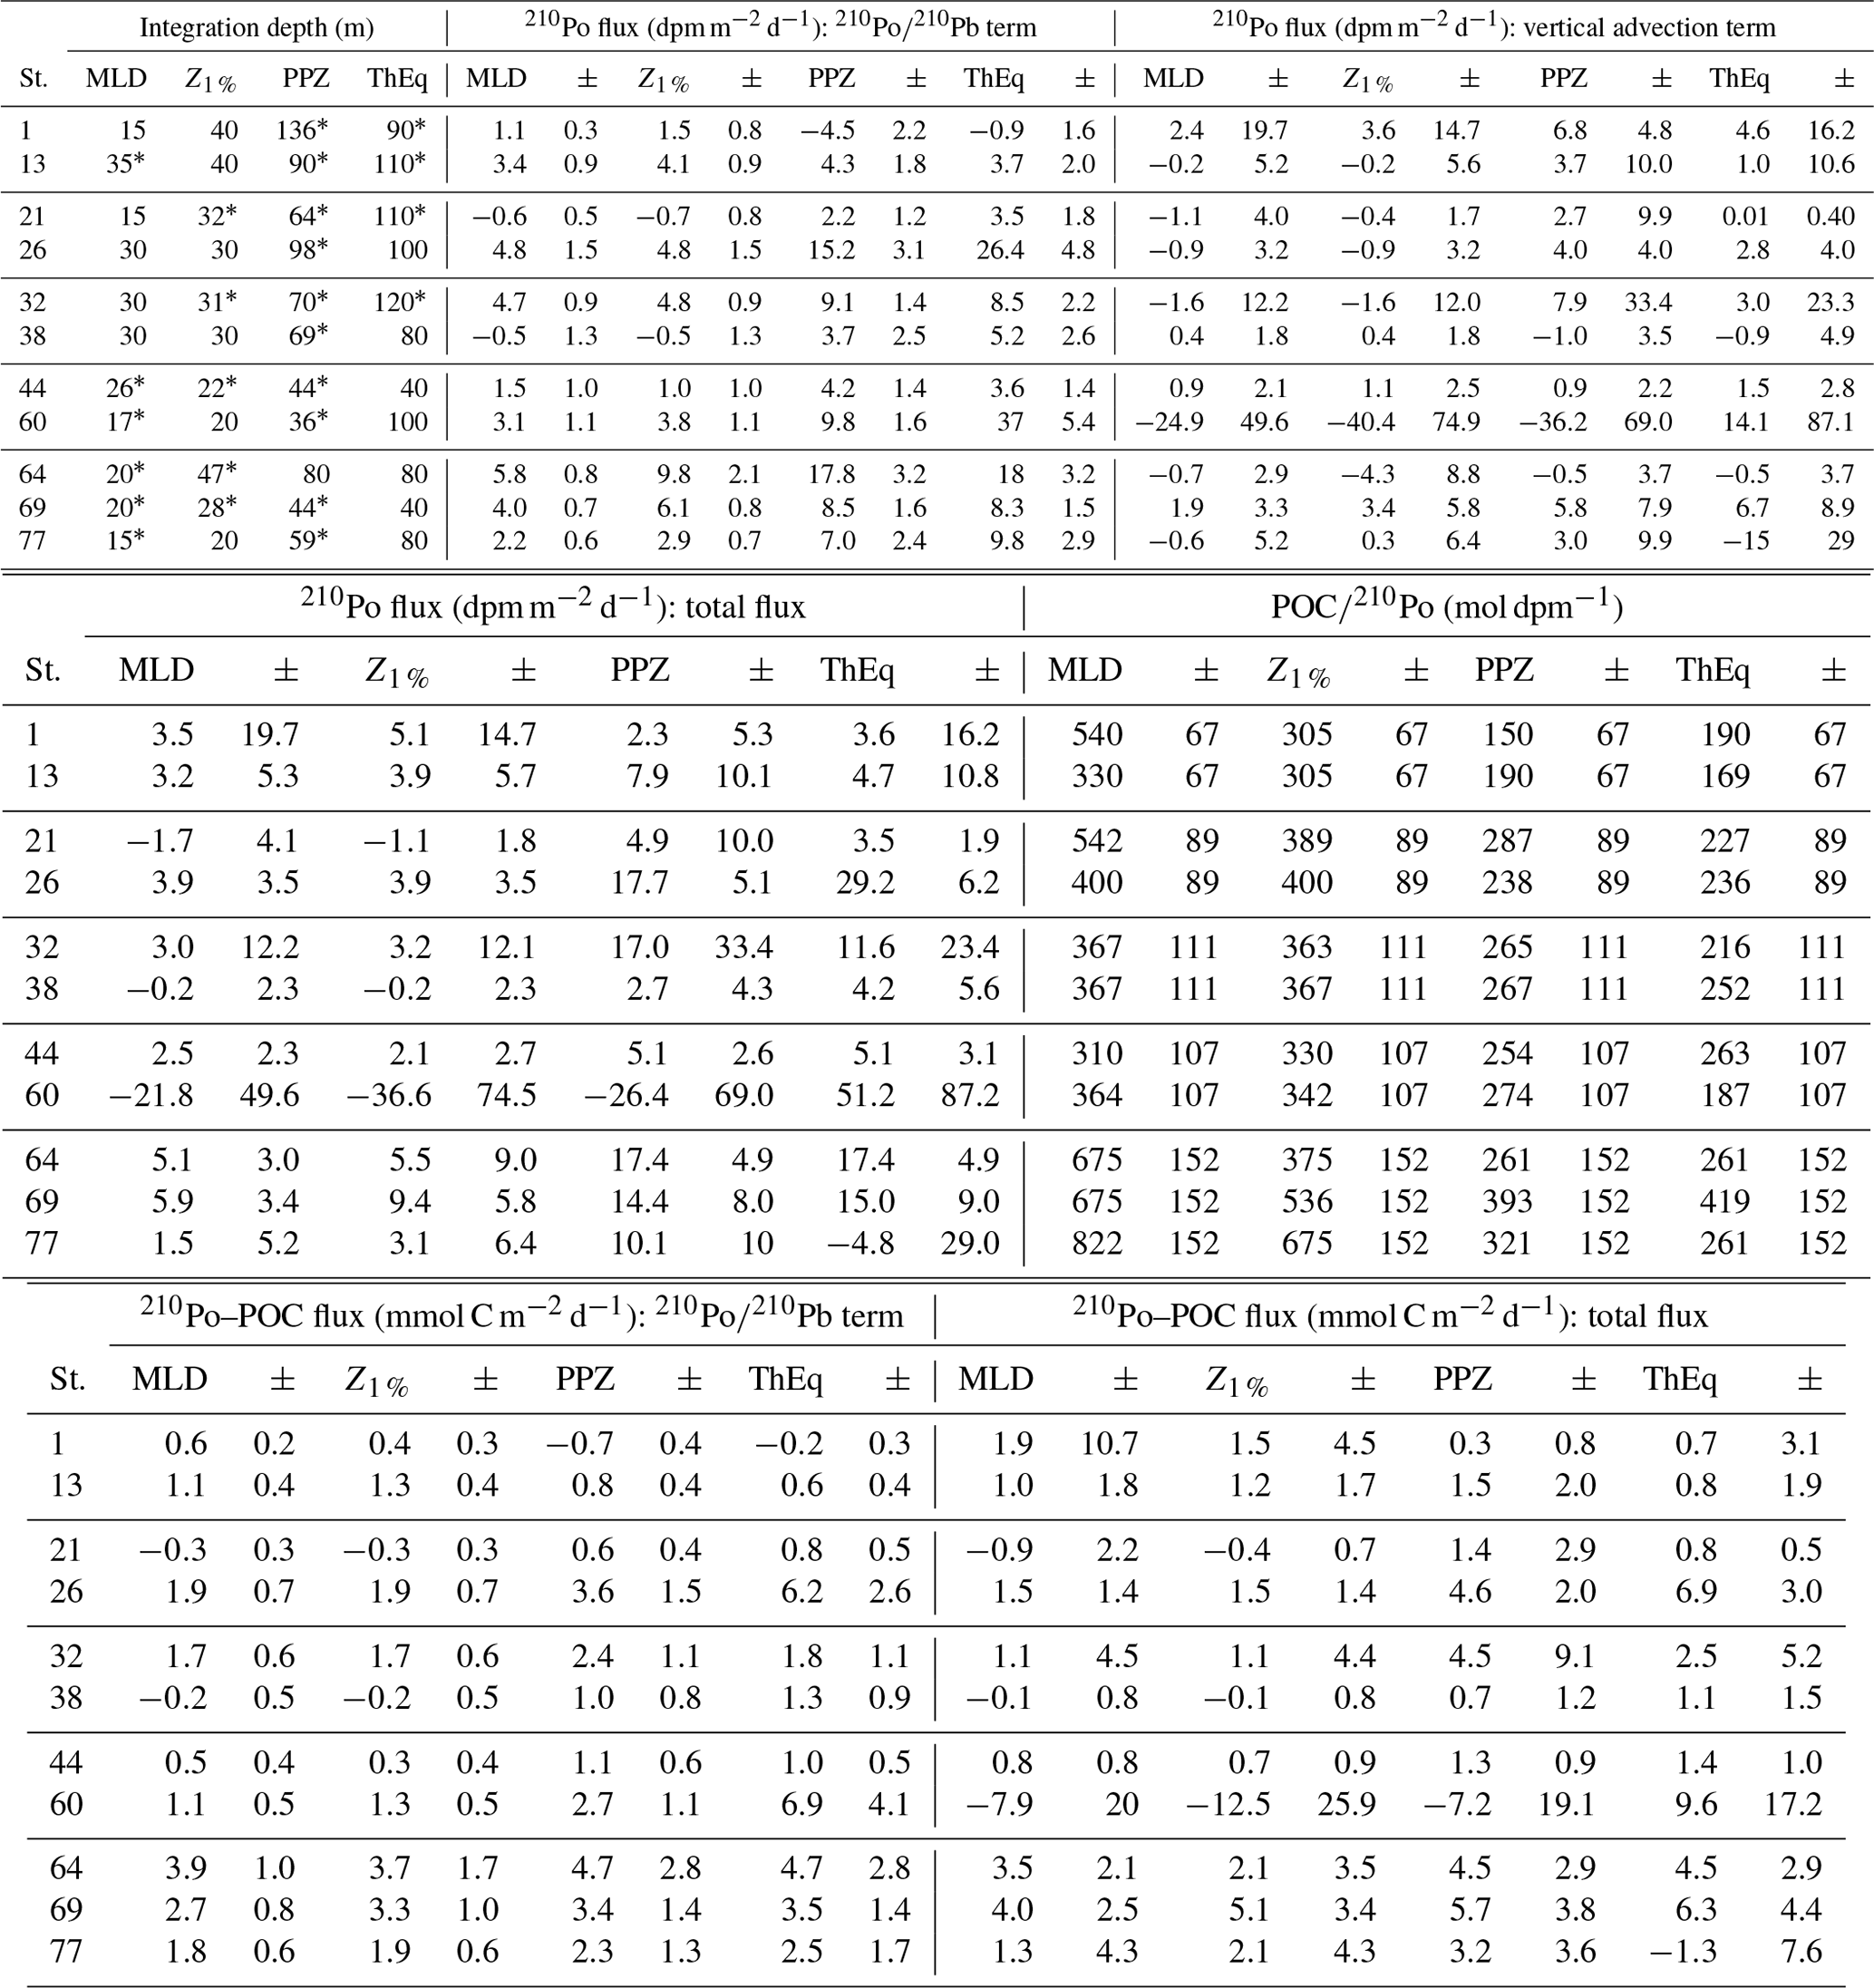
* For the depths at which total radionuclides data are not available, the measured values of total 210Po and 210Pb activities were linearly interpolated at the missing depths.
3.4 The 210Po flux calculated from the deficit of 210Po alone
Using the data of total 210Po and 210Pb activities, the amount of 210Po escaping from the surface ocean via particles (210Po fluxes, dpm m−2 d−1) was calculated using Eq. (2) assuming steady state and ignoring advection and diffusion (Table 2, 210Po∕210Pb term). The 210Po fluxes were negligible or very low at stations 1, 21, and 38. At the other stations the 210Po fluxes averaged 3.7±1.4, 4.6±2.6, 9.5±4.9, and 14.4±12 dpm m−2 d−1 at the MLD, Z1 %, PPZ, and ThEq, respectively. The 210Po fluxes tended to increase with depth at 7 out of 11 stations (26, 38, 44, 60, 64, 69, and 77). At the MLD, Z1 % and PPZ, the largest 210Po fluxes were all found in the Labrador Basin. The other four basins had relatively similar 210Po export fluxes (2.1–2.8 dpm m−2 d−1) at the MLD and Z1 %. The West European Basin had much higher 210Po flux (8.7 dpm m−2 d−1) relative to that in the Iberian Basin (−0.1 dpm m−2 d−1) at the PPZ. At the ThEq, on the other hand, the Irminger Sea had the highest 210Po fluxes followed by the West European Basin. The lowest 210Po fluxes at all investigated depths were generally found in the Iberian Basin.
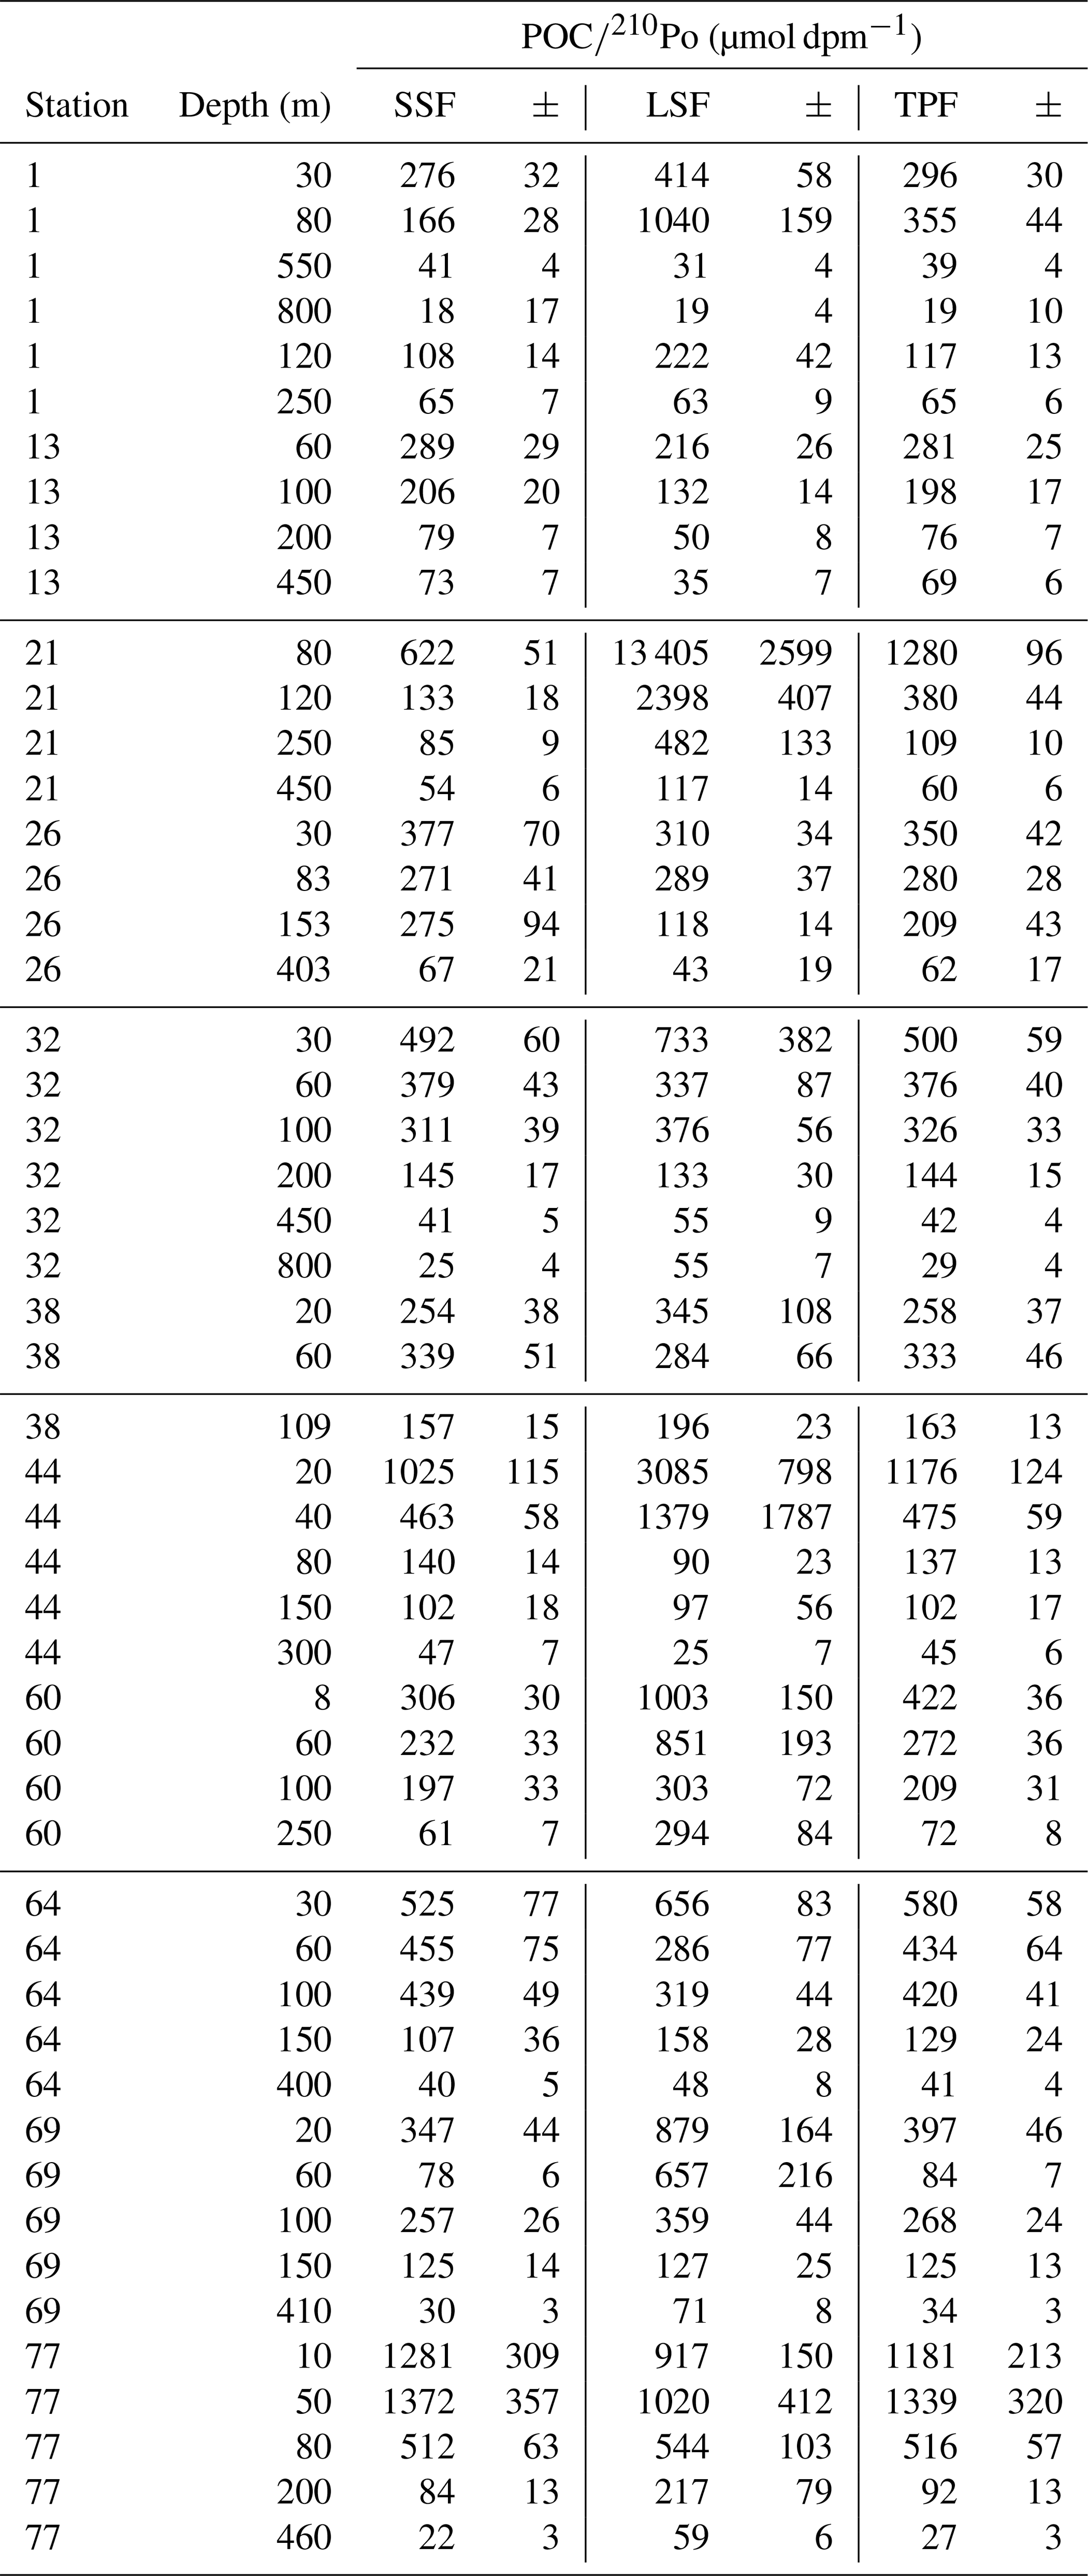
Table 3The ratio of POC concentration to 210Po activity (POC∕210Po) in the particles collected by in situ pumps. SSF is small-size fraction (1–53 µm); LSF is large-size fraction (> 53 µm); TPF is total particulate fraction (> 1 µm).
3.5 POC∕210Po ratios in particles
Most of the ratios of POC concentration to 210Po activity (µmol dpm−1) in the large-size fraction of particles (POC∕210Po_LSF, > 53 µm) were comparable to or higher than those in the small-size fraction (POC∕210Po_SSF, 1–53 µm), although a few samples at stations 13, 26, 44, 64, and 77 had lower values of POC∕210Po_LSF than those of POC∕210Po_SSF (Table 3, Fig. 4a). The POC∕210Po ratio in the total particles (> 1 µm, the combination of small and large particles, POC∕210Po_TPF) was similar to that in the small particles (SSF), within about 97 % (Table 3, Fig. 4b). This is because over 80 % of the particulate 210Po activity was associated with the small-size fraction (Tang et al., 2018) likely due to the large surface area of abundant small particles. Because of the possible link between small particles and export along the transect discussed in Sect. 3.1, and the results that scavenging of 210Po was governed by the small particles (Tang et al., 2018), we propose to use this total particulate fraction in addition to the more commonly used large-size fraction to calculate POC export along this cruise track.
The POC∕210Po in total particles (POC∕210Po_TPF) varied from 19 to 1300 µmol dpm−1 with a mean of 290±320 µmol dpm−1 (n=51, upper 800 m). The variability of POC∕210Po_TPF ratios in this study is in line with previous observations in the Antarctic Circumpolar Current (300–1200 µmol dpm−1 for particles > 1 µm) (Friedrich and Rutgers van der Loeff, 2002) and the central Arctic (90–1900 µmol dpm−1 for particles > 53 µm) (Roca-Martí et al., 2016). The average ratio of 290 µmol dpm−1 is comparable to those observed in the central equatorial Pacific (202±90 µmol dpm−1 for particles > 0.45 µm) (Murray et al., 2005), the North Atlantic (290±70 µmol dpm−1 for particles > 1 µm) (Rigaud et al., 2015), and the South Atlantic (113±80 µmol dpm−1 for particles > 0.7 µm) (Sarin et al., 1999).
The measured POC∕210Po ratios in total particles at each station and depth were grouped into the five basins and fitted against depth using a single power law function in each basin (Fig. 5). The fit equations were used to calculate total particulate POC∕210Po ratios at the investigated depths at each station (Table 3).
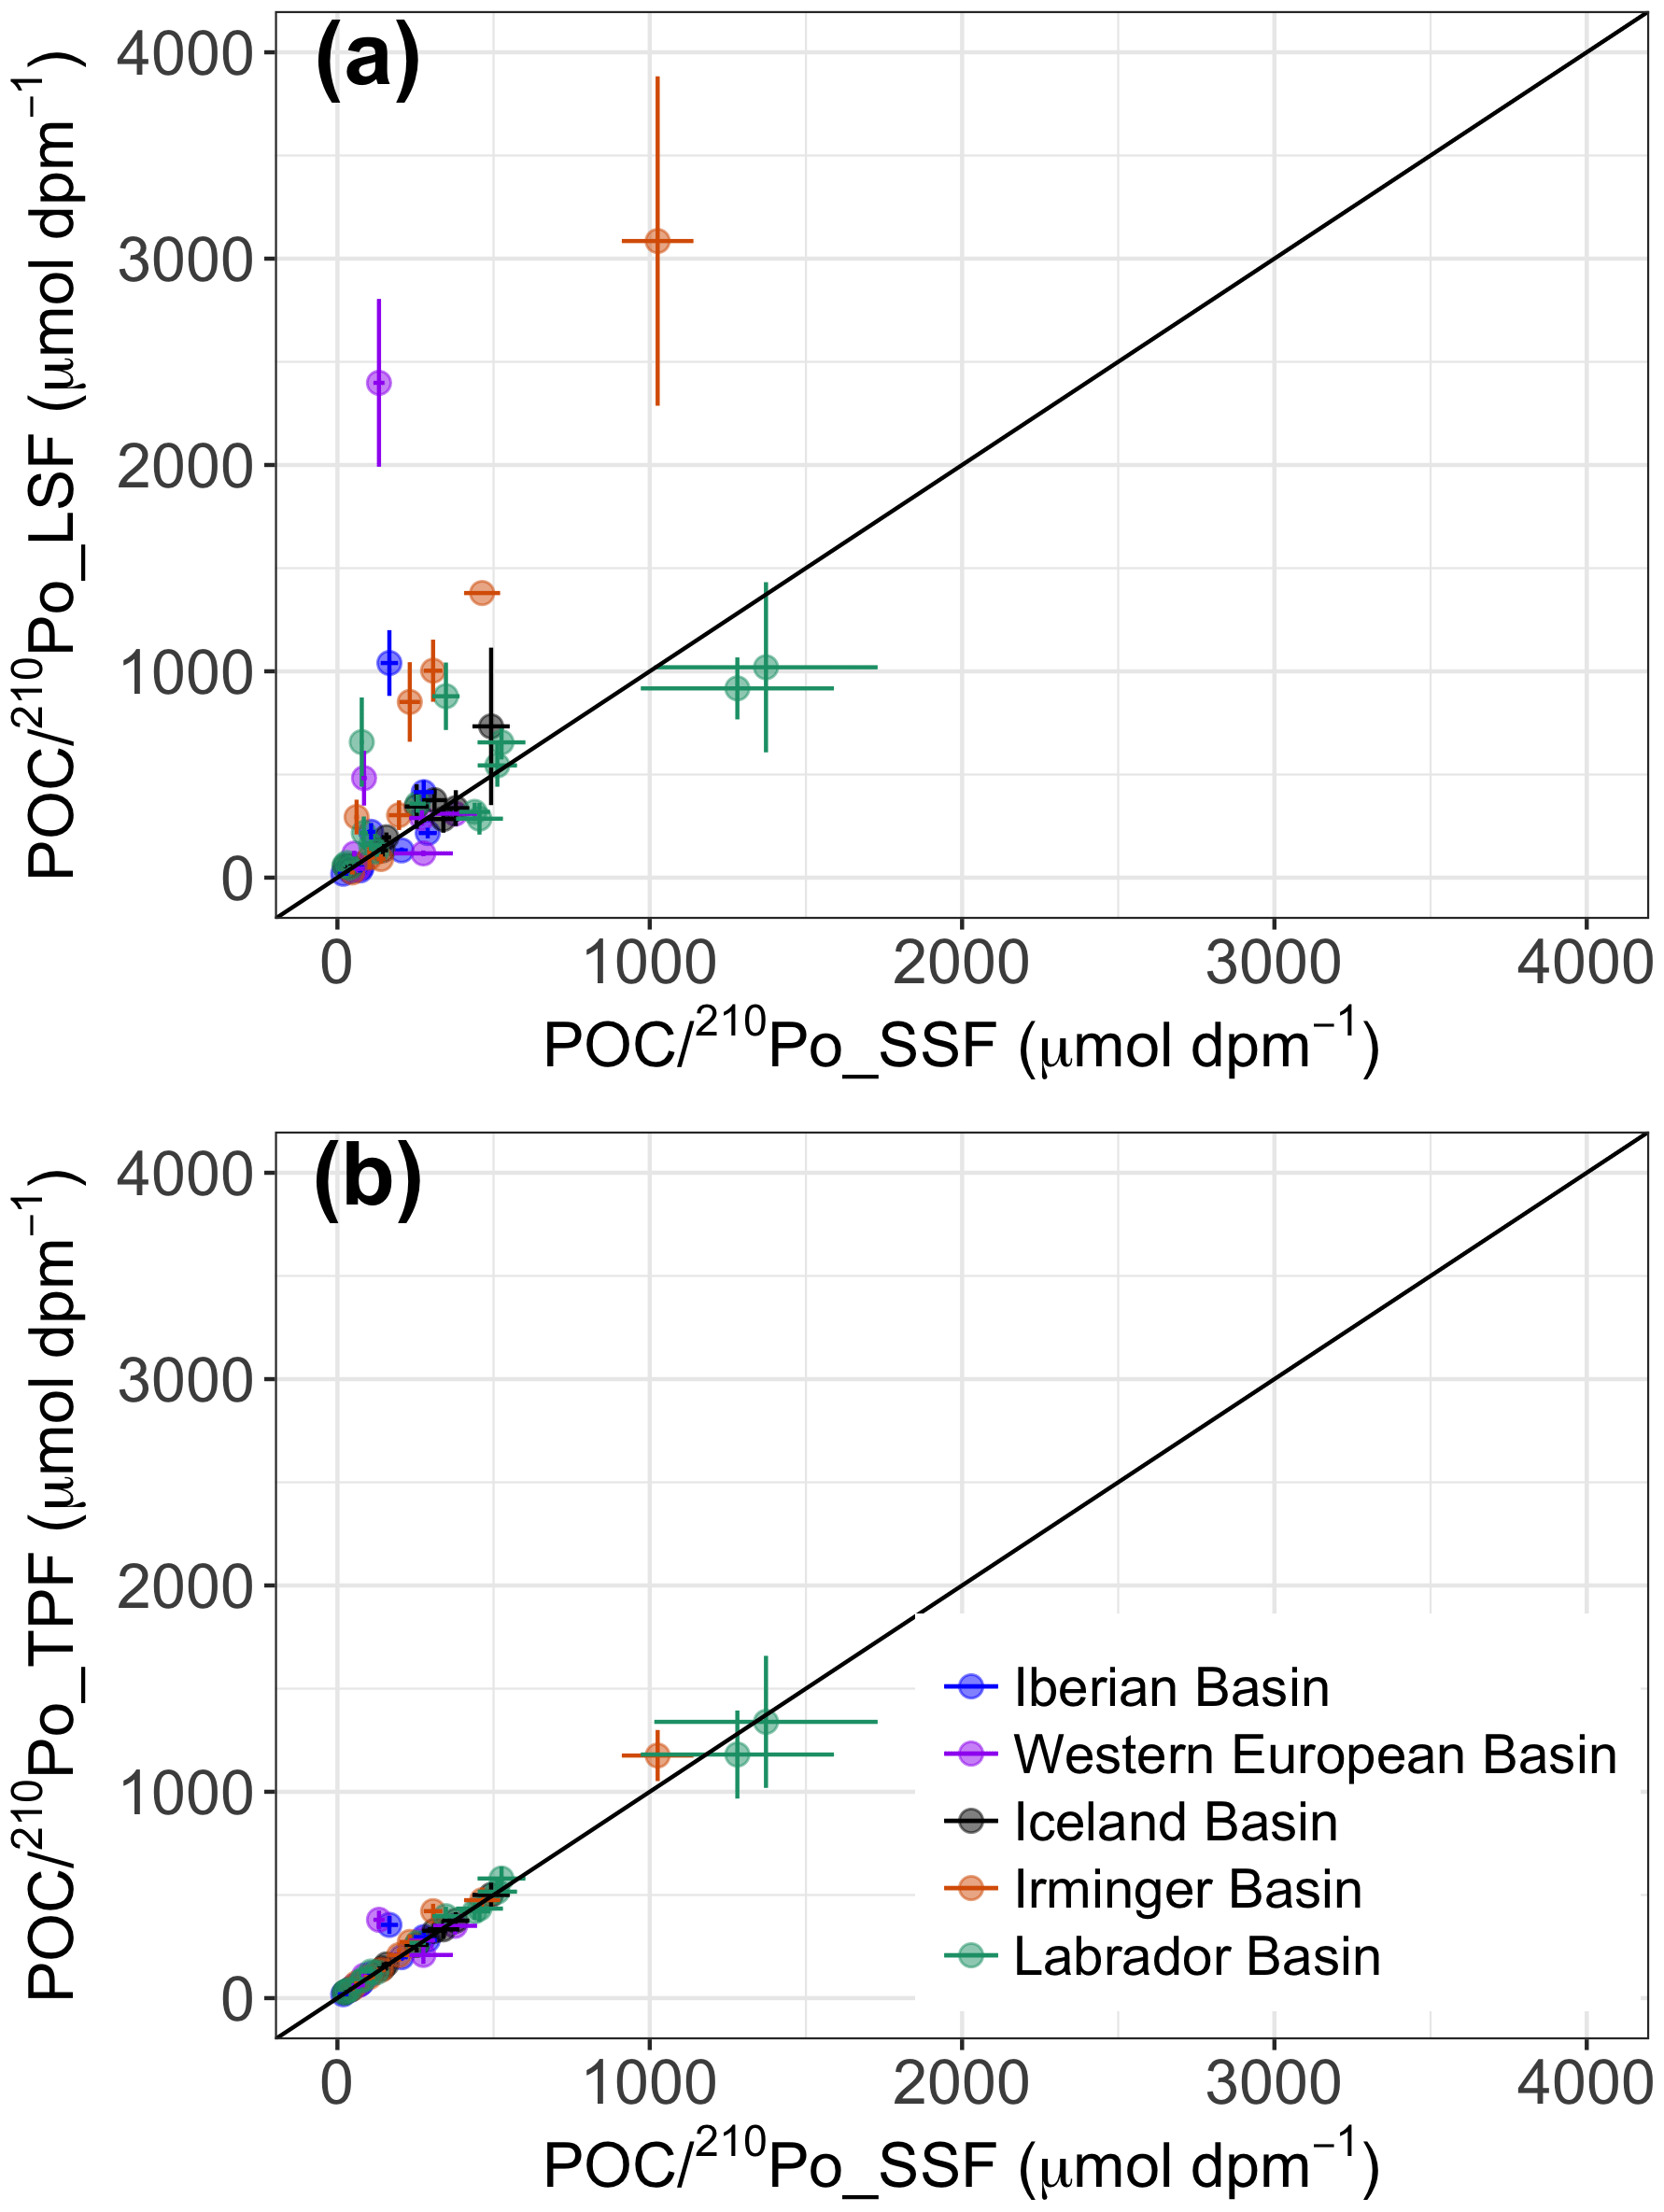
Figure 4Plots of the ratios of POC concentration to 210Po activity in (a) the large (> 53 µm) particles (POC∕210Po_LSF) against the small (1–53 µm) particles (POC∕210Po_SSF), and in (b) the total (> 1 µm) particles (POC∕210Po_TPF) against the small particles. The black lines indicate the 1:1 line.
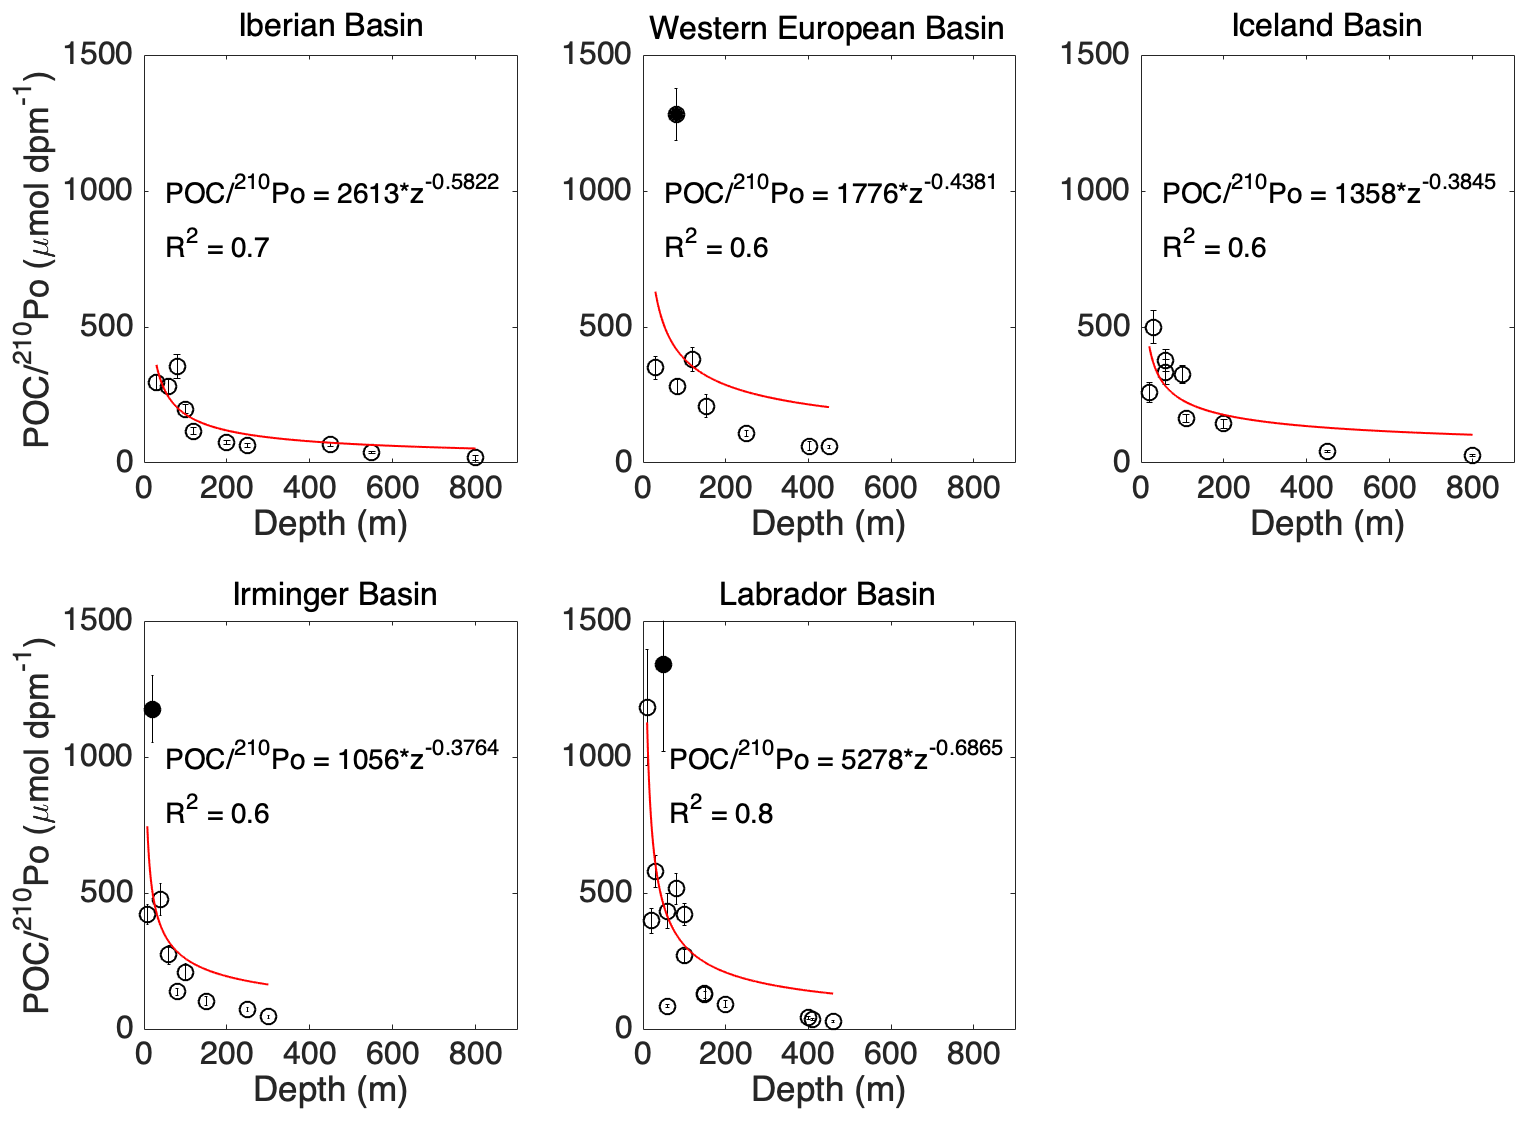
Figure 5The ratios of POC concentration to 210Po activity in the total particles vs. depth in each basin along the GA01 transect. Power law regression (red line) was fitted for POC∕210Po against depth in each plot: the Iberian Basin (stations 1, 13), West European Basin (stations 21, 26), Iceland Basin (stations 32, 38), Irminger Basin (stations 44, 60), and Labrador Basin (stations 64, 69, 77). The data points denoted as filled by black circles were outliers (points at a distance greater than 1.5 standard deviations from the power law model) and excluded from the power law regression.
4.1 Physical advection effects on 210Po export fluxes
In the study region, there were consistent patterns of circulation traveling through and near our sampling sites during the GEOVIDE cruise. From east to west the cruise track crossed the North Atlantic Current, the East Reykjanes Ridge Current, the Irminger Current, the Irminger Gyre, the eastern and western boundary currents and the Labrador Current (Fig. 1 in García-Ibáñez et al., 2018). Additionally, short-lived eddies and fronts were also observed during the cruise, particularly in the OVIDE section from Portugal to Greenland (García-Ibáñez et al., 2018; Zunino et al., 2017). In this dynamic region advective influences may be important to include in calculations of 210Po export. Despite this knowledge, we could not include horizontal advection in our model because the horizontal resolution of our sample sites was not sufficient to constrain reliable horizontal gradients of 210Po activity in the study region. This assumption of negligible horizontal physical transport has been made in most 210Po studies because of a similar lack of spatial resolution (e.g., Kim and Church, 2001; Stewart et al., 2010; Rigaud et al., 2015), and may be justified in some open-ocean settings where horizontal gradients in 210Po activity are small (e.g., Wei et al., 2011). For more dynamic regimes, such as along the GA01 transect, however, this assumption needs to be carefully evaluated, and the relative importance of advective 210Po flux should be assessed if possible.
We did, however, have enough sampling depths at each station to assess the vertical variability in 210Po activity and to estimate the impact of vertical advection on the 210Po flux. The range of 210Po activity flux due to vertical advection (−40 to 14 dpm m−2 d−1, Table 2) was of the same magnitude as the steady-state fluxes calculated from the deficit alone (−5 to 37 dpm m−2 d−1, Table 2). The magnitude of the uncertainty of the 210Po export flux due to vertical advection was influenced by the large variance in vertical velocity field mentioned in Sect. 3.2. When excluding the three depths at stations 13 and 21, where the monthly vertical velocity average had substantial standard deviations (an order of magnitude greater than w20), the uncertainty of the 210Po export flux was on average 2-fold larger than the calculated 210Po export flux. The largest positive vertical advective 210Po fluxes were at station 1, where the Iberian upwelling increased the calculated flux by 150 %–500 %. The largest negative vertical advective 210Po fluxes were seen at station 60 where upwelling decreased the 210Po flux by 370 %–1100 % at the depths of the MLD, Z1 %, and PPZ. This is because the upwelling velocity was high at those depths (14–3 m s−1, Table 1) and the upwelled water was depleted in 210Po activity. The vertical advective transport was smaller at the MLD and Z1 % at station 13, at the ThEq at station 21, and at the PPZ and ThEq at station 64, with contributions lower than 6 % of the total 210Po fluxes. Including vertical advection in our flux estimates at all other depths, however, increased or decreased the 210Po fluxes by 10 %–180 %. Like with vertical advection, neglecting horizontal advection can result in either an underestimate or overestimate of 210Po export flux depending on whether the advected water is enriched or depleted in 210Po. However, because our study region was characterized by distinct water masses separated over tens to hundreds of meters in the vertical plane, whereas those same water masses covered huge distances (hundreds to thousands of kilometers) in the horizontal plane (Fig. 4 in García-Ibáñez et al., 2018), vertical advection would most likely result in more change in physical and chemical parameters over the scale of sampling than horizontal advection would. Because the advective 210Po export flux was calculated as the product of the velocity of the water mass and the gradient of 210Po activity in the corresponding direction, horizontal advection would most likely contribute a much smaller range of advective 210Po flux estimates.
Overall, the influence of physical advection on 210Po activity may range from relatively unimportant to dominant depending on the study area. In this study, we observed physical processes influencing 210Po fluxes, in particular at stations 1 and 60. For future studies of 210Po and 210Pb activity in regions of established upwelling or ocean margins, we suggest designing the sampling plan so that the magnitude and variability of these processes may be incorporated into 210Po export models. At ocean margins, in particular, more water samples should be taken to improve the resolution of horizontal features.
4.2 Non-steady-state effects on 210Po export fluxes
To our knowledge, three time-series studies of 210Po and 210Pb activities have been conducted to date and have assessed the NSS effects on 210Po fluxes. First, in the upper 500 m of the Sargasso Sea, Kim and Church (2001) found that the SS model may have overestimated and underestimated the 210Po export fluxes in May and July 1997, respectively. Second, at the DYFAMED site of the northwestern Mediterranean Sea, the term accounted for ∼50 % of 210Po flux estimated by using the SS model (Stewart et al., 2007). Last, in the South China Sea, the 210Po export fluxes at 1000 m calculated from the SS and NSS models had similar values within the uncertainties (Wei et al., 2014). In fact, the SS model generally results in an underestimation of the 210Po flux under conditions of decreasing 210Po activity in the water column (i.e., when blooms switch from the productive phase to the export phase), whereas the SS model overestimates the flux for conditions of increasing 210Po activity (i.e., high atmospheric deposition).

Figure 6Time-series (1 January–12 July 2014) satellite estimates of net primary production (NPP) between 1 January and 12 July in 2014 at each station along the GA01 transect (VPGM algorithm, http://www.science.oregonstate.edu/ocean.productivity/, last access: 18 January 2019). The shaded rectangle in each plot denotes NPP for about 2 months prior to the sampling date. Two months of NPP data are needed because this timescale could ensure the sensitivity for NSS estimates (Friedrich and Rutgers van der Loeff, 2002; Stewart et al., 2007). The vertical red line in each plot indicates the sampling date at each station.
Atmospheric aerosol deposition along the GA01 transect was reportedly low without the significant influence of the Saharan plume (Shelley et al., 2017). The influence of atmospheric deposition on the SS estimates obtained in this study, therefore, can be ignored. However, it is important to assess the term that was associated with the site-specific bloom events during the cruise. Satellite estimates of net primary production (VGPM model) for the eight 8-day periods prior to the sampling date (∼2 months) were calculated at each station (Fig. 6). Two months of NPP data are needed because such a timescale could ensure the sensitivity for NSS estimates (Friedrich and Rutgers van der Loeff, 2002; Stewart et al., 2007). NPP values for the 2-month period were in the ranges of 51–184, 39–403, 22–131, 18–204, 16–210 mmol C m−2 d−1 in the Iberian Basin, the West European Basin, the Iceland Basin, the Irminger Basin, and the Labrador Basin, respectively, indicating the occurrence of blooms during this time period along the transect that might have influenced the 210Po fluxes derived from Eq. (1).
SS may have underestimated the 210Po export along the GA01 transect depending on the stage of the bloom before sampling. For example, at station 21 the largest NPP peak (403 mmol C m−2 d−1) occurred 2 weeks before our sampling date and diminished rapidly (∼100 mmol C m−2 d−1 at sampling time). The combination of high phytoplankton export and a sudden decrease in NPP may have significantly lowered the 210Po activity in the upper waters, resulting in a negative , and thus the SS model may have underestimated the true 210Po flux. Temporal variations were also seen in the time-series phytoplankton community composition, in particular at stations 1 and 13 (Fig. 2). Both stations were dominated (> 60 %) by coccolithophores between October 2013 and July 2014, but appeared to have a diatom bloom in April 2014 before sampling. Polonium-210 and 210Pb tend to bind to specific biopolymeric functional groups, leading to fractionation during their sorption onto particles (Quigley et al., 2002; Chuang et al., 2013; Yang et al., 2013). The temporal variation of phytoplankton composition could therefore also lead to non-steady-state effects on the overall 210Po activity balance, which are difficult to assess but deserve more attention.
The NSS effect on the 234Th fluxes at the ThEq were evaluated during the same cruise along the GA01 transect in Lemaitre et al. (2018) by using the NSS model developed in Savoye et al. (2006). Because the cruise plan did not allow an opportunity to reoccupy the study areas over time, the authors made the assumption that 234Th activity was in equilibrium with 238U activity at the starting date of the bloom. Their results suggested that the NSS 234Th fluxes were about 1.1 to 1.3 times higher than the SS estimates in the Iberian and West European basins, and 1.4 to 2.1 times higher in the Iceland, Irminger, and the Labrador basins. We did not attempt to apply the same technique to estimate NSS 210Po fluxes in this study because the assumption of equilibrium between 210Po activity and 210Pb activity at the starting date of the bloom may be inappropriate and the 210Po deficit integrates over a longer time period (months) than a typical bloom event (days to weeks).
4.3 POC flux calculated from 210Po flux
The POC export fluxes were calculated by multiplying both the 210Po export fluxes calculated from the deficit alone (SS without advection) and the total 210Po fluxes (sum of the fluxes calculated from the 210Po deficit and vertical advection) by the total particulate (> 1 µm) POC∕210Po ratios at the corresponding depths (Table 2, Fig. 7). The POC fluxes calculated from only the deficit term and the total term ranged from negligible to 7 mmol C m−2 d−1 and from negative to 10 mmol C m−2 d−1, respectively. This is in good agreement with the SS fluxes derived via the 210Po∕210Pb method ignoring advection in other regions of the world ocean (negligible to 8.5 mmol C m−2 d−1) (e.g., Shimmield et al., 1995; Sarin et al., 1999; Kim and Church, 2001; Stewart et al., 2007; Verdeny et al., 2008; Roca-Martí et al., 2016; Subha Anand et al., 2017).
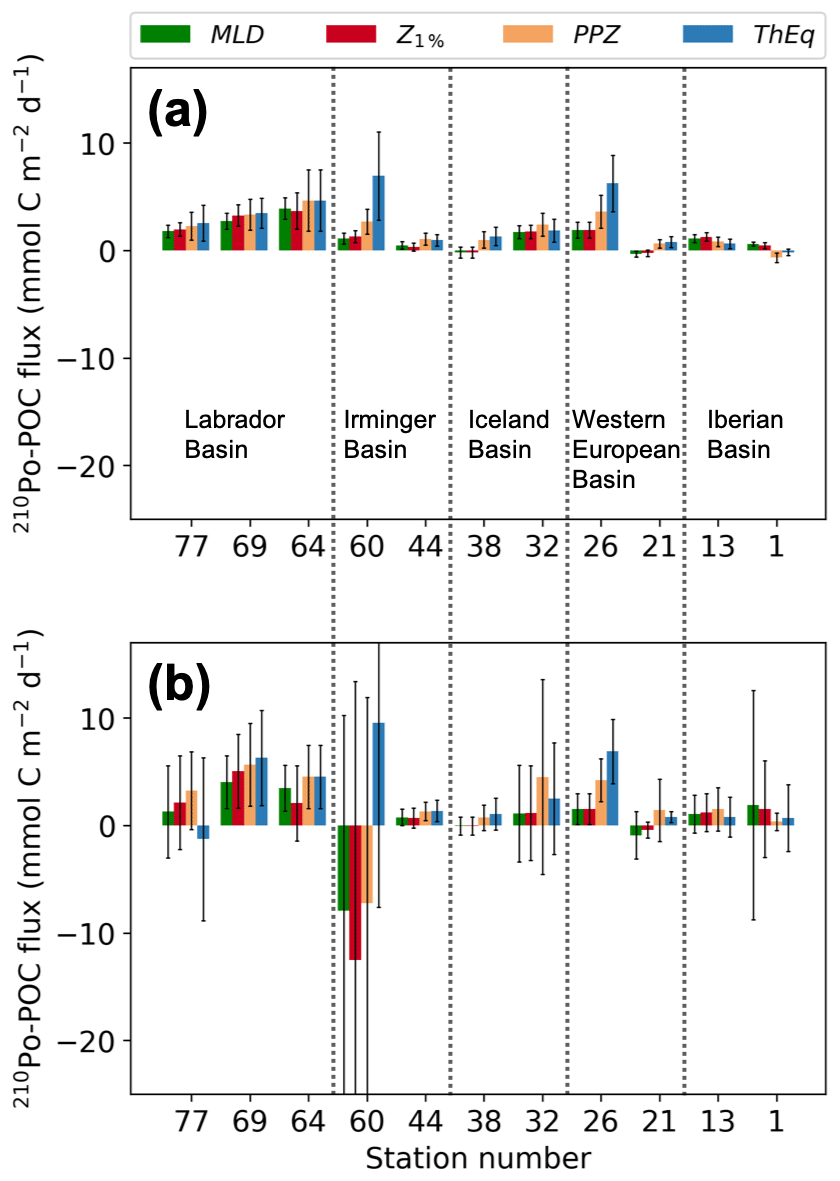
Figure 7POC fluxes derived from 210Po for the mixed-layer depth (MLD), the base of the euphotic zone (Z1 %), the base of the primary production zone (PPZ), and the 234Th-238U equilibrium depth (ThEq). (a) POC fluxes derived from the 210Po fluxes that were calculated from the deficit alone; (b) POC fluxes derived from the sum of the 210Po fluxes that were calculated from the 210Po deficit and vertical advective flux. Note that the > 1 µm particles were used to calculate the POC∕210Po ratios. The stations were plotted from west to east.
The highest-estimated POC fluxes (Table 2) along the transect were observed at most of the investigated depths in the Labrador Sea and at the Greenland Shelf, whereas the lowest export was in the Iberian and West European basins. An exception to this pattern was found at station 26, where POC flux was actually similar in magnitude to the flux at stations 64 and 69. Station 26 was located in the middle of the Subarctic Front (SAF), a cold and fresh anomaly originating from subpolar water (Zunino et al., 2017). The hydrographic properties associated with the SAF appear to promote high primary production (174±19 mmol C m−2 d−1, Table 1) and subsequently high carbon export (Kemp et al., 2006; Rivière and Pondaven, 2006; Guidi et al., 2007; Waite et al., 2016). While stations on the Greenland Shelf (stations 60 and 64) had the greatest estimated carbon export at the depth of ThEq (5–10 mmol C m−2 d−1), station 60 at the depth of Z1 % had the lowest POC flux (−12.5 to −8.4 mmol C m−2 d−1).
The negligible deficit of 210Po at the MLD and Z1 % seen at stations 21, 38 and 44 leads to negligible 210Po-derived POC fluxes at those depths and stations (Table 2, Fig. 7). The relatively low POC export (negligible – 1.7 mmol C m−2 d−1) at stations 1 and 13, on the other hand, resulted from low particulate POC∕210Po ratios (Table 2). In fact, the Iberian Basin had the lowest measurements of particulate POC∕210Po ratios in both the small- and large-size fractions relative to the other four basins along the transect (Fig. 4). This basin was also the only region along the transect where the phytoplankton community was not dominated by diatoms but by smaller phytoplankton, in particular coccolithophores. Smaller phytoplankton cells could scavenge more 210Po (higher particulate 210Po activity relative to the large particles) due to larger surface area per unit of volume, lowering their ratio of POC concentration to 210Po activity.
4.4 POC export efficiency
The POC export flux calculated from the total 210Po flux at the depth of the PPZ was compared to the satellite-derived NPP over ∼138 days (see Sect. 2.5) at each station, and the ratio was reported as the POC export efficiency.
The export efficiencies in this study were below 10 % at 10 out of 11 stations, averaging 6±4 % (n=10, excluding the negative value at station 60, Fig. 8). Export efficiencies < 10 % observed here were similar to those found in the equatorial Pacific, the Arabian Sea, and at the BATS site (Buesseler, 1998; Subha Anand et al., 2017), but lower than those reported at high-latitude sites (> 25 %), such as the Arctic (Gustafsson and Andersson, 2012; Moran et al., 1997; Roca-Martí et al., 2016), the Bellingshausen Sea (Shimmield et al., 1995), and the Antarctic Polar Front (Rutgers van der Loeff et al., 1997).
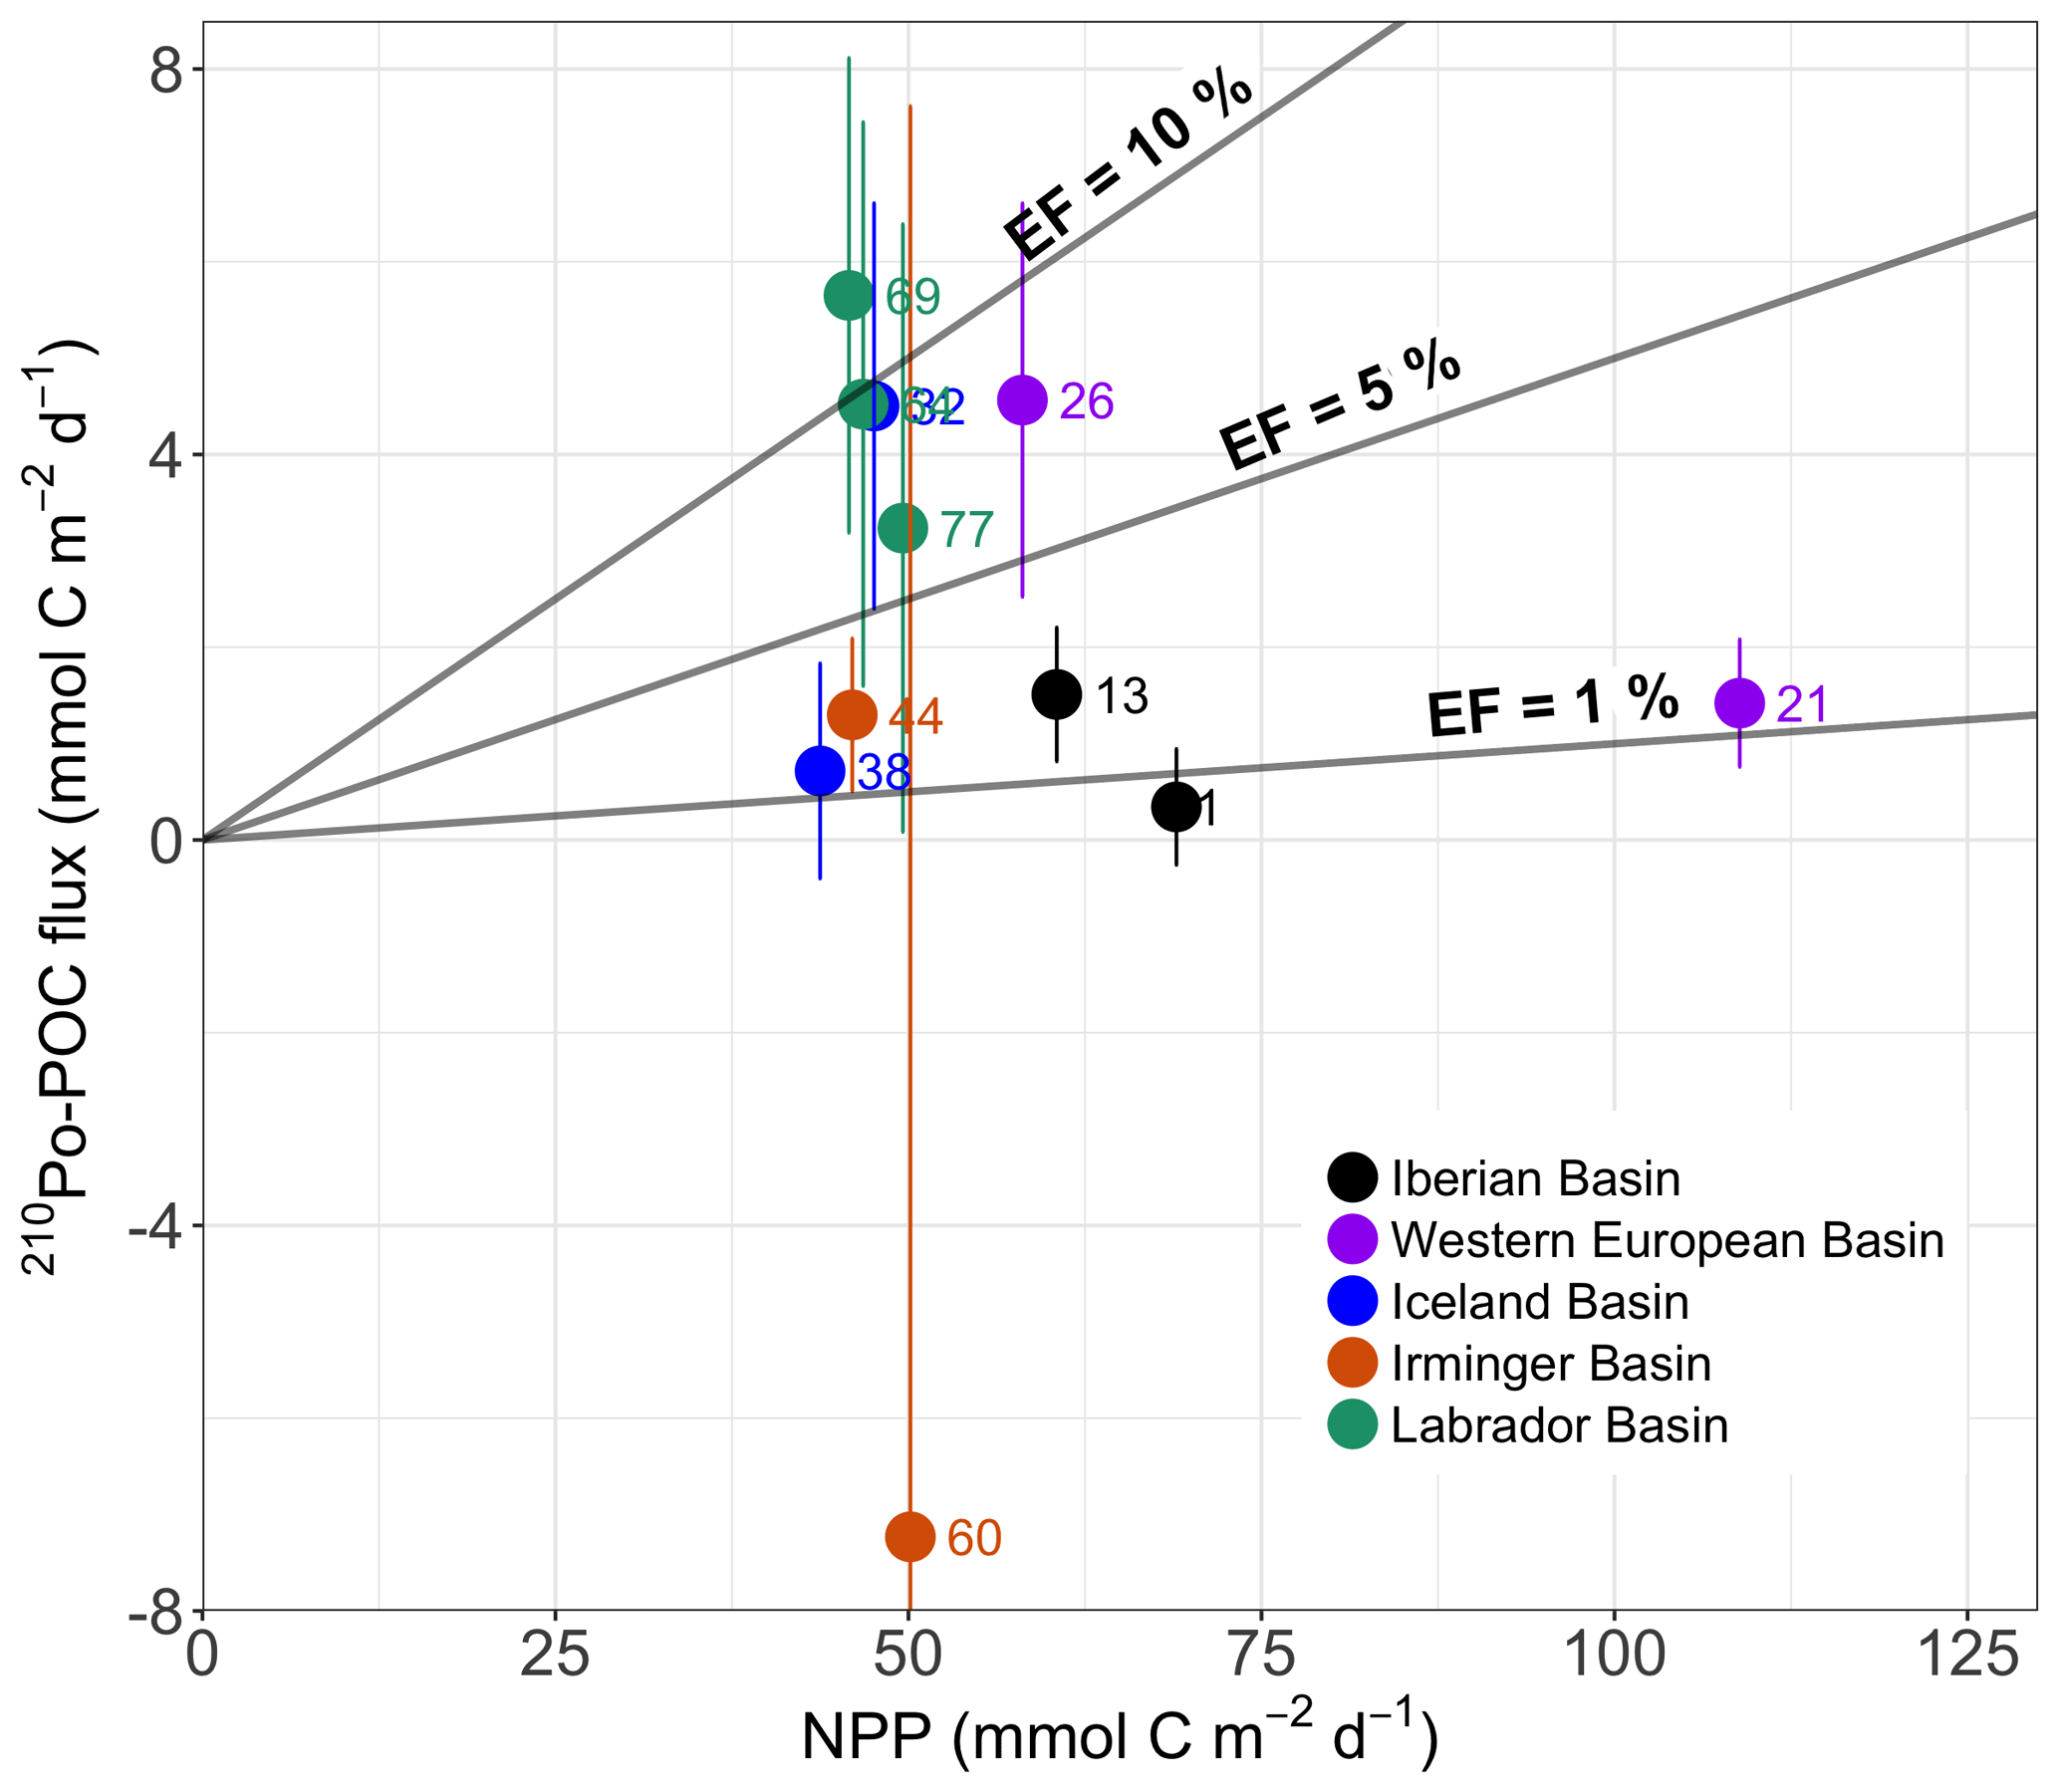
Figure 8Plot of POC export flux derived from the 210Po method (210Po–POC) versus satellite estimates of net primary production (NPP). The NPP values were averaged for the previous 138 days (210Po half-life) prior to the sampling date. The sum of the 210Po fluxes calculated from the 210Po deficit and vertical advective flux, and the POC∕210Po ratios in the > 1 µm particles were used to derive POC fluxes. The 210Po–POC fluxes were integrated within the primary production zone (PPZ). Lines of export efficiency (EF) of 10 %, 5 %, and 1 % are drawn in the plot. The numbers in the plot are station numbers. The colored dots of the stations correspond to the basins.
Export efficiencies ranged from 0.5 % to 2.5 % in the Iberian Basin, while the values in the Irminger Basin (3±3 %, excluding station 60) were similar to the export efficiencies in the Western European Basin (5±5 %) and in the Iceland Basin (6±6 %). The export efficiencies, in contrast, were larger in the Labrador Basin (10±3 %). The lowest export efficiencies observed in the Iberian Basin were consistent with the dominance of smaller phytoplankton species there (coccolithophores and cyanobacteria; Fig. 2). Indeed, small cells are usually slow-sinking particles that are likely more prone to degradation (Villa-Alfageme et al., 2016), leading to lower export efficiencies. Conversely, the higher export efficiencies at other stations, all generally dominated by diatoms (Fig. 2), support the idea that diatoms may be more efficient in exporting POC than smaller phytoplankton (Buesseler, 1998). Differences in export efficiencies between the basins dominated by diatoms suggest that other factors may also play some role (e.g., temporal decoupling between production and export).
The POC export efficiency could also vary widely within the same basin. Taking the two stations in the Western European Basin for instance, export efficiency at station 26 was ∼5-fold greater than that estimated at station 21, likely consistent with a lower contribution of diatoms and a higher contribution of smaller phytoplankton at station 21 relative to those at station 26 (Fig. 2). But overall the time-series composition of the phytoplankton community at the two stations was similar (Fig. 2). The site-specific environment may have impacted the export of the same cell type to different degrees (Durkin et al., 2016). Station 26 was in the middle of the SAF, and the mesoscale physical processes (i.e., turbulence and mixing) at the front can introduce nutrients into the local euphotic zone (Lévy et al., 2012). Large phytoplankton species generally dominate in these nutrients-rich waters and can promote massive episodic particle export (e.g., Kemp et al., 2006; Guidi et al., 2007; Waite et al., 2016).
4.5 Comparison of 210Po and 234Th derived POC fluxes
The measurements of 234Th∕238U disequilibrium to estimate POC export flux were simultaneously carried out during the GEOVIDE cruise (Lemaitre et al., 2018). The authors discussed the influence of vertical advection on 234Th export flux and concluded it can be neglected. In the present study, estimates of 234Th-derived POC (234Th-POC) flux were compared to 210Po-derived POC (210Po–POC) flux. To avoid discrepancies, both the 234Th-POC and 210Po–POC flux estimates were calculated at the depth of ThEq using the POC ∕ radionuclide ratio in total particles > 1 µm (TPF) and large particles > 53 µm (LSF), and both methods ignored physical transport and assumed steady state, where any deviation from secular equilibrium was created by sinking particles with an adsorbed and/or absorbed excess of the short-lived daughter isotope.
4.5.1 210Po flux vs. 234Th flux
The integrated 210Po and 234Th fluxes at the depth of ThEq were compared (Fig. 9). There was a spatial trend of 234Th flux, but not 210Po flux along the transect; 234Th fluxes at stations 1 to 38 (eastern section, 1580±430 dpm m−2 d−1) were significantly greater (Wilcoxon rank sum test, p value < 0.002) than the fluxes at stations 44 to 77 (western section, 710±230 dpm m−2 d−1). The means of the 210Po fluxes in the western and eastern sections were not statistically different from each other (Wilcoxon rank sum test, p value =0.3). However, the flux of 210Po and 234Th correlated with each other better in the western (n=5, R2=0.6) than in the eastern (n=6, R2=0.01) sections.
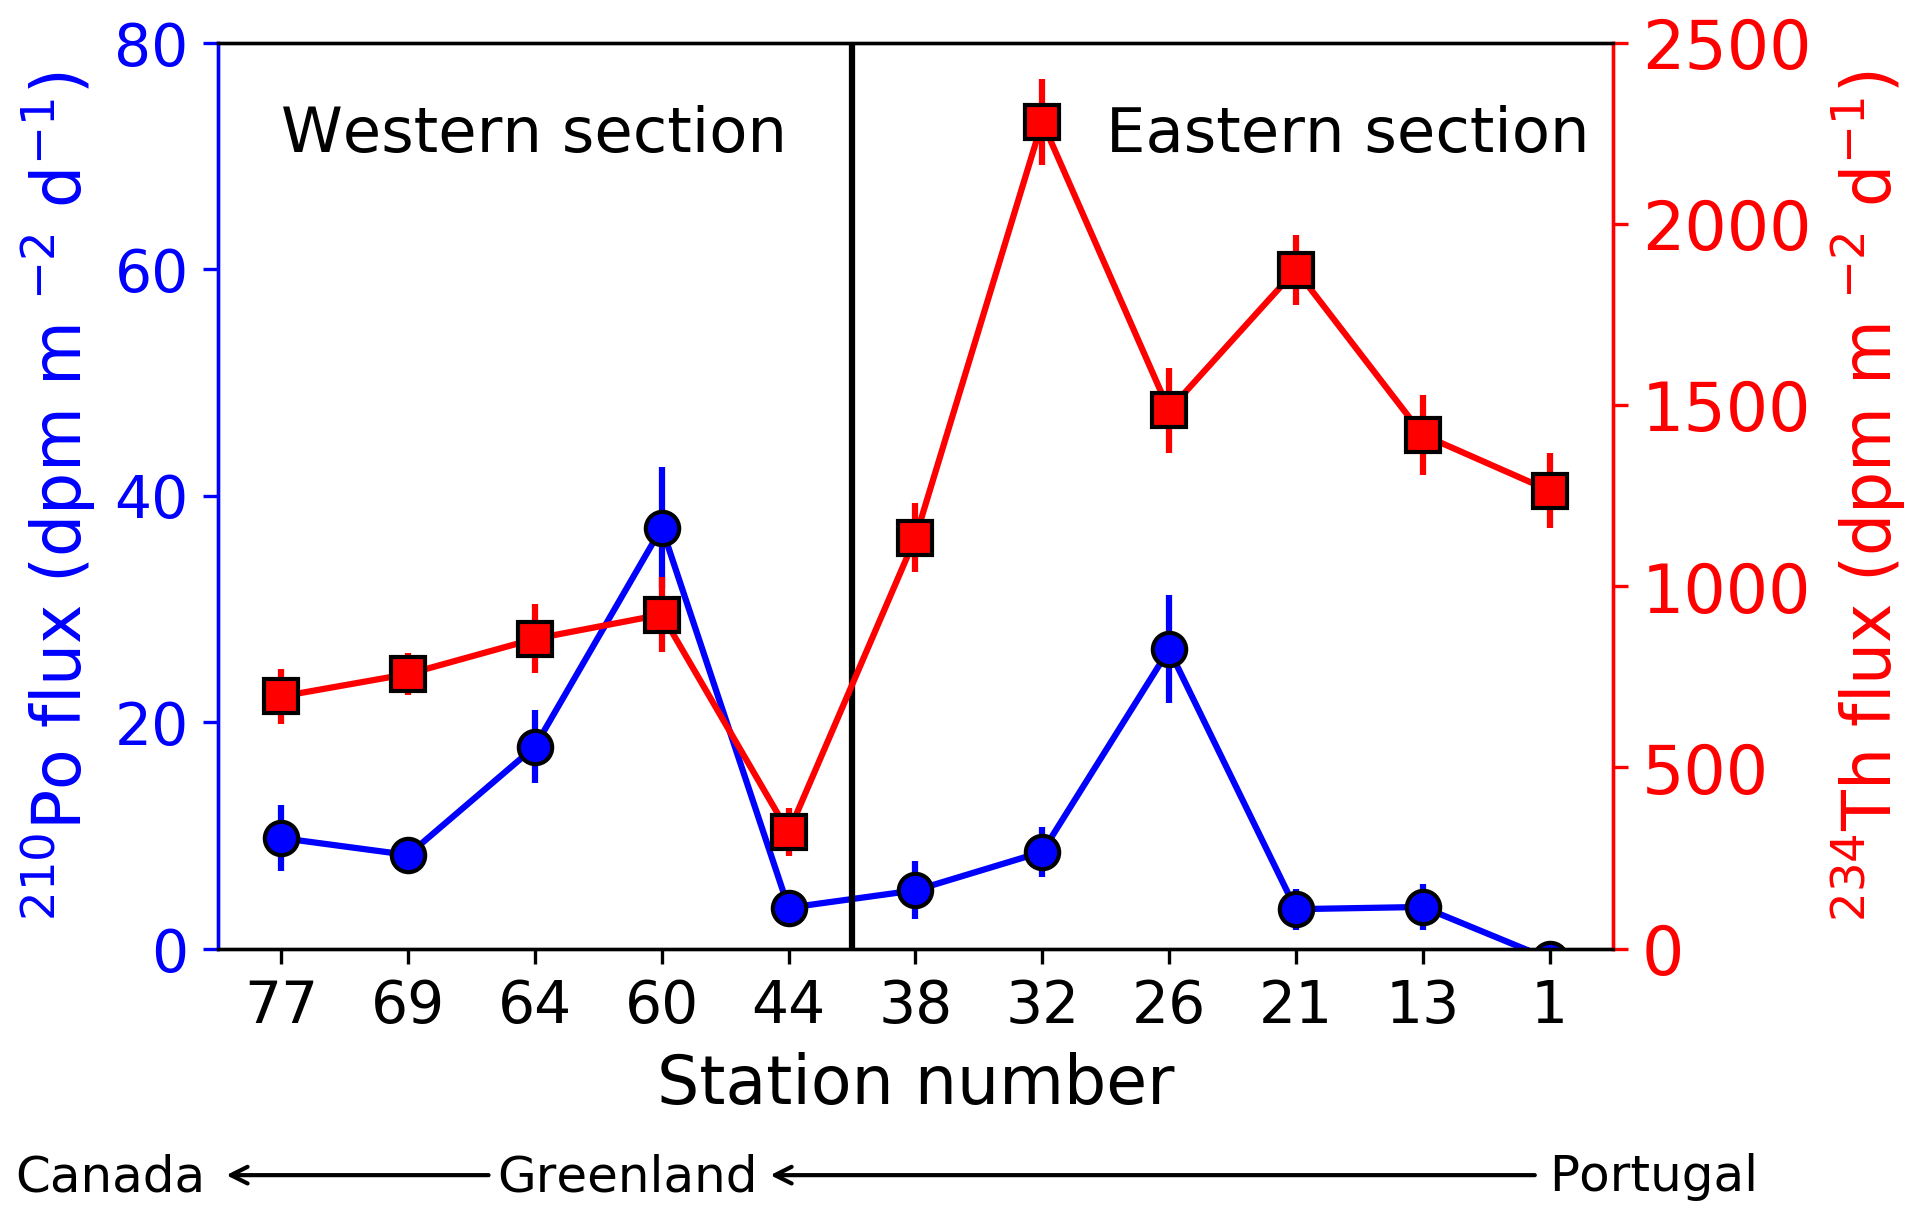
Figure 9Sinking fluxes of 210Po (blue circles) and 234Th (red squares) integrated to the depth at which 234Th activity returned to equilibrium with 238U activity (ThEq), assuming steady state and negligible physical transport along the GA01 transect. Note that the stations are plotted from west to east, and the transect was separated into the western (stations 44–77) and eastern (stations 1–38) sections.
These relationships may be related to both the stage of the bloom and different half-lives of the two isotopes. Indeed, 234Th fluxes integrate the conditions that occurred days to weeks prior to the sampling date, while the 210Po method integrates the flux over the past few months. Within the Iberian Basin, stations 1 and 13 were sampled weeks to months after the bloom development (Fig. 6). The moderate to relatively high 234Th fluxes are thus surprising. Lemaitre et al. (2018) argue that the greater fluxes there might be related to the proximity of the Iberian margin, where particle dynamics were intense and lithogenic particles were numerous (Gourain et al., 2018). A temporal decoupling between production and export could be an alternative possibility. The Western European and Icelandic basins were sampled during bloom development, and the NPP peaks occurring just before sampling may have promoted the high fluxes. In fact, these basins have been characterized by the presence of fast-sinking particles during the bloom (Villa-Alfageme et al., 2016), likely also explaining the high export. In contrast, the lower export observed in the western section may be due to the fact that the sampling occurred during the decline of the bloom, probably with a decoupling between production and export in the Labrador Basin, or during a particle retention event in the Irminger Basin.
Unlike the observations of higher 234Th export flux in the eastern than western sections, there were no significant differences in 210Po export flux between the two sections. This observation supports the argument that the 210Po deficit tends to smooth out episodic events due to integration over longer time periods. The 210Po deficit records seasonal changes in export fluxes, whereas the 234Th deficit represents more recent changes in the water column (Verdeny et al., 2009; Hayes et al., 2018). Indeed, the 210Po deficit integrates the flux over months that include a period of lower flux prior to the bloom along the GA01 transect, whereas the 234Th deficit integrates the flux only over weeks that include the bloom itself at most of the stations (Fig. 6). Therefore, the specific stage of the bloom shortly prior to the sampling date appears to have less influence on the 210Po-derived than the 234Th-derived export flux along this transect.
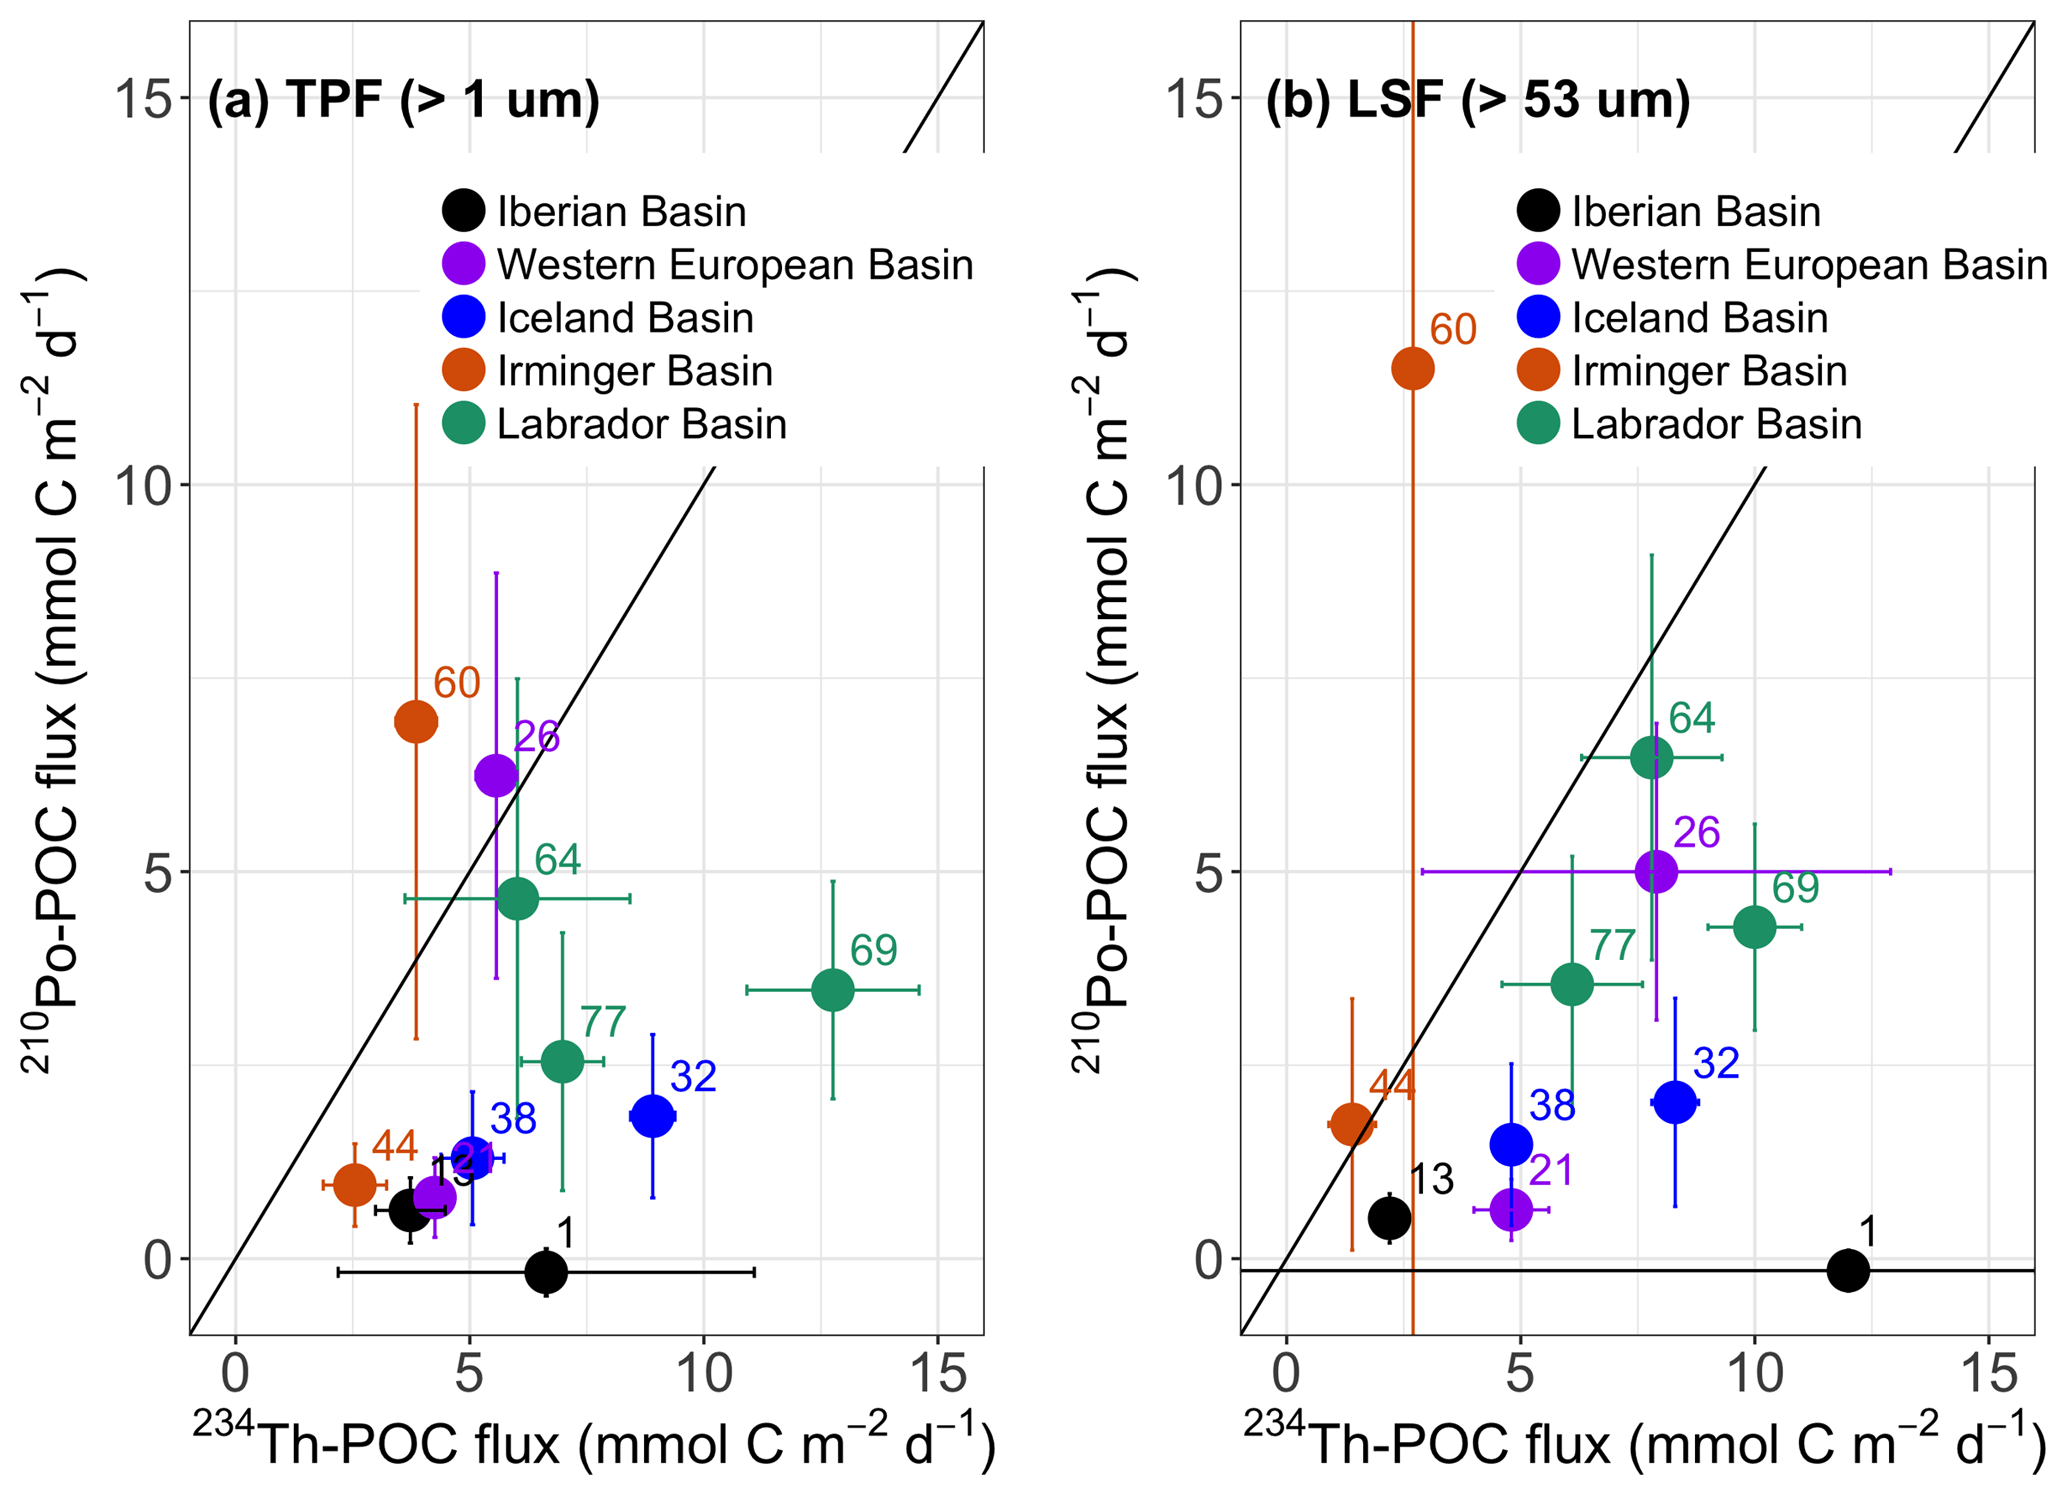
Figure 10Plot of the POC flux derived from 210Po (210Po–POC) versus the POC flux derived from 234Th (234Th-POC) at 11 stations along the GA01 transect. Both the fluxes of 210Po and 234Th were calculated from the deficit term alone, assuming steady state and negligible physical transport. The POC ∕ radionuclide ratios on (a) total particulate fraction (TPF, > 1 µm) and (b) large-size fraction (LSF, > 53 µm) were used to calculate the POC flux. The fluxes were integrated down to the depth at which the 234Th activity returned to equilibrium with 238U activity (ThEq). The numbers in the plot are station numbers. The colored dots of the stations correspond to the basins.
4.5.2 POC∕210Po vs. POC∕234Th ratio
In order to calculate POC export flux, one needs both the export of the daughter nuclide at a defined depth as well as the particulate POC ∕ radionuclide ratio on the sinking particles. In situ pump filtered particles, either operationally defined as small (1–53 µm, SSF), large (> 53 µm, LSF), or total (> 1 µm, TPF) particles, may all represent a combination of sinking and non-sinking particles. In the present study, the particulate POC ∕ radionuclide ratio on the TPF and LSF were examined and used to calculate POC export flux. The POC∕210Po and POC∕234Th ratios in the particles at the depths of ThEq were derived from the power law functions in each basin (TPF POC∕210Po in Table 2, LSF POC∕234Th in Lemaitre et al., 2018; LSF POC∕210Po and TPF POC∕234Th not shown). The TPF POC∕210Po and TPF POC∕234Th ratios had very similar spatial trends (n=11, R2=0.8, p value < 0.0001) along the transect, with the lowest POC ∕ radionuclide ratios in the Iberian and Western European basins and the highest ratios in the Labrador Sea. In contrast, the LSF POC∕210Po ratios were not correlated with LSF POC∕234Th ratios (n=11, R2=0.3, p value =0.07). The correlation of values within the TPF but not the LSF suggests that the composition of large particles was different from that of the total particles, and that the difference in particle association between POC and 210Po and 234Th was greater in large particles than in total particles.
4.5.3 210Po-derived POC vs. 234Th-derived POC
When the radionuclide fluxes were multiplied by the POC ∕ radionuclide values, the range of the calculated POC fluxes were negligible to 7 mmol C m−2 d−1 and negligible to 12 mmol C m−2 d−1 via the 210Po method using the TPF and LSF POC∕210Po ratios, respectively, and from 2.5 to 13 mmol C m−2 d−1 and from 1 to 12 mmol C m−2 d−1 via the 234Th method using the TPF and LSF POC∕234Th ratios (Fig. 10). The 234Th-POC and 210Po–POC fluxes agreed within a factor of 3 along the transect, with higher POC estimates derived from the 234Th method in 9 out of 11 stations. This was consistent with previous studies that have typically found higher-estimated POC flux via the 234Th method (e.g., Shimmield et al., 1995; Stewart et al., 2007; Verdeny et al., 2009).
When using the total particle POC ∕ radionuclide ratios, only stations 26 and 60 were characterized by slightly higher 210Po-derived POC flux estimates than 234Th-derived estimates (0.2 and 1.5-fold, respectively). In contrast, at station 1 the difference between the methods was greatest, with the 210Po-derived POC flux negligible and the 234Th-POC flux of about 7 mmol C m−2 d−1. At stations 13, 21, and 44, the 234Th-POC fluxes were greater than 210Po–POC estimates by almost 1-fold, whereas in the Iceland and Labrador basins, the 234Th-POC fluxes were larger than 210Po–POC estimates by 3- and 2-fold, respectively. When using the large particle POC ∕ radionuclide ratios, only in the Irminger Basin was there higher 210Po-derived POC flux than 234Th-derived POC flux (> 0.2 to 3-fold). In the Iberian Basin, the greatest difference between the methods was found at station 1, where 210Po-derived POC flux was negligible, while 234Th-derived POC flux was the highest along the transect but with a large uncertainty (12±22 mmol C m−2 d−1), and at station 13 the 234Th-POC flux was greater than the 210Po–POC estimate by 4-fold. In the Western European, Iceland, and Labrador basins, the 234Th-POC fluxes were larger than 210Po–POC estimates by 5, 4, and 2-fold.
Wilcoxon rank sum tests revealed that the 234Th-POC estimates were significantly greater than 210Po-derived POC export at the stations from the Iberian Basin to the Iceland Basin (n=6, TPF: p value < 0.01, LSF: p value < 0.02), but not at the stations from the Irminger Basin to the Labrador Basin (n=5, TPF: p value > 0.1, LSF: p value =1). Since the ratios of POC to radionuclides for total particles had very similar spatial trends along the transect, the discrepancy between TPF 234Th-POC and TPF 210Po–POC flux estimates must be driven primarily by the discrepancy between the SS estimates of 234Th and 210Po fluxes, discussed in Sect. 4.5.1. In contrast, the discrepancy between the POC to isotope ratios in the large particle may have led to some degree of discrepancy between the LSF 234Th-POC and LSF 210Po–POC flux estimates.
This study used the water column 210Po and 210Pb activity data to constrain the 210Po particulate flux from the mixed-layer depth, the base of the euphotic zone and primary production zone, and the 234Th-238U equilibrium depth. The ratios of POC concentration to 210Po activity on the total particulate (> 1 µm) fraction and large particulate fraction (> 53 µm) were used to estimate POC export fluxes. We have been able to include vertical advection into a steady-state model to calculate the 210Po flux along the transect. The scale of 210Po fluxes due to vertical advection was of the same magnitude as the steady-state fluxes calculated from the 210Po deficit alone. The 210Po-derived POC export fluxes varied spatially, ranging from negligible to 10 mmol C m−2 d−1 along the transect, with the highest export fluxes in the Labrador Sea. POC export efficiencies (flux relative to production) also showed regional differences, ranging from negligible to 13 % along the transect. Higher export efficiencies were seen in the basins where diatoms dominated the phytoplankton community. The low-export efficiencies recorded in the Iberian Basin, on the other hand, may be associated with the dominance of smaller phytoplankton, such as coccolithophores. POC export fluxes estimated from the water column 210Po∕210Pb and 234Th∕238U disequilibria agreed within a factor of 3 across our study region, with higher POC estimates generally derived from the 234Th method. The differences were attributed to integration timescales and the history of bloom events.
The total and particulate 210Po and 210Pb activity data from the GEOVIDE cruise can be found in the companion article (Table S2 in Tang et al., 2018).
The authors declare that they have no conflict of interest.
This article is part of the special issue “GEOVIDE, an international GEOTRACES study along the OVIDE section in the North Atlantic and in the Labrador Sea (GA01)”. It is not associated with a conference.
We thank the captain (Gilles Ferrand) and crew of the R/V Pourquoi Pas? and the chief
scientists (Geráldine Sarthou and Pascale Lherminier) of the GEOVIDE
cruise. We also thank Pierre Branellec, Floriane Desprez de Gésincourt,
Michel Hamon, Catherine Kermabon, Philippe Le Bot, Stéphane Leizour,
Olivier Ménage, Fabien Pérault, and Emmanuel de Saint-Léger for
their technical support during the GEOVIDE expedition; Catherine Schmechtig
for the GEOVIDE database management, and Phoebe Lam for providing two
modified McLane in situ pumps; Frédéric Planchon, Virginie Sanial,
and Catherine Jeandel for their assistance with pump deployments and
particulate sample collection. The authors also thank Arnout Roukaerts,
Debany Fonseca-Batista, Florian Deman, and Frank Dehairs for providing
primary production data. Funding for the GEOVIDE cruise was provided by the
French National Research Agency (ANR-13-BS06-0014, ANR-12-PDOC-0025-01), the
French National Center for Scientific Research (CNRS-LEFE-CYBER), the
LabexMER (anr-10-LABX-19), and Ifremer. Gillian Stewart and Yi Tang were
supported by NSF award #OCE 1237108. The Generalitat de Catalunya also
helped through its grant 2017 SGR-1588. This work is contributing to the
ICTA “Unit of Excellence” (MinECo, MDM2015-0552). Maxi Castrillejo and
Montserrat Roca-Marti were funded by an FPU PhD studentship (AP-2012-2901
and AP2010-2510, respectively) from the Ministerio de Educación, Cultura
y Deporte of Spain. Maxi Castrillejo was also supported by the ETH Zurich
Postdoctoral Fellowship Program (17-2 FEL-30), co-funded by the Marie Curie
Actions for People COFUND Program. We also thank Gary Hemming (Queens
College) and Troy Rasbury (Stony Brook University) for laboratory assistance
with the ICP-MS analyses. Finally, we thank the associate editor and the
anonymous reviewers for their helpful comments on how to improve the
manuscript.
Edited by: Gilles Reverdin
Reviewed by: two anonymous referees
Acker, J. G. and Leptoukh, G.: Online Analysis Enhances Use of NASA Earth Science Data, Eos Trans. AGU, 88, 14–17, 2007.
Behrenfeld, M. J. and Falkowski, P. G.: Photosynthetic rates derived from satellite-based chlorophyll concentration, Limnol. Oceanogr., 42, 1–20, https://doi.org/10.4319/lo.1997.42.1.0001, 1997.
Bhat, S. G., Krishnaswamy, S., Lal, D., Rama, and Moore, W. S.: 234Th/238U ratios in the ocean, Earth Planet. Sc. Lett., 5, 483–491, 1968.
Broecker, W. S., Kaufman, A., and Trier, R. M.: The residence time of thorium in surface sea water and its implications regarding the rate of reactive pollutants, Earth Planet. Sc. Lett., 20, 35–44, https://doi.org/10.1016/0012-821X(73)90137-4, 1973.
Buesseler, K. O.: The decoupling of production and particulate export in the surface ocean, Global Biogeochem. Cy., 12, 297–310, https://doi.org/10.1029/97GB03366, 1998.
Buesseler, K. O., Bacon, M. P., Kirk Cochran, J., and Livingston, H. D.: Carbon and nitrogen export during the JGOFS North Atlantic Bloom experiment estimated from 234Th:238U disequilibria, Deep-Sea Res. Pt. I, 39, 1115–1137, 1992.
Cherrier, J., Burnett, W. C., and LaRock, P. A.: Uptake of polonium and sulfur by bacteria, Geomicrobiol. J., 13, 103–115, https://doi.org/10.1080/01490459509378009, 1995.
Chuang, C., Santschi, P. H., Ho, Y., Conte, M. H., Guo, L., Schumann, D., Ayranov, M., and Li, Y.: Role of biopolymers as major carrier phases of Th, Pa, Pb, Po, and Be radionuclides in settling particles from the Atlantic Ocean, Mar. Chem., 157, 131–143, 2013.
Cochran, J. K.: Uranium-Series Disequilibrium – Application to Earth, Marine, and Environmental Sciences, The oceanic chemistry of the uranium and thorium-series nuclides, Oxford University Press, 334–395, 1992.
Djogic, R., Sipos, L., and Branica, M.: Characterization of uranium(VI) in seawater, Limnol. Oceanogr., 31, 1122–1131, https://doi.org/10.4319/lo.1986.31.5.1122, 1986.
Ducklow, H., Steinberg, D., and Buesseler, K.: Upper Ocean Carbon Export and the Biological Pump, Oceanography, 14, 50–58, https://doi.org/10.5670/oceanog.2001.06, 2001.
Durkin, C. A., Van Mooy, B. A. S., Dyhrman, S. T., and Buesseler, K. O.: Sinking phytoplankton associated with carbon flux in the Atlantic Ocean, Limnol. Oceanogr., 61, 1172–1187, https://doi.org/10.1002/lno.10253, 2016.
Falkowski, P. G., Barber, R. T., and Smetacek, V.: Biogeochemical Controls and Feedbacks on Ocean Primary Production, Science, 281, 200–206, 1998.
Fisher, N. S., Burns, K. A., Cherry, R. D., and Heyraud, M.: Accumulation and cellular distribution of 241Am, 210Po and 210Pb in two marine algae, Mar. Ecol.-Prog. Ser., 11, 233–237, 1983.
Fleer, A. P. and Bacon, M. P.: Determination of 210Pb and 210Po in seawater and marine particulate matter, Nucl. Instrum. Methods, 223, 243–249, 1984.
Flynn, W. W.: The determination of low levels of polonium-210 in environmental materials, Anal. Chim. Acta, 43, 221–227, 1968.
Fonseca-Batista, D., Li, X., Riou, V., Michotey, V., Deman, F., Fripiat, F., Guasco, S., Brion, N., Lemaitre, N., Tonnard, M., Gallinari, M., Planquette, H., Planchon, F., Sarthou, G., Elskens, M., Chou, L., and Dehairs, F.: Evidence of high N2 fixation rates in productive waters of the temperate Northeast Atlantic, Biogeosciences Discuss., https://doi.org/10.5194/bg-2018-220, in review, 2018.
Friedrich, J. and Rutgers van der Loeff, M. M.: A two-tracer (210Po–234Th) approach to distinguish organic carbon and biogenic silica export flux in the Antarctic Circumpolar Current, Deep-Sea Res. Pt. I, 49, 101–120, https://doi.org/10.1016/S0967-0637(01)00045-0, 2002.
García-Ibáñez, M. I., Pérez, F. F., Lherminier, P., Zunino, P., Mercier, H., and Tréguer, P.: Water mass distributions and transports for the 2014 GEOVIDE cruise in the North Atlantic, Biogeosciences, 15, 2075–2090, https://doi.org/10.5194/bg-15-2075-2018, 2018.
Gourain, A., Planquette, H., Cheize, M., Lemaitre, N., Menzel Barraqueta, J.-L., Shelley, R., Lherminier, P., and Sarthou, G.: Inputs and processes affecting the distribution of particulate iron in the North Atlantic along the GEOVIDE (GEOTRACES GA01) section, Biogeosciences Discuss., https://doi.org/10.5194/bg-2018-234, in review, 2018.
Guidi, L., Stemmann, L., Legendre, L., Picheral, M., Prieur, L., and Gorsky, G.: Vertical distribution of aggregates (> 110 µm) and mesoscale activity in the northeastern Atlantic: Effects on the deep vertical export of surface carbon, Limnol. Oceanogr., 52, 7–18, https://doi.org/10.4319/lo.2007.52.1.0007, 2007.
Gustafsson, O. and Andersson, P.: 234Th-derived surface export fuxes of POC from the Northern Barents Sea and the Eurasian sector of the Central Arctic Ocean, Deep-Sea Res. Pt. I, 68, 1–11, https://doi.org/10.1016/j.dsr.2012.05.014, 2012.
Hayes, C. T., Black, E. E., Andersen, R. A., Baskaran, M., Buesseler, K. O., Charette, M. A., Cheng, H., Cochran, J. K., Edwards, R. L., Fitzgerald, P., Lam, P. J., Lu, Y., Morris, S. O., Ohnemus, D. C., Pavia, F. J., Stewart, G., and Tang, Y.: Flux of particulate elements in the North Atlantic Ocean constrained by multiple radionuclides, Global Biogeochem. Cy., 32, 1738–1758, https://doi.org/10.1029/2018GB005994, 2018
Honjo, S., Manganini, S. J., Krishfield, R. A., and Francois, R.: Particulate organic carbon fluxes to the ocean interior and factors controlling the biological pump: A synthesis of global sediment trap programs since 1983, Prog. Oceanogr., 76, 217–285, 2008.
Jerlov, N. G.: Optical Oceanography, Elsevier Publishing Company, 1968.
Kemp, A. E. S., Pearce, R. B., Grigorov, I., Rance, J., Lange, C. B., Quilty, P., and Salter, I.: Production of giant marine diatoms and their export at oceanic frontal zones: Implications for Si and C flux from stratified oceans, Global Biogeochem. Cy., 20, GB4S04, https://doi.org/10.1029/2006GB002698, 2006.
Kim, G. and Church, T. M.: Seasonal biogeochemical fluxes of 234Th and 210Po in the Upper Sargasso Sea: Influence from atmospheric iron deposition, Global Biogeochem. Cy., 15, 651–661, https://doi.org/10.1029/2000GB001313, 2001.
Lemaitre, N., Planchon, F., Planquette, H., Dehairs, F., Fonseca-Batista, D., Roukaerts, A., Deman, F., Tang, Y., Mariez, C., and Sarthou, G.: High variability of particulate organic carbon export along the North Atlantic GEOTRACES section GA01 as deduced from 234Th fluxes, Biogeosciences, 15, 6417–6437, https://doi.org/10.5194/bg-15-6417-2018, 2018.
Lévy, M., Iovino, D., Resplandy, L., Klein, P., Madec, G., Tréguier, A. M., Masson, S., and Takahashi, K.: Large-scale impacts of submesoscale dynamics on phytoplankton: Local and remote effects, Ocean Modell., 43–44, 77–93, https://doi.org/10.1016/j.ocemod.2011.12.003, 2012.
Masqué, P., Sanchez-Cabeza, J. A., Bruach, J. M., Palacios, E., and Canals, M.: Balance and residence times of 210Pb and 210Po in surface waters of the northwestern Mediterranean Sea, Cont. Shelf Res., 22, 2127–2146, https://doi.org/10.1016/S0278-4343(02)00074-2, 2002.
Matsumoto, E.: 234Th/238U radioactive disequilibrium in the surface layer of the ocean, Geochim. Cosmochim. Ac., 39, 205–212, https://doi.org/10.1016/0016-7037(75)90172-6, 1975.
Menemenlis, D., Campin, J., Heimbach, P., Hill, C., Lee, T., Nguyen, A., Schodlock, M., and Zhang, H.: ECCO2: High Resolution Global Ocean and Sea Ice Data Synthesis, Mercator Ocean Quarterly Newsletter, 31, 13–21, 2008.
Moore, H. E., Poet, S. E., Martell, E. A., and Wilkening, M. H.: Origin of 222Rn and its long-lived daughters in air over Hawaii, J. Geophys. Res., 79, 5019–5024, https://doi.org/10.1029/JC079i033p05019, 1974.
Moran, S. B., Ellis, K. M., and Smith, J. N.: 234Th/238U disequilibrium in the central Arctic Ocean: implications for particulate organic carbon export, Deep-Sea Res. Pt. II, 44, 1593–1606, https://doi.org/10.1016/S0967-0645(97)00049-0, 1997.
Murray, J. W., Paul, B., Dunne, J. P., and Chapin, T.: 234Th, 210Pb, 210Po and stable Pb in the central equatorial Pacific: Tracers for particle cycling, Deep-Sea Res. Pt. I, 52, 2109–2139, 2005.
Owens, S. A., Pike, S., and Buesseler, K. O.: Thorium-234 as a tracer of particle dynamics and upper ocean export in the Atlantic Ocean, Deep-Sea Res. Pt. II, 116, 42–59, https://doi.org/10.1016/j.dsr2.2014.11.010, 2015.
Quigley, M. S., Santschi, P. H., Hung, C., Guo, L., and Honeyman, B. D.: Importance of acid polysaccharides for 234Th complexation to marine organic matter, Limnol. Oceanogr., 47, 367–377, https://doi.org/10.4319/lo.2002.47.2.0367, 2002.
Richardson, T. L. and Jackson, G. A.: Small Phytoplankton and Carbon Export from the Surface Ocean, Science, 315, 838–840, https://doi.org/10.1126/science.1133471, 2007.
Rigaud, S., Puigcorbé, V., Camara-Mor, P., Casacuberta, N., Roca-Martí, M., Garcia-Orellana, J., Benitez-Nelson, C. R., Masqué, P., and Church, T.: A methods assessment and recommendations for improving calculations and reducing uncertainties in the determination of 210Po and 210Pb activities in seawater, Limnol. Oceanogr.-Meth., 11, 561–571, https://doi.org/10.4319/lom.2013.11.561, 2013.
Rigaud, S., Stewart, G., Baskaran, M., Marsan, D., and Church, T.: 210Po and 210Pb distribution, dissolved-particulate exchange rates, and particulate export along the North Atlantic US GEOTRACES GA03 section, Deep-Sea Res. Pt. II, 116, 60–78, https://doi.org/10.1016/j.dsr2.2014.11.003, 2015.
Rivière, P. and Pondaven, P.: Phytoplankton size classes competitions at sub-mesoscale in a frontal oceanic region, J. Marine Syst., 60, 345–364, https://doi.org/10.1016/j.jmarsys.2006.02.005, 2006.
Roca-Martí, M., Puigcorbé, V., Rutgers van der Loeff, M. M., Katlein, C., Fernández-Méndez, M., Peeken, I., and Masqué, P.: Carbon export fluxes and export efficiency in the central Arctic during the record sea-ice minimum in 2012: a joint 234Th/238U and 210Po/210Pb study, J. Geophys. Res.-Oceans, 121, 5030–5049, https://doi.org/10.1002/2016JC011816, 2016.
Rutgers van der Loeff, M. M., Friedrich, J., and Bathmann, U. V.: Carbon export during the Spring Bloom at the Antarctic Polar Front, determined with the natural tracer 234Th, Deep-Sea Res. Pt. II, 44, 457–478, https://doi.org/10.1016/S0967-0645(96)00067-7, 1997.
Sabine, C. L.: The Oceanic Sink for Anthropogenic CO2, Science, 305, 367–371, https://doi.org/10.1126/science.1097403, 2004.
Sarin, M. M., Kim, G., and Church, T. M.: 210Po and 210Pb in the South-equatorial Atlantic: distribution and disequilibrium in the upper 500 m, Deep-Sea Res. Pt. II, 46, 907–917, 1999.
Savoye, N., Benitez-Nelson, C., Burd, A. B., Cochran, J. K., Charette, M., Buesseler, K. O., Jackson, G. A., Roy-Barman, M., Schmidt, S., and Elskens, M.: 234Th sorption and export models in the water column: A review, Mar. Chem., 100, 234–249, 2006.
Shelley, R. U., Roca-Martí, M., Castrillejo, M., Sanial, V., Masqué, P., Landing, W. M., van Beek, P., Planquette, H., and Sarthou, G.: Quantification of trace element atmospheric deposition fluxes to the Atlantic Ocean (> 40∘ N; GEOVIDE, GEOTRACES GA01) during spring 2014, Deep-Sea Res. Pt. I, 119, 34–49, https://doi.org/10.1016/j.dsr.2016.11.010, 2017.
Shimmield, G. B., Ritchie, G. D., and Fileman, T. W.: The impact of marginal ice zone processes on the distribution of 210Pb, 210Po and 234Th and implications for new production in the Bellingshausen Sea, Antarctica, Deep-Sea Res. Pt. II, 42, 1313–1335, https://doi.org/10.1016/0967-0645(95)00071-W, 1995.
Stewart, G., Cochran, J. K., Miquel, J. C., Masqué, P., Szlosek, J., Rodriguez y Baena, A. M., Fowler, S. W., Gasser, B., and Hirschberg, D. J.: Comparing POC export from 234Th/238U and 210Po/210Pb disequilibria with estimates from sediment traps in the northwest Mediterranean, Deep-Sea Res. Pt. I, 54, 1549–1570, https://doi.org/10.1016/j.dsr.2007.06.005, 2007.
Stewart, G. M. and Fisher, N. S.: Bioaccumulation of polonium-210 in marine copepods, Limnol. Oceanogr., 48, 2011–2019, https://doi.org/10.4319/lo.2003.48.5.2011, 2003a.
Stewart, G. M. and Fisher, N. S.: Experimental studies on the accumulation of polonium-210 by marine phytoplankton, Limnol. Oceanogr., 48, 1193–1201, https://doi.org/10.4319/lo.2003.48.3.1193, 2003b.
Stewart, G. M., Bradley Moran, S., and Lomas, M. W.: Seasonal POC fluxes at BATS estimated from 210Po deficits, Deep-Sea Res. Pt. I, 57, 113–124, https://doi.org/10.1016/j.dsr.2009.09.007, 2010.
Subha Anand, S., Rengarajan, R., Shenoy, D., Gauns, M., and Naqvi, S. W. A.: POC export fluxes in the Arabian Sea and the Bay of Bengal: A simultaneous 234Th/238U and 210Po/210Pb study, Mar. Chem., 198, 70–87, https://doi.org/10.1016/j.marchem.2017.11.005, 2017.
Tang, Y., Stewart, G., Lam, P. J., Rigaud, S., and Church, T.: The influence of particle concentration and composition on the fractionation of 210Po and 210Pb along the North Atlantic GEOTRACES transect GA03, Deep-Sea Res. Pt. I, 128, 42–54, https://doi.org/10.1016/j.dsr.2017.09.001, 2017.
Tang, Y., Castrillejo, M., Roca-Martí, M., Masqué, P., Lemaitre, N., and Stewart, G.: Distributions of total and size-fractionated particulate 210Po and 210Pb activities along the North Atlantic GEOTRACES GA01 transect: GEOVIDE cruise, Biogeosciences, 15, 5437–5453, https://doi.org/10.5194/bg-15-5437-2018, 2018.
Turekian, K. K., Nozaki, Y., and Benninger, L. K.: Geochemistry of Atmospheric Radon and Radon Products, Annu. Rev. Earth Pl. Sc., 5, 227–255, https://doi.org/10.1146/annurev.ea.05.050177.001303, 1977.
Verdeny, E., Masqué, P., Maiti, K., Garcia-Orellana, J., Bruach, J. M., Mahaffey, C., and Benitez-Nelson, C. R.: Particle export within cyclonic Hawaiian lee eddies derived from 210Pb–210Po disequilibrium, Deep-Sea Res. Pt. II, 55, 1461–1472, https://doi.org/10.1016/j.dsr2.2008.02.009, 2008.
Verdeny, E., Masqué, P., Garcia-Orellana, J., Hanfland, C., Kirk Cochran, J., and Stewart, G. M.: POC export from ocean surface waters by means of 234Th/238U and 210Po/210Pb disequilibria: A review of the use of two radiotracer pairs, Deep-Sea Res. Pt. II, 56, 1502–1518, https://doi.org/10.1016/j.dsr2.2008.12.018, 2009.
Villa-Alfageme, M., Soto, F. C., Ceballos, E., Giering, S. L. C., Le Moigne, F. A. C., Henson, S., Mas, J. L., and Sanders, R. J.: Geographical, seasonal, and depth variation in sinking particle speeds in the North Atlantic, Geophys. Res. Lett., 43, 8609–8616, https://doi.org/10.1002/2016GL069233, 2016.
Waite, A. M., Stemmann, L., Guidi, L., Calil, P. H. R., Hogg, A. M. C., Feng, M., Thompson, P. A., Picheral, M., and Gorsky, G.: The wineglass effect shapes particle export to the deep ocean in mesoscale eddies, Geophys. Res. Lett., 43, 9791–9800, https://doi.org/10.1002/2015GL066463, 2016.
Wei, C.-L., Lin, S.-Y., Sheu, D. D.-D., Chou, W.-C., Yi, M.-C., Santschi, P. H., and Wen, L.-S.: Particle-reactive radionuclides (234Th, 210Pb, 210) as tracers for the estimation of export production in the South China Sea, Biogeosciences, 8, 3793–3808, https://doi.org/10.5194/bg-8-3793-2011, 2011.
Wei, C.-L., Yi, M.-C., Lin, S.-Y., Wen, L.-S., and Lee, W.-H.: Seasonal distributions and fluxes of 210Pb and 210Po in the northern South China Sea, Biogeosciences, 11, 6813–6826, https://doi.org/10.5194/bg-11-6813-2014, 2014.
Weller, R. A. and Plueddemann, A. J.: Observations of the vertical structure of the oceanic boundary layer, J. Geophys. Res.-Oceans, 101, 8789–8806, https://doi.org/10.1029/96JC00206, 1996.
Yang, W., Guo, L., Chuang, C., Schumann, D., Ayranov, M., and Santschi, P. H.: Adsorption characteristics of 210Pb, 210Po and 7Be onto micro-particle surfaces and the effects of macromolecular organic compounds, Geochim. Cosmochim. Ac., 107 47–64, 2013.
Zunino, P., Lherminier, P., Mercier, H., Daniault, N., García-Ibáñez, M. I., and Pérez, F. F.: The GEOVIDE cruise in May–June 2014 reveals an intense Meridional Overturning Circulation over a cold and fresh subpolar North Atlantic, Biogeosciences, 14, 5323–5342, https://doi.org/10.5194/bg-14-5323-2017, 2017.
The requested paper has a corresponding corrigendum published. Please read the corrigendum first before downloading the article.
- Article
(4048 KB) - Full-text XML