the Creative Commons Attribution 4.0 License.
the Creative Commons Attribution 4.0 License.
 | 05 Jul 2019
Global trends in marine nitrate N isotopes from observations and a neural network-based climatology
Aaron Bagnell
Dario Marconi
Timothy DeVries
Nitrate is a critical ingredient for life in the ocean because, as the most abundant form of fixed nitrogen in the ocean, it is an essential nutrient for primary production. The availability of marine nitrate is principally determined by biological processes, each having a distinct influence on the N isotopic composition of nitrate (nitrate δ15N) – a property that informs much of our understanding of the marine N cycle as well as marine ecology, fisheries, and past ocean conditions. However, the sparse spatial distribution of nitrate δ15N observations makes it difficult to apply this useful property in global studies or to facilitate robust model–data comparisons. Here, we use a compilation of published nitrate δ15N measurements (n=12 277) and climatological maps of physical and biogeochemical tracers to create a surface-to-seafloor, 1∘ resolution map of nitrate δ15N using an ensemble of artificial neural networks (EANN). The strong correlation (R2>0.87) and small mean difference (<0.05 ‰) between EANN-estimated and observed nitrate δ15N indicate that the EANN provides a good estimate of climatological nitrate δ15N without a significant bias. The magnitude of observation-model residuals is consistent with the magnitude of seasonal to interannual changes in observed nitrate δ15N that are not captured by our climatological model. The EANN provides a globally resolved map of mean nitrate δ15N for observational and modeling studies of marine biogeochemistry, paleoceanography, and marine ecology.


In contrast to other marine nutrients (e.g., phosphate and silicate), the inventory of nitrate () and other fixed nitrogen (N) is mediated by biological processes, where the main source is N2 fixation by diazotrophic phytoplankton and the main sink is denitrification (via microbial consumption in oxygen deficient waters and sediments) (Codispoti and Christensen, 1985). Biological processes also determine the distribution of marine nitrate throughout the water column, with phytoplankton assimilating nitrate in the surface ocean and microbes degrading organic matter in the subsurface (i.e., remineralization). The latter involves the multi-step process of ammonification (organic matter → ) and nitrification (). By regulating the global inventory and distribution of marine nitrate, these N cycling processes control global net primary productivity, the transfer of nutrients to higher trophic levels and the strength of the ocean's biological carbon pump (Dugdale and Goering, 1967).
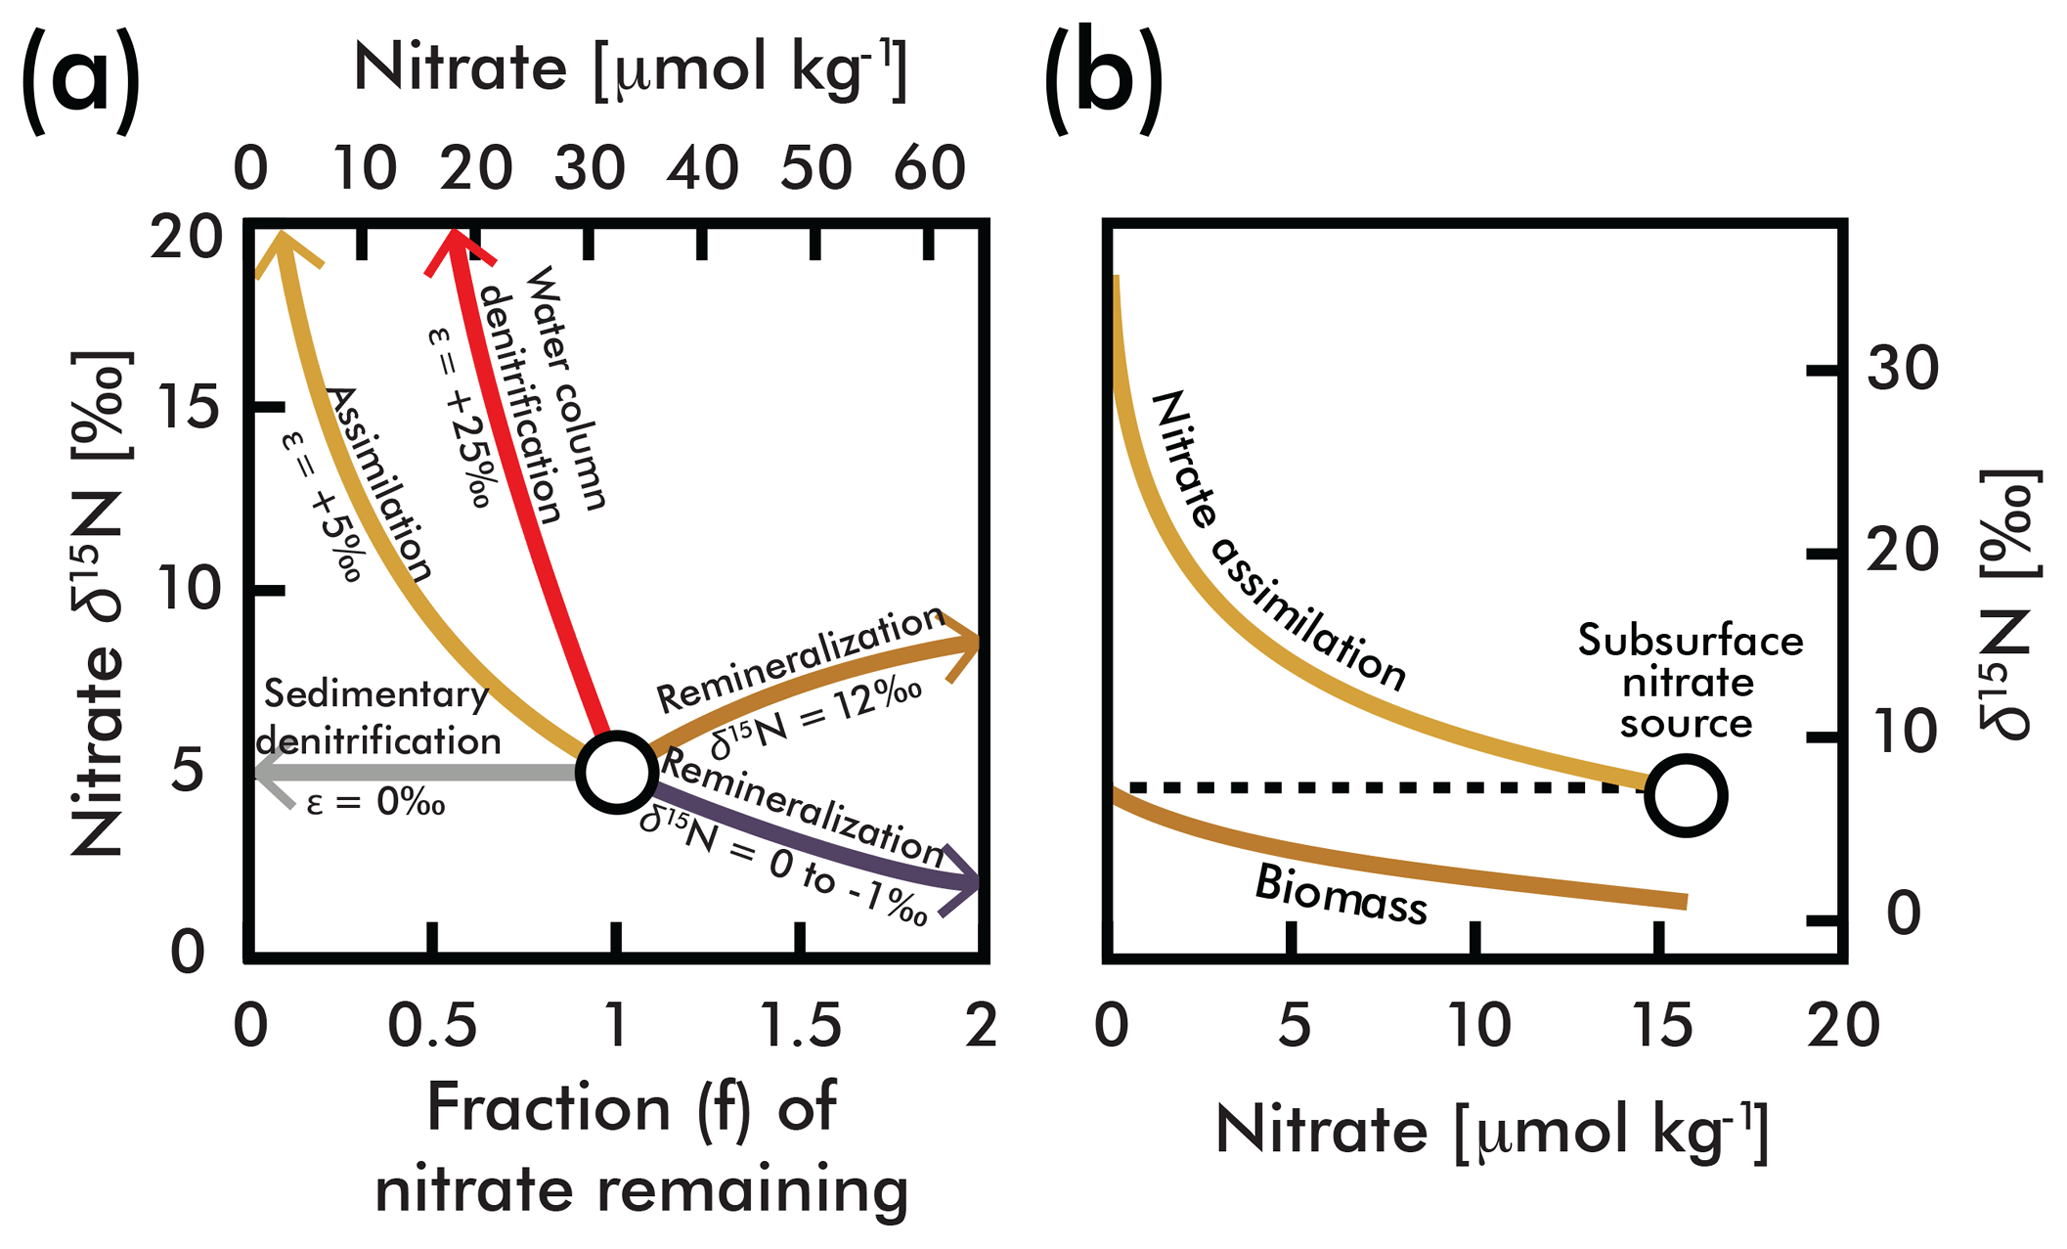
Figure 1(a) A comparison of influences on average deep-sea nitrate (circle; concentration and δ15N estimated here by EANN results in Table 1) including the isotope effects of assimilation (yellow arrow), water column and sedimentary denitrification (red and gray arrows), and the addition of nitrate via remineralization of organic matter with higher and lower δ15N (brown and purple arrows) (modified from Galbraith et al., 2008). (b) An example of N isotopic fractionation during nitrate assimilation on nitrate and organic matter biomass in eastern equatorial Pacific surface waters (from Rafter and Sigman, 2016). These calculations are based on isotopic fractionation equations of Mariotti et al., (1981) simplified in Sigman and Casciotti (2001) with an isotope effect (ε) as shown in (a). The variable f is the initial nitrate concentration.
Each of these biologically mediated N transformations affects the N isotopic composition of nitrate in unique ways (Fig. 1a and b), adjusting the relative abundance of 15N and 14N in oceanic nitrate relative to the atmosphere. (, multiplied by 1000 to give units of per mil (‰); see Sigman and Casciotti, 2001, for simplified equations from Mariotti et al., 1981.) Nitrate δ15N measurements have become a powerful tool for understanding the “biogeochemical history” of marine nitrate (Rafter et al., 2012), which includes nitrate assimilation by phytoplankton (Miyake and Wada, 1967; Wada and Hattori, 1978), nitrogen fixation (Carpenter et al., 1997; Hoering and Ford, 1960), denitrification (Liu, 1979), and nitrification (Casciotti et al., 2013). For example, the consumption of nitrate by denitrification (red line in Fig. 1a) has a larger impact on the residual nitrate δ15N than partial nitrate assimilation by phytoplankton (yellow line in Fig. 1), and thus very high δ15N values serve as a fingerprint of denitrification. Nitrate δ15N is also influenced by the addition of nitrate via remineralization of organic matter. The exact influence of remineralization depends on the isotopic composition of the organic matter, and could result in higher or lower nitrate δ15N (Fig. 1a). Nitrate introduced into the water column by the remineralization of organic matter formed by N2-fixing phytoplankton has an isotopic composition close to that of air (0 ‰–1 ‰) (Carpenter et al., 1997; Hoering and Ford, 1960) and serves to lower the mean ocean nitrate δ15N (Fig. 1b). On the other hand, organic matter formed from nitrate assimilation in regions where the plankton use most of the available nitrate can be isotopically heavy, and its remineralization will increase the δ15N of ambient nitrate (Fig. 1b). The actual value of organic matter δ15N formed from nitrate assimilation is mostly determined by the following: (1) the δ15N of nitrate delivered to the euphotic zone (the subsurface source), which in turn is dependent on the degree of water column denitrification and (2) the degree of nitrate consumption at the ocean surface, with heavier values associated with greater nitrate consumption (Fig. 1b). Accordingly, changes in organic matter δ15N (and therefore sediment δ15N used for paleoceanographic work) can reflect variability of the source nitrate δ15N and variability of the degree of nitrate consumption (e.g., see Rafter and Charles, 2012).
Because of nitrate's place at the base of the marine ecosystem, nitrate δ15N is also useful for understanding the lifecycles of higher trophic level organisms such as fish (Graham et al., 2007; Tawa et al., 2017) and fishery productivity (Finney et al., 2002, 2000). The δ15N of whole sediment and microfossils provides insight by proxy of past ocean nitrate transformations (Altabet and Francois, 1994a; Kienast et al., 2008; Ren et al., 2009; Robinson et al., 2004; Sigman et al., 1999b) – work that places important constraints on modern ocean N cycling (Altabet, 2007; Eugster et al., 2013; Ren et al., 2017). With an understanding of the N transformations described above and their influences on the N isotopic composition of nitrate, we can begin using nitrate δ15N measurements to trace the biogeochemical history of marine nitrate. However, identifying basin- and global-scale trends in nitrate δ15N is challenged by the limited spatial extent of nitrate δ15N observations (Fig. 2). Here, we compile a global database of nitrate δ15N measurements (Fig. 2) and use an ensemble of artificial neural networks (EANN) to produce a map of the global nitrate δ15N distribution at 1∘ spatial resolution. We find that the mapped nitrate δ15N climatology matches the observations well and should be a valuable tool for estimating mean conditions and for constraining predictive nitrate δ15N models (Somes et al., 2010; Yang and Gruber, 2016). Below we briefly discuss how the EANN was used to produce global maps of nitrate δ15N (Sect. 2), address the ability of the EANN to match the measured δ15N (Sect. 3), and examine the EANN-mapped δ15N climatology and global compilation of nitrate δ15N in the context of published work (Sect. 4).

Figure 2The location of global nitrate δ15N observations used to constrain the ensemble of artificial neural networks are shown as red circles. Observations used as an “external validation dataset” (those withheld from training the EANN) are shown in blue. Inset figure shows the number of observations versus depth. Contours are surface nitrate concentrations for October–December from World Ocean Atlas (Garcia et al., 2010).
2.1 Data compilation
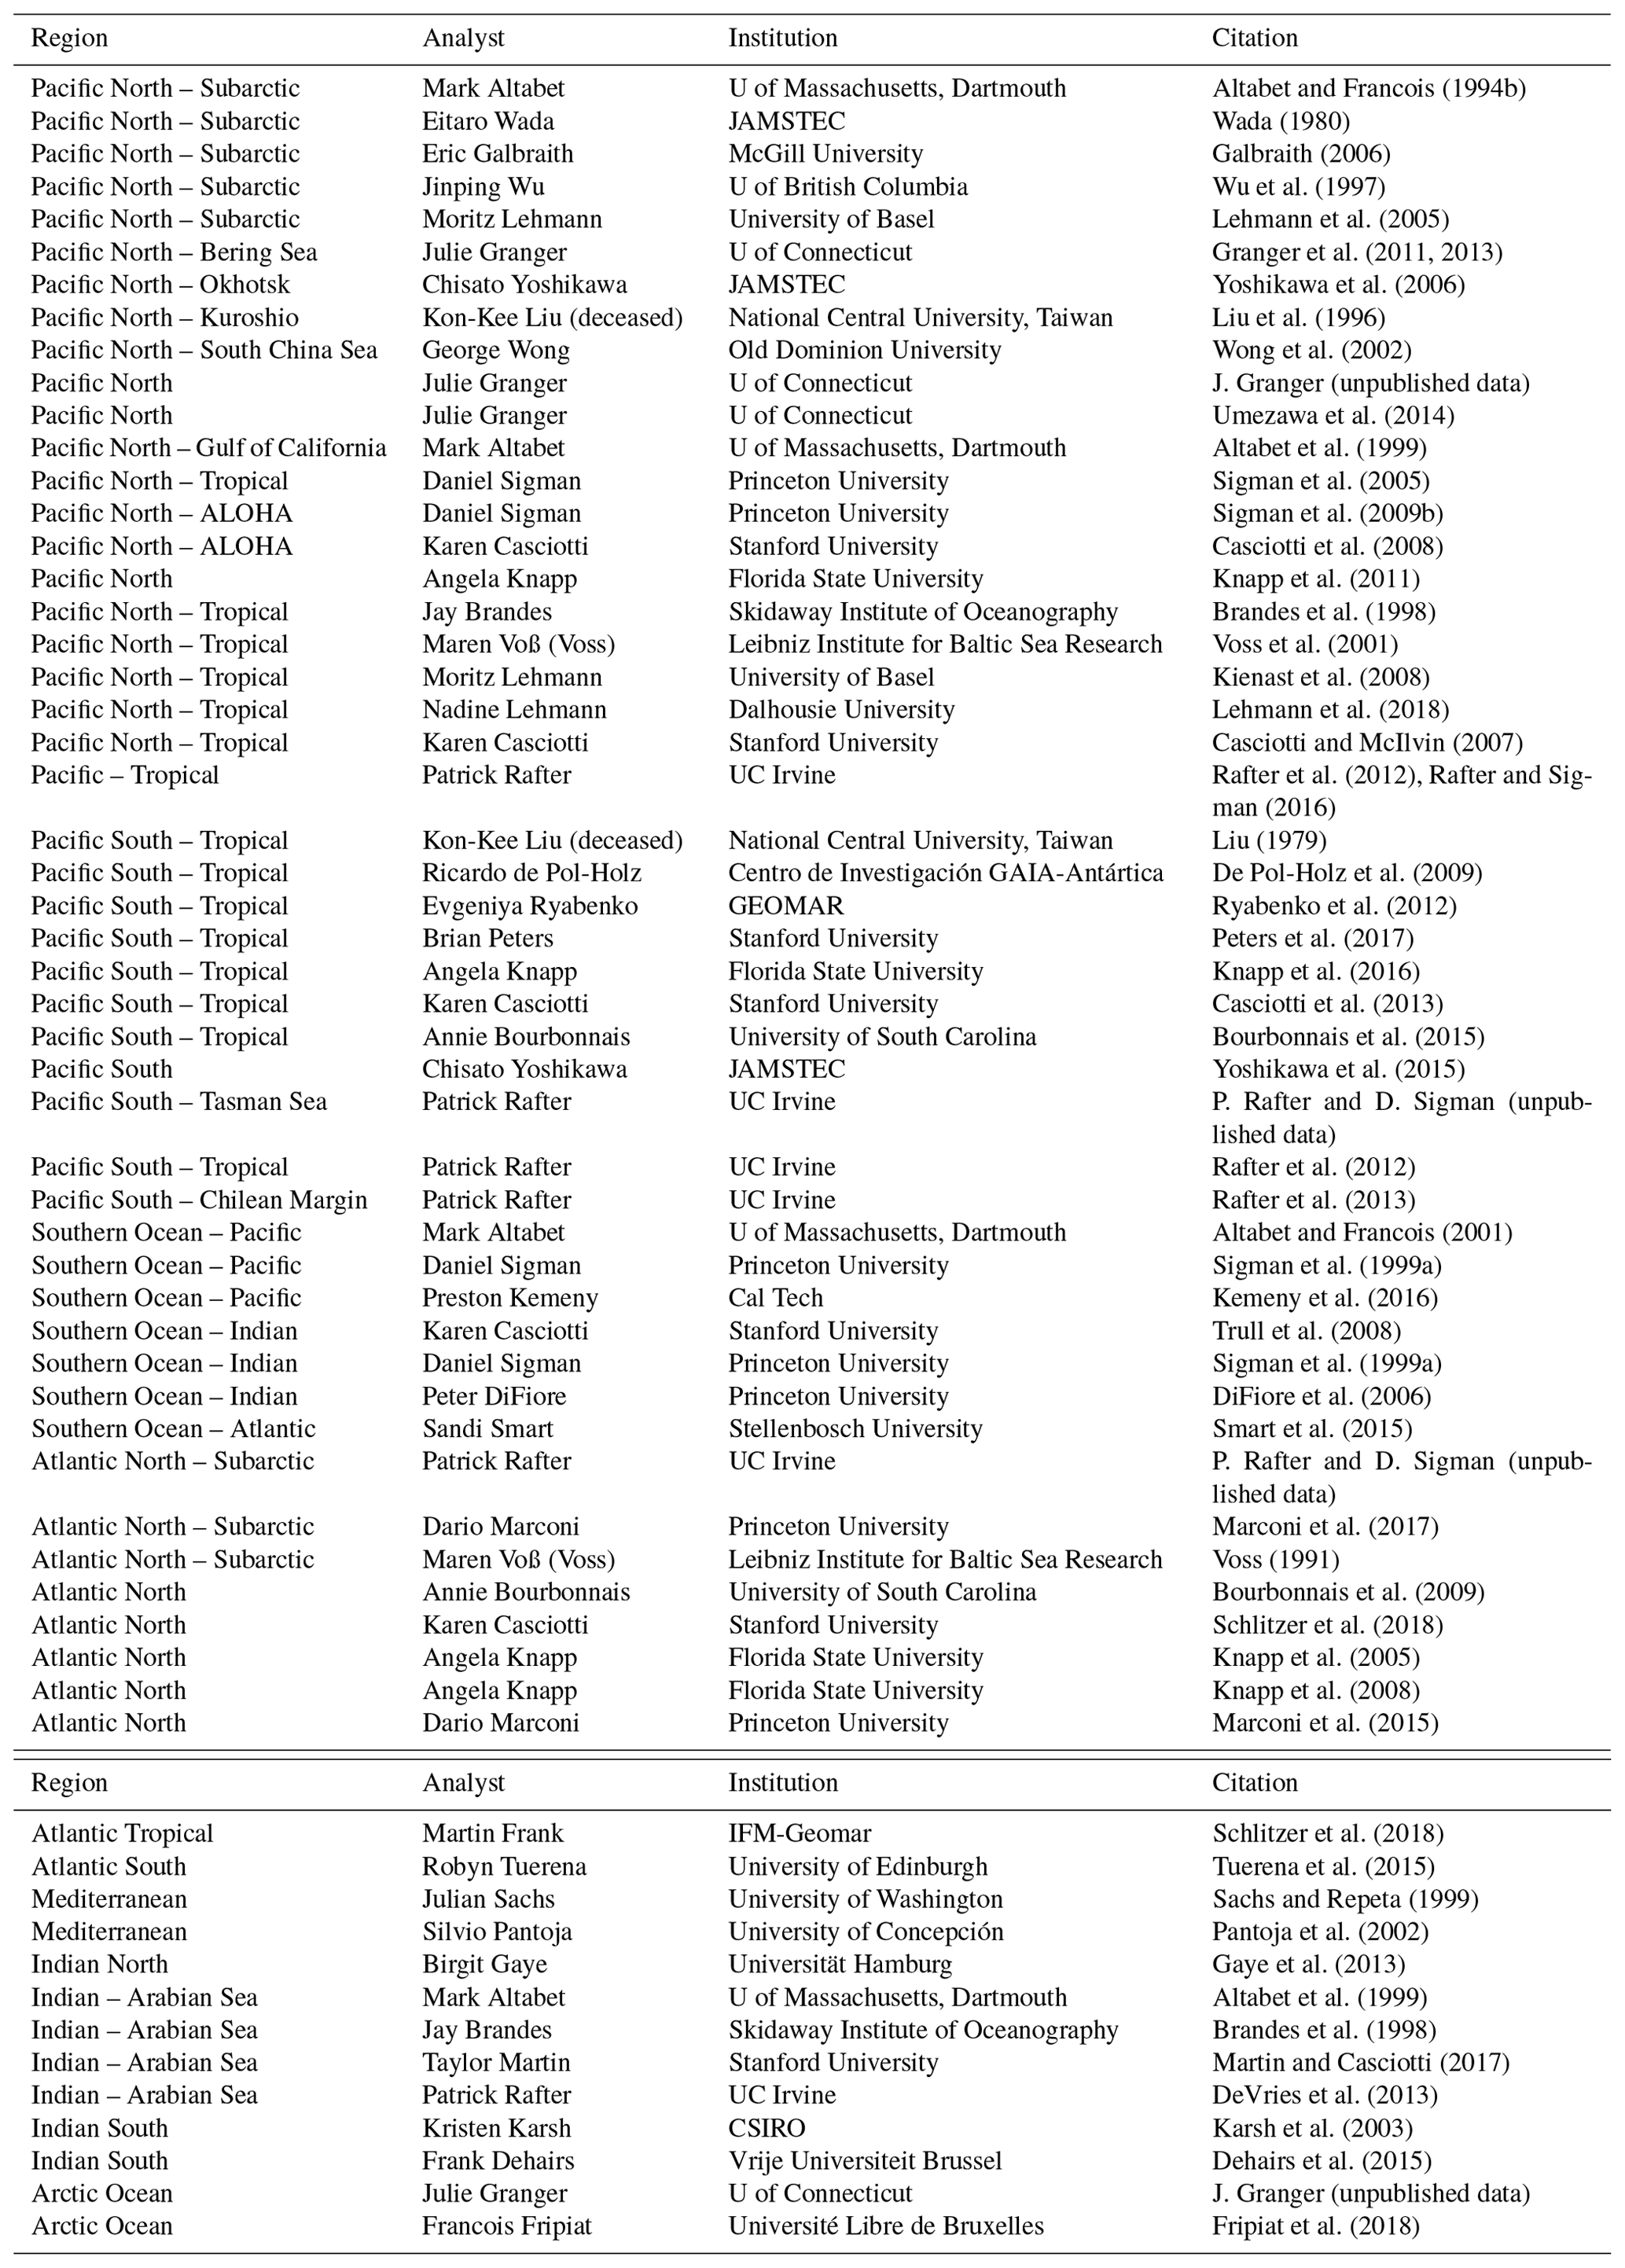
Nitrate δ15N observations (Fig. 2; references and region of measurement in Appendix) were compiled from studies dating from 1975 (Cline and Kaplan, 1975) to 2018 (Fripiat et al., 2018), including data from the GEOTRACES intermediate data product (Schlitzer et al., 2018). Whenever possible, the data were acquired via the original author, but in other cases the data were estimated from the publication directly. All observations were treated equally, although the failure to remove nitrite when using the “denitrifier method” may bias the nitrate δ15N to low values (Rafter et al., 2013). These measurements have been identified as “nitrate + nitrite” in the dataset to acknowledge this potential biasing, which predominantly affects observations in the upper 100 m (Kemeny et al., 2016; Rafter et al., 2013).
2.2 Building the neural network model
We utilize an ensemble of artificial neural networks (EANN) to interpolate our global ocean nitrate δ15N database (Fig. 2), producing complete 3-D maps of the data. The artificial neural network (ANN) is a machine learning approach that identifies nonlinear relationships between a target variable (the isotopic dataset) and a set of input features (other available ocean datasets), and extrapolates these relationships to produce global coverage of nitrate δ15N.
2.2.1 Binning target variables (Step 1)
We binned the nitrate δ15N observations (red symbols in Fig. 2) to the World Ocean Atlas 2009 (WOA09) grid with a 1∘ spatial resolution and 33 vertical depth layers (0–5500 m) (Garcia et al., 2010). When binning vertically, we use the depth layer whose value is closest to the observation's sampling depth (the first depth layer has a value of 0 m, the second of 10 m, and the third of 20 m, so all nitrate isotopic data sampled between 0 and 5 m fall in the 0 m bin; between 5 and 15 m they fall in the 10 m bin, etc.). An observation with a sampling depth that lies right at the midpoint between depth layers is binned to the shallower layer. If more than one raw data point falls in a grid cell we take the average of all those points as the value for that grid cell. Certain whole ship tracks of nitrate δ15N data were withheld from binning to be used as an independent validation set (see Sect. 2.2.4).
2.2.2 Obtaining input features (Step 2)
Our input dataset contains a set of climatological values for physical and biogeochemical ocean parameters that form a non-linear relationship with the target data. We use six input features including objectively analyzed annual-mean fields for temperature, salinity, nitrate, oxygen, and phosphate taken from the WOA09 (https://www.nodc.noaa.gov/OC5/WOA09/woa09data.html, last access: 1 January 2017) at 1∘ resolution. Additionally, daily chlorophyll data from Modis Aqua for the period 1 January 2003 through 31 December 2012 are averaged and binned to the WOA09 grid (as described in Step 1) to produce an annual climatological field of chlorophyll values, which we then log transform to reduce their dynamic range.
The choice of these specific input features was dictated by our desire to achieve the best possible R2 value on our internal validation sets (Step 4). Additional inputs besides those we included, such as latitude, longitude, silicate, euphotic depth, or sampling depth either did not improve the R2 value on the validation dataset or degraded it, indicating that they are not essential parameters for characterizing this system globally. By opting to use the set of input features that yielded the best results for the global oceans, we potentially overlooked combinations of inputs that perform better at regional scales. However, given the scarcity of δ15N data in some regions, it is not possible to differentiate the impact of input features from the impact of available δ15N data, which may not be representative of the region's climatological state, to the model performance in these regions.
2.2.3 Training the ANN (Step 3)
The architecture of our ANN consists of a single hidden layer, containing 25 nodes, that connects the biological and physical input features (discussed in Step 2) to the target nitrate isotopic variable (as discussed in Step 1). The role of the hidden layer is to transform input features into new features contained in the nodes. These are given to the output layer to estimate the target variable. The number of nodes in this hidden layer, as well as the number of input features, determines the number of adjustable weights (the free parameters) in the network. Because there is a danger of over-fitting the model, which occurs when the ANN is over-trained on a dataset so that it cannot generalize well when presented with new data, it is a good practice to have a large number of training data (we have 7170 binned data points) relative to the number of free parameters (we have 201 free parameters) (Weigend et al., 1990). To create a nonlinear system, an activation function transforms the product of the weights and input features and creates the values assigned to nodes in the hidden layer. These act as new features for estimating the target δ15N data. Our model utilizes the hyperbolic tangent as its activation function between the input and hidden layer, as well as between the hidden and output layer, due to its speed and general performance (Thimm and Fiesler, 1997).
The values of nodes in the hidden layer (H) can be defined as
where H is an array containing the values of the hidden nodes, and a is the activation function. I is a 7170×6 array containing the values of the input features at the locations of the binned observations (there are 7170 binned observations and six input parameters). W1 is a 6×25 array of weights that connect input features to hidden nodes, and b1 is a 7170×25 array of weights (25 unique values repeated 7170 times) that connects a bias node to the hidden nodes. The factor of 25 represents the number of nodes in the hidden layer, chosen by experimentation to find the maximum number of effective parameters (Foresee and Hagan, 1997), i.e., where adding new parameters no longer improves performance on an internal validation set (Step 4). The bias node acts as an offset term, similar to a constant term in a linear function, and has a value that is always one.
At the output layer, the network produces a prediction of the target nitrate isotopic data (δ15Npred). Similar to how nodes in the hidden layer are a function of the inputs and a set of weights, δ15Npred is a function of the hidden nodes and an additional set of weights. The predicted values can be defined as
where H (size 7170×25) has been previously defined, W2 (size 25×1) is a matrix of weights that connect features in the hidden layer to nodes in the output layer, and b2 (size 7170×1) is an array of weights (all of the same value) that connects a bias node to the output layer.
The ANN learns by comparing δ15Npred to the actual δ15N data (δ15Ndata), attempting to minimize the value of the cost function
by iteratively adjusting the weights using the Levenberg–Marquardt algorithm (Marquardt, 1963) as a way of propagating the errors between δ15Npred and δ15Ndata backwards though the network (Rumelhart et al., 1986).
2.2.4 Validating the ANN (Step 4)
To ensure good generalization of the trained ANN, we randomly withheld 10 % of the δ15N data to be used as an internal validation set for each network. These are data that the network never sees, meaning it does not factor into the cost function, so it works as a test of the ANN's ability to generalize. This internal validation set acts as a gatekeeper to prevent poor models from being accepted into the ensemble of trained networks (see Step 5). A second, independent or “external” validation set (blue symbols in Fig. 2), composed of complete ship transects from the high- and low-latitude ocean, was omitted from binning in Step 1 and used to establish the performance of the entire ensemble (Sect. 3.2). Our rationale for using complete ship transects is to have a validating observational dataset that is not highly correlated geographically with the data used to train the ANN. Using an external validation dataset from areas where the model has not “learned” anything about nitrate δ15N provides a more rigorous test of the model than would be provided by a randomly selected validating dataset.
2.2.5 Forming the ensemble (Step 5)
The ensemble is formed by repeating Steps 3 to 4 (using a different random 10 % validation set) until we obtain 25 trained networks for the nitrate δ15N dataset. A network is admitted into the ensemble if it yields an R2 value greater than 0.81 on the internal validation dataset. Using an EANN instead of any single network provides several advantages. For example, the random initialization of the weight values in each network as well as differences in the training and internal validation sets used across members make it possible for many different networks to achieve similar performance on their respective validation set while generalizing to areas with no data coverage differently. By performing this type of data subsampling and taking an ensemble average, similar to bootstrap aggregating (Breiman, 1996), this approach on average improves the robustness of the generalization in areas without data coverage compared to a single randomly generated ensemble member. Compared to each of its members, our ensemble mean sees improved performance on all internal validation sets and has a higher R2 and lower root mean square error on the independent validation set compared to 19 of the 25 members. The range of values given by the ensemble also provides a measure of the uncertainty for our estimations of δ15N.
3.1 Global nitrate δ15N observations
The global compilation of nitrate δ15N includes 1180 stations from all major ocean basins and some minor seas (Fig. 2) giving a total of 12 277 nitrate δ15N measurements. Within this dataset, 1197 nitrate δ15N measurements were withheld from the EANN and used to validate the EANN results (the “external” validation dataset; blue symbols in Fig. 2, see Sect. 2). With observations from the surface to as deep as 6002 m (Rafter et al., 2012), we find that nitrate δ15N ranges from ≈1 ‰ in the North Atlantic (e.g., Marconi et al., 2015) to 68.7 ‰ in the eastern tropical South Pacific (Bourbonnais et al., 2015). Nitrate δ15N of ≈1 ‰ was also irregularly observed in the shallow North and South Pacific (Liu et al., 1996; Yoshikawa et al., 2015). These latter observations were included in the training dataset, although we should note that measurements using the “Devarda's alloy” method (Liu et al., 1996) are thought to be biased towards low values (Altabet and Francois, 2001). Similarly, the inclusion of nitrite during “denitrifier method” nitrate δ15N measurements can bias the measurement towards lower values (Kemeny et al., 2016; Rafter et al., 2013).
3.2 Marine nitrate δ15N observations model comparison
The observed and EANN-predicted nitrate δ15N measurements are distributed around a 1:1 line in Fig. 3a (all data), with considerably less scatter for the values >1000 m depth (Fig. 3b). The correlation coefficient of determination for the observations versus the model nitrate δ15N gives an R2=0.75 for the raw and unbinned observations used to train the EANN (see Fig. 3a) and an R2 of 0.78 for the external validation dataset (not shown). The model matches the observations even better for depths >1000 m with an R2=0.83 (values used in model; Fig. 3b) and R2=0.78 for the external validation dataset (not shown). We can also examine the performance of the EANN with the nitrate δ15N “residual” or the difference between observed and modeled δ15N (Fig. 3c), which indicates a mean residual or “mean bias” value of −0.03 ‰ and +0.18 ‰ for the model training and external validation datasets, respectively.
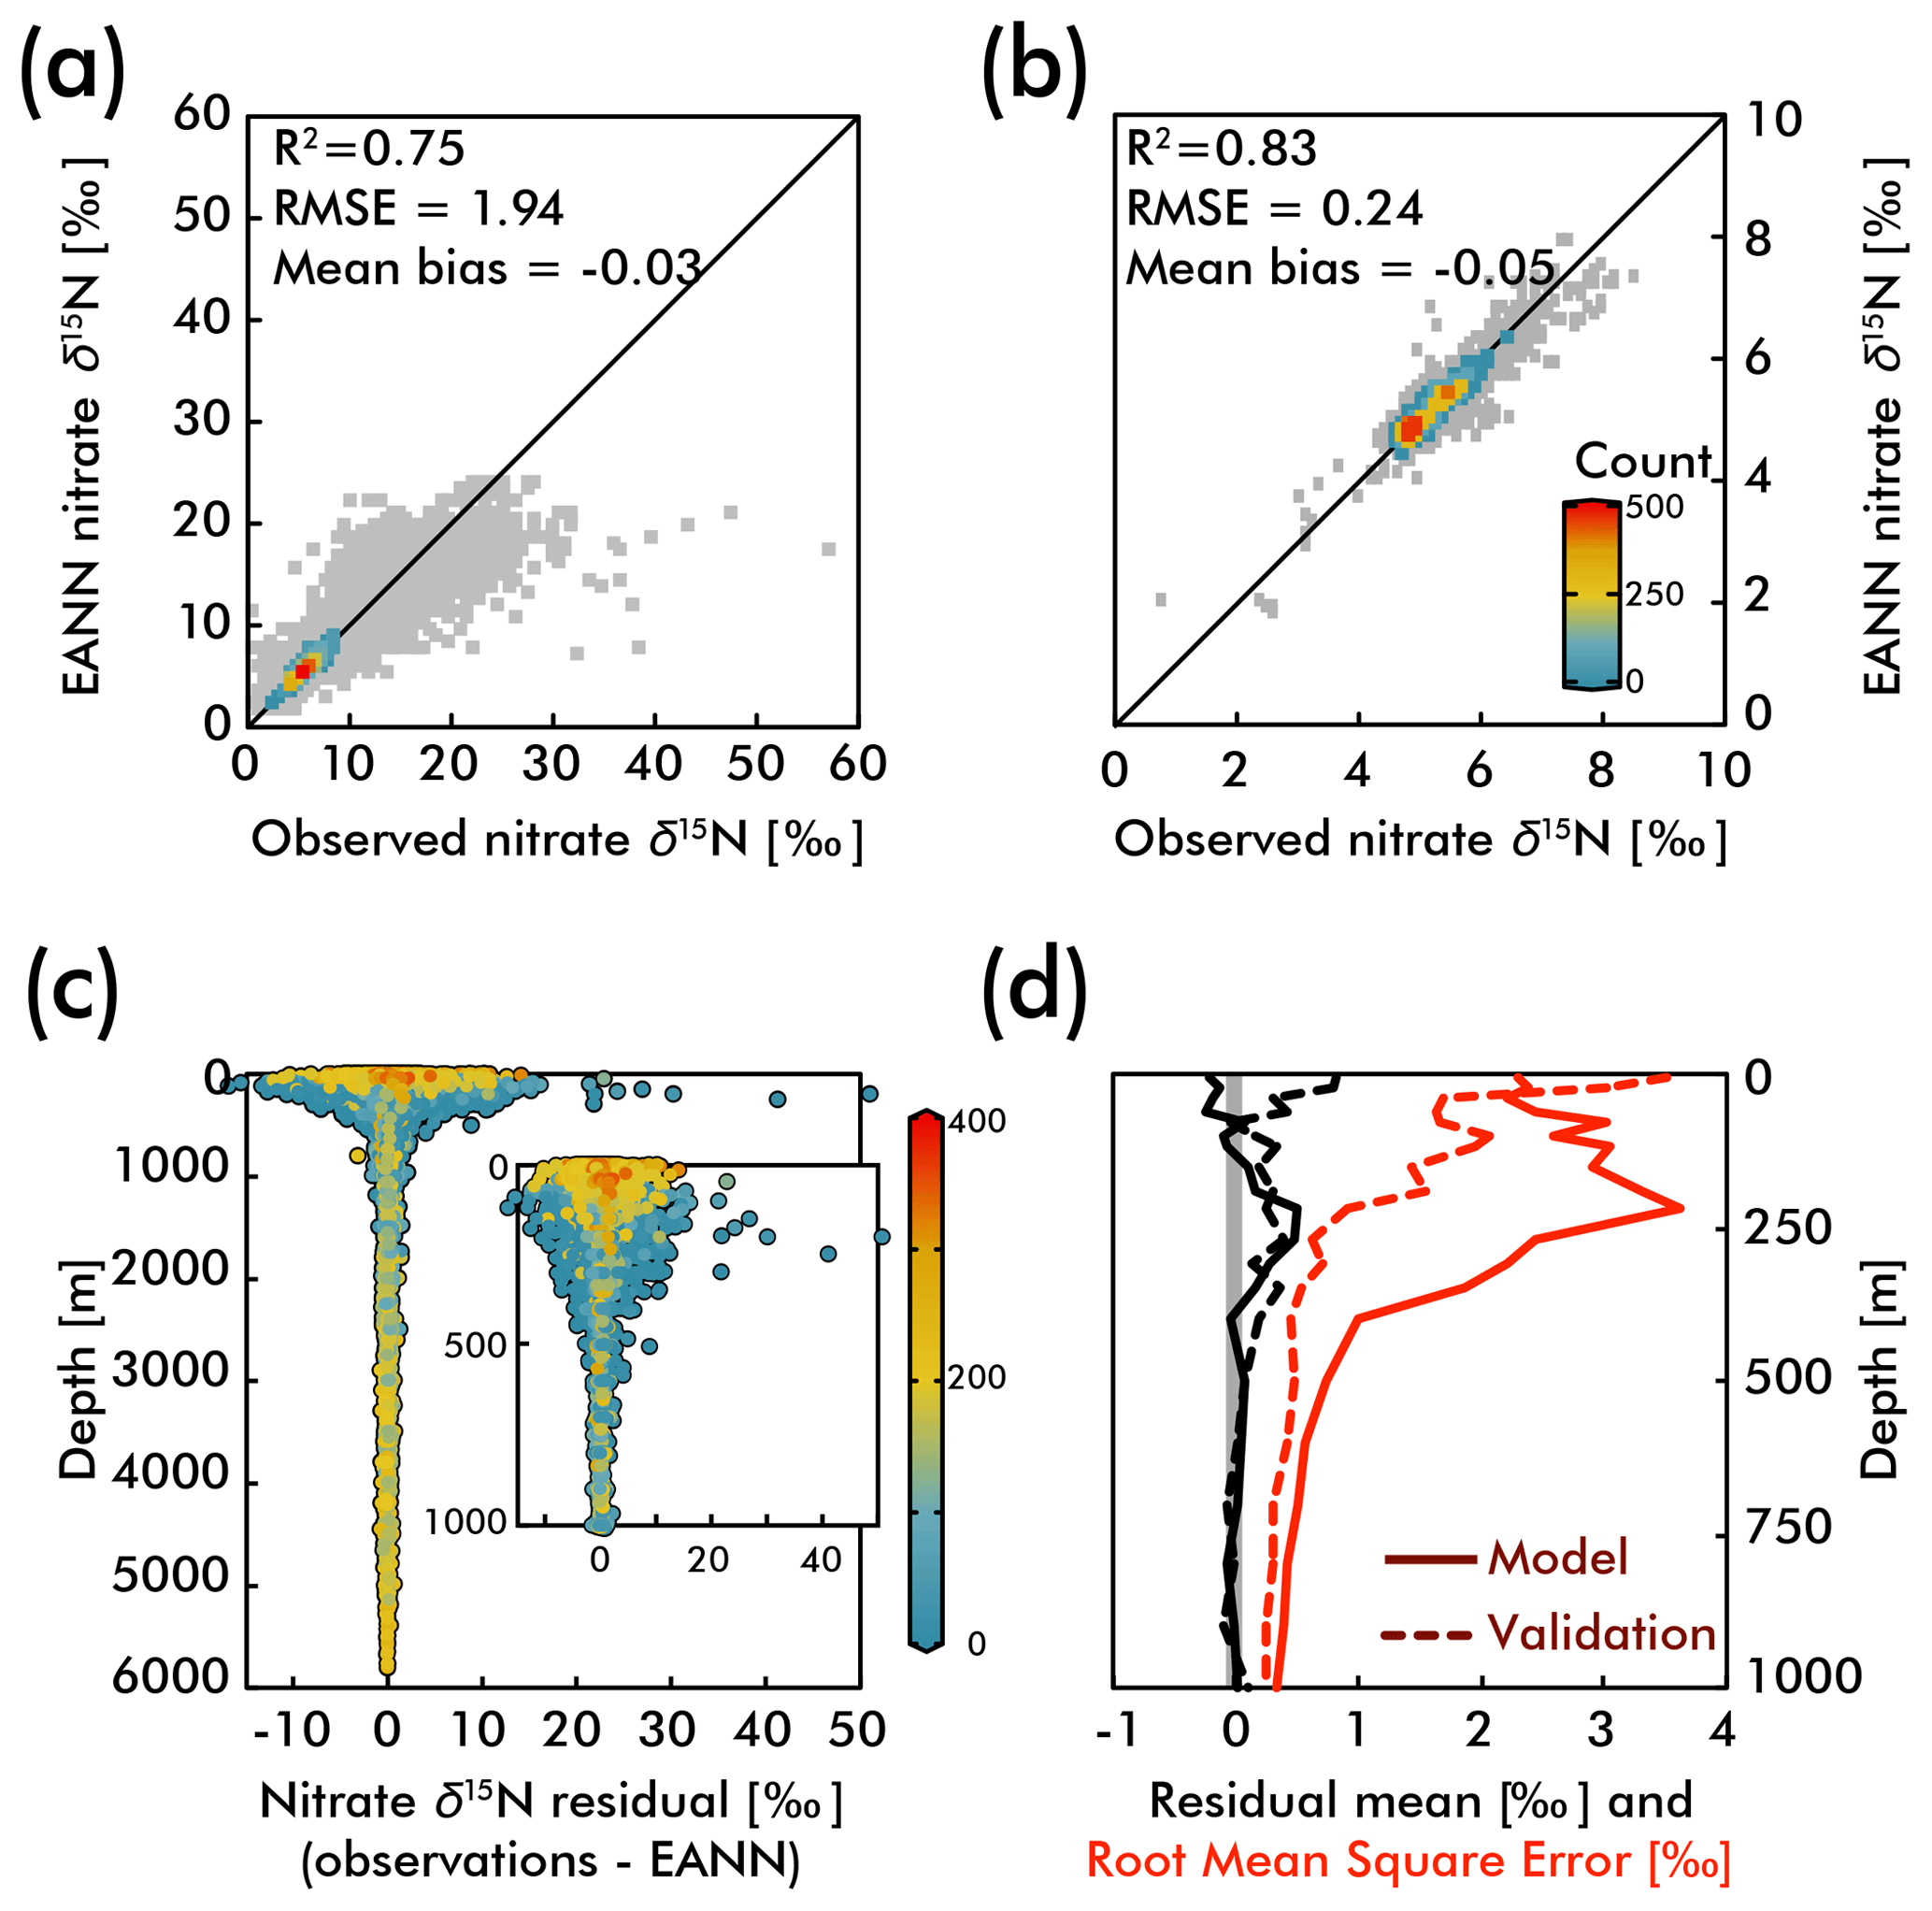
Figure 3The observed versus EANN-predicted nitrate δ15N are shown for all data at all depths in (a) and for >1000 m in (b). The colors indicate the number of comparisons on the World Ocean Atlas grid (legend in b; gray = 1 observation). The anomalously high observed nitrate δ15N values (>30 ‰) in (a) are exclusively from the eastern tropical South Pacific waters (Bourbonnais et al., 2015; Casciotti et al., 2013; Rafter et al., 2012; Ryabenko et al., 2012). The difference (or residual) between the observations and EANN nitrate δ15N is shown for all depths and the upper 1000 m in (c) with colors representing the dissolved oxygen content. Note the largest offsets between 100 and 500 m in (c) are associated with lowest oxygen content. Similarly, the mean residual (black) and root mean square error (RMSE; red) with depth (d) are highest in the upper 500 m. Dashed lines in (d) demonstrate the same statistics, but for the external validation dataset (blue in Fig. 2).
Examining the observation-EANN residuals via the root mean square error (RMSE; Fig. 3d), we find an RMSE of 1.94 ‰ for the data used to train the EANN and an RMSE of 1.26 ‰ for the external validation dataset. There is a clear relationship between the residual mean, the RMSE and depth, with significantly higher values for the upper 500 m (Fig. 3c and d). Comparing these with dissolved oxygen concentrations (color in Fig. 3c), we find that the largest residuals and RMSE are associated with high oxygen concentration near the surface and low oxygen concentrations at about 250 m.
The RMSE patterns in Fig. 3c and d are to be expected given the natural variability in nitrate δ15N driven by assimilation in the upper ocean and denitrification in the shallow subsurface – variability which is not captured by the climatological EANN. The only available nitrate δ15N time-series is by Rafter and Sigman (2016) in the eastern equatorial Pacific, and it shows that variability of nitrate assimilation produces seasonal-to-interannual deviations of δ15N of ±2.5 ‰, which is similar to the magnitude of the RMSE in the surface ocean (2.2 ‰). Although there are no nitrate δ15N time series measurements from the subsurface oxygen-deficient zone (ODZ) waters where denitrification occurs, nitrate δ15N in ODZs presumably have similar seasonal-to-interannual (or longer timescale) variability due to changes in the rate and extent of water column denitrification (Deutsch et al., 2011; Yang et al., 2017). For example, a larger-than-average rate of water column denitrification could explain the extreme δ15N values at the bottom right of Fig. 3a – observations that all come from the ODZ waters of the eastern tropical South Pacific (Bourbonnais et al., 2015; Casciotti et al., 2013; Rafter et al., 2012; Ryabenko et al., 2012). Some of these very high nitrate δ15N values are associated with nitrate concentrations <1 µmol kg−1 (Bourbonnais et al., 2015), values much lower than those within our climatology for the subsurface eastern tropical South Pacific. These values thus represent episodic denitrification events that the EANN will not be able to capture because it is trained on climatological data. In the deep ocean where temporal variability is smaller, the observation-EANN residuals of 0.2 ‰ are the same magnitude as the δ15N analytical errors, further emphasizing the ability of the model to match climatological average conditions.
The EANN's skillful estimate of climatological nitrate δ15N will be useful for studies of the marine nitrogen cycle. The zonal average view of EANN nitrate δ15N for each major ocean basin (Fig. 4) includes statistics comparing the observations to the EANN results above and below 1000 m. These region-specific statistics show a weaker correlation between EANN and observed nitrate δ15N in the deep Atlantic and Southern Ocean, despite a low RMSE and negligible mean bias. This weak correlation is due to the overall limited variability of deep nitrate δ15N (±0.1 ‰) in these basins, which is within the noise (analytical error) and the model cannot be expected to fit this variability (see Fig. 5d).
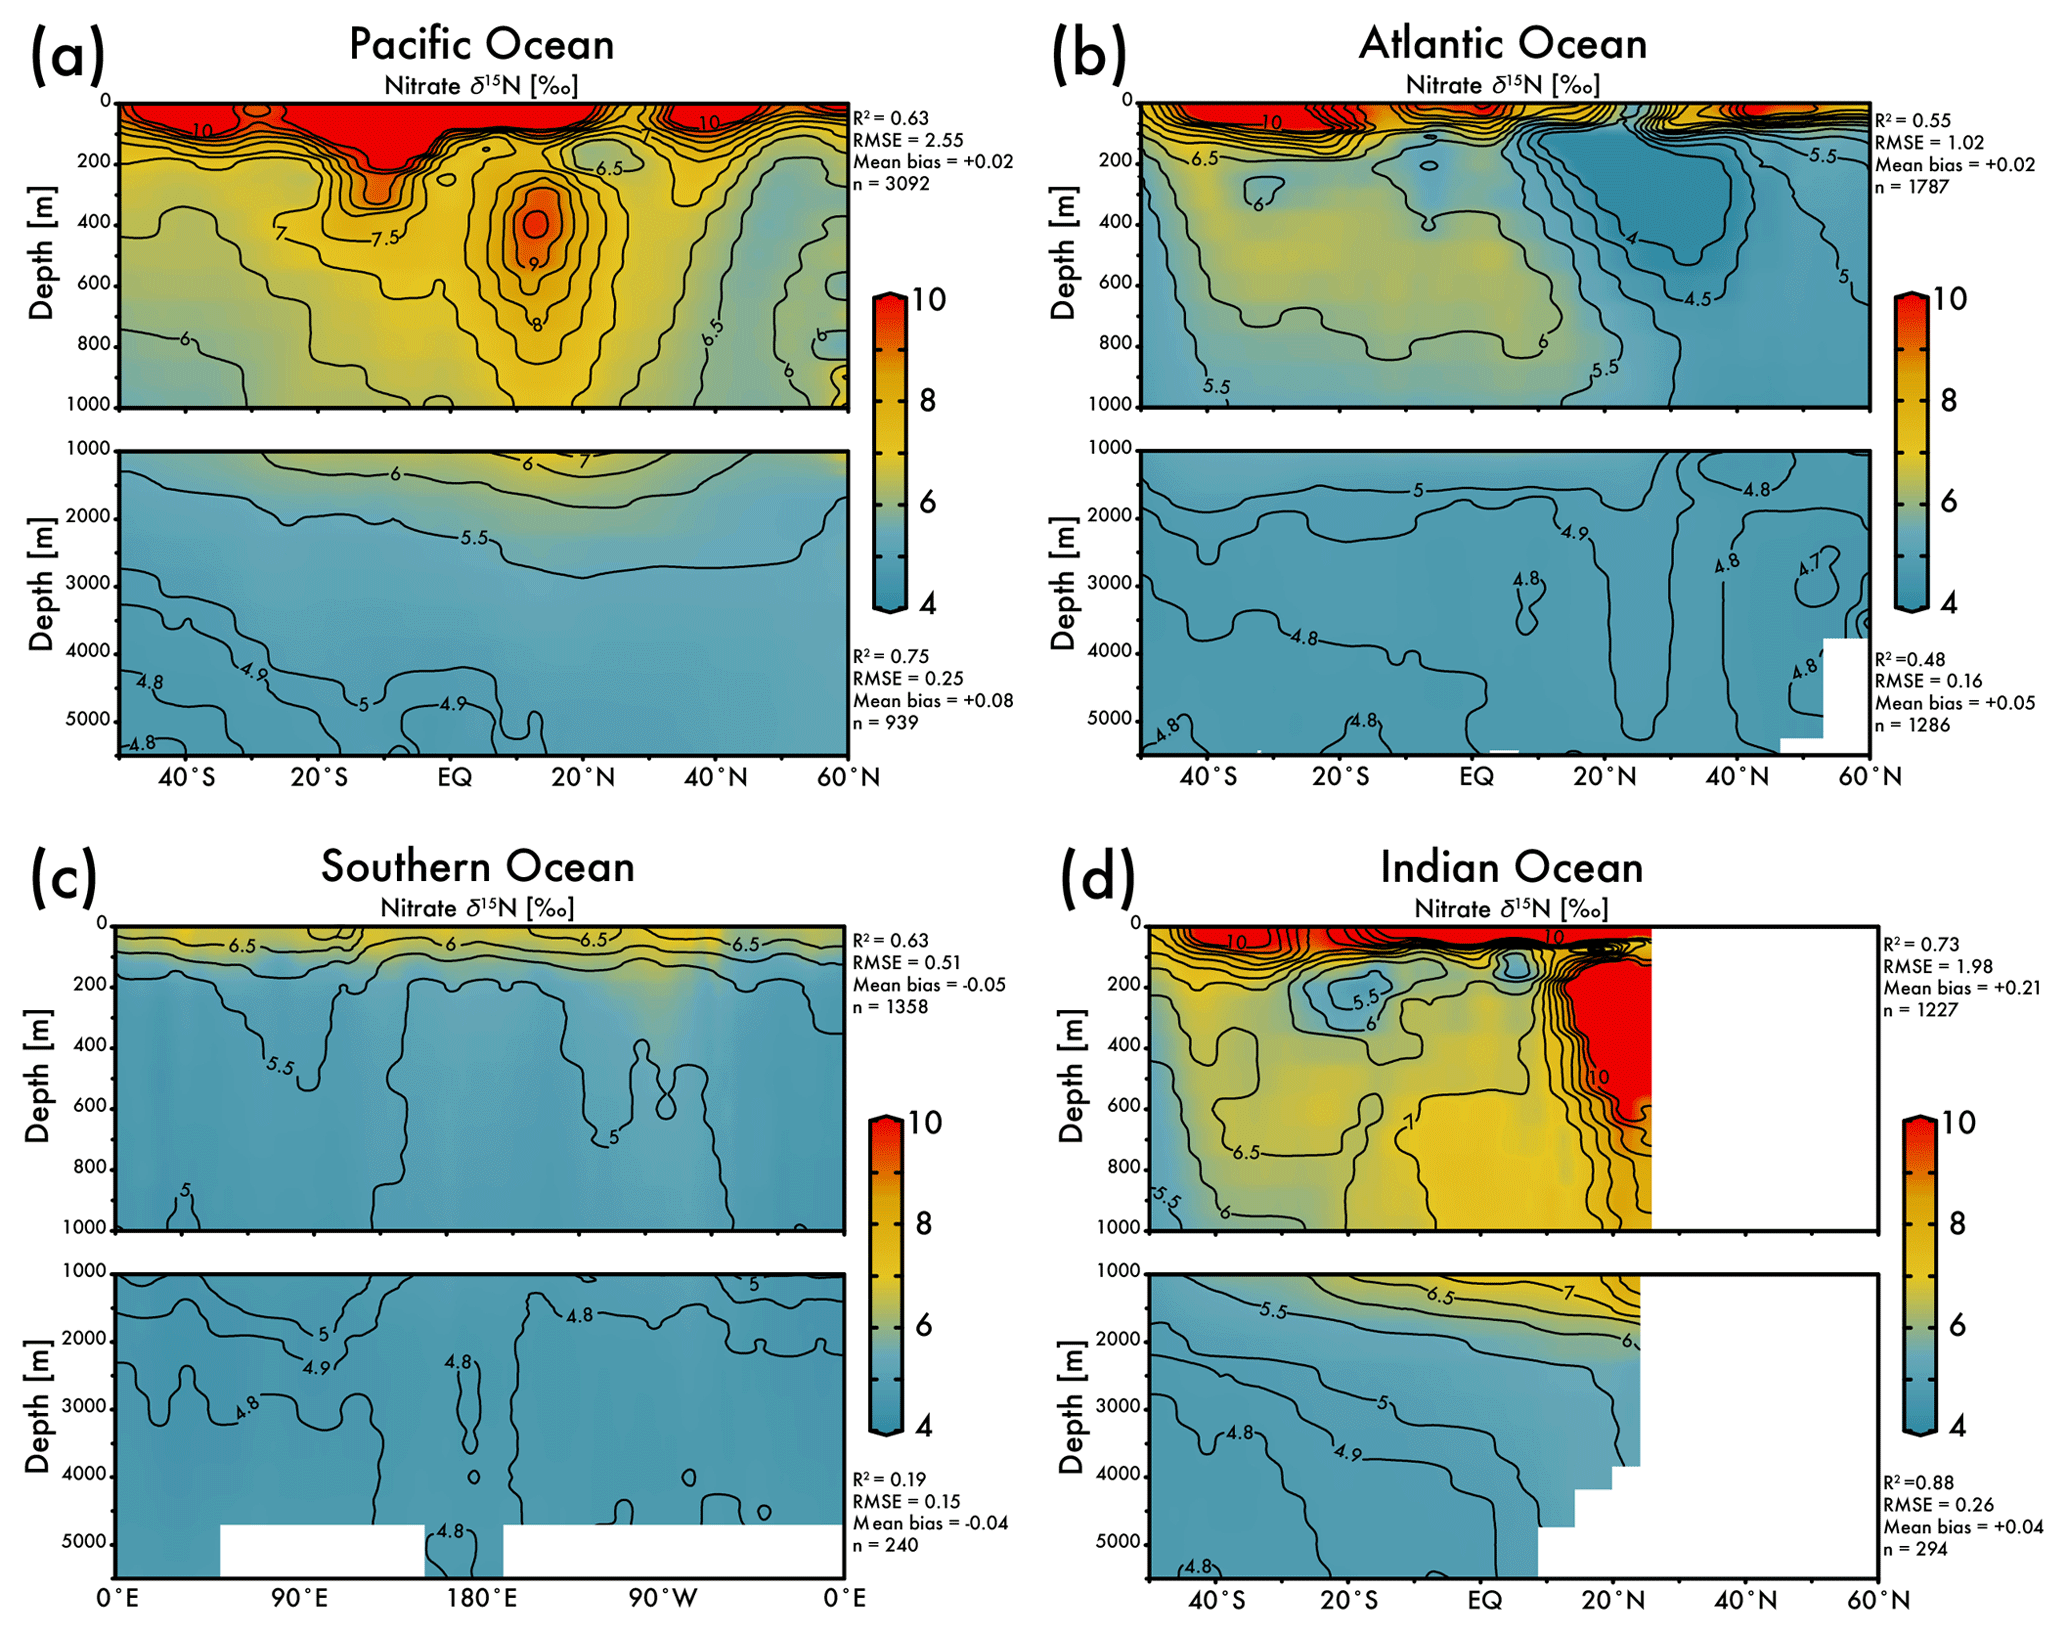
Figure 4Zonal average of model nitrate δ15N versus latitude or longitude for the (a) Pacific Ocean, (b) Atlantic Ocean, (c) Southern Ocean, and the (d) Indian Ocean. White bars indicate no data because of land. The R2, RMSE, mean bias, and total number (n) of observed versus EANN nitrate δ15N are shown on the right for each region and depth range. White indicates regions of no data coverage. Note that these zonally averaged views obscure zonal gradients in nitrate δ15N (see Fig. 5).
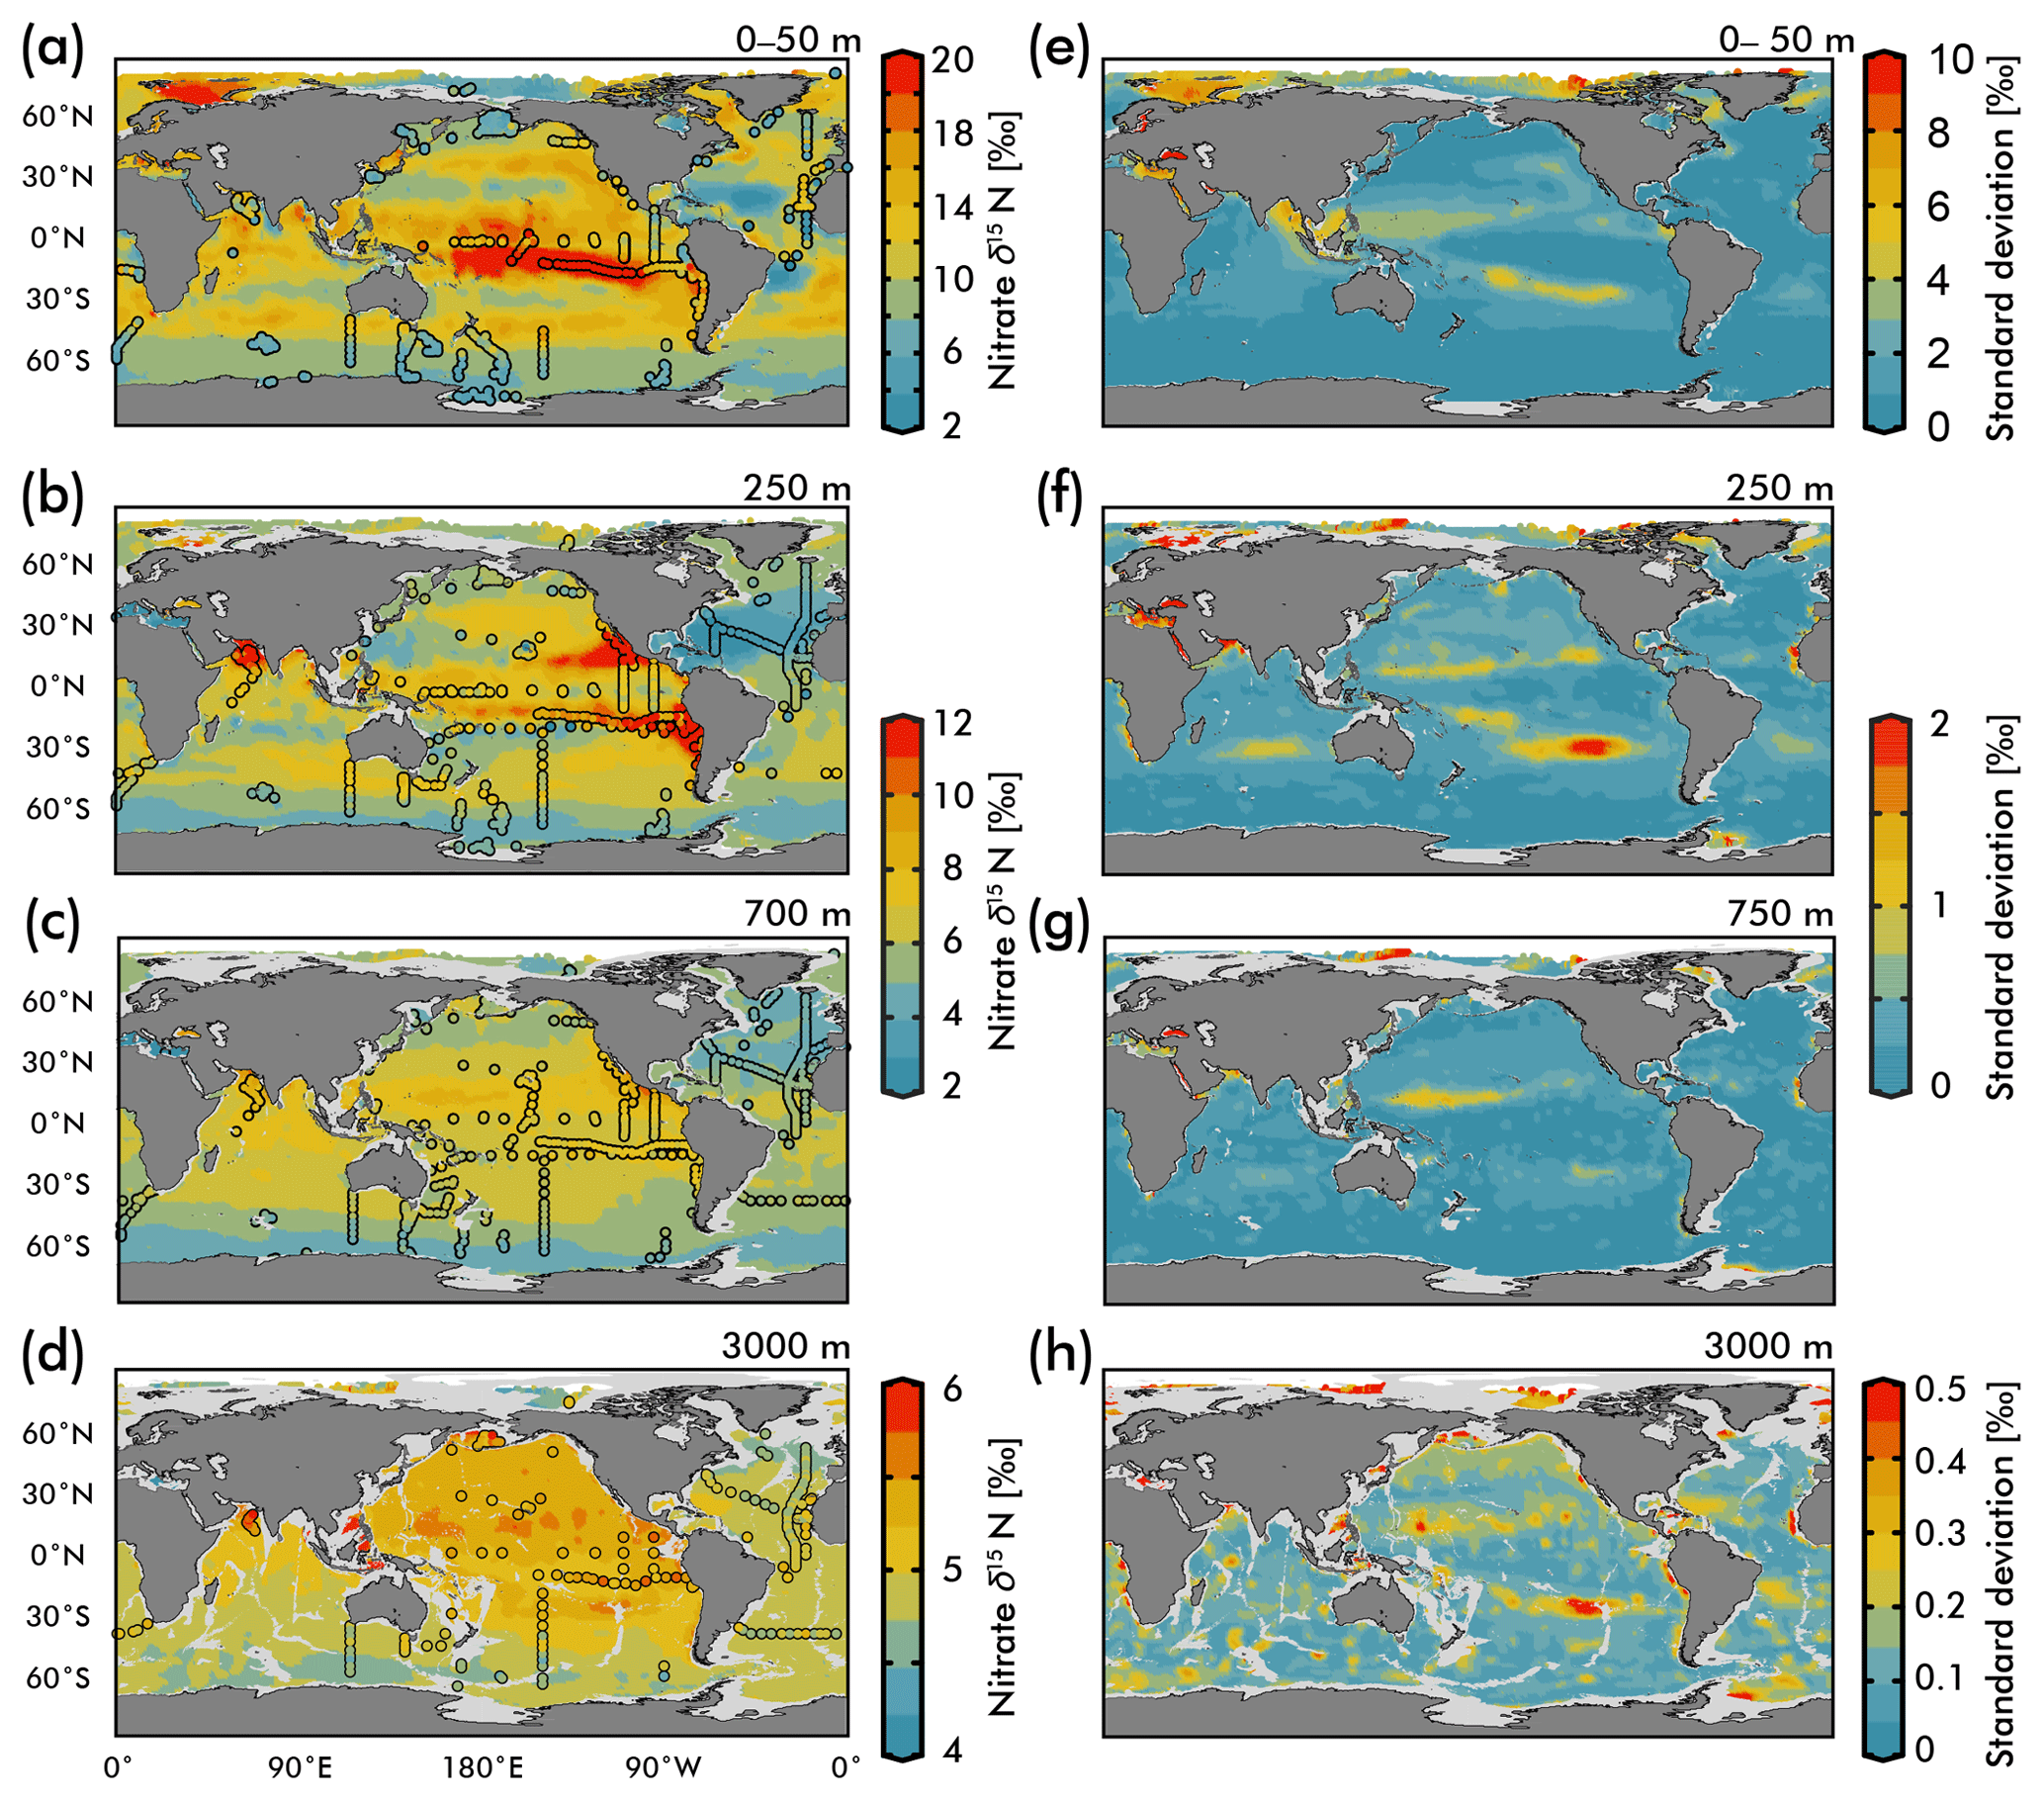
Figure 5(Left) Map view of nitrate δ15N from our EANN and our observations (circles) for the (a) average over the 0–50 m depth as well as the (b) 250 m, (c) 700 m, and (d) 3000 m depth surfaces. (Right) Map views of nitrate δ15N error from the EANN model nitrate δ15N for the same depth surfaces on the left.
The nitrate δ15N sections in Fig. 4 show elevated values for the low latitude, upper mesopelagic Pacific Ocean (Fig. 4a), and Indian Ocean (Fig. 4d) where water column denitrification raises the residual nitrate δ15N (Fig. 1a). Viewing this elevated nitrate δ15N at the 250 m depth horizon (Fig. 5) better reveals the spatial heterogeneity of the observations and EANN results. (It is because of this intra-basin heterogeneity, and the fact that many observations are biased towards the areas of denitrification, that we did not plot the observed nitrate δ15N within the zonally averaged Fig. 4 views.) The EANN error for the Fig. 5 depth intervals (Fig. 5e–h) is the standard deviation of the 25 ensemble members of the EANN and shows a decrease in ensemble variability with depth – a trend that is consistent with the overall decrease in observed nitrate δ15N variability with depth (Figs. 4 and 5).
Below we inspect the observed and EANN-predicted nitrate δ15N and discuss the consistency of these results with our understanding of published work. This analysis begins with the spatial distribution of nitrate delivered to the upper ocean. We then discuss the impacts of upper ocean nitrate assimilation on organic matter δ15N and consider the influence of organic matter remineralization on subsurface nitrate.
4.1 Subsurface and surface nitrate δ15N
The nitrate δ15N distribution at 250 m depth (Fig. 5b) offers a view of nitrate at a depth that is negligibly influenced by nitrate assimilation, and therefore provides a qualitative view of spatial trends in nitrate delivered to the surface ocean. Nitrate δ15N at this depth is highest in the northeastern and southeastern tropical Pacific and the Arabian Sea (Fig. 5b), due to the influence of water column denitrification in the ODZs in these regions (Altabet et al., 2012; Bourbonnais et al., 2015; Ryabenko et al., 2012), which preferentially uses the light isotope and leaves the residual nitrate enriched in 15N. A notable difference between the EANN and earlier model estimates of nitrate δ15N (Somes et al., 2010) is that the EANN captures the much higher nitrate δ15N in the Arabian Sea relative to the Bay of Bengal (a relationship that is consistent with observed active denitrification in the Arabian Sea).
Lowest δ15N values of subsurface 250 m nitrate are found in the Southern Ocean and in the North Atlantic. The North Atlantic subtropical gyre in particular has the lowest δ15N values in any basin (Fig. 5b; also see Marconi et al., 2015, 2017; Fawcett et al., 2011; Knapp et al., 2005, 2008), which has been attributed to the remineralization of low-δ15N organic matter originating from N2 fixation, which produces organic matter with a δ15N between 0 and −1 ‰ (similar to atmospheric N2; see Fig. 1b; Carpenter et al., 1997; Hoering and Ford, 1960). Earlier work argues that this nitrate δ15N lowering requires the bulk of Atlantic N2 fixation (≈90 %) to occur in the tropics (Marconi et al., 2017) followed by the advection of this remineralized nitrate to the North Atlantic. This contrasts with numerical models arguing for high N2 fixation rates in the North Atlantic (Ko et al., 2018) and South Atlantic (Wang et al., 2019). Similar local minima of subsurface δ15N appear in all the subtropical gyres (Fig. 5b), which is consistent with observations (Casciotti et al., 2008; Yoshikawa et al., 2015) and presumably indicates the importance of N2 fixation in these regions (e.g., Ko et al., 2018) and others. The N2 fixation δ15N signal in the Pacific Ocean (lowering in situ nitrate δ15N via remineralization of organic matter with lower δ15N) will be counteracted by the influence of water column denitrification in that basin (raising the δ15N of residual nitrate), which imparts a high-δ15N signal, but a local minimum in δ15N can still be seen in the Pacific subtropical gyres (Fig. 4a).
Nitrate assimilation by phytoplankton in the upper ocean is influenced by both the subsurface source nitrate δ15N and the degree of nitrate assimilation (Miyake and Wada, 1967; Wada and Hattori, 1978) (Fig. 1b). This gives the expectation that average nitrate δ15N values for the upper 50 m (Fig. 5a) will be consistently higher than those at 250 m (Fig. 5b). However, the highest observed and estimated values in the upper 50 m are not found above the ODZ regions, but are on the edges of high nitrate concentration upwelling zones in the Southern Ocean, equatorial Pacific, and subarctic gyres (contours in Fig. 2). Circulation in these “edge” regions allows for nitrate to be advected along the surface, lengthening its time in the surface ocean and allowing more utilization to elevate the residual nitrate δ15N pool. In other words, the degree of nitrate utilization appears to play a more important role in determining surface nitrate δ15N than the initial value. (This is not the case for the organic matter δ15N produced from this nitrate, which will be discussed more below.)
Despite our expectation of higher nitrate δ15N in the upper 50 m versus 250 m (Fig. 5a vs. b), we identify three types of regions where this difference is negative (Fig. 6): above ODZ waters, in subtropical Atlantic gyres, and north of the Bering Strait. The explanation for the negative values above the ODZ regions is that the nitrate δ15N at 250 m must be much higher than the nitrate δ15N upwelled to the surface. This is consistent with elevated ODZ nitrate δ15N having an indirect path to waters outside of ODZ regions (Peters et al., 2017; Rafter et al., 2013). The subtropical gyres also have modeled nitrate δ15N in the upper 50 m that is less than 250 m, but this finding is difficult to test with observations because of low nitrate concentrations. That said, the model predicts a lower nitrate δ15N in the upper ocean relative to that at 250 m, which is consistent with N2 fixation in these regions. Our estimated nitrate δ15N north of the Bering Strait suggests a previously unobserved elevation of subsurface values relative to the surface.
Our discussion above highlights the difficulty of distinguishing between the competing influences of the subsurface source nitrate δ15N and the degree of nitrate utilization on residual nitrate δ15N. Clearly a static depth does not reflect the subsurface source of nitrate delivered to the surface and a more robust method for estimating this subsurface source needs to be developed. However, some generalizations can be made regarding the organic matter δ15N produced in these regions and its potential influence (via remineralization) on subsurface nitrate throughout the water column via the export and remineralization of organic matter (Sigman et al., 2009a). For example, a local minimum in δ15N visible at 250 m depth in the eastern equatorial Pacific (Fig. 5b; also discussed in several studies; Rafter et al., 2012; Rafter and Sigman, 2016) is caused by the remineralization of organic matter with a low δ15N due to partial nitrate consumption at the surface. Below we discuss these and other influences on intermediate-depth nitrate δ15N.
4.2 Intermediate-depth nitrate δ15N variability
Waters at “intermediate” depths (here shown as the 750 m surface in Fig. 5c) are important because they are part of a large-scale circulation that originally upwells in the Southern Ocean and resupplies nutrients to the low-latitude thermocline (Palter et al., 2010; Sarmiento et al., 2004; Toggweiler et al., 1991; Toggweiler and Carson, 1995). Within the context of this overturning, the nitrate δ15N upwelling in the Southern Ocean begins at ≈5 ‰ (Figs. 4c and 5c) and is elevated ≈1 ‰ by partial nitrate assimilation in the Southern Ocean surface waters as they are advected equatorward (see Figs. 5a and 6; Rafter et al., 2012). Deep wintertime mixing in the subantarctic Pacific converts these Southern Ocean surface waters into mode and intermediate waters (Herraiz-Borreguero and Rintoul, 2011), introducing nitrate with a “preformed” δ15N of ≈6 ‰ into the intermediate-depth South Pacific and South Atlantic (Rafter et al., 2012, 2013; Tuerena et al., 2015) at depths between ≈ 600 and 1200 m (between ≈40∘ S and 20∘ N)(Fig. 4b).
Intermediate-depth nitrate δ15N increases from the Southern Ocean toward the Equator in the Pacific Ocean and the Indian Ocean, but less so in the Atlantic Ocean (Fig. 5). This contrast in intermediate-depth nitrate δ15N is likely caused by differences in δ15N of organic matter remineralized in these regions. The increase in intermediate-depth nitrate δ15N from the subantarctic to the tropical Pacific appears to result from the remineralization of organic matter with a δ15N increased by elevated source nitrate δ15N. Previous work suggests that direct mixing with denitrified waters represents only a small fraction of the change from the preformed high-latitude value (≈6 ‰) to tropical nitrate δ15N of ≈7 ‰ (Peters et al., 2017; Rafter et al., 2012, 2013). Similar processes likely elevate lower latitude intermediate-depth nitrate δ15N in the Indian Ocean. The Pacific and Indian basins contrast with the Atlantic, where the subsurface source nitrate δ15N is generally lower (Fig. 6b), N2 fixation is enhanced, and the remineralization of organic matter lowers subsurface nitrate δ15N (Marconi et al., 2017).
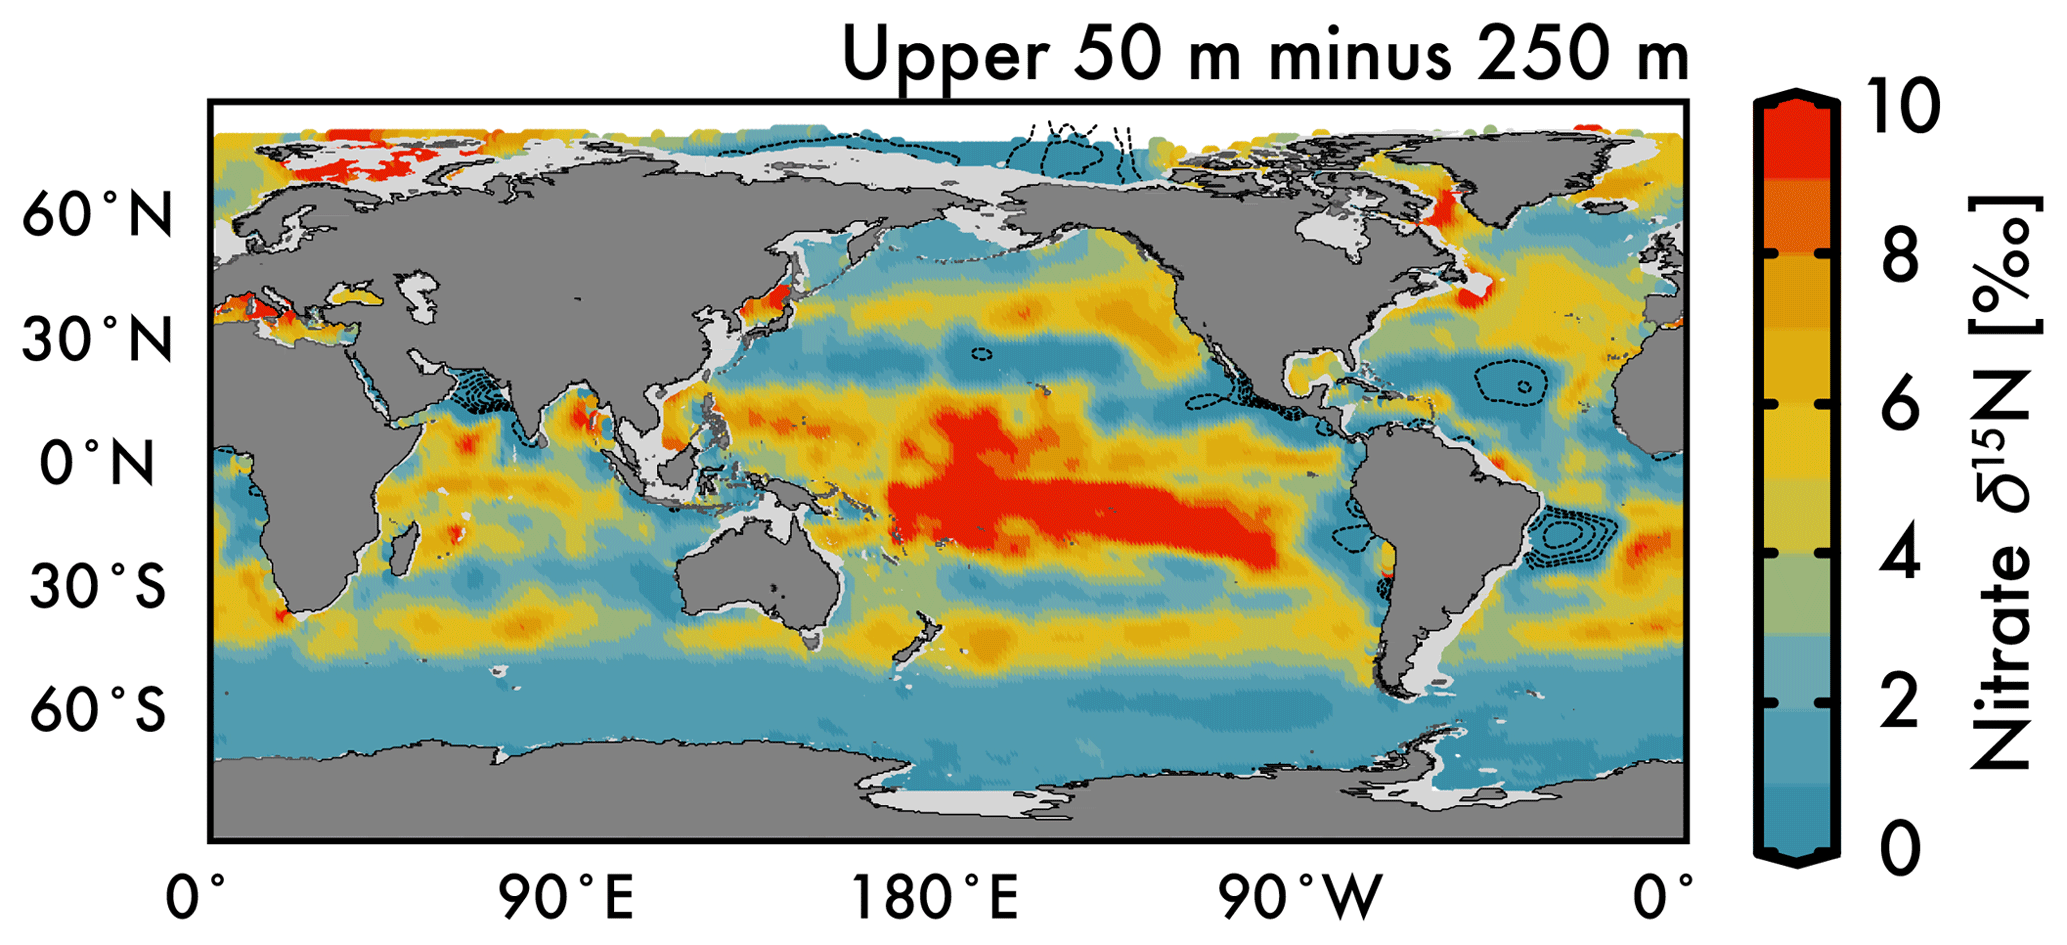
Figure 6Difference between the average nitrate δ15N in the upper 50 m and 250 m depths in Fig. 5. Dashed contours in low-latitude ODZ regions and subtropical gyres indicate regions where nitrate δ15N at 250 m is greater than the upper 50 m nitrate δ15N.
4.3 Deep-sea nitrate δ15N trends
Our discussion above suggests that the basin-scale balance of N2 fixation and water column denitrification is a major contributor to inter-basin nitrate δ15N gradients in the upper ocean (<1000 m; see Fig. 5), lowering values in the Atlantic Ocean compared to the Pacific and Indian oceans. By averaging EANN nitrate δ15N with depth for each ocean basin (Fig. 7), we find that these basin-scale nitrate δ15N differences also persist into the deep sea (here defined as ≥3000 m and below). Note that the inter-basin EANN nitrate δ15N gradients in Fig. 7a are smaller than the corresponding inter-basin gradients in observed δ15N, because the observations are spatially biased towards areas of water column denitrification in the Pacific and Indian oceans (see Fig. 2).
The remineralization of organic matter is one process that can – and has been used to – explain both the elevation of deep Pacific nitrate δ15N (Peters et al., 2017; Rafter et al., 2013; Sigman et al., 2009a) and lowering of deep Atlantic nitrate δ15N (Knapp et al., 2008; Marconi et al., 2017; Tuerena et al., 2015) relative to the deep ocean mean. Here we provide two additional pieces of evidence that argue for the remineralization of organic matter as the key driver of these deep-sea nitrate δ15N differences. Our first piece of evidence is that the average subsurface source of nitrate to the Pacific Ocean and Indian Ocean surfaces has a significantly higher δ15N (by 2 ‰ at the 250 m depth surface) than the Atlantic and Southern Ocean (Figs. 5b and 7). Nitrate δ15N at 250 m is an admittedly imprecise estimate for the nitrate upwelled to the surface, but even a slight elevation in Pacific source nitrate δ15N and near-complete nitrate utilization at the surface will translate into higher sinking organic matter δ15N (i.e., see Fig. 1b).

Figure 7Mean EANN nitrate δ15N (solid line) and 1σ standard deviation (envelope) with depth for each ocean basin. Note change in vertical and horizontal axes between (a) and (b).
Our second piece of evidence that the export and remineralization of organic matter drives the inter-basin differences in deep nitrate δ15N comes from sediment trap measurements. Averaging published sediment trap organic matter δ15N from the subtropical and tropical Pacific gives a value of 8.5±2.9 ‰ (Knapp et al., 2016; Robinson et al., 2012), which is significantly higher than measured in traps from the Atlantic (4.5±1.5 ‰) (Freudenthal et al., 2001; Holmes et al., 2002; Lavik, 2000; Thunell et al., 2004). Given observed Southern Ocean nitrate characteristics (Rafter et al., 2013), we estimate an even lower typical sinking organic matter δ15N of +1.5 ‰ for this region, which assumes initial nitrate values equal the upper circumpolar deep water and final values from the open Antarctic zone. This value is consistent with annually averaged sinking organic matter δ15N of ≈0.9 ‰ to 1.6 ‰ in the open Antarctic zone (Lourey et al., 2003), although published sediment trap results from the iron-fertilized Kerguelen Plateau region are predictably higher because of increased nitrate utilization at the surface (Trull et al., 2008). The much lower Southern Ocean sinking organic matter δ15N is consistent with partial consumption of nitrate at the surface (see Fig. 1b), which works export nitrate with elevated δ15N to intermediate waters throughout the Southern Hemisphere (see discussion above and Rafter et al., 2012, 2013). Based on this evidence, it appears that global patterns of sinking organic matter δ15N are consistent with the remineralization of this organic matter driving subtle, but significant differences in deep-sea nitrate δ15N.
An alternative explanation for the deep-sea nitrate δ15N differences in Fig. 7 and Table 1 is that they reflect the lateral (along isopycnal) advection of elevated nitrate δ15N from the shallower Pacific and Indian Ocean ODZ regions. However, we can easily dismiss this explanation by looking at the meridional trends in deep-sea nitrate δ15N – following the deep waters from their entrance in the south and movement northward. What we find is that deep EANN nitrate δ15N (Fig. 5d) is lowest in the Southern Ocean and increases equatorward in the Pacific (Table 1). Average deep-sea nitrate δ15N for the global ocean is 5.0±0.3 ‰, but average observed nitrate δ15N below 3000 m increases from 4.7±0.1 ‰ in the Pacific sector of the Southern Ocean to 4.9±0.2 ‰ in the deep South Pacific, 5.4±0.2 ‰ in the deep tropical Pacific, and 5.2±0.2 ‰ in the deep North Pacific (Table 1). This is consistent with elevated organic matter δ15N being produced at the surface and remineralized at depth in the lower-latitude Pacific Ocean. This is also consistent with the known increase in nitrate concentrations and lowering of deep oxygen concentrations from the deep South Pacific to tropical and North Pacific (e.g., see Fig. 4e in Rafter et al., 2013). This contrasts with the Atlantic, where there is with no significant change in deep nitrate δ15N, despite the export of slightly elevated nitrate δ15N into intermediate-depth Atlantic (see above and Tuerena et al., 2015). In summary, inter-basin differences in sinking organic matter δ15N best explains the inter-basin differences in the deep-ocean δ15N climatology. Diapycnal mixing from the low-latitude Pacific ODZ regions may also play a part in the south-to-north elevation of deep Pacific nitrate δ15N – a contribution that can be quantified by integrating the climatological nitrate δ15N fields with ocean circulation models.
Table 1Average EANN nitrate δ15N ≥3000 m for each ocean region (tropical being between 23.5∘ N and 23.5∘ S).
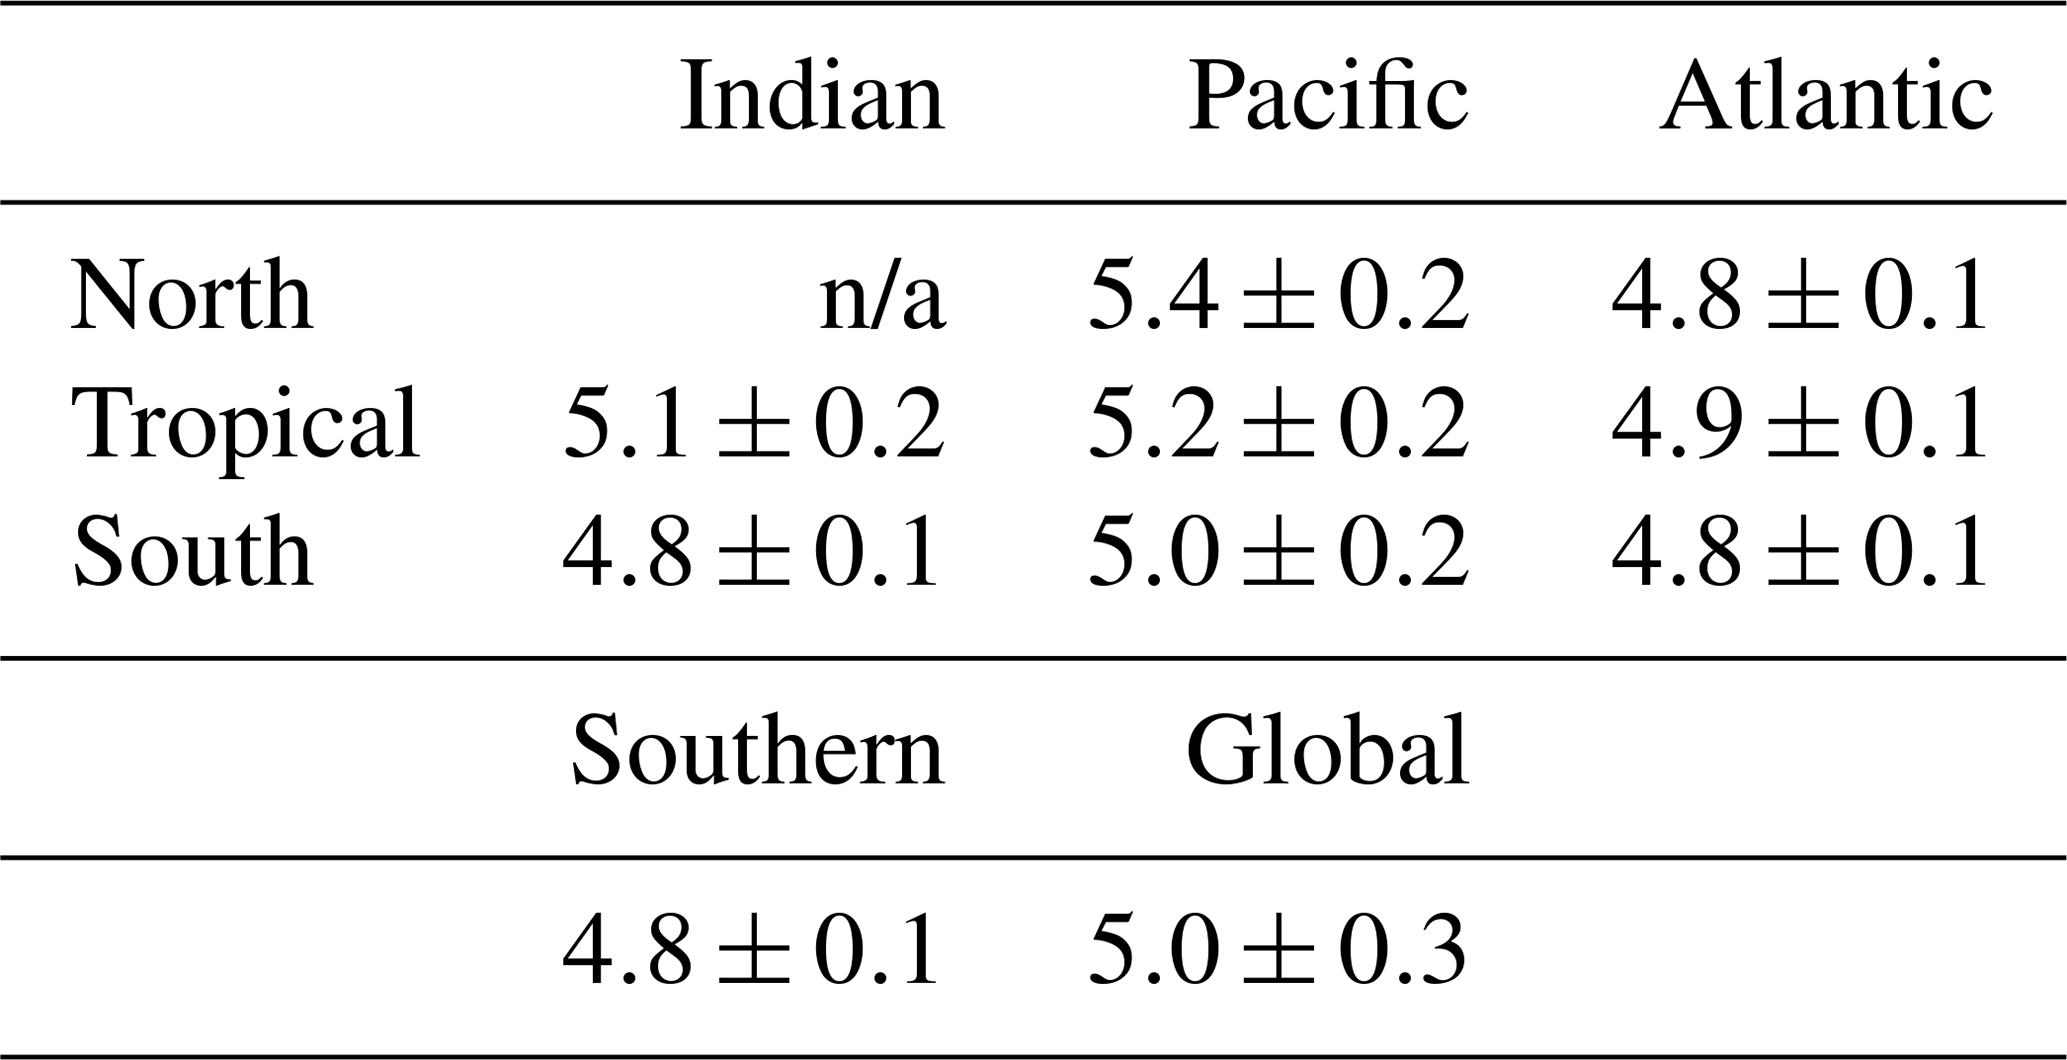
n/a – not applicable
We find that an ensemble of artificial neural networks (EANN) can be trained on climatological distributions of physical and biogeochemical tracers to reproduce a global database of nitrate δ15N observations (Fig. 2) with good fidelity (Fig. 3). We used the EANN to produce global climatological maps of nitrate δ15N at 1∘ resolution from the surface to the seafloor. This climatology reveals large-scale spatial patterns in nitrate δ15N (Figs. 4–6) and quantifies regional and basin-average oceanic values of nitrate δ15N (Fig. 7 and Table 1). Major differences between the observed and EANN-predicted nitrate δ15N appear to be caused by temporal variability of nitrate δ15N in the upper ocean and in ODZs associated with variable nitrate uptake and denitrification rates, respectively. Additional measurements of nitrate δ15N will help to develop seasonally resolved maps that can improve upon the climatological mean map provided here.
Observations can be obtained at https://doi.org/10.1575/1912/bco-dmo.768627.1 (Rafter et al., 2019a). Model output and code can be obtained at https://doi.org/10.1575/1912/bco-dmo.768655.1 (Rafter et al., 2019b).
Data compilation was done by PAR. The ANN was developed by AB and TD. Coding and statistics were done by AB and PAR. All authors contributed to writing the manuscript.
The authors declare that they have no conflict of interest.
We thank Mark Altabet, Karen Casciotti, Alyson Santoro, Benoit Pasquier, J. J. Becker, two anonymous reviewers, and Markus Kienast, as well as Julie Granger and Daniel Sigman for (at-the-time) unpublished data. A complete list of references can be found in the Appendix. Many figures were made using Ocean Data View software (Schlitzer, 2002). Custom-made color palettes are available via https://prafter.com/ (last access: 1 January 2019). Timothy DeVries acknowledges support from NSF grant OCE-1658392.
This paper was edited by Perran Cook and reviewed by two anonymous referees.
Altabet, M. A.: Constraints on oceanic N balance/imbalance from sedimentary 15N records, Biogeosciences, 4, 75–86, https://doi.org/10.5194/bg-4-75-2007, 2007.
Altabet, M. A. and Francois, R.: Sedimentary nitrogen isotopic ratio as a recorder for surface ocean nitrate utilization, Global Biogeochem. Cy., 8, 103–116, 1994a.
Altabet, M. A. and Francois, R.: The use of nitrogen isotopic ratio for reconstruction of past changes in surface ocean nutrient utilization, in Carbon Cycling in the Glacial Ocean: Constraints on the Ocean's Role in Global Change, Vol. 117, 281–306, Springer-Verlag Berlin Heidelberg, 1994b.
Altabet, M. A. and Francois, R.: Nitrogen isotope biogeochemistry of the antarctic polar frontal zone at 170∘ W, Deep-Sea Res. Pt. II, 48, 4247–4273, 2001.
Altabet, M. A., Murray, D. W., and Prell, W. L.: Climatically linked oscillations in Arabian Sea denitrification over the past 1 m.y.: Implications for the marine N cycle, Paleoceanography, 14, 732–743, 1999.
Altabet, M. A., Ryabenko, E., Stramma, L., Wallace, D. W. R., Frank, M., Grasse, P., and Lavik, G.: An eddy-stimulated hotspot for fixed nitrogen-loss from the Peru oxygen minimum zone, Biogeosciences, 9, 4897–4908, https://doi.org/10.5194/bg-9-4897-2012, 2012.
Altabet, M. A., Pilskaln, C., Thunell, R., Pride, C., Sigman, D., Chavez, F., and Francois, R.: The nitrogen isotope biogeochemistry of sinking particles from the margin of the Eastern North Pacific, Deep-Sea Res. Pt. I, 46, 655–679, 1999.
Bourbonnais, A., Lehmann, M. F., Waniek, J. J., and Schulz-Bull, D. E.: Nitrate isotope anomalies reflect N2 fixation in the Azores Front region (subtropical NE Atlantic), J. Geophys. Res., 114, C03003, https://doi.org/10.1029/2007JC004617, 2009.
Bourbonnais, A., Altabet, M. A., Charoenpong, C. N., Larkum, J., Hu, H., Bange, H. W., and Stramma, L.: N-loss isotope effects in the Peru oxygen minimum zone studied using a mesoscale eddy as a natural tracer experiment, Global Biogeochem. Cy., 29, 793–811, https://doi.org/10.1002/2014GB005001, 2015.
Brandes, J. A., Devol, A. H., Yoshinari, T., Jayakumar, D. A., and Naqvi, S. W. A.: Isotopic composition of nitrate in the central Arabian Sea and eastern tropical North Pacific: A tracer for mixing and nitrogen cycles, Limnol. Oceanogr., 43, 1680–1689, 1998.
Breiman, L.: Bagging predictors, Mach. Learn., 24, 123–140, https://doi.org/10.1007/BF00058655, 1996.
Carpenter, E. J., Harvey, H. R., Fry, B., and Capone, D. G.: Biogeochemical tracers of the marine cyanobacterium Trichodesmium, Deep-Sea Res. Pt. I, 44, 27–38, https://doi.org/10.1016/s0967-0637(96)00091-x, 1997.
Casciotti, K. L. and McIlvin, M. R.: Isotopic analyses of nitrate and nitrite from reference mixtures and application to Eastern Tropical North Pacific waters, Mar. Chem., 107, 184–201, https://doi.org/10.1016/j.marchem.2007.06.021, 2007.
Casciotti, K. L., Trull, T. W., Glover, D. M., and Davies, D.: Constraints on nitrogen cycling at the subtropical North Pacific Station ALOHA from isotopic measurements of nitrate and particulate nitrogen, Deep-Sea Res. Pt. II, 55, 1661–1672, https://doi.org/10.1016/j.dsr2.2008.04.017, 2008.
Casciotti, K. L., Buchwald, C., and McIlvin, M.: Implications of nitrate and nitrite isotopic measurements for the mechanisms of nitrogen cycling in the Peru oxygen deficient zone, Deep-Sea Res. Pt. I, 80, 78–93, https://doi.org/10.1016/j.dsr.2013.05.017, 2013.
Cline, J. D. and Kaplan, I. R.: Isotopic fractionation of dissolved nitrate during denitrification in the eastern tropical North Pacific Ocean, Mar. Chem., 3, 271–299, https://doi.org/10.1016/0304-4203(75)90009-2, 1975.
Codispoti, L. and Christensen, J.: Nitrification, denitrification and nitrous oxide cycling in the eastern tropical South Pacific ocean, Mar. Chem., 16, 277–300, https://doi.org/10.1016/0304-4203(85)90051-9, 1985.
Dehairs, F., Fripiat, F., Cavagna, A.-J., Trull, T. W., Fernandez, C., Davies, D., Roukaerts, A., Fonseca Batista, D., Planchon, F., and Elskens, M.: Nitrogen cycling in the Southern Ocean Kerguelen Plateau area: evidence for significant surface nitrification from nitrate isotopic compositions, Biogeosciences, 12, 1459–1482, https://doi.org/10.5194/bg-12-1459-2015, 2015.
De Pol-Holz, R., Robinson, R. S., Hebbeln, D., Sigman, D. M., and Ulloa, O.: Controls on sedimentary nitrogen isotopes along the Chile margin, Deep-Sea Res. Pt. II, 56, 1100–1112, https://doi.org/10.1016/j.dsr2.2008.09.014, 2009.
Deutsch, C., Brix, H., Ito, T., Frenzel, H., and Thompson, L.: Climate-Forced Variability of Ocean Hypoxia, Science, 333, 336–339, https://doi.org/10.1126/science.1202422, 2011.
DeVries, T., Deutsch, C., Rafter, P. A., and Primeau, F.: Marine denitrification rates determined from a global 3-D inverse model, Biogeosciences, 10, 2481–2496, https://doi.org/10.5194/bg-10-2481-2013, 2013.
DiFiore, P. J., Sigman, D. M., Trull, T. W., Lourey, M. J., Karsh, K., Cane, G., and Ho, R.: Nitrogen isotope constraints on subantarctic biogeochemistry, J. Geophys. Res.-Oceans, 111, C08016, https://doi.org/10.1029/2005jc003216, 2006.
Dugdale, R. C. and Goering, J. J.: Uptake of new and regenerated forms of nitrogen in primary production, Limnol. Oceanogr., 12, 196–206, 1967.
Eugster, O., Gruber, N., Deutsch, C., Jaccard, S. L., and Payne, M. R.: The dynamics of the marine nitrogen cycle across the last deglaciation, Paleoceanography, 28, 116–129, https://doi.org/10.1002/palo.20020, 2013.
Fawcett, S. E., Lomas, M., Casey, J. R., Ward, B. B., and Sigman, D. M.: Assimilation of upwelled nitrate by small eukaryotes in the Sargasso Sea, Nat. Geosci., 4, 717–722, https://doi.org/10.1038/ngeo1265, 2011.
Finney, B. P., Gregory-Eaves, I., Douglas, M. S. V., and Smol, J. P.: Impacts of Climatic Change and Fishing on Pacific Salmon Abundance Over the Past 300 Years, Science, 290, 795–799, 2000.
Finney, B. P., Gregory-Eaves, I., Douglas, M. S. V., and Smol, J. P.: Fisheries productivity in the northeastern Pacific Ocean over the past 2,200 years, Nature, 416, 729–733, https://doi.org/10.1038/416729a, 2002.
Foresee, F. D. and Hagan, M. T.: Gauss-Newton approximation to Bayesian learning, in: Proceedings of International Conference on Neural Networks (ICNN'97), Vol. 3, 1930–1935, IEEE, Houston, TX, USA, 1997.
Freudenthal, T., Neuer, S., Meggers, H., Davenport, R., and Wefer, G.: Influence of lateral particle advection and organic matter degradation on sediment accumulation and stable nitrogen isotope ratios along a productivity gradient in the Canary Islands region, Mar. Geol., 17, 93–109, 2001.
Fripiat, F., Declercq, M., Sapart, C. J., Anderson, L. G., Bruechert, V., Deman, F., Fonseca-Batista, D., Humborg, C., Roukaerts, A., Semiletov, I. P., and Dehairs, F.: Influence of the bordering shelves on nutrient distribution in the Arctic halocline inferred from water column nitrate isotopes, Limnol. Oceanogr., 63, 2154–2170, 2018.
Galbraith, E. D.: Interactions between climate and the marine nitrogen cycle on glacial-interglacial timescales, University of British Columbia, Vancouver, 2007.
Garcia, H. E., Locarnini, T. P., Boyer, T. P., Antonov, J. I., Zweng, M. M., Baranova, O. K., and Johnson, D. R.: Volume 4: Nutrients (phosphate, nitrate, and silicate), in: World Ocean Atlas 2009, 1–44, U.S. Government Printing Office, Washington, D.C., 2010.
Gaye, B., Nagel, B., Dähnke, K., Rixen, T., and Emeis, K.-C.: Evidence of parallel denitrification and nitrite oxidation in the ODZ of the Arabian Sea from paired stable isotopes of nitrate and nitrite, Global Biogeochem. Cy., 27, 1059–1071, https://doi.org/10.1002/2011GB004115, 2013.
Graham, B. S., Grubbs, D., Holland, K., and Popp, B. N.: A rapid ontogenetic shift in the diet of juvenile yellowfin tuna from Hawaii, Mar. Biol., 150, 647–658, https://doi.org/10.1007/s00227-006-0360-y, 2007.
Granger, J., Prokopenko, M. G., Sigman, D. M., Mordy, C. W., Morse, Z. M., Morales, L. V., Sambrotto, R. N., and Plessen, B.: Coupled nitrification-denitrification in sediment of the eastern Bering Sea shelf leads to 15N enrichment of fixed N in shelf waters, J. Geophys. Res.-Oceans, 116, C11006, https://doi.org/10.1029/2010jc006751, 2011.
Granger, J., Prokopenko, M. G., Mordy, C. W., and Sigman, D. M.: The proportion of remineralized nitrate on the ice-covered eastern Bering Sea shelf evidenced from the oxygen isotope ratio of nitrate, Global Biogeochem. Cy., 27, 962–971, https://doi.org/10.1002/gbc.20075, 2013.
Herraiz-Borreguero, L. and Rintoul, S. R.: Subantarctic mode water: distribution and circulation, Ocean Dynam., 61, 103–126, https://doi.org/10.1007/s10236-010-0352-9, 2011.
Hoering, T. C. and Ford, H. T.: The isotope effect in the fixation of nitrogen by azotobacter, J. Am. Chem. Soc., 82, 376–378, https://doi.org/10.1021/ja01487a031, 1960.
Holmes, E., Lavik, G., Fischer, G., Segl, M., Ruhland, G., and Wefer, G.: Seasonal variability of δ15N in sinking particles in the Benguela upwelling region, Deep-Sea Res. Pt. I, 49, 377–394, 2002.
Karsh, K. L., Trull, T. W., Lourey, A. J., and Sigman, D. M.: Relationship of nitrogen isotope fractionation to phytoplankton size and iron availability during the Southern Ocean Iron RElease Experiment (SOIREE), Limnol. Oceanogr., 48, 1058–1068, 2003.
Kemeny, P. C., Weigand, M. A., Zhang, R., Carter, B. R., Karsh, K. L., Fawcett, S. E., and Sigman, D. M.: Enzyme-level interconversion of nitrate and nitrite in the fall mixed layer of the Antarctic Ocean: Antarctic Fall Nitrate Isotopes, Global Biogeochem. Cy., 30, 1069–1085, https://doi.org/10.1002/2015GB005350, 2016.
Kienast, M., Lehmann, M. F., Timmermann, A., Galbraith, E., Bolliet, T., Holboum, A., Normandeau, C., and Laj, C.: A mid-Holocene transition in the nitrogen dynamics of the western equatorial Pacific: Evidence of a deepening thermocline?, Geophys. Res. Lett., 35, L23610, https://doi.org/10.1029/2008gl035464, 2008.
Knapp, A. N., Sigman, D. M., and Lipschultz, F.: N isotopic composition of dissolved organic nitrogen and nitrate at the Bermuda Atlantic time-series study site, Global Biogeochem. Cy., 19, GB1018, https://doi.org/10.1029/2004gb002320, 2005.
Knapp, A. N., DiFiore, P. J., Deutsch, C., Sigman, D. M., and Lipschultz, F.: Nitrate isotopic composition between Bermuda and Puerto Rico: Implications for N2 fixation in the Atlantic Ocean, Global Biogeochem. Cy., 22, GB3014, https://doi.org/10.1029/2007gb003107, 2008.
Knapp, A. N., Sigman, D. M., Lipschultz, F., Kustka, A. B., and Capone, D. G.: Interbasin isotopic correspondence between upper-ocean bulk DON and subsurface nitrate and its implications for marine nitrogen cycling, Global Biogeochem. Cy., 25, GB4004, https://doi.org/10.1029/2010gb003878, 2011.
Knapp, A. N., Casciotti, K. L., Berelson, W. M., Prokopenko, M. G., and Capone, D. G.: Low rates of nitrogen fixation in eastern tropical South Pacific surface waters, P. Natl. Acad. Sci. USA, 113, 4398–4403, https://doi.org/10.1073/pnas.1515641113, 2016.
Ko, Y. H., Lee, K., Takahashi, T., Karl, D. M., Kang, S.-H., and Lee, E.: Carbon-Based Estimate of Nitrogen Fixation-Derived Net Community Production in N-Depleted Ocean Gyres, Global Biogeochem. Cy., https://doi.org/10.1029/2017GB005634, 2018.
Lavik, G.: Nitrogen isotopes of sinking matter and sediments in the South Atlantic, Universität Bremen, Bremen, Germany, 2000.
Lehmann, M. F., Sigman, D. M., McCorkle, D. C., Brunelle, B. G., Hoffmann, S., Kienast, M., Cane, G., and Clement, J.: Origin of the deep Bering Sea nitrate deficit: Constraints from the nitrogen and oxygen isotopic composition of water column nitrate and benthic nitrate fluxes, Global Biogeochem. Cy., 19, GB4005, https://doi.org/10.1029/2005gb002508, 2005.
Lehmann, N., Granger, J., Kienast, M., Brown, K. S., Rafter, P. A., Martínez-Méndez, G., and Mohtadi, M.: Isotopic Evidence for the Evolution of Subsurface Nitrate in the Western Equatorial Pacific, J. Geophys. Res.-Oceans, 213, 1684–1707, https://doi.org/10.1002/2017JC013527, 2018.
Liu, K. K.: Geochemistry of inorganic nitrogen compounds in two marine environments: The Santa Barbara Basin and the ocean off Peru, University of Southern California, Los Angeles, 1979.
Liu, K. K., Su, M. J., Hsueh, C. R., and Gong, G. C.: The nitrogen isotopic composition of nitrate in the Kuroshio Water northeast of Taiwan: Evidence for nitrogen fixation as a source of isotopically light nitrate, Mar. Chem., 54, 273–292, https://doi.org/10.1016/0304-4203(96)00034-5, 1996.
Lourey, M. J., Trull, T. W., and Sigman, D. M.: Sensitivity of delta N-15 of nitrate, surface suspended and deep sinking particulate nitrogen to seasonal nitrate depletion in the Southern Ocean, Global Biogeochem. Cy., 17, 1081, https://doi.org/10.1029/2002gb001973, 2003.
Marconi, D., Alexandra Weigand, M., Rafter, P. A., McIlvin, M. R., Forbes, M., Casciotti, K. L., and Sigman, D. M.: Nitrate isotope distributions on the US GEOTRACES North Atlantic cross-basin section: Signals of polar nitrate sources and low latitude nitrogen cycling, Mar. Chem., 177, 143–156, https://doi.org/10.1016/j.marchem.2015.06.007, 2015.
Marconi, D., Sigman, D. M., Casciotti, K. L., Campbell, E. C., Alexandra Weigand, M., Fawcett, S. E., Knapp, A. N., Rafter, P. A., Ward, B. B., and Haug, G. H.: Tropical Dominance of N2 Fixation in the North Atlantic Ocean: Tropical Lead of Atlantic N2 fixation, Global Biogeochem. Cy., 31, 1608–1623, https://doi.org/10.1002/2016GB005613, 2017.
Mariotti, A., Germon, J. C., Hubert, P., Kaiser, P., Letolle, R., Tardieux, A., and Tardieux, P.: Experimental determination of nitrogen kinetic isotope fractionation – some principles – illustration for the denitrification and nitrification processes, Plant Soil, 62, 413–430, 1981.
Marquardt, D. W.: An Algorithm for Least-Squares Estimation of Nonlinear Parameters, J. Soc. Ind. Appl. Math., 11, 431–441, https://doi.org/10.1137/0111030, 1963.
Martin, T. S. and Casciotti, K. L.: Paired N and O isotopic analysis of nitrate and nitrite in the Arabian Sea oxygen deficient zone, Deep-Sea Res. Pt. I, 121, 121–131, https://doi.org/10.1016/j.dsr.2017.01.002, 2017.
Miyake, Y. and Wada, E.: The Abundance Ratio of 15N∕14N in Marine Environments, Rec. Oceanogr. Works Jpn., 9, 37–53, 1967.
Palter, J. B., Sarmiento, J. L., Gnanadesikan, A., Simeon, J., and Slater, R. D.: Fueling export production: nutrient return pathways from the deep ocean and their dependence on the Meridional Overturning Circulation, Biogeosciences, 7, 3549–3568, https://doi.org/10.5194/bg-7-3549-2010, 2010.
Pantoja, S., Repeta, D. J., Sachs, J. P., and Sigman, D. M.: Stable isotope constraints on the nitrogen cycle of the Mediterranean Sea water column, Deep-Sea Res. Pt. I, 49, 1609–1621, https://doi.org/10.1016/s0967-0637(02)00066-3, 2002.
Peters, B. D., Lam, P. J., and Casciotti, K. L.: Nitrogen and oxygen isotope measurements of nitrate along the US GEOTRACES Eastern Pacific Zonal Transect (GP16) yield insights into nitrate supply, remineralization, and water mass transport, Mar. Chem., 201, 137–150, https://doi.org/10.1016/j.marchem.2017.09.009, 2017.
Rafter, P. A. and Charles, C. D.: Pleistocene equatorial Pacific dynamics inferred from the zonal asymmetry in sedimentary nitrogen isotopes, Paleoceanography, 27, PA3102, https://doi.org/10.1029/2012pa002367, 2012.
Rafter, P. A. and Sigman, D. M.: Spatial distribution and temporal variation of nitrate nitrogen and oxygen isotopes in the upper equatorial Pacific Ocean, Limnol. Oceanogr., 61, 14–31, https://doi.org/10.1002/lno.10152, 2016.
Rafter, P. A., Sigman, D. M., Charles, C. D., Kaiser, J., and Haug, G. H.: Subsurface tropical Pacific nitrogen isotopic composition of nitrate: Biogeochemical signals and their transport, Global Biogeochem. Cy., 26, GB1003, https://doi.org/10.1029/2010gb003979, 2012.
Rafter, P. A., DiFiore, P. J., and Sigman, D. M.: Coupled nitrate nitrogen and oxygen isotopes and organic matter remineralization in the Southern and Pacific Oceans, J. Geophys. Res.-Oceans, 118, 1–14, https://doi.org/10.1002/jgrc.20316, 2013.
Rafter, P., Bagnell, A., DeVries, T., and Marconi, D.: Compiled dataset consisting of published and unpublished global nitrate δ15N measurements from from 1975–2018. Biological and Chemical Oceanography Data Management Office (BCO-DMO), Dataset version 2019-05-28, https://doi.org/10.1575/1912/bco-dmo.768627.1, 2019a.
Rafter, P., Bagnell, A., DeVries, T., and Marconi, D.: Estimated nitrate δ15N modeled using an ensemble of artificial neural networks (EANNs). Biological and Chemical Oceanography Data Management Office (BCO-DMO), Dataset version 2019-05-28, https://doi.org/10.1575/1912/bco-dmo.768655.1, 2019b.
Ren, H., Sigman, D. M., Meckler, A. N., Plessen, B., Robinson, R. S., Rosenthal, Y., and Haug, G. H.: Foraminiferal Isotope Evidence of Reduced Nitrogen Fixation in the Ice Age Atlantic Ocean, Science, 323, 244–248, https://doi.org/10.1126/science.1165787, 2009.
Ren, H., Chen, Y.-C., Wang, X. T., Wong, G. T. F., Cohen, A. L., DeCarlo, T. M., Weigand, M. A., Mii, H.-S., and Sigman, D. M.: 21st-century rise in anthropogenic nitrogen deposition on a remote coral reef, Science, 356, 749–752, https://doi.org/10.1126/science.aal3869, 2017.
Robinson, R. S., Brunelle, B. G., and Sigman, D. M.: Revisiting nutrient utilization in the glacial Antarctic: Evidence from a new method for diatom-bound N isotopic analysis, Paleoceanography, 19, PA3001, https://doi.org/10.1029/2003pa000996, 2004.
Robinson, R. S., Kienast, M., Albuquerque, A. L., Altabet, M., Contreras, S., Holz, R. D., Dubois, N., Francois, R., Galbraith, E., Hsu, T. C., Ivanochko, T., Jaccard, S., Kao, S. J., Kiefer, T., Kienast, S., Lehmann, M. F., Martinez, P., McCarthy, M., Mobius, J., Pedersen, T., Quan, T. M., Ryabenko, E., Schmittner, A., Schneider, R., Schneider-Mor, A., Shigemitsu, M., Sinclair, D., Somes, C., Studer, A., Thunell, R., and Yang, J. Y.: A review of nitrogen isotopic alteration in marine sediments, Paleoceanography, 27, PA4203, https://doi.org/10.1029/2012pa002321, 2012.
Rumelhart, D. E., Hinton, G. E., and Williams, R. J.: Learning Representations by Back-Propagating Errors, Nature, 323, 533–536, https://doi.org/10.1038/323533a0, 1986.
Ryabenko, E., Kock, A., Bange, H. W., Altabet, M. A., and Wallace, D. W. R.: Contrasting biogeochemistry of nitrogen in the Atlantic and Pacific Oxygen Minimum Zones, Biogeosciences, 9, 203–215, https://doi.org/10.5194/bg-9-203-2012, 2012.
Sachs, J. P. and Repeta D. J.: Oligotrophy and nitrogen fixation during eastern Mediterranean sapropel events, Science, 286, 2485–2488, 1999.
Sarmiento, J. L., Gruber, N., Brzezinski, M. A., and Dunne, J. P.: High-latitude controls of thermocline nutrients and low latitude biological productivity, Nature, 427, 56–60, https://doi.org/10.1038/nature02127, 2004.
Schlitzer, R.: Ocean Data View, available at: https://odv.awi.de (last access: 1 January 2019), 2002.
Schlitzer, R., Anderson, R. F., Dodas, E. M., et al.: The GEOTRACES Intermediate Data Product 2017, Chem. Geol., https://doi.org/10.1016/j.chemgeo.2018.05.040, 2018.
Sigman, D. M. and Casciotti, K. L.: Nitrogen Isotopes in the Ocean, in: Encyclopedia of Ocean Science, 1884–1894, Academic Press, London, 2001.
Sigman, D. M., Altabet, M. A., McCorkle, D. C., Francois, R., and Fischer, G.: The delta N-15 of nitrate in the Southern Ocean: Consumption of nitrate in surface waters, Global Biogeochem. Cy., 13, 1149–1166, 1999a.
Sigman, D. M., Altabet, M. A., Francois, R., McCorkle, D. C., and Gaillard, J. F.: The isotopic composition of diatom-bound nitrogen in Southern Ocean sediments, Paleoceanography, 14, 118–134, 1999b.
Sigman, D. M., Granger, J., DiFiore, P. J., Lehmann, M. M., Ho, R., Cane, G., and van Geen, A.: Coupled nitrogen and oxygen isotope measurements of nitrate along the eastern North Pacific margin, Global Biogeochem. Cy., 19, GB4022, https://doi.org/10.1029/2005gb002458, 2005.
Sigman, D. M., DiFiore, P. J., Hain, M. P., Deutsch, C., and Karl, D. M.: Sinking organic matter spreads the nitrogen isotope signal of pelagic denitrification in the North Pacific, Geophys. Res. Lett., 36, https://doi.org/10.1029/2008gl035784, 2009a.
Sigman, D. M., DiFiore, P. J., Hain, M. P., Deutsch, C., Wang, Y., Karl, D. M., Knapp, A. N., Lehmann, M. F., and Pantoja, S.: The dual isotopes of deep nitrate as a constraint on the cycle and budget of oceanic fixed nitrogen, Deep-Sea Res. Pt. I, 56, 1419–1439, https://doi.org/10.1016/j.dsr.2009.04.007, 2009b.
Smart, S. M., Fawcett, S. E., Thomalla, S. J., Weigand, M. A., Reason, C. J. C., and Sigman, D. M.: Isotopic evidence for nitrification in the Antarctic winter mixed layer, Globa; Biogeochem. Cy., 29, 427–445, https://doi.org/10.1002/2014GB005013, 2015.
Somes, C. J., Schmittner, A., and Altabet, M. A.: Nitrogen isotope simulations show the importance of atmospheric iron deposition for nitrogen fixation across the Pacific Ocean, Geophys. Res. Lett., 37, L23605, https://doi.org/10.1029/2010gl044537, 2010.
Tawa, A., Ishihara, T., Uematsu, Y., Ono, T., and Ohshimo, S.: Evidence of westward transoceanic migration of Pacific bluefin tuna in the Sea of Japan based on stable isotope analysis, Mar. Biol., 164, https://doi.org/10.1007/s00227-017-3127-8, 2017.
Thimm, G. and Fiesler, E.: Optimal Setting of Weights, Learning Rate, and Gain, Dalle Molle Institute for Perceptive Artificial Intelligence, Martigny-Valais, Switzerland, 1997.
Thunell, R. C., Sigman, D. M., Muller-Karger, F., Astor, Y., and Varela, R.: Nitrogen isotope dynamics of the Cariaco Basin, Venezuela, Global Biogeochem. Cy., 18, GB3001, https://doi.org/10.1029/2003gb002185, 2004.
Toggweiler, J. R. and Carson, S.: What Are Upwelling Systems Contributing to the Ocean's Carbon and Nutrient Budgets?, in: Upwelling in the Ocean: Modern Processes and Ancient Records, edited by: Summerhayes, C. P., John Wiley & Sons Ltd., New York, 1995.
Toggweiler, J. R., Dixon, K., and Broecker, W. S.: The Peru upwelling and the ventilation of the South-Pacific thermocline, J. Geophys. Res.-Oceans, 96, 20467–20497, https://doi.org/10.1029/91jc02063, 1991.
Trull, T. W., Davies, D., and Casciotti, K.: Insights into nutrient assimilation and export in naturally iron-fertilized waters of the Southern Ocean from nitrogen, carbon and oxygen isotopes, Deep-Sea Res. Pt. II, 55, 820–840, https://doi.org/10.1016/j.dsr2.2007.12.035, 2008.
Tuerena, R. E., Ganeshram, R. S., Geibert, W., Fallick, A. E., Dougans, J., Tait, A., Henley, S. F., and Woodward, E. M. S.: Nutrient cycling in the Atlantic basin: The evolution of nitrate isotope signatures in water masses, Globa; Biogeochem. Cy., 29, 1830–1844, https://doi.org/10.1002/2015GB005164, 2015.
Umezawa, Y., Yamaguchi, A., Ishizaka, J., Hasegawa, T., Yoshimizu, C., Tayasu, I., Yoshimura, H., Morii, Y., Aoshima, T., and Yamawaki, N.: Seasonal shifts in the contributions of the Changjiang River and the Kuroshio Current to nitrate dynamics in the continental shelf of the northern East China Sea based on a nitrate dual isotopic composition approach, Biogeosciences, 11, 1297–1317, https://doi.org/10.5194/bg-11-1297-2014, 2014.
Voss, M.: Räumliche und zeitliche Verteilung stabiler Isotope (δ15N, δ13C) in suspendierten und sedimentierten Partikeln im Nördlichen Nordatlantik, Christian-Albrechts-Universitat zu Kiel, 1991.
Voss, M., Dippner, J. W., and Montoya, J. P.: Nitrogen isotope patterns in the oxygen-deficient waters of the Eastern Tropical North Pacific Ocean, Deep-Sea Res. Pt. I, 48, 1905–1921, https://doi.org/10.1016/s0967-0637(00)00110-2, 2001.
Wada, E.: Nitrogen isotope fractionation and its significance in biogeochemical processes occurring in marine environments, in: Isotope Marine Chemistry, 375–398, Uchida Rokakudo, Tokyo, 1980.
Wada, E. and Hattori, A.: Nitrogen isotope effects in the assimilation of inorganic nitrogenous compounds by marine diatoms, Geomicrobiol. J., 1, 85–101, 1978.
Wang, W.-L., Moore, J. K., Martiny, A. C., and Primeau, F. W.: Convergent estimates of marine nitrogen fixation, Nature, 566, 205–211, https://doi.org/10.1038/s41586-019-0911-2, 2019.
Weigend, A. S., Huberman, B. A., and Rumelhart, D. E.: Predicting The Future: A Connectionist Approach, Int. J. Neural Syst., 1, 193–209, https://doi.org/10.1142/s0129065790000102, 1990.
Wong, G. T. F., Chung, S.-W., Shiah, F.-K., Chen, C.-C., Wen, L.-S., and Liu, K.-K.: Nitrate anomaly in the upper nutricline in the northern South China Sea – Evidence for nitrogen fixation, Geophys. Res. Lett., 29, 12-1–12-4, https://doi.org/10.1029/2002GL015796, 2002.
Wu, J., Calvert, S. E., and Wong, C. S.: Nitrogen isotope variations in the subarctic northeast Pacific: relationships to nitrate utilization and trophic structure, Deep-Sea Res. Pt. I, 44, 287–314, 1997.
Yang, S. and Gruber, N.: The anthropogenic perturbation of the marine nitrogen cycle by atmospheric deposition: Nitrogen cycle feedbacks and the 15N Haber-Bosch effect, Global Biogeochem. Cy., 30, 1418–1440, https://doi.org/10.1002/2016GB005421, 2016.
Yang, S., Gruber, N., Long, M. C., and Vogt, M.: ENSO-Driven Variability of Denitrification and Suboxia in the Eastern Tropical Pacific Ocean, Global Biogeochem. Cy., 31, 1470–1487, https://doi.org/10.1002/2016GB005596, 2017.
Yoshikawa, C., Nakatsuka, T., and Wakatsuchi, M.: Distribution of N* in the Sea of Okhotsk and its use as a biogeochemical tracer of the Okhotsk Sea Intermediate Water formation process, J. Marine Syst., 63, 49–62, https://doi.org/10.1016/j.jmarsys.2006.05.008, 2006.
Yoshikawa, C., Makabe, A., Shiozaki, T., Toyoda, S., Yoshida, O., Furuya, K., and Yoshida, N.: Nitrogen isotope ratios of nitrate and N* anomalies in the subtropical South Pacific, Geochem. Geophy. Geosy., 16, 1439–1448, https://doi.org/10.1002/2014GC005678, 2015.
nitrate δ15N) is a useful tracer of ocean N cycling and many other ocean processes. Here, we use a global compilation of marine nitrate δ15N as an input, training, and validating dataset for an artificial neural network (a.k.a.,
machine learning) and examine basin-scale trends in marine nitrate δ15N from the surface to the seafloor.
nitrate δ15N) is a useful tracer of ocean N cycling and...