the Creative Commons Attribution 4.0 License.
the Creative Commons Attribution 4.0 License.
 | 05 Apr 2019
Multidecadal persistence of organic matter in soils: multiscale investigations down to the submicron scale
Suzanne Lutfalla
Sylvain Bernard
Corentin Le Guillou
Julien Alléon
Claire Chenu
Minerals, particularly clay-sized minerals, protect soil organic matter (SOM) from decomposition by microorganisms. Here we report the characterization of SOM and the associated minerals over decades of biodegradation, in a French long-term bare fallow (LTBF) experiment started in 1928. The amounts of carbon (C) and nitrogen (N) in the study area declined over time for six fractions (sand, coarse silt, fine silt, coarse clays, intermediate clays, and fine clays). The C:N ratios of SOM associated with silt fractions remained constant, whereas the ratios significantly decreased in clays, reaching very low values in intermediate and fine clays (C:N < 5) after 8 decades of LTBF conditions. X-ray absorption spectroscopy revealed the following: (i) bulk-scale SOM chemical speciation remained almost constant; (ii) submicron particulate OM was present in coarse clays, even after 79 years of LTBF conditions; and (iii) illite particles became progressively SOM-free with time, whereas mixed-layer illite/smectite and smectites were always associated with OM throughout the bare fallow treatment. In summary, these results suggest that clay-sized minerals preferentially protect N-rich SOM and that smectites and mixed-layer illite/smectite seem to protect associated OM more effectively than pure illites.
- Article
(831 KB) -
Supplement
(529 KB) - BibTeX
- EndNote


Soils represent an important carbon reservoir on the global scale: they store 3 times more carbon than the atmosphere (Batjes, 1996) and are currently considered as one of the solutions for climate change mitigation and adaptation in addition to food security as highlighted by the “4 per 1000” initiative (Soussana et al., 2017). Soil organic matter (SOM) encompasses compounds with residence times ranging from days to millennia (Trumbore, 2000), and the mechanisms controlling SOM turnover are actively debated (Dungait et al., 2012; Lehmann and Kleber, 2015; Schmidt et al., 2011).
Except to some extent for pyrogenic C (Lutfalla et al., 2017), the current thinking considers organomineral interactions (by adsorption or coprecipitation) as a dominant factor, rather than intrinsic chemical recalcitrance, for the long-term persistence of otherwise labile organic compounds in soil (Baldock and Skjemstad, 2000; Balesdent et al., 2000; Lehmann and Kleber, 2015; von Lützow and Kögel-Knabner, 2010; Schmidt et al., 2011; Sollins et al., 2006). However, the exact mineralogical nature of soils remains barely documented, especially at the submicrometer scale, and in particular for soils where the clay fraction is dominated by phyllosilicates (Barré et al., 2014).
Soil phyllosilicates are very diverse (Wilson, 1999). Among phyllosilicates, smectites are considered to have higher protective capabilities than illite and kaolinite, because of their higher specific surface area and cation exchange capacities (Bruun et al., 2010). Nonetheless, in situ experimental demonstrations are still lacking (Barré et al., 2014). To date, the influence of phyllosilicate mineralogy on the chemical composition of persistent SOM has only been documented in model systems (Mikutta et al., 2007).
Here, we studied samples from long-term bare fallow (LTBF) experiments. These vegetation-free experimental plots offer the unique opportunity to naturally concentrate persistent SOM (Barré et al., 2010; Rühlmann, 1999): with time, biodegradation occurs in the LTBF plots and the carbon content gradually decreases as there is no input of fresh organic carbon.
We used quadruplicate LTBF soil samples collected in 1929, 1939, 1951, 1981, and 2008 and fractionated into six particle-size classes” sand (> 50 µm), coarse silt (20–50 µm), fine silt (2–20 µm), coarse clays (CC; 0.2–2 µm), intermediate clays (IC; 0.05–0.2 µm), and fine clays (FC; 0–0.05 µm). The three clay subfractions contained diverse phyllosilicates (Fernández-Ugalde et al., 2016; Hubert et al., 2012), which were characterized by X-ray diffraction. Synchrotron-based near-edge X-ray absorption fine structure (NEXAFS) spectroscopy at the C K-edge is a pertinent tool for studying SOM because it provides information on the carbon speciation regardless of the mineral matrix in which the carbon particles are embedded. NEXAFS data were collected on clay fractions at the “bulk” scale (∼ mm3) using fluorescence-based X-ray spectroscopy and at the submicrometer scale using scanning transmission X-ray microscopy (STXM). Combined, these previous observations allowed for the heterogeneous nature of SOM (Gillespie et al., 2015; Keiluweit et al., 2012; Kinyangi et al., 2006; Lehmann et al., 2005; Wan et al., 2007) and the complex relationship between the SOM spatial distribution and soil mineral composition to be demonstrated (Solomon et al., 2012; Wan et al., 2007).
The present contribution addresses the following fundamental questions:
-
How much pluri-decadal persistent SOM is in the different fractions?
-
What is the chemical nature of pluri-decadal persistent SOM in the different fractions?
-
What is the long-term protective capabilities of the different phyllosilicates?
2.1 Soil description and sampling
We used archived samples of the “42 Parcelles” LTBF experiment to study the evolution of SOM towards more persistent forms of SOM over 79 years of biodegradation. The 42 Parcelles LTBF is an INRA (Institut National de la Recherche Agronomique) experiment which started in Versailles (France) in 1928 (Burgevin and Hénin, 1939). Since 1929, the soil in the area has not been cropped and has been weeded (by hand or with herbicides) and plowed (to the depth of 25 cm) twice a year. It is a non-carbonated brown soil (silty loam Luvisol: 16 % clay, 57 % silt, and 27 % sand), and the control plots had an average pH of 6.3 in 1929 and of 5.2 in 2008 (Grasset et al., 2009; Paradelo et al., 2013; Pernes-Debuyser and Tessier, 2002). We used archived samples (air dried and stored in the dark) from four plots (13, 21, 22, and 32) sampled on five different dates: 1929 (year 0 of the LTBF), 1939 (year 10), 1951 (year 22), 1981 (year 52), and 2008 (year 79). Samples were from the first 25 cm of soil, except the last samples (2008) that corresponded to the first 20 cm of soil.
2.2 Particle size fractionation
We subjected soil samples to physical dispersion and particle-size fractionation following a published protocol (Balesdent et al., 1998, Fernández-Ugalde et al., 2016) to separate the following fractions: sand fraction (> 50 µm), silt fractions (20–50 µm, 2–20 µm), and clay fractions (0.2–2, 0.05–0.2, and < 0.05 µm).
Approximately 50 g of soil was shaken overnight with 20 glass beads in 180 mL of deionized water to break aggregates bigger than 50 µm. The suspension obtained was then passed through a 50 µm sieve, thereby preventing the disruption of particulate OM during the subsequent ultrasonic dispersion (Balesdent et al., 1991), and sonicated in an ice bath for a total input of 320 J mL−1 using a digital sonifier (Sonics model 500W operating at 20 kHz – max. output of 120 W – with a probe with a flat tip of 2.5 cm diameter). The dispersion conditions allowed for the recovery of a clay-size fraction (< 2 µm) equivalent in proportion to that achieved during standard particle-size fractionation (Balesdent et al., 1991). At this stage, the solution was centrifuged at 79 g for 12 min to first isolate the clay fraction (0–2 µm) and then at 5 g for 1 min to isolate the silt fractions (2–20 and 20–50 µm). Before weighing, sand and coarse silt fractions were oven-dried at 60 ∘C, whereas the fine silt and clay fractions were freeze-dried. The total mass recovery was 99.1 % (SD =0.44 %).
Clay subsamples (2 g) were suspended in water and sonicated at 320 J mL−1. The sonicated suspension was then sequentially centrifuged at 23 056 g for 61 min to isolate the fraction < 0.05 µm and at 5764 g for 15 min 22 s to separate the smaller fractions (0.05–0.2 and 0.2–2 µm). All clay subfractions were then freeze-dried. Mass recovery for the clay fractionation was 98.3 % (SD =1.70 %).
2.3 Clay mineralogy analysis
The mineral compositions of the total clay fraction and of the clay subfractions (CC, IC, and FC) were determined by X-ray diffraction (XRD) analyses. Air-dried, oriented deposits prepared using the filter transfer method (Moore and Reynolds, 1989) were analyzed with a Cu Kα radiation Rigaku UltraX18HF X-ray diffractometer (Rigaku, Tokyo, Japan). The XRD patterns were accumulated at 0.05∘ step intervals with a counting time of 3 s in the range from 3 to 35∘ (2θ). One set of replicates was then exposed to ethylene glycol vapor over 16 h at 60 ∘C before being remeasured under the same conditions as the air-dried samples.
2.4 Elemental analysis
The total organic carbon (C) and nitrogen (N) contents of all particle-size fractions were measured by dry combustion in a CHN autoanalyzer (Carlo Erba NA 1500). The total C content is equivalent to the total organic carbon content, as the investigated soil samples do not contain carbonates.
2.5 Synchrotron-based NEXAFS spectroscopy
In the present study, synchrotron-based C-NEXAFS data were collected using beamlines located at the Canadian Light Source (CLS, Canada) where the storage ring is operated at 2.9 GeV and at a current between 250 and 150 mA.
2.5.1 C-NEXAFS spectroscopy at the “bulk” scale
The “bulk” carbon speciation of clay subfractions was investigated by NEXAFS spectroscopy using the CLS beamline 11-ID-1 Spherical Grating Monochromator (SGM; Regier et al., 2007). See Supplement for details regarding the method. Each spectrum reported in the present study corresponds to an average of about 50 measurements. Of note, only the first 250 nm of the sample surface are probed using the SGM setup. Spectra were averaged, background subtracted, and normalized using the Igor Pro software.
2.5.2 STXM-based NEXAFS spectroscopy
STXM-based NEXAFS data were collected using the CLS beamline 10ID-1 (SM beamline, Kaznatcheev et al., 2007), which operates in the soft X-ray energy range (130–2500 eV) using an elliptically polarized undulator. See the Supplement for details regarding the method. All clay subfractions were analyzed for each sampling time, i.e., 15 samples were analyzed. We first analyzed each sample at the millimeter scale to identify carbon bearing regions of a few square micrometers. We then collected STXM-based NEXAFS data over the 250–450 eV energy range covering the C K-edge (280–295 eV), the K L2,3-edges (295–305 eV), the Ca L2,3-edges (345–355 eV) and the N K-edge (395–405 eV). For each sample, we analyzed one or two regions that contained carbon-rich particles and presented a diversity of absorptions in order to qualitatively investigate the organomineral interactions present in each fraction on each date. The C-NEXAFS spectra shown here correspond to homogeneous areas of several hundreds of square nanometers. Extensive databases of reference C-NEXAFS spectra are available in the literature (Dhez et al., 2003; Solomon et al., 2009; Le Guillou et al., 2018). The compositional maps presented in this study are derived from the analysis of the selected micrometric regions, they are the visual representation of the assignment of each pixel of the image to the category of particle it belongs to, according to its associated NEXAFS spectra.
2.5.3 C-NEXAFS data deconvolution procedure
To obtain a more “quantitative” insight on the evolution of the molecular signatures of the investigated experimental samples with increasing bare fallow duration and to be able to compare the spectra, we performed (i) background subtraction, (ii) normalization to the carbon amount, and (iii) fit using Gaussian functions placed at fixed positions (e.g., 284.4 eV, quinones; 285 and 285.4 eV, aromatic; 285.8 eV, imines; 286.2, 286.6, and 287.1 eV, carbonyls; 287.7 eV, aliphatics; 288.2 eV, amides; 288.6 eV, carboxylic; 289.1 eV, aldehydes; 289.4 eV, hydroxyls; 289.9 eV, aliphatics; 290.3 eV, carbonates) (Bernard et al., 2012; Le Guillou et al., 2014, 2018).
2.6 Statistical analyses
Statistical analyses were conducted using the R free software environment for statistical computing (http://www.r-project.org, last access: 27 March 2019). The significance of the difference between C contents or C∕N ratios was assessed using pairwise t tests. A level of significance of P=0.05 was considered for all analyses.
3.1 Carbon and nitrogen declines in the fractions
Initial C and N concentrations were low and very low in the sand and coarse silt fractions, respectively, but much higher in the fine silt and clay fractions (Table 1). The IC and CC subfractions displayed an initial OC content (35.9±2.19 mgC g−1 fraction and 46.6±2.95 mgC g−1 fraction, respectively) 3 to 5 times lower than that of the FC fraction (147.8±16.9 mgC g−1 fraction). Of note, dissolved organic carbon may contribute to this high value (Balesdent et al., 1998; Tiessen and Stewart, 1983). The C and N contents of the bulk and of each fraction decreased with increasing LTBF duration and somehow stabilized after 52 years of BF conditions (Table 1; Fig. 1). The C and N declines in the coarse silt fraction were not that clear, but these fractions had very low N and C concentrations. The low C decline (53 %) compared with the N decline (74 %) in the sand fraction could be explained by the presence of C-rich sand-sized coal or pyrogenic carbon (Lutfalla et al., 2017). Overall, the CC, IC, and FC subfractions lost 59 %, 49 %, and 67 % of their initial C content and 52 %, 36 %, and 48 % of their initial N content, respectively. The C:N ratios of the different fractions evolved differently with bare fallow duration, while that of the bulk soil remained roughly constant. The C:N ratio of the sand fractions increased (due to the increased proportion of pyrogenic carbon), while those of the clay fractions decreased (the C:N ratios of IC and FC fractions reached values as low as 4.5).
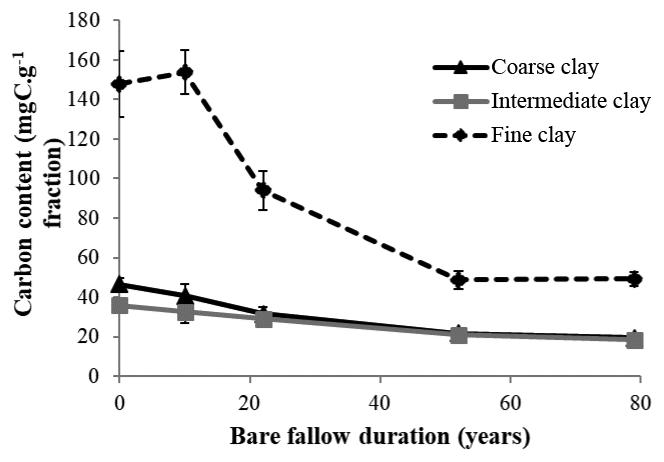
Figure 1Evolution of carbon content (mgC g−1 fraction) with time in the three different clay subfractions (error bars represent the standard deviation observed over the four field replicates).
Table 1Carbon and nitrogen contents and corresponding losses of organic carbon and nitrogen in each of the fractions on the first and last sampling dates. Standard deviations are indicated in parentheses. Data for bulk soil and for clay fractions are in bold as they will be discussed in length throughout the paper.


Figure 2Evolution of the carbon to nitrogen ratio (C:N) with time in the three different clay subfractions (error bars represent the standard deviation observed over the four field replicates).
3.2 Mineralogy of the clay subfractions
The XRD patterns of the three clay subfractions of a bare fallow sample (plot 21) collected at t=0 showed that, in agreement with previous results obtained on similar soils (Fernández-Ugalde et al., 2016; Hubert et al., 2009), the CC fraction contained smectite, illite, kaolinite, and mixed-layer illite and smectite, whereas the IC and FC fractions only contained smectite and mixed-layer illite and smectite (Fig. 3). The mineral composition of each investigated clay subfraction did not evolve during the 79 years of bare fallow conditions as indicated by XRD (data not shown). The soils studied did not contain significant amounts of iron (Fe) or aluminium (Al) minerals as evidenced by Fernández-Ugalde et al. (2013) who analyzed soils from an adjacent field at the same experimental site in Versailles.
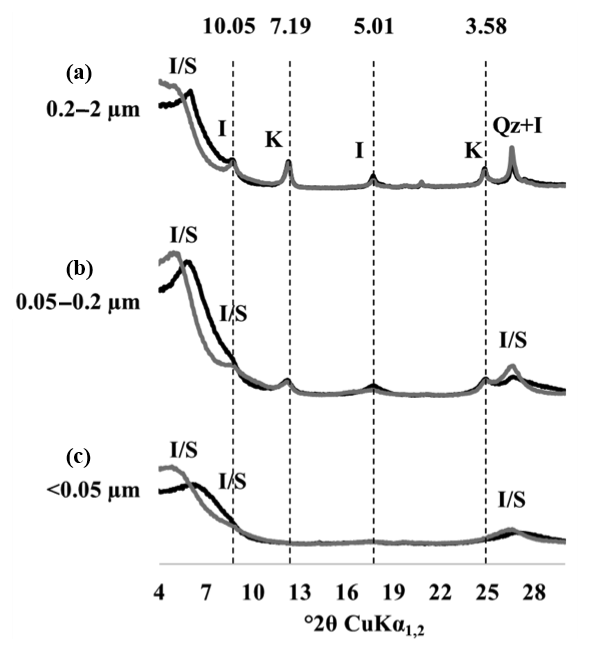
Figure 3X-ray diffraction patterns of particle-size fractions in one of the replicated plots of the LTBF experiment sampled at the beginning of the BF treatment. The black line corresponds to air-dried preparations, and the grey line corresponds to glycolated preparations. (a–c) From top to bottom: coarse clay fraction (0.2–2 µm), medium clay fraction (0.05–0.2 µm), fine clay fraction (< 0.05 µm). The letter labels denote the type of mineral detected: kaolinite (K), illite (I), quartz (Qz), and mixed-layer illite/smectite (I/S). Numbers above the dashed lines correspond to angströms (Å).
3.3 “Bulk” C-NEXAFS spectroscopy
The “bulk” C-NEXAFS spectra of the clay subfractions were very similar, with spectral features attributed to four main chemical moeities (Fig. 4): aromatic or olefin carbons (peak between 285 and 285.5 eV), carbonyl groups (shoulder between 286.1 and 287.1 eV), aliphatic carbons (shoulder at 287.7 eV), and carboxylic groups (intense peak at 288.6 eV). The peak at 290.3 eV is attributed to carbonates (Bernard et al., 2015). The features at approximately 283–284 eV are artefact features created by the presence of minerals that significantly absorb the beam throughout the carbon absorption energy range. Deconvolution of the data allowed for the semiquantitative estimation of the relative concentration of the four functional groups described above (aromatics/olefinics, carbonyls, aliphatics, and carboxylics) as a function of time and revealed no major evolution except for a slight but statistically significant increase in carboxylic moeities contained in the CC subfraction and a slight but statistically significant decrease in aliphatics in the FC subfraction (Fig. S3 in the Supplement).
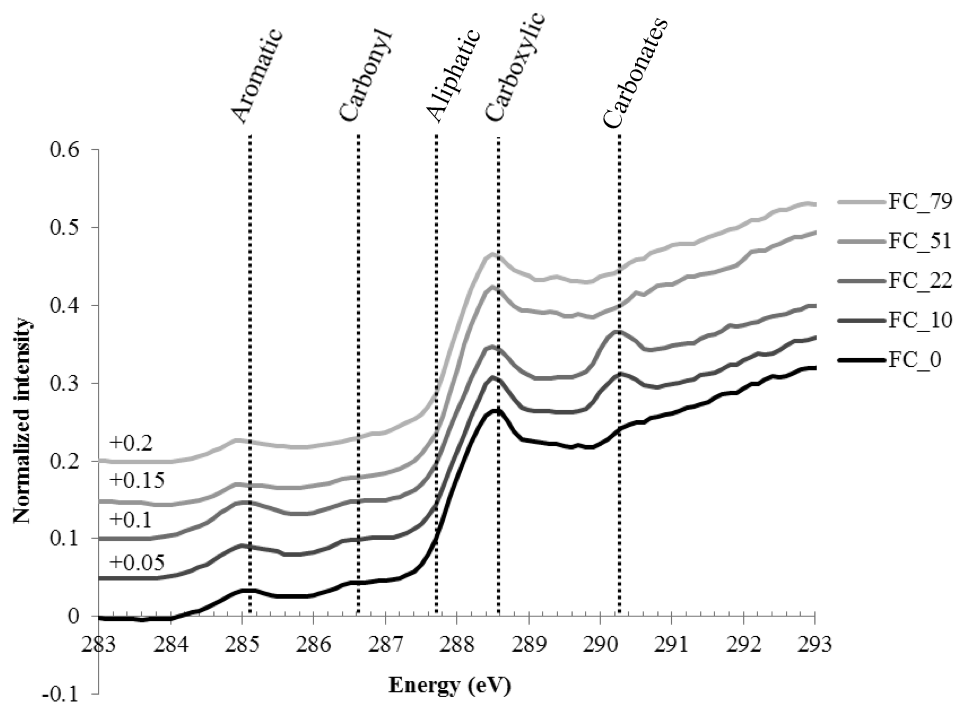
Figure 4Normalized C-NEXAFS spectra of the fine clay (FC) subfraction of samples collected at different times, from t=0 (bottom spectrum, darkest color) to t=79 years of bare fallow conditions (upper spectrum, lightest color).
3.4 STXM-based NEXAFS spectroscopy
3.4.1 NEXAFS spectra of organomineral particles
Four different types of assemblages were observed in the clay subfractions (Fig. 5): (1) SOM-poor K-rich minerals, for which the abundance increased with bare fallow duration; (2) organomineral complexes rich in C, N, and K; (3) organomineral complexes rich in C, N, K, and Ca; and (4) K-poor particulate OM. Of note, pure OM without any signal from K minerals was not identified in the present samples (a possible explanation could be that the signal corresponds to the average of at least 10 pixels of 40 nm×40 nm in size, it is therefore unlikely that pure OM of pure K would be isolated at this submicron scale), which is why there is a distinguishable contribution of K in the OM-rich reference spectra. Still, these K-poor OM particles can be described as particulate OM (Keiluweit et al., 2010). Similarly, pure mineral particles were not identified in the samples investigated: there was always a distinguishable contribution from C (same possible explanation).
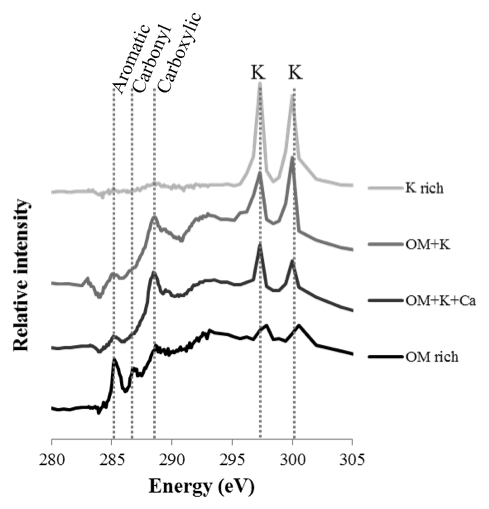
Figure 5Selected NEXAFS spectra of the four types of particles identified in the clay subfractions by STXM. Individual spectra are shifted on the intensity axis for better discrimination. Unlabeled peaks at 297.1 and 299.7 eV correspond to potassium (K) L-edge peaks. The spectra correspond to OM-rich particles with very little mineral (darkest color), organomineral particles with K and Ca mineral phases, organomineral particles with K-minerals, and K-rich phases (lightest color).
3.4.2 Evolution of organomineral particles in the three clay subfractions with time
Over the course of the bare fallow treatment, CC subfractions displayed particles ranging from isolated OM (particulate OM) to mineral-rich, OM-bearing particles (Figs. 5 and 6). After 22 years of bare fallow conditions, mineral particles exempt of OM appeared in the CC subfractions.Conversely, mineral particles exempt of OM and OM-rich particles were virtually undetected in the IC and FC subfractions. These subfractions exhibited a homogeneous signal similar to the spectra of OM+K+Ca organomineral particles, i.e., assemblages involving SOM and smectite or mixed-layer clay particles (Figs. 5 and 6).
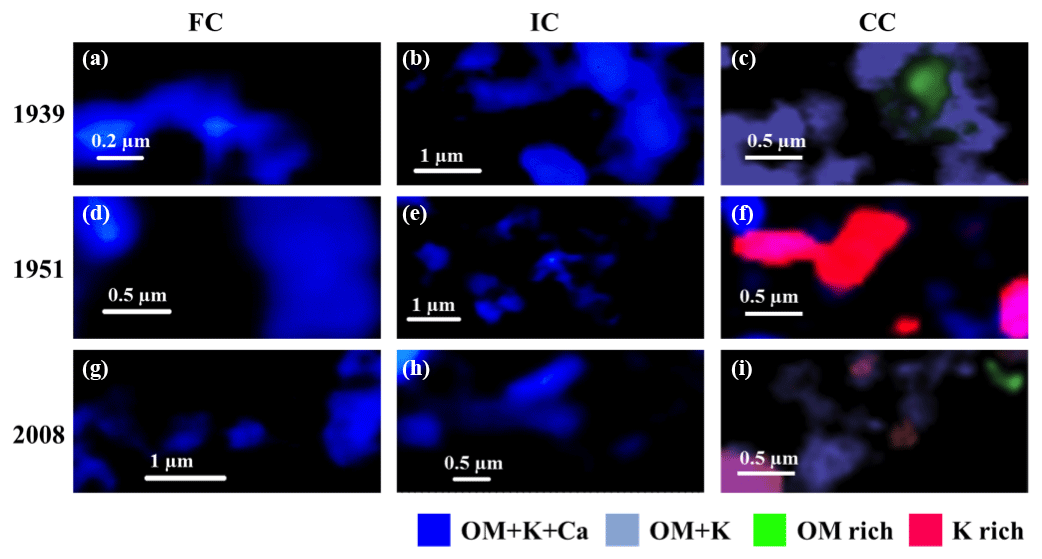
Figure 6STXM-NEXAFS compositional maps of organomineral particles contained in the fine clay (a, d, g), intermediate clay (b, e, h), and coarse clay (c, f, i) subfractions on three different dates: 1939 (a–c), 1951 (d–f), and the final sampling in 2008 (g–i). The scale bar is represented by a white line in each panel, it varies from 0.2 to 1 µm and depends on the sample. Dark blue represents OM+K+Ca, light blue represents OM+K, green represents OM-rich, and red/pink represents K-rich. The corresponding spectra are shown in Fig. 5.
4.1 Persistent SOM in clay fractions is N-rich
After 79 years of bare fallow conditions, SOM remained in all of the soil fractions. Apart from the coarse silt fraction which contained very low amounts of SOM, the amount of OC and N remaining after 79 years of bare fallow conditions were, as expected, higher in the clay fractions (Table 1). Of note, the relatively high amount of C remaining in the sand fractions could be explained by the presence of pyrogenic carbon in these fractions (Table 1, Fig. 2).
The percentage of C and N remaining increased with decreasing particle-size for fine silt, CC, and IC; however, the same was not observed for FC, where much lower percentages of C and N remained, suggesting a higher labile SOM content in the FC fraction. This is likely due to the fractionation procedure which can favor the accumulation of labile dissolved OM in the FC fraction (Laird et al., 2001).
Although it was not possible to determine the nitrogen speciation, our results show that persistent SOM associated with clays is highly enriched in N. Indeed, particulate OM with high C:N ratios is present in coarse fractions, whereas smaller particle-sizes typically have lower C:N ratios (Balesdent et al., 1987; Christensen, 1992; Fernández-Ugalde et al., 2016). Interestingly, while the C:N ratios of SOM associated with silt fractions did not evolve, the C:N ratios of SOM associated with clay fractions significantly decreased with bare fallow duration (down to values as low as 4.5 for the IC and FC fractions, which has, to our best knowledge, never been reported before). Accordingly, it appears that compounds with nitrogen moieties have a strong affinity for mineral surfaces (Kleber et al., 2007).
NEXAFS showed no major shift in the chemistry of SOM after several decades of biodegradation under bare fallow conditions besides a slight increase in carboxylic moeities in the CC subfraction and a slight decrease in aliphatics in the FC subfraction, supporting the fact that persistent forms of carbon are slightly more oxidized than the initial forms of carbon (von Lützow and Kögel-Knabner, 2010). The present study also confirmed that persistent SOM is mainly composed of microbial material: on average, all spectra displayed typical patterns of SOM strongly enriched in microbial material (Keiluweit et al., 2012; Kleber et al., 2011).
4.2 Particulate organic matter persists in clays after decades of biodegradation
Particulate OM could still be observed in the CC subfraction even after 79 years of bare fallow conditions. The NEXAFS spectra of these particles highlighted their polyphenolic nature (Keiluweit et al., 2010), suggesting that these were pieces of lignin-rich plant debris, possibly physically protected in submicron aggregates as shown in similar temperate Luvisols (Chenu and Plante, 2006). Thus, the present results show that pluri-decadal persistent SOM is made of N-rich oxidized SOM adsorbed to mineral surfaces and, to a lesser extent, of particulate OM, in agreement with the recently proposed “Soil Continuum Model (SCM)” (Lehmann and Kleber, 2015).
A simple mixing model allows for a rough estimation of the amount of C associated with minerals in the CC subfractions. Assuming a C:N ratio of 10 for pure particulate OM (corresponding to C:N observed in silt fractions and referred to as C:Nparticulate OM) and a C:N ratio of 4.5 for OM bound to minerals (referred to as C:NOM-minerals), i.e., without particulate OM (corresponding to the C:N ratio observed in IC and FC subfractions after 79 years of bare fallow conditions), and knowing that the C:N ratio of CC after 79 years of bare fallow conditions is 6.7 (referred to as C:NCC, 79 years), we can calculate the proportion of OM associated with minerals in CC by solving the following simple equation:
where C:N, C:NOM-minerals=4.5, C:Nparticulate OM=10, and x represents the proportion of particulate OM in the coarse clay fraction after 79 years of bare fallow conditions.
Solving the equation leads to x=0.4. Thus, it can be estimated that the CC subfractions contain (at the end) approximately 40 % particulate OM and 60 % SOM associated with minerals. Therefore, in addition to particulate OM, the CC subfractions contain approximately 11.6 mgC g−1, in the form of OM bound to minerals, i.e., significantly less than the C content of the IC subfractions. This might be explained by the relatively small specific surface area of relatively coarse clay minerals compared with that of finer clay minerals.
4.3 Smectitic clays appear more efficient at protecting SOM than pure illites
After 79 years of bare fallow conditions, the FC and IC subfractions, mostly composed of swelling clays, had a higher N content than the CC subfraction which contained both illites and swelling clays (Fig. 3). The CC and IC subfractions had a similar apparent C content after 79 years of bare fallow conditions, which was lower than that of the FC subfraction (Table 1). However, as seen above, TOC (total organic carbon) contents might be misleading in this particular case as CC contains significant amounts of POM (particulate organic matter) (estimated to be around 40 % of TOC in this fraction). Therefore, if we focus on C associated with clay minerals by organomineral interactions (either through adsorption or coprecipitation), we find that at all times, there is more C associated with IC and FC than to CC. These results may be due to the predominance of swelling clays in IC and FC or to the fact that finer clay minerals have a higher specific surface area and can therefore interact with more SOM. These results also suggest that swelling clays may better protect N-rich SOM in particular.
Spatially resolved observations at the submicron scale with STXM-NEXAFS clearly showed that mineralogy influences SOM stabilization. Indeed, several illite particles (identified by the presence of K and the absence of Ca) were devoid of OM (Figs. 5 and 6), and the relative abundance of OM-depleted illites increased over time. Conversely, smectite layers (identified by the presence of Ca, as interstratified illite/smectite in the presence of K or pure smectite in the absence of K) were always found in association with OM over the chronosequence. This demonstrates that among phyllosilicates, smectites might have higher SOM protective capabilities than illites. Our results do not allow us to make conclusions regarding the protective capability of kaolinite; thus, additional experiments are needed to confirm the present findings and investigate clays with other mineralogies.
The suggested higher capacity of smectites and mixed-layer illite/smectite to protect OM compared to illites could be due to the presence of calcium which might facilitate the formation of persistent bounds between clay surfaces and OM. Organomineral assemblages rely on different physicochemical interactions, depending on the chemical nature of the OM and of the mineral phase, which include covalent bonding, ligand exchange, or weaker interactions such as Van der Waals for instance (Barré et al., 2014; Kögel-Knabner and Amelung, 2014). Similarly to previous studies (Chen et al., 2014), we observed a colocation of C and Ca (contained in smectites). Although the exact mechanism responsible for this colocation is not clearly identified, one hypothesis is that Ca could facilitate the binding of negatively charged or polarized organic compounds to negatively charged mineral surfaces via cation bridging (Lützow et al., 2006; Mikutta et al., 2007; Rowley et al., 2018). It has been shown that the cation bridging mechanism can promote organomineral interaction and reduce the bioavailability of adsorbed organic molecules for negatively charged 2 : 1 clay minerals (vermiculite) (Mikutta et al., 2007). In contrast to smectites, the negative charges of illite surfaces are mostly compensated for by K+ ions. K+ ions are monovalent and have a lower charge/radius ratio and, as a result, are much less efficient as bridges between organic compounds and mineral surfaces. Additionally, smectites have a higher specific surface area and could adsorb more OM. These points may explain the lower capability of illite particles to protect SOM as evidenced here.
Underlying research data are available upon request from the corresponding author.
Materials and methods on C-NEXAFS spectroscopy at the “bulk” scale, STXM-based NEXAFS spectroscopy, and the C-NEXAFS data deconvolution procedure. Additional figures of normalized NEXAFS spectra of coarse and intermediate clay subfractions from all sampling dates (Figs. S1 and S2) and corresponding deconvolution (Figs. S3 and S4). The supplement related to this article is available online at: https://doi.org/10.5194/bg-16-1401-2019-supplement.
SL, PB and CC designed the study. SL prepared the samples and carried out the analyses with technical help from all co-authors. All authors participated in the discussion of the results and the paper preparation.
The authors declare that they have no conflict of interest.
The INSU EC2CO program is acknowledged for financial support. NEXAFS data were acquired at the beamline 11ID-1 at the CLS, which is supported by the NSERC, the CIHR, the NRC, and the University of Saskatchewan. Special thanks go to Jian Wang and Jay Dynes for their expert support of the STXM at the CLS and to Tom Regier and Adam Gillespie for their expert support on the SGM-beamline at CLS.
This paper was edited by Yakov Kuzyakov and reviewed by two anonymous referees.
Baldock, J. A. and Skjemstad, J. O.: Role of the soil matrix and minerals in protecting natural organic materials against biological attack, Org. Geochem., 31, 697–710, 2000.
Balesdent, J., Mariotti, A., and Guillet, B.: Natural 13C abundance as a tracer for studies of soil organic matter dynamics, Soil Biol. Biochem., 19, 25–30, https://doi.org/10.1016/0038-0717(87)90120-9, 1987.
Balesdent, J., Petraud, J. P., and Feller, C.: Some effects of ultrasonic vibrations on size-distribution of soil organic matter, Sci. Sol, 29, 95–106, 1991.
Balesdent, J., Besnard, E., Arrouays, D., and Chenu, C.: The dynamics of carbon in particle-size fractions of soil in a forest-cultivation sequence, Plant Soil, 201, 49–57, https://doi.org/10.1023/A:1004337314970, 1998.
Balesdent, J., Chenu, C., and Balabane, M.: Relationship of soil organic matter dynamics to physical protection and tillage, Soil Till. Res., 53, 215–230, https://doi.org/10.1016/S0167-1987(99)00107-5, 2000.
Barré, P., Eglin, T., Christensen, B. T., Ciais, P., Houot, S., Kätterer, T., van Oort, F., Peylin, P., Poulton, P. R., Romanenkov, V., and Chenu, C.: Quantifying and isolating stable soil organic carbon using long-term bare fallow experiments, Biogeosciences, 7, 3839–3850, https://doi.org/10.5194/bg-7-3839-2010, 2010.
Barré, P., Fernandez-Ugalde, O., Virto, I., Velde, B., and Chenu, C.: Impact of phyllosilicate mineralogy on organic carbon stabilization in soils: incomplete knowledge and exciting prospects, Geoderma, 235–236, 382–395, https://doi.org/10.1016/j.geoderma.2014.07.029, 2014.
Batjes, N. H.: Total carbon and nitrogen in the soils of the world, Eur. J. Soil Sci., 47, 151–163, 1996.
Bernard, S., Horsfield, B., Schulz, H.-M., Wirth, R., Schreiber, A., and Sherwood, N.: Geochemical evolution of organic-rich shales with increasing maturity: A STXM and TEM study of the Posidonia Shale (Lower Toarcian, northern Germany), Mar. Pet. Geol., 31, 70–89, https://doi.org/10.1016/j.marpetgeo.2011.05.010, 2012.
Bernard, S., Benzerara, K., Beyssac, O., Balan, E., and Brown Jr., G. E.: Evolution of the macromolecular structure of sporopollenin during thermal degradation, Heliyon, 1, e00034, https://doi.org/10.1016/j.heliyon.2015.e00034, 2015.
Bruun, T. B., Elberling, B., and Christensen, B. T.: Lability of soil organic carbon in tropical soils with different clay minerals, Soil Biol. Biochem., 42, 888–895, 2010.
Burgevin, H. and Hénin, S.: Dix années d'expériences sur l'action des engrais sur la composition et les propriétés d'un sol de limon, Ann Agron, 9, 771–799, 1939.
Chen, C., Dynes, J. J., Wang, J., Karunakaran, C., and Sparks, D. L.: Soft X-ray Spectromicroscopy Study of Mineral-Organic Matter Associations in Pasture Soil Clay Fractions, Environ. Sci. Technol., 48, 6678–6686, https://doi.org/10.1021/es405485a, 2014.
Chenu, C. and Plante, A. F.: Clay-sized organo-mineral complexes in a cultivation chronosequence: revisiting the concept of the “primary organo-mineral complex”, Eur. J. Soil Sci., 57, 596–607, https://doi.org/10.1111/j.1365-2389.2006.00834.x, 2006.
Christensen, B. T.: Physical Fractionation of Soil and Organic Matter in Primary Particle Size and Density Separates, in Advances in Soil Science, 1–90, Springer, New York, 1992.
Dhez, O., Ade, H., and Urquhart, S. G.: Calibrated NEXAFS spectra of some common polymers, Journal of Electron Spectroscopy and Related Phenomena, 128, 85–96, 2003.
Dungait, J. A. J., Hopkins, D. W., Gregory, A. S., and Whitmore, A. P.: Soil organic matter turnover is governed by accessibility not recalcitrance, Glob. Change Biol., 18, 1781–1796, https://doi.org/10.1111/j.1365-2486.2012.02665.x, 2012.
Fernández-Ugalde, O., Barré, P., Hubert, F., Virto, I., Girardin, C., Ferrage, E., Caner, L., and Chenu, C.: Clay mineralogy differs qualitatively in aggregate-size classes: clay-mineral-based evidence for aggregate hierarchy in temperate soils, Eur. J. Soil Sci., 64, 410–422, https://doi.org/10.1111/ejss.12046, 2013.
Fernández-Ugalde, O., Barré, P., Virto, I., Hubert, F., Billiou, D., and Chenu, C.: Does phyllosilicate mineralogy explain organic matter stabilization in different particle-size fractions in a 19-year C3∕C4 chronosequence in a temperate Cambisol?, Geoderma, 264, 171–178, 2016.
Gillespie, A. W., Phillips, C. L., Dynes, J. J., Chevrier, D., Regier, T. Z., and Peak, D.: Chapter One – Advances in Using Soft X-Ray Spectroscopy for Measurement of Soil Biogeochemical Processes, Adv. Agron., 133, 1–32, 2015.
Grasset, L., Martinod, J., Plante, A. F., Amblès, A., Chenu, C., and Righi, D.: Nature and origin of lipids in clay size fraction of a cultivated soil as revealed using preparative thermochemolysis, Org. Geochem., 40, 70–78, https://doi.org/10.1016/j.orggeochem.2008.09.004, 2009.
Hubert, F., Caner, L., Meunier, A., and Lanson, B.: Advances in characterization of soil clay mineralogy using X-ray diffraction: from decomposition to profile fitting, Eur. J. Soil Sci., 60, 1093–1105, 2009.
Hubert, F., Caner, L., Meunier, A., and Ferrage, E.: Unraveling complex < 2 µm clay mineralogy from soils using X-ray diffraction profile modeling on particle-size sub-fractions: Implications for soil pedogenesis and reactivity, Am. Mineral., 97, 384–398, 2012.
Kaznatcheev, K. V., Karunakaran, C., Lanke, U. D., Urquhart, S. G., Obst, M., and Hitchcock, A. P.: Soft X-ray spectromicroscopy beamline at the CLS: Commissioning results, Nucl. Instrum. Methods Phys. Res. Sect. Accel. Spectrometers Detect. Assoc. Equip., 582, 96–99, https://doi.org/10.1016/j.nima.2007.08.083, 2007.
Keiluweit, M., Nico, P. S., Johnson, M. G., and Kleber, M.: Dynamic Molecular Structure of Plant Biomass-Derived Black Carbon (Biochar), Environ. Sci. Technol., 44, 1247–1253, https://doi.org/10.1021/es9031419, 2010.
Keiluweit, M., Bougoure, J. J., Zeglin, L. H., Myrold, D. D., Weber, P. K., Pett-Ridge, J., Kleber, M., and Nico, P. S.: Nano-scale investigation of the association of microbial nitrogen residues with iron (hydr)oxides in a forest soil O-horizon, Geochim. Cosmochim. Ac., 95, 213–226, https://doi.org/10.1016/j.gca.2012.07.001, 2012.
Kinyangi, J., Solomon, D., Liang, B., Lerotic, M., Wirick, S., and Lehmann, J.: Nanoscale Biogeocomplexity of the Organomineral Assemblage in Soil, Soil Sci. Soc. Am. J., 70, 1708, https://doi.org/10.2136/sssaj2005.0351, 2006.
Kleber, M., Sollins, P., and Sutton, R.: A conceptual model of organo-mineral interactions in soils: self-assembly of organic molecular fragments into zonal structures on mineral surfaces, Biogeochemistry, 85, 9–24, https://doi.org/10.1007/s10533-007-9103-5, 2007.
Kleber, M., Nico, P. S., Plante, A., Filley, T., Kramer, M., Swanston, C., and Sollins, P.: Old and stable soil organic matter is not necessarily chemically recalcitrant: implications for modeling concepts and temperature sensitivity, Glob. Change Biol., 17, 1097–1107, https://doi.org/10.1111/j.1365-2486.2010.02278.x, 2011.
Kögel-Knabner, I. and Amelung, W.: 12.7 – Dynamics, Chemistry, and Preservation of Organic Matter in Soils, in: Treatise on Geochemistry, edited by: Holland, H. D. and Turekian, K. K., Second Edition, 157–215, Elsevier, Oxford, 2014.
Laird, D. A., Martens, D. A., and Kingery, W. L.: Nature of Clay-Humic Complexes in an Agricultural Soil, Soil Sci. Soc. Am. J., 65, 1413–1418, https://doi.org/10.2136/sssaj2001.6551413x, 2001.
Le Guillou, C., Bernard, S., Brearley, A. J., and Remusat, L.: Evolution of organic matter in Orgueil, Murchison and Renazzo during parent body aqueous alteration: In situ investigations, Geochim. Cosmochim. Ac., 131, 368–392, https://doi.org/10.1016/j.gca.2013.11.020, 2014.
Le Guillou, C., Bernard, S., De la Pena, F., and Le Brech, Y.: XANES-Based Quantification of Carbon Functional Group Concentrations, Anal. Chem., 90, 8379–8386, https://doi.org/10.1021/acs.analchem.8b00689, 2018.
Lehmann, J. and Kleber, M.: The contentious nature of soil organic matter, Nature, 528, 60–68, https://doi.org/10.1038/nature16069, 2015.
Lehmann, J., Liang, B., Solomon, D., Lerotic, M., Luizão, F., Kinyangi, J., Schäfer, T., Wirick, S., and Jacobsen, C.: Near-edge X-ray absorption fine structure (NEXAFS) spectroscopy for mapping nano-scale distribution of organic carbon forms in soil: Application to black carbon particles, Glob. Biogeochem. Cy., 19, GB1013, https://doi.org/10.1029/2004GB002435, 2005.
Lutfalla, S., Abiven, S., Barré, P., Wiedemeier, D. B., Christensen, B. T., Houot, S., Kätterer, T., Macdonald, A. J., van Oort, F., and Chenu, C.: Pyrogenic Carbon Lacks Long-Term Persistence in Temperate Arable Soils, Front. Earth Sci., 5, 96, https://doi.org/10.3389/feart.2017.00096, 2017.
Lützow, M. V., Kögel-Knabner, I., Ekschmitt, K., Matzner, E., Guggenberger, G., Marschner, B., and Flessa, H.: Stabilization of organic matter in temperate soils: mechanisms and their relevance under different soil conditions – a review, Eur. J. Soil Sci., 57, 426–445, https://doi.org/10.1111/j.1365-2389.2006.00809.x, 2006.
Mikutta, R., Mikutta, C., Kalbitz, K., Scheel, T., Kaiser, K., and Jahn, R.: Biodegradation of forest floor organic matter bound to minerals via different binding mechanisms, Geochim. Cosmochim. Ac., 71, 2569–2590, https://doi.org/10.1016/j.gca.2007.03.002, 2007.
Moore, D. M. and Reynolds, R. C.: X-Ray-Diffraction and the Identification and Analysis of Clay Minerals, Oxford university press, Oxford, 322, 321, 1989.
Paradelo, R., van Oort, F., and Chenu, C.: Water-dispersible clay in bare fallow soils after 80 years of continuous fertilizer addition, Geoderma, 200–201, 40–44, https://doi.org/10.1016/j.geoderma.2013.01.014, 2013.
Pernes-Debuyser, A. and Tessier, D.: Influence du pH sur les propriétés des sols?: l'essai de longue durée des 42 parcelles à Versailles, Rev. Sci. Eau, 15, 27–39, https://doi.org/10.7202/705484ar, 2002.
Regier, T., Krochak, J., Sham, T., Hu, Y., Thompson, J., and Blyth, R.: Performance and capabilities of the Canadian Dragon: The SGM beamline at the Canadian Light Source, Nucl. Instrum. Methods Phys. Res. Sect. Accel. Spectrometers Detect. Assoc. Equip., 582, 93–95, 2007.
Rowley, M. C., Grand, S., and Verrecchia, É. P.: Calcium-mediated stabilisation of soil organic carbon, Biogeochemistry, 137, 27–49, https://doi.org/10.1007/s10533-017-0410-1, 2018.
Rühlmann, J.: A new approach to estimating the pool of stable organic matter in soil using data from long-term field experiments, Plant Soil, 213, 149–160, https://doi.org/10.1023/A:1004552016182, 1999.
Schmidt, M. W. I., Torn, M. S., Abiven, S., Dittmar, T., Guggenberger, G., Janssens, I. A., Kleber, M., Kögel-Knabner, I., Lehmann, J., Manning, D. A. C., Nannipieri, P., Rasse, D. P., Weiner, S., and Trumbore, S. E.: Persistence of soil organic matter as an ecosystem property, Nature, 478, 49–56, https://doi.org/10.1038/nature10386, 2011.
Sollins, P., Swanston, C., Kleber, M., Filley, T., Kramer, M., Crow, S., Caldwell, B. A., Lajtha, K., and Bowden, R.: Organic C and N stabilization in a forest soil: Evidence from sequential density fractionation, Soil Biol. Biochem., 38, 3313–3324, https://doi.org/10.1016/j.soilbio.2006.04.014, 2006.
Solomon, D., Lehmann, J., Kinyangi, J., Liang, B., Heymann, K., Dathe, L., Hanley, K., Wirick, S., and Jacobsen, C.: Carbon (1s) NEXAFS spectroscopy of biogeochemically relevant reference organic compounds, Soil Sci. Soc. Am. J., 73, 1817–1830, 2009.
Solomon, D., Lehmann, J., Wang, J., Kinyangi, J., Heymann, K., Lu, Y., Wirick, S., and Jacobsen, C.: Micro- and nano-environments of C sequestration in soil: A multi-elemental STXM–NEXAFS assessment of black C and organomineral associations, Sci. Total Environ., 438, 372–388, https://doi.org/10.1016/j.scitotenv.2012.08.071, 2012.
Soussana, J.-F., Lutfalla, S., Ehrhardt, F., Rosenstock, T., Lamanna, C., Havlík, P., Richards, M., Wollenberg, E., Chotte, J.-L., Torquebiau, E., Ciais, P., Smith, P., and Lal, R.: Matching policy and science: Rationale for the “4 per 1000 – soils for food security and climate” initiative, Soil Till. Res., 188, 3–15, https://doi.org/10.1016/j.still.2017.12.002, 2017.
Tiessen, H. and Stewart, J. W. B.: Particle-size Fractions and their Use in Studies of Soil Organic Matter: II. Cultivation Effects on Organic Matter Composition in Size Fractions1, Soil Sci. Soc. Am. J., 47, 509–514, https://doi.org/10.2136/sssaj1983.03615995004700030023x, 1983.
Trumbore, S.: Age of Soil Organic Matter and Soil Respiration: Radiocarbon Constraints on Belowground C Dynamics, Ecol. Appl., 10, 399–411, https://doi.org/10.2307/2641102, 2000.
von Lützow, M. and Kögel-Knabner, I.: Response to the Concept paper: “What is recalcitrant soil organic matter?” by Markus Kleber, Environ. Chem., 7, 333–335, 2010.
Wan, J., Tyliszczak, T., and Tokunaga, T. K.: Organic carbon distribution, speciation, and elemental correlations within soil microaggregates: Applications of STXM and NEXAFS spectroscopy, Geochim. Cosmochim. Ac., 71, 5439–5449, https://doi.org/10.1016/j.gca.2007.07.030, 2007.
Wilson, M. J.: The origin and formation of clay minerals in soils: past, present and future perspectivesd, Clay Miner., 34, 7–25, https://doi.org/10.1180/000985599545957, 1999.