the Creative Commons Attribution 4.0 License.
the Creative Commons Attribution 4.0 License.
 | 20 Mar 2019
Planktonic foraminiferal spine versus shell carbonate Na incorporation in relation to salinity
Lennart J. de Nooijer
Jacqueline Bertlich
Jelle Bijma
Dirk Nürnberg
Gert-Jan Reichart
Sea surface salinity is one of the most important parameters to reconstruct in paleoclimatology, reflecting amongst other things the hydrological cycle, paleodensity, ice volume, and regional and global circulation of water masses. Recent culture studies and a Red Sea field study revealed a significant positive relation between salinity and Na incorporation within benthic and planktonic foraminiferal shells. However, these studies reported varying partitioning of Na between and within the same species. The latter could be associated with ontogenetic variations, most likely spine loss. Varying Na concentrations were observed in different parts of foraminiferal shells, with spines and regions close to the primary organic sheet being especially enriched in Na. In this study, we unravel the Na composition of different components of the planktonic foraminiferal shell wall using electron probe micro-analysis (EPMA) and solution ICP-MS. A model is presented to interpret EPMA data for spines and spine bases to quantitatively assess differences in composition and contribution to whole-shell Na∕Ca signals. The same model can also be applied to other spatial inhomogeneities observed in foraminiferal shell chemistry, like elemental (e.g., Mg, Na, S) banding and/or hotspots. The relative contribution of shell carbonate, organic linings, spines and spine bases to whole-shell Na chemistry is considered quantitatively. This study shows that whereas the high Na areas may be susceptible to taphonomic alterations, the Na chemistry of the shell itself seems relatively robust. Comparing both shell and spine Na∕Ca values with salinity shows that shell chemistry records salinity, albeit with a very modest slope.
- Article
(6049 KB) -
Supplement
(2756 KB) - BibTeX
- EndNote


Salinity is one of the most popular parameters to reconstruct in paleoceanography, driving, together with temperature, the thermohaline circulation and reflecting regional hydrological cycling. Whereas temperature can be reconstructed by a variety of proxies (e.g., : Prahl and Wakeham, 1987; foraminiferal Mg∕Ca: Elderfield and Ganssen, 2000; Lea et al., 1999; Nürnberg et al., 1996; foraminiferal δ18O: e.g., Zachos et al., 2001; Elderfield and Ganssen, 2000 and TEX86: Schouten et al., 2002), equally reliable proxies for salinity are still under development (Wit et al., 2013; Mezger et al., 2016; Allen et al., 2016; Rohling and Bigg, 1998; Schouten et al., 2006). A number of approaches have been proposed to reconstruct salinity, including a combination of stable isotopes (δ18O from foraminiferal shells or δD of long-chain ketones) with independent reconstructions of sea surface temperature (e.g., Mg∕Ca or , Elderfield and Ganssen, 2000; Schouten et al., 2006); foraminiferal Ba∕Ca (Weldeab, 2007), dinoflagellate cyst morphology (e.g., Verleye et al., 2012; Mertens et al., 2012), and δD of long-chain ketones and alkenones (e.g., Vasiliev et al., 2017). However, uncertainties associated with the indirect controls on these proxy signals or preservation issues result in (large) errors in the reconstructed salinity (Rohling, 2007). This can be circumvented by a more direct approach, related to elements determining seawater salinity (e.g., Cl, Na). Even though Na is considered as a conservative element in seawater, recent culture studies and a Red Sea field study reveal a significant positive relation between salinity and Na incorporation within benthic (Wit et al., 2013; Geerken et al., 2018) and planktonic (Allen et al., 2016; Mezger et al., 2016; Bertlich et al., 2018) foraminiferal shells. This relation between salinity and Na incorporation, potentially related to an increase in the activity ratio with salinity, is not only observed for foraminiferal calcite (Allen et al., 2016; Mezger et al., 2016; Wit et al., 2013), but also for barnacles and Atlantic oyster shells (Rucker and Valentine, 1961; Gordon et al., 1970) and inorganically precipitated calcium carbonate (Kitano et al., 1975; Ishikawa and Ichikuni, 1984).
Previous studies on the incorporation of Na into biogenic and inorganic calcite varied in reported partition coefficients, despite similar conditions (White, 1978; Ishikawa and Ichikuni, 1984; Kitano et al., 1975). These differences are not only observed between inorganic and biogenic studies, but also between and within the same foraminiferal species, either growing in culture or the natural environment (Mezger et al., 2016; Allen et al., 2016; Wit et al., 2013; Bertlich et al., 2018). Recently, Mezger et al. (2018) studied the preservation of the Na-salinity signal of the G. ruber and T. sacculifer species through the water column, comparing sedimentary and water-column-collected specimens (0–500 m) of the Red Sea. It was found that Na∕Ca values decrease with water depth, thereby aligning the lower Na∕Ca from the surface sediment samples with those observed in culture studies (Allen et al., 2016; Wit et al., 2013; Mezger et al., 2018; Bertlich et al., 2018). The loss of spines, highly enriched in Na (Branson et al., 2016; Mezger et al., 2016), during settling in the water column is hypothesized to be the controlling factor of the decreasing Na∕Ca values, as foraminifera shed their spines before gametogenesis (Bé, 1980). Furthermore, it has been suggested that calcite growth rate (Busenberg and Plummer, 1985), temperature (Allen et al., 2016), environmental differences between field and controlled growth experiments (Wit et al., 2013; Allen et al., 2016; Mezger et al., 2016), life stages (Mezger et al., 2018) ageing/leakage (Yoshimura et al., 2017), or organic linings (Yoshimura et al., 2017; Branson et al., 2016) affect Na incorporation. The inhomogeneous inter-shell distribution of sodium, partially due to life stage, could influence measured Na values (Geerken et al., 2018; Branson et al., 2016; Mezger et al., 2018) and potentially explain part of the observed differences. Similar to reports for other inter-shell element distributions (e.g., Mg: Sadekov et al., 2005; Hathorne et al., 2009; Kunioka, 2006), Na appears to occur in bands of alternating high and low concentrations (Geerken et al., 2018). However, the thickness and intensity of these bands is not similar between species (Geerken et al., 2018). For the planktonic species Globigerinoides ruber and Trilobatus sacculifer, elevated concentrations of Na are also observed in regions where the spines meet the rest of the shell wall (Branson et al., 2016; Mezger et al., 2018), close to the primary organic sheet (POS). This may indicate that different species vary in their calcification mechanisms: i.e., spines and gametogenic (GAM) calcite in planktonic species may be precipitated by different biomineralization pathways and hence may have various element compositions (Steinhardt et al., 2015; Nürnberg et al., 1996; Sadekov et al., 2005). Clearly, the internal Na distribution influences measured Na∕Ca values and is hence important for the potential application of foraminiferal shell Na∕Ca for salinity reconstructions. In this study, different parts of planktonic foraminiferal shells are distinguished geochemically to quantify the relative contribution of shell calcite, spine calcite and organic linings on the total foraminiferal Na∕Ca. We use high-resolution quantitative electron probe micro-analysis (EPMA) to distinguish differences in element composition between different parts of the shell and scanning electron microscopy (SEM) to determine the relative contribution of spines (thickness, density) of surface water specimens. Not only field-collected surface water specimens (Mezger et al., 2016), but also cultured T. sacculifer (Bertlich et al., 2018), Red Sea water column and surface sediment T. sacculifer and G. ruber specimens (Mezger et al., 2018) are measured for comparison. Furthermore, we assess the impact on the foraminiferal shell chemistry of the organic linings by isolating these linings and analyzing their Na∕Ca. These data are subsequently evaluated along a (surface water) salinity gradient, considering the potential impact of taphonomic alterations to evaluate the proxy potential of foraminiferal shell Na∕Ca values.
Living Red Sea field-collected T. sacculifer and G. ruber specimens were collected in May 2000 during R/V Pelagia cruise 64PE158 (Mezger et al., 2016). Core-top and box-core (upper 0–1 cm) specimens from similar locations were collected during different cruises as described in Siccha et al. (2009). Cultured T. sacculifer specimens were collected at 3–8 m water depth 1.6–3.2 km off the south coast of Curaçao and off the west coast of Barbados, after which they were grown in filtered seawater with salinities ranging from 26 to 45 (Nürnberg et al., 1996; Bijma et al., 1990; Bertlich et al., 2018). To study the relative contribution of Na in different parts of the shell to the total Na∕Ca composition, high-resolution quantitative EPMAs were performed at Utrecht University (Sect. 2.1). Spine thickness and densities (number of spines per surface area) were derived by scanning electron microscopy (Sect. 2.2). For the chemical analyses of organic linings (Sect. 2.3), foraminifera within the size fraction of 250–355 µm for T. sacculifer and 100–355 µm for G. ruber were collected from calcareous ooze, retrieved by a gravity core at the Walvis ridge (similar to the material used for the NFHS-1, Mezger et al., 2016).
2.1 Electron probe micro-analysis (EPMA)
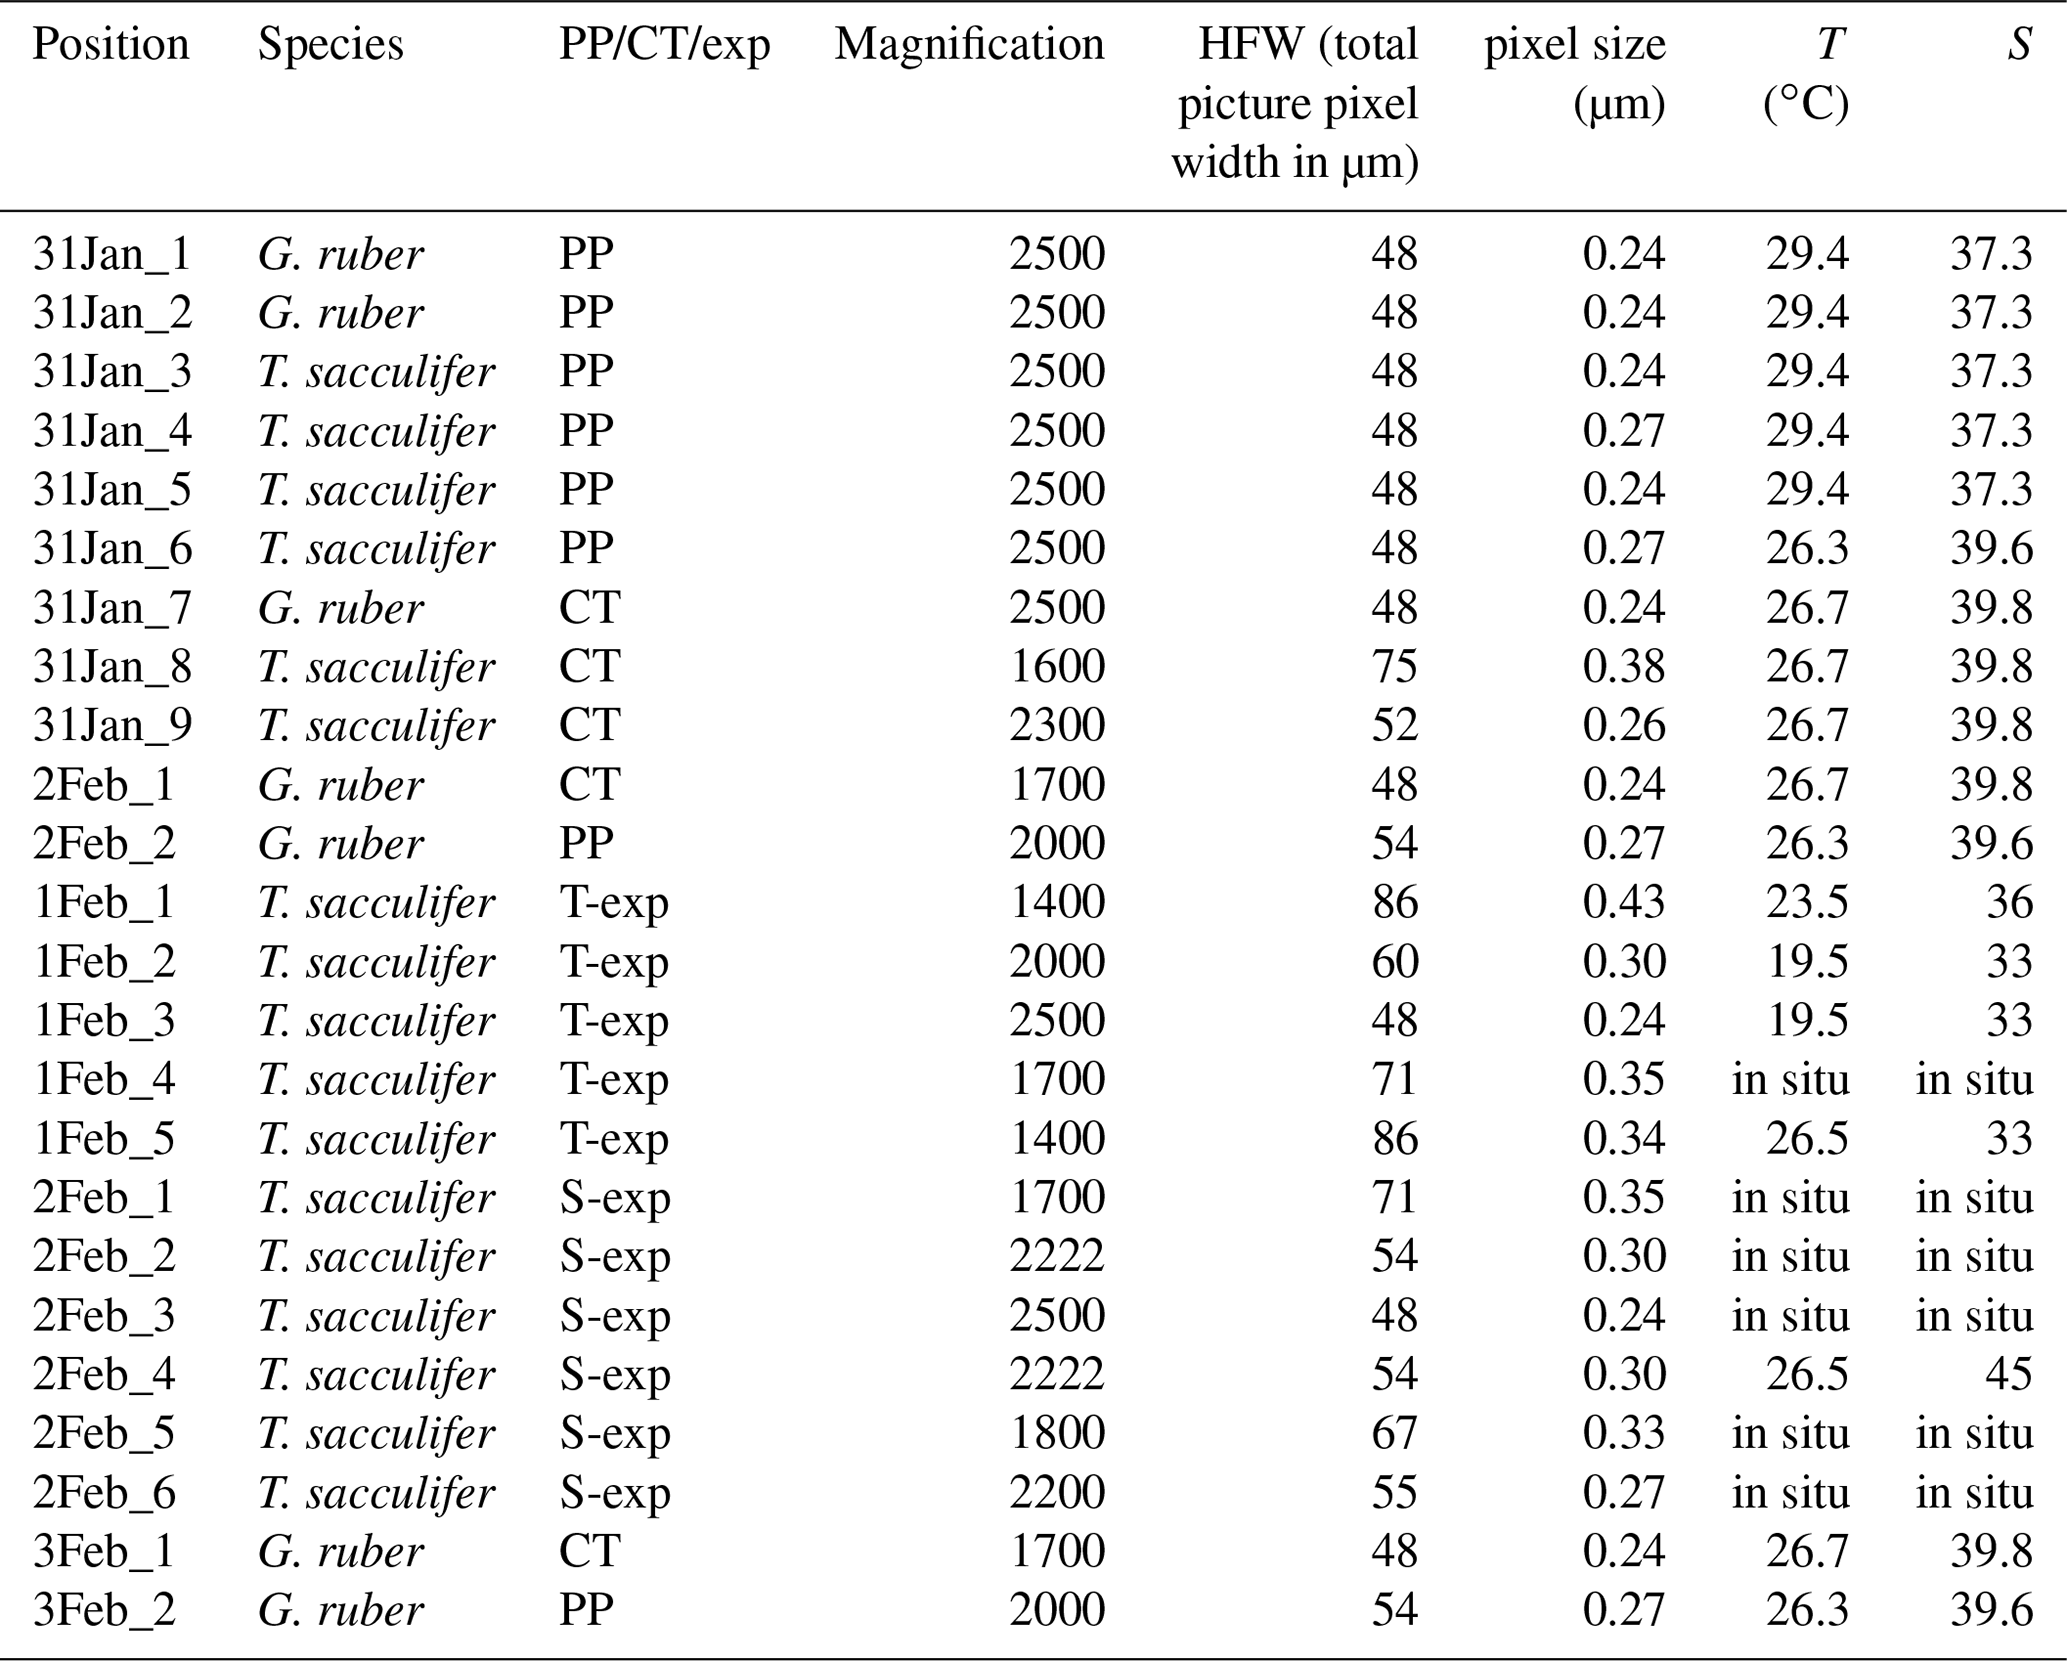
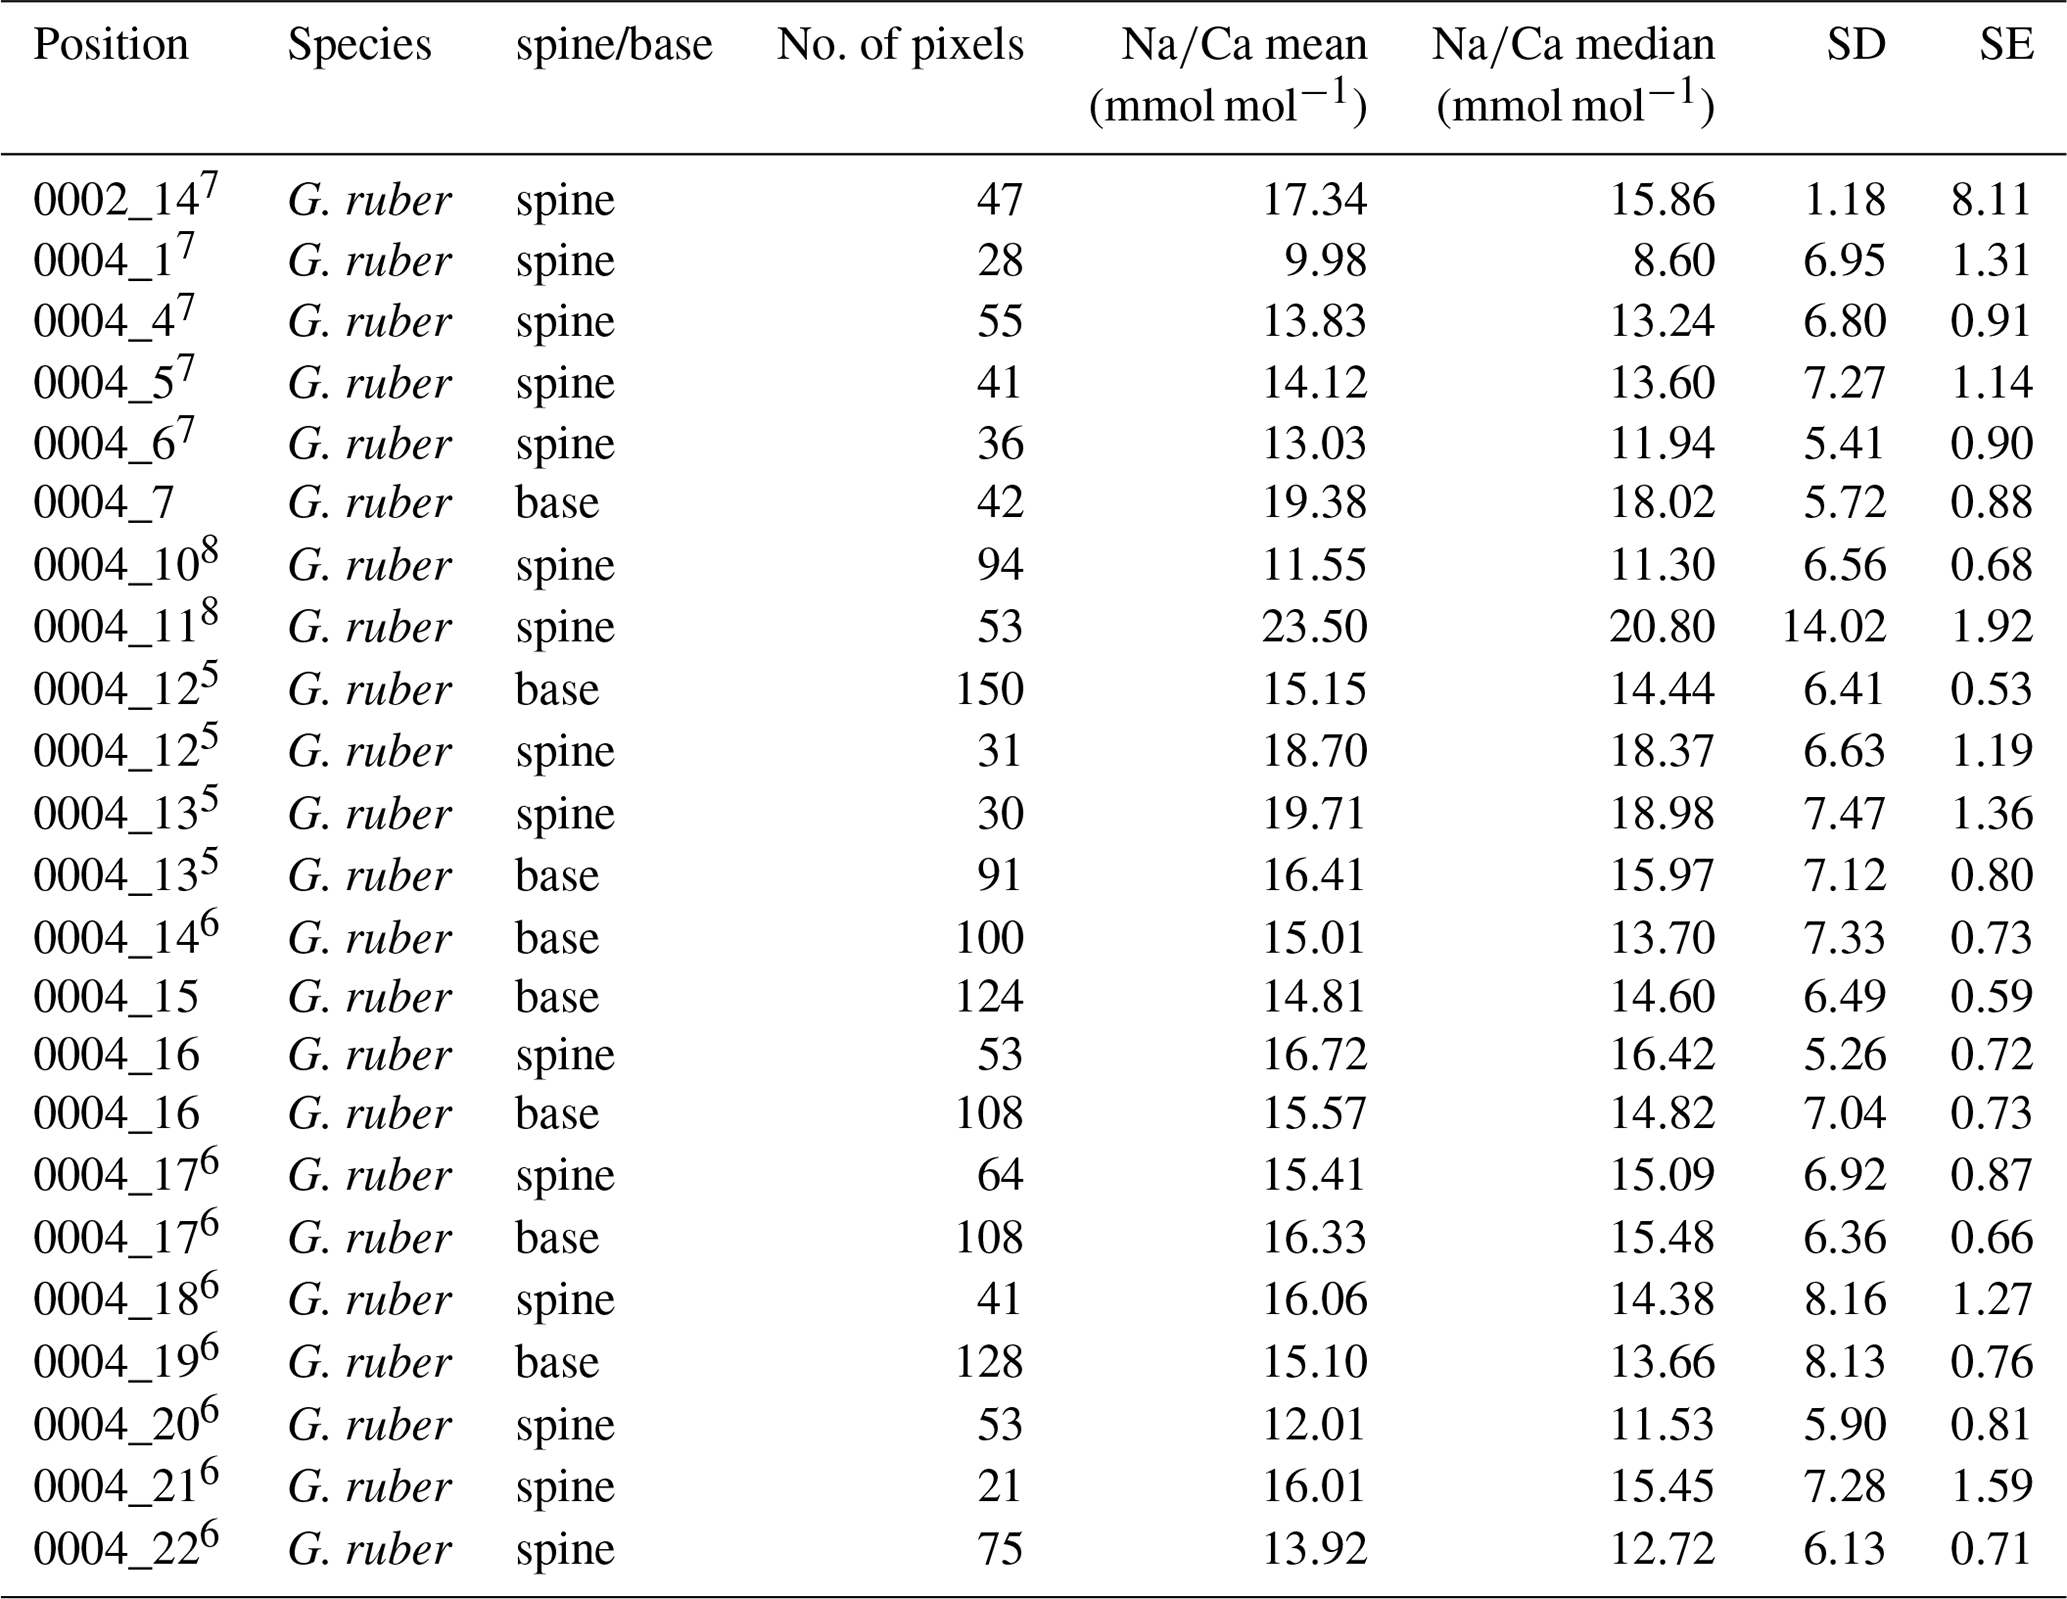
The Na∕Ca composition of the spines and shells collected from the Red Sea water column as well as core tops were measured at a high spatial resolution using EPMA (Table 1). Several specimens of both species were selected and embedded in resin (Araldite 20∕20) in a vacuum chamber. Multi-net-collected specimens were isolated directly upon low temperature ashing for spine analysis, transferred without sieving to preserve the spines and embedded in resin as well (Mezger et al., 2018). After drying for at least 48 h in an oven at approximately 50 ∘C, the specimens embedded in resin were polished. This polishing was performed until the center of the shell was reached, as potential differences in element incorporation related to the 3-D structure of foraminiferal shells are still not well known. Upon polishing, samples were cleaned by rinsing 3 times with double de-ionized water and coated with carbon after drying. Element mapping for Na and Ca of cultured specimens of T. sacculifer (Bertlich et al., 2018) as well as Red Sea-derived specimens of G. ruber and T. sacculifer was performed with an electron microprobe at Utrecht University (JEOL JXA-8530F Field Emission Electron Probe Microanalyzer). Maps were generated with a focused electron beam, a beam current of 10 nA and an accelerating voltage of 7 kV. The dwell time was set at 300 ms and pixel sizes ranged between 0.2 and 0.43 µm. Counts, representing current strength, were converted to elemental ratios using analyses on standard material. We used jadeite for Na, foraminiferal calcite for Ca and forsterite for Mg, assuming a linear dependency of concentration (in mass %) on the signal and a constant background. Background intensities, measured for the same (foraminiferal) samples with similar settings, were subtracted from total element intensities before converting to mass %. Single points were eliminated from further analyses when the Ca mass percentage of that spot was below 30 %. Unfortunately, this (EPMA) method did not allow for chlorine (Cl) measurements, being present in seawater in similar concentrations as Na and therefore potentially also a suitable proxy for salinity, since their concentrations in calcite are much lower (∼40 times) than those of Na (Kitano et al., 1975).
Table 1List of characteristics of the EPMA measurements, excluding the multi-nets. The phrase “in situ” indicates that the measured chambers were not grown in culture, but formed in the natural environment 1.6–3.2 km off the south coast of Curaçao () before sampling. “PP” refers to Red Sea plankton pump samples, “CT” to Red Sea core-top samples and “exp” to experiments.
In this article, we refer to “whole-shell” for total shell measurements including high Na regions such as spines (e.g., laser ablation measurements in Mezger et al., 2016), and “shell-only” when spine (base) regions are excluded from analysis. For the elemental analyses of the foraminiferal shell, regions of the shell not containing spines (shell-only) were selected that included potential banding, but excluded Na hotspots, which were observed near spine bases (e.g., Figs. 1 and S1 in the Supplement). Deconvolving the “true” maximum Na values within the mixed spine signal is challenging, as the EPMA Na∕Ca signal has a limited resolution. Values hence consist of shell calcite values, as well as pixel-averaged mixed signals and the real spine signal. Because of the limited size of the spines and spine bases only a few of the analyses will capture spine carbonate, while more analyses capture a mixture of both spine and ontogenetic carbonate and most analyses will show ontogenetic carbonate only. In the discussion, we suggest how the limited data of the spine chemistry can still be interpreted (Sect. 4.2).
The similarity between Na∕Ca EPMA measurements of the same cultured T. sacculifer specimens performed at GEOMAR in Kiel, grown at different salinity and temperature conditions (for standards and measurements: Bertlich et al., 2018), and Utrecht University was used to assess consistency of the measurements, which was between 101.8 % and 106.4 % for the line scans and between 101 % and 122 % for the maps (concentrations from Utrecht compared to Kiel). These values are a conservative estimate, as the selection of the lines and regions to compare are never identical to previous measurements on the same shell (Fig. S2). Details for these cultured specimens can be found in Bijma et al. (1990). Elemental analysis on JCP-1 powder (n=6) (Okai et al., 2002) was included, with similar settings as the sample measurements, to assess accuracy (sample and reference) of Sr (99.3 %), Mg (106.3 %), S (103.4 %) and Na (85 %). Although the error on the Na quantification is considerable, offsets are minor compared to the ranges studied here.
2.2 Scanning electron microscopy
Surface structures of foraminifera, including spine density, length and width, were quantified using scanning electron microscopy (Hitachi High-Tech TM3000 TableTop scanning electron microscope). However, as a consequence of sampling (plankton pump, sieving) and sample preparation (low temperature ashing – LTA; Mezger et al., 2016; Fallet et al., 2010), many of the spines (partially) broke off and the total spine lengths could not be determined and not used for further calculations. Spine density was calculated from pictures of a 50 µm × 50 µm square, focusing on the F-2 chamber (antepenultimate chamber) and, if that is not available, the final or penultimate chamber. We used the surface-water-collected specimens for two species (G. ruber and T. sacculifer), which were measured previously for their Na∕Ca composition with laser ablation laser ablation quadrupole inductively coupled plasma mass spectrometry (LA-Q-ICP-MS) (Mezger et al., 2016). Previously ablated areas were avoided, but using these exact specimens allows comparison of the previously published whole-shell data (respectively shells including spine(s) (bases)) with the here-presented spine distributions. The number of spines was determined by counting the number of pores, as these morphological features are more robust. This quantification is based on the assumption that a spine is or was present at every corner of the cancellated (hexagonal) shell structure around each pore for these species (Bé, 1980). The thickness of the round spines was measured at the base of the spine. This effectively avoids potential pitfalls of the method associated with tapering of spines (Fig. 2). Foraminiferal size was measured as described by Mezger et al. (2016).
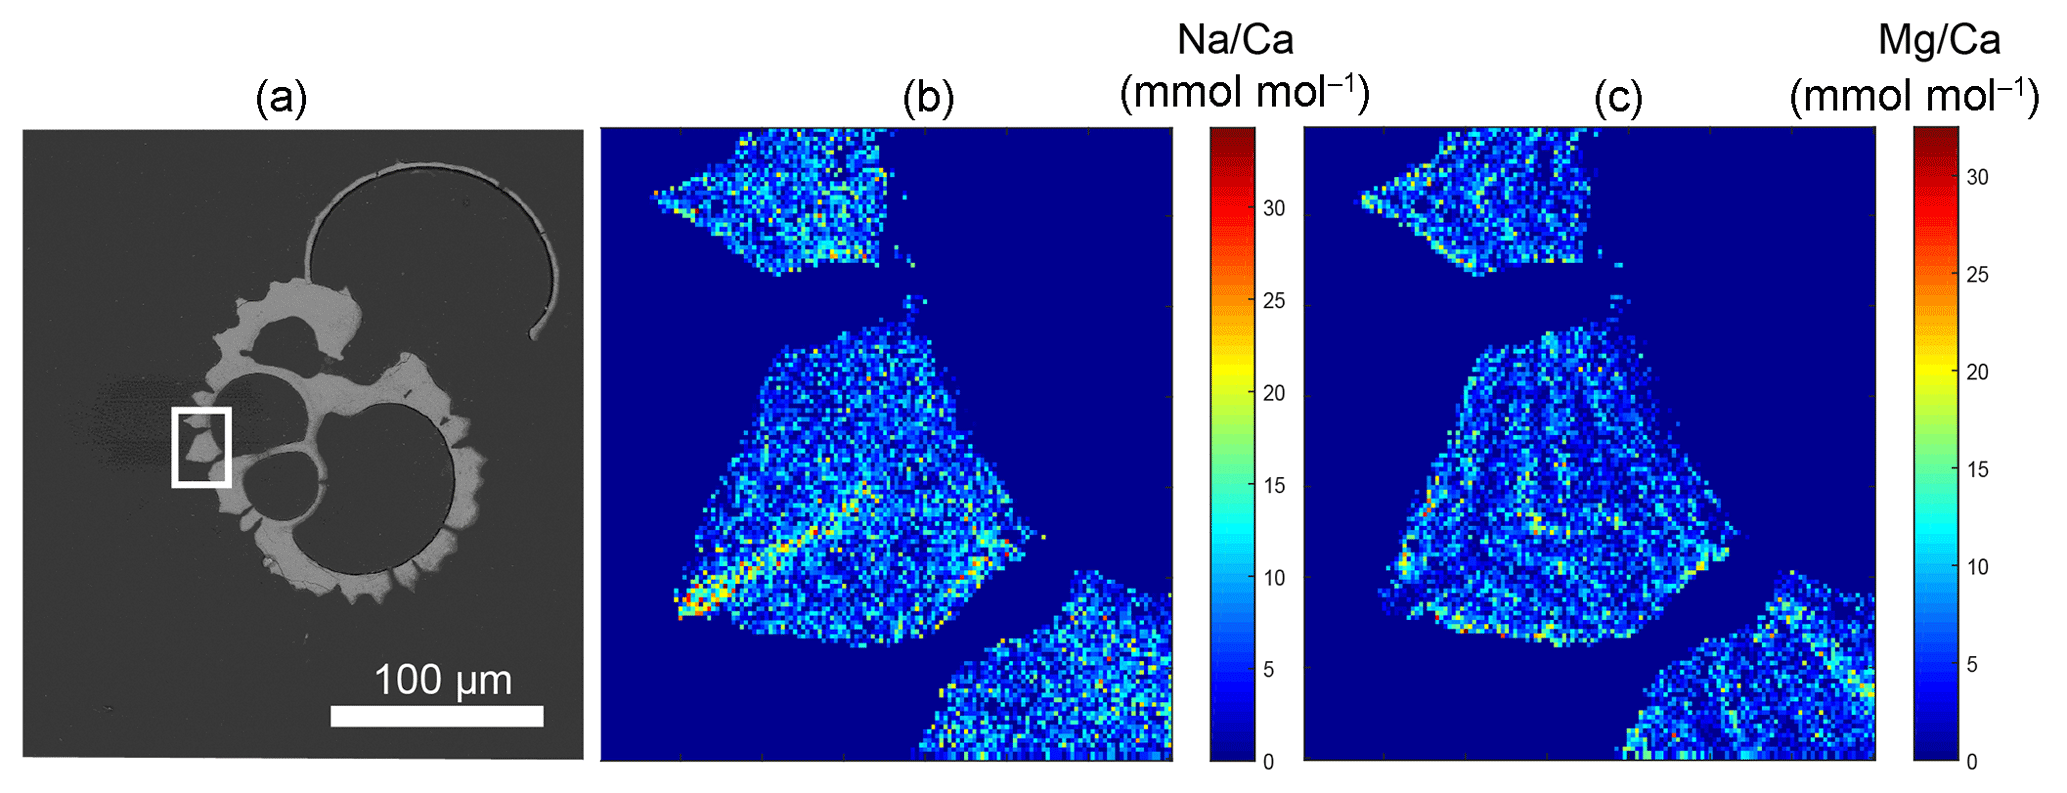
Figure 1Example of a backscattered electron overview image of an embedded and polished G. ruber plankton tow specimen, with the white square indicating the close-up region (a), and the Na∕Ca (b) and Mg∕Ca (c) EPMA images of this close-up showing the relative distribution of both elements within the shell. Whereas Na appears to be mainly concentrated in the spine (base), Mg mainly occurs in clear bands sloping upwards towards the spine and somewhat lower in the spine region (Mezger et al., 2018).

Figure 2Example of SEM-images of the foraminiferal specimens studied here: (a) example of a laser-ablated T. sacculifer specimen, (b) spine count area in the F-2 chamber, (c) close-up of spines, showing the tapering shape of spines and (d) spine width measurements at the base of the spines.
2.3 Organic linings
For isolation of organic linings, 257 G. ruber specimens and 150 T. sacculifer specimens were selected from a calcareous ooze isolated from a gravity core recovered from the Walvis ridge (similar to the material used for the NFHS-1: Mezger et al., 2016). After isolation of the specimens, samples were treated to remove organic matter on the outside of the shell with buffered 1 % hydrogen peroxide in a heated water bath at 90 ∘C. Thereafter, samples were crushed lightly to enable clay particle removal from the inside of the shell by ultra-sonication. The calcite shells were subsequently dissolved in a glass beaker filled with 0.1 M ultrapure weak acetic acid, leaving these overnight to dissolve. After visual inspection of the dissolution of the shells, organic linings (OLs) were isolated, centrifuged and rinsed 3 times with ultrapure water. Weights were determined after drying the isolated linings in a laminar cabinet at room temperature. In total, 0.04 mg OL was isolated from 5.66 mg T. sacculifer shells (0.7 %), and 0.02 mg OL from 4.95 mg G. ruber (0.4 %). After drying and weighing, the isolated OL was destructed in a PTFE tube overnight in an oxidative acid mixture (0.09 mL ultrapure HNO3 and 0.01 mL ultrapure perchloric acid) in a 70 ∘C water bath. The sample was brought to near dryness before being transferred to a PTFE digestion tube with 0.075 mL ultrapure HNO3 and kept at 150 ∘C for 12 h. After cooling down another aliquot of 0.05 mL ultrapure perchloric acid was added and left to react at 180 ∘C on a thermostatic block. After the samples were inspected for total destruction the sample was diluted to 2.5 mL with ultrapure water and small amounts of ultrapure HNO3. The elemental composition was subsequently measured with a Thermo Fisher Scientific iCAP-Q. Elements were quantified using their relevant isotopes (23Na, 24Mg, 43Ca and 88Sr, respectively). Calibration standards used were taken up in a similar matrix (1 mol L−1 HNO3). OL quantifications were based on back-calculating original shell and OL weights.
3.1 EPMA
3.1.1 Shell Na∕Ca
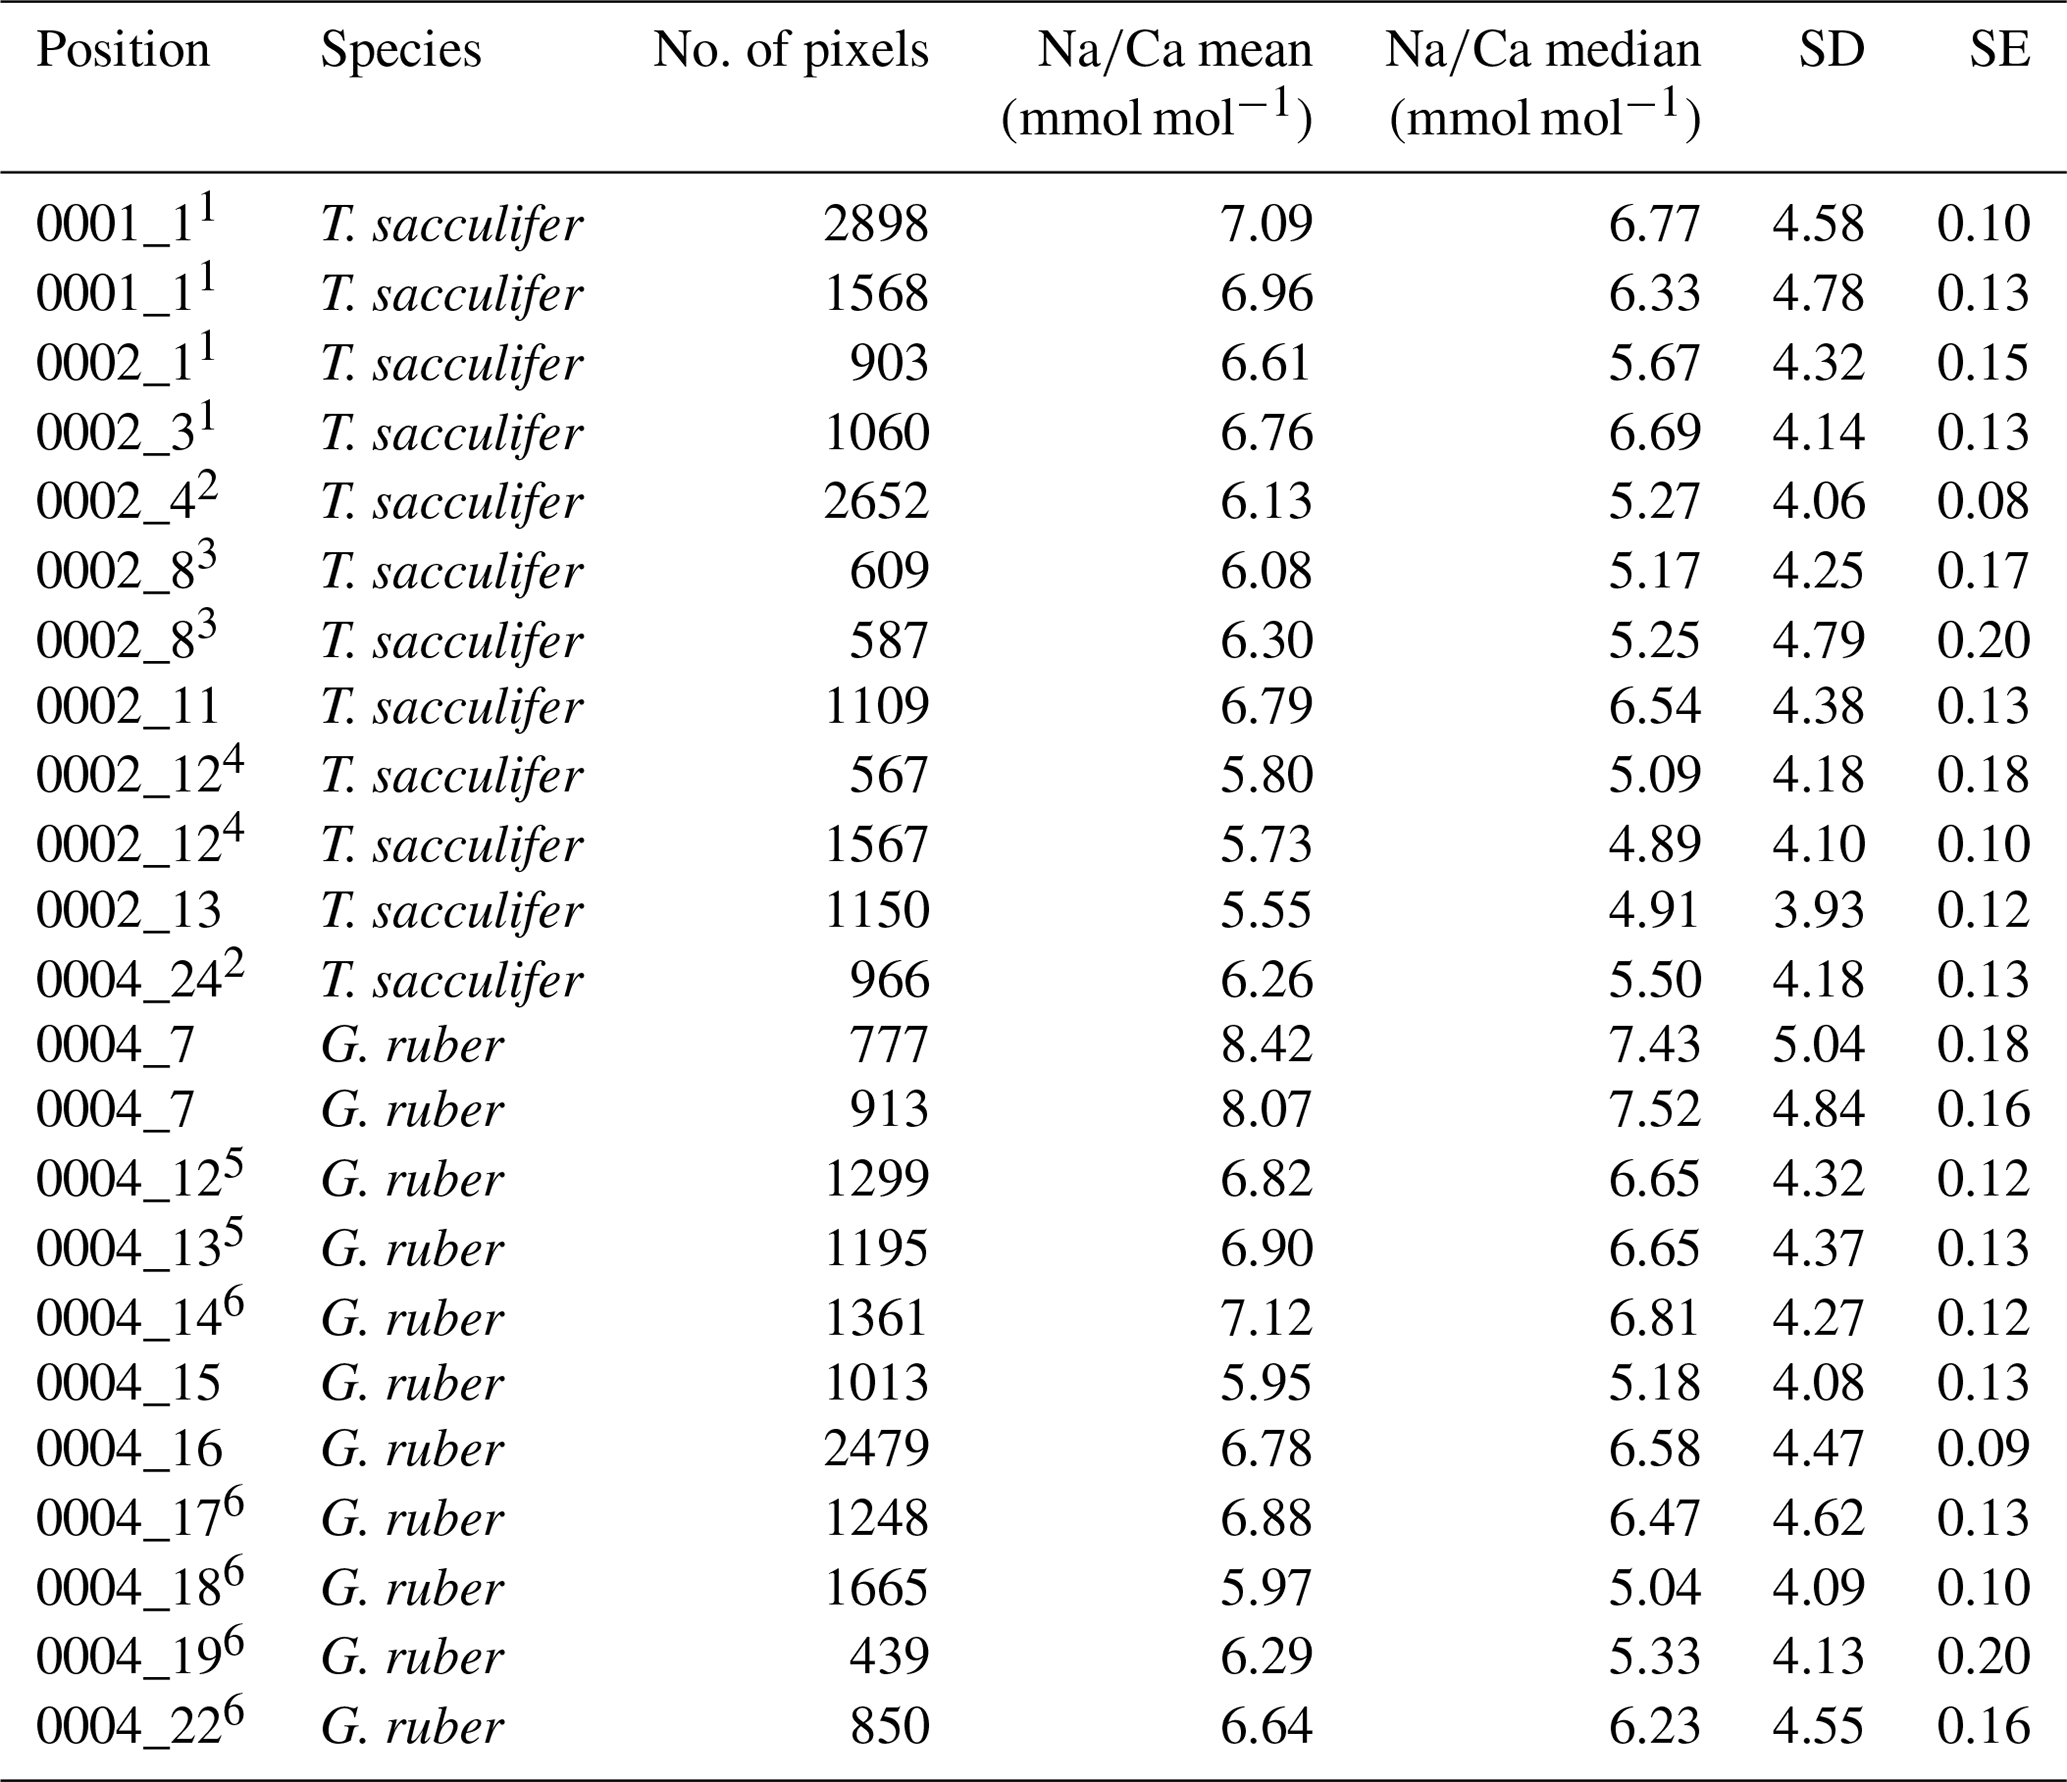
Generally, Na is rather homogeneously distributed throughout the shell, although Na hotspots are observed in spines and near the spine bases (Figs. 1, S1). Banding is not observed for any of the specimens from plankton pumps, core tops or multi-nets, except for one specimen of T. sacculifer (Supplement Sect. S3, specimen 31-4). Several areas from shell cross sections were selected in such a way to avoid areas enriched in Na (“shell-only”). This basically excludes areas with spines and spine bases. Plankton pump shell-only G. ruber Na∕Ca values range from 5.6±0.18 to 7.7±0.25 mmol mol−1 (averages and standard errors) for a Red Sea surface water salinity of 37.3 and between 5.91±0.21 and 6.39±0.29 for a Red Sea surface water salinity of 39.6 (Table 2). For plankton pump-collected T. sacculifer, shell-only Na∕Ca values range between 6.12±0.20 and 6.83±0.13 mmol mol−1 for a Red Sea surface water salinity of 37.3 and between 6.12±0.15 and 6.75±0.31 for a Red Sea surface water salinity of 39.6 (Table 2). Shells collected from the 0 to 100 m water depth interval show Na∕Ca values for T. sacculifer ranging from 5.6±0.12 to 7.1±0.10 mmol mol−1 and for G. ruber between 5.95±0.13 and 8.42±0.18 (Table 3). Core-top shell-only Na∕Ca values range from 5.41±0.17 to 6.84±0.25 mmol mol−1 for G. ruber and from 5.52±0.14 to 6.22±0.23 mmol mol−1 for T. sacculifer (Table 2). All quantitative EPMA maps for Na in the shells and spines are shown in the Supplement section.
Table 2Overview of EPMA shell measurements of different parts of the shell for core tops and plankton pumps.
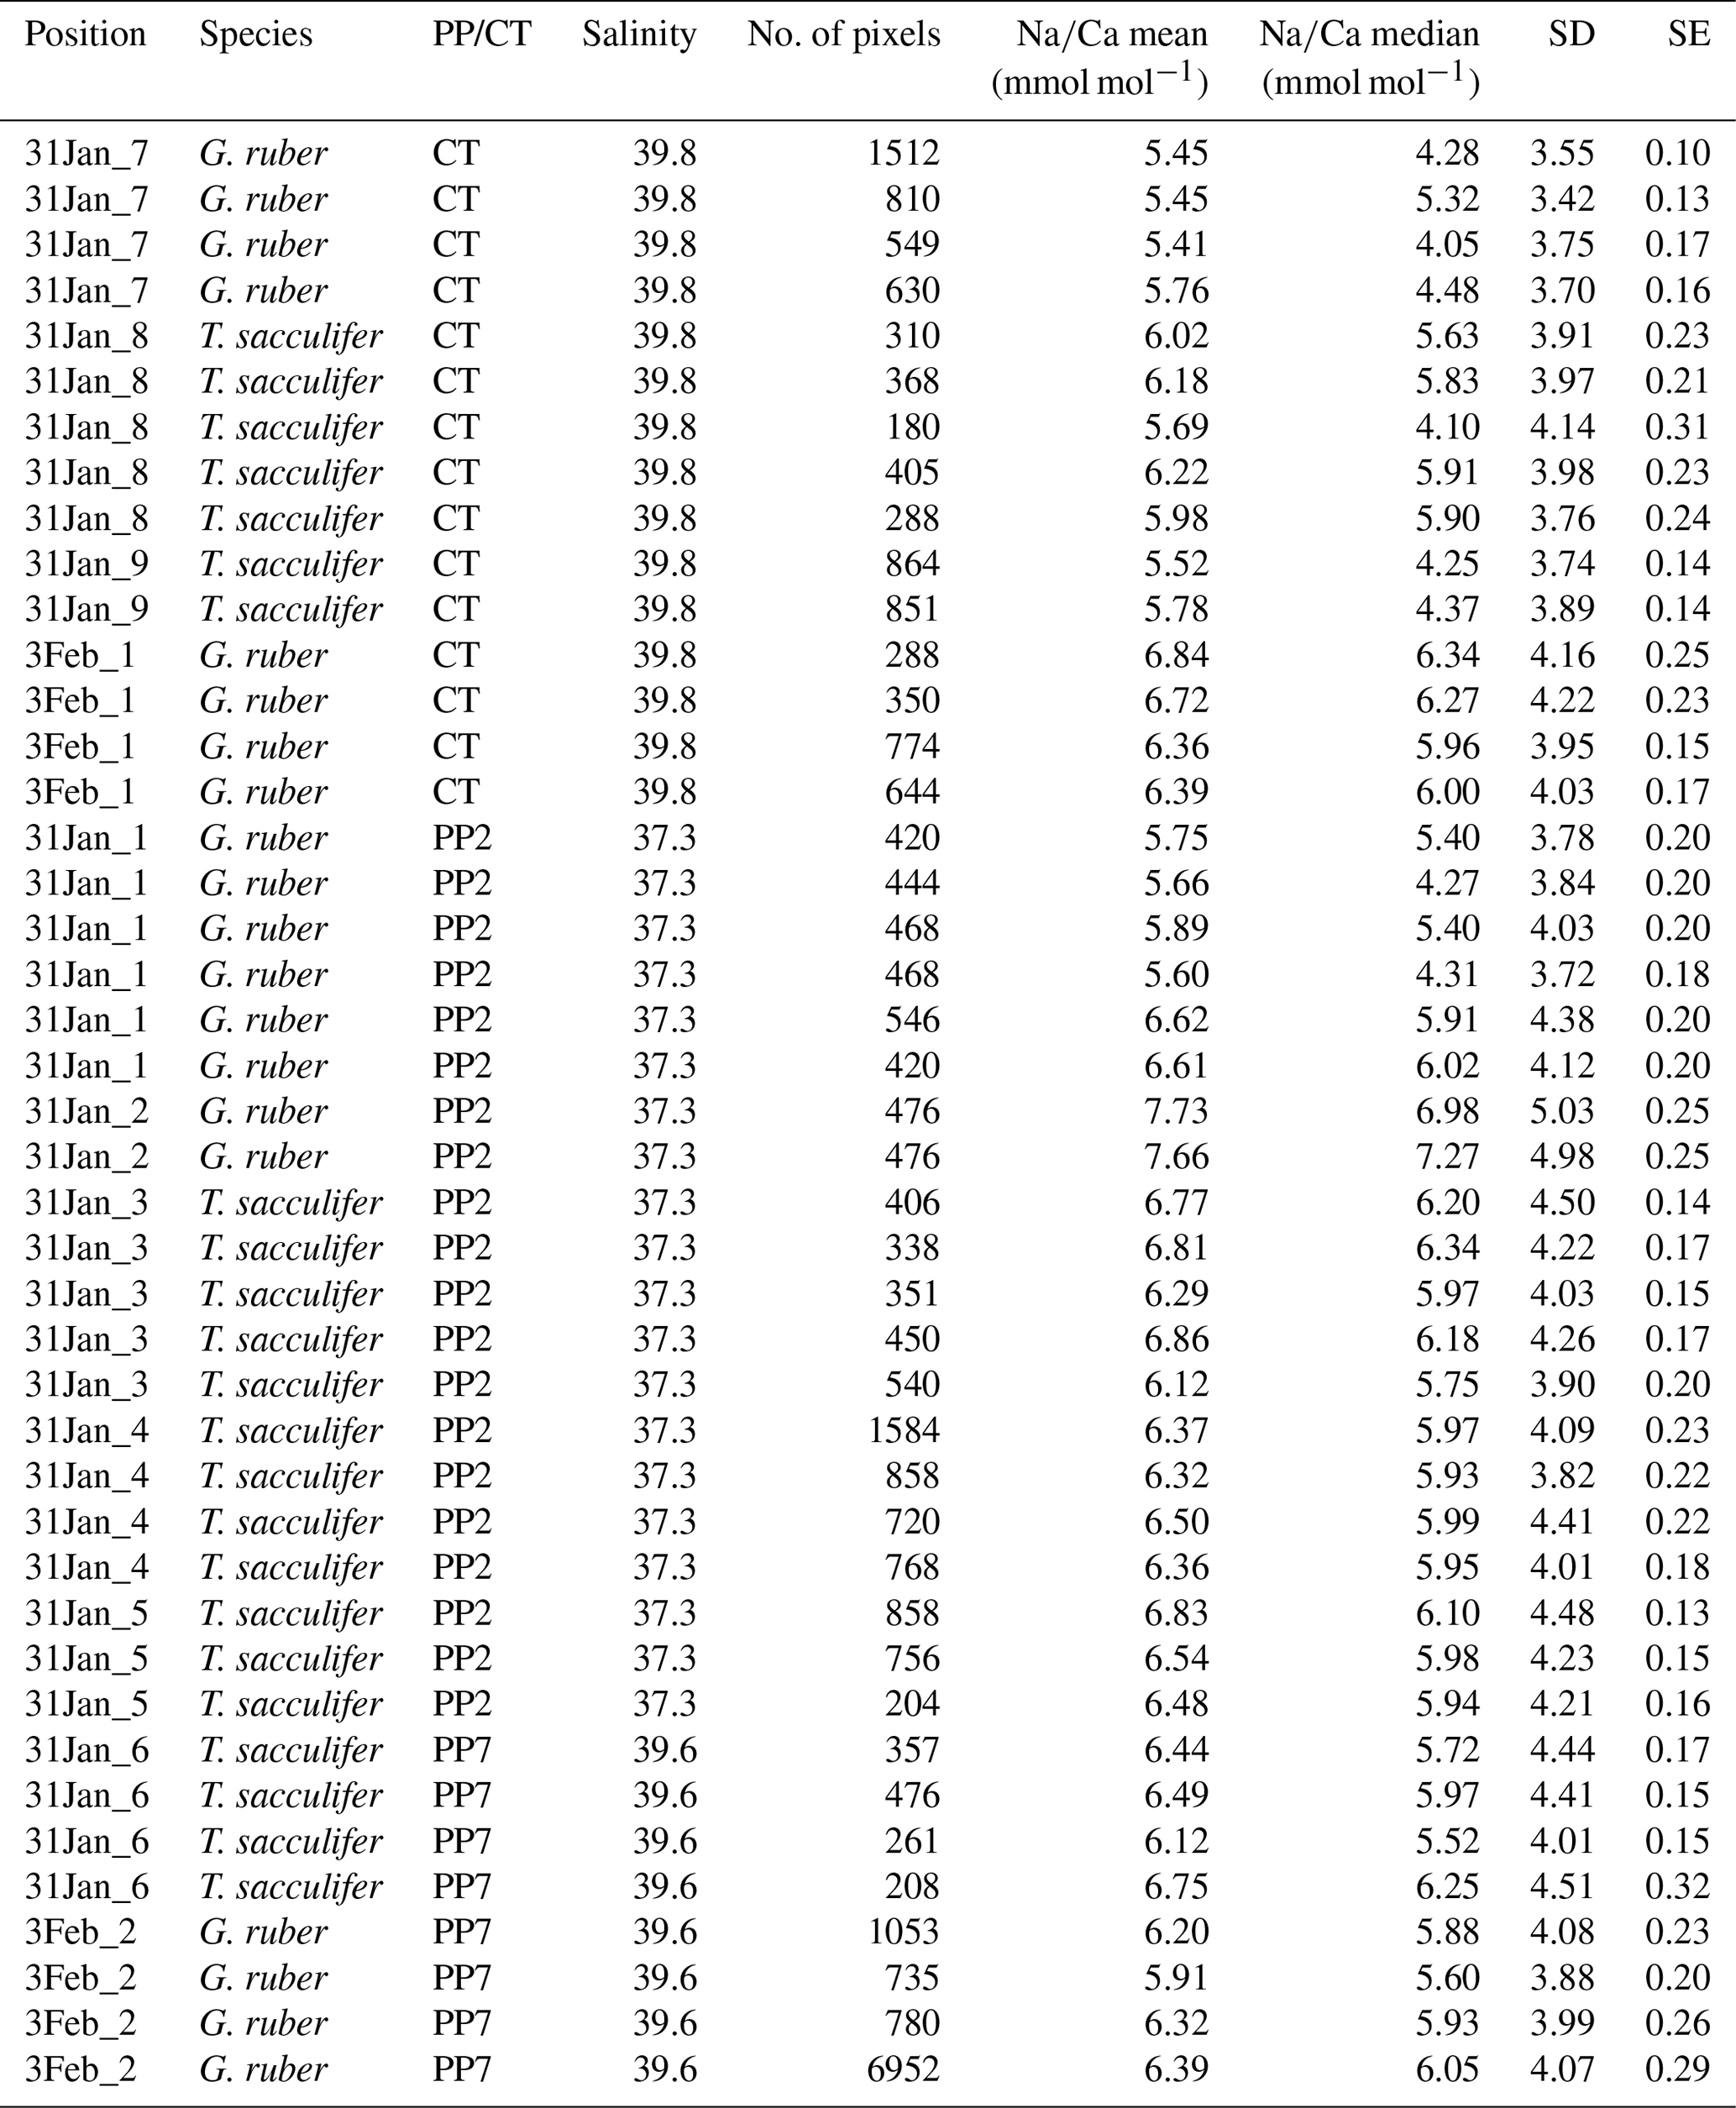
Table 3Overview of multi-net Na∕Ca shell values. Similar superscript numbers indicate that these are measurements from the same specimen.
3.1.2 Spine Na∕Ca
For the multi-net-derived samples we were able to directly measure spine Na∕Ca values on spines sticking out of the shell. Within the spines a considerable variability in Na∕Ca values is observed, but not with a consistent zonation or trend. Spine G. ruber Na∕Ca values for the multi-nets () range from 10±1.3 to 23.5±1.9 mmol mol−1, whereas T. sacculifer Na∕Ca values range from 10.7±0.8 to 24.9±1.9 mmol mol−1. Intra-specimen spine variability is more than 200 % for both G. ruber and T. sacculifer (highest and lowest average spine Na∕Ca values, Tables 4, 5). Spine Na∕Ca values are consistently much higher compared to shell Na∕Ca values (e.g., Fig. 3, Tables 2–5). Comparing shell-based Na∕Ca values with the Na∕Ca values measured on spines for the same specimen, for T. sacculifer spines are 2 to 4.3 times higher and for G. ruber spines are 1.4 to 2.5 times higher (Tables 2–5). No correlation is observed between spine and shell-based Na∕Ca values for neither species.

Figure 3Comparison between spine Na∕Ca values (green columns) and shell Na∕Ca values (blue columns) within the same specimen (specimen 0002_13, T. sacculifer, Table 3) and EPMA-map indicating the regions represented by the histograms (white box: shell; green box: spine). The turquoise color represents the overlap region of the spine and shell histogram (not the spine base). Clearly, spine Na∕Ca values are higher compared to shell Na∕Ca values.
For several specimens we were able to measure both spines and spine bases. The EPMAs show a clear difference in Na∕Ca values between spines and spine bases. The spine bases show values in between the high spine and low shell Na∕Ca values. Still, as the spine bases are surrounded by foraminiferal shell calcite, this possibly results in mixing signals between spine base and shell carbonate due to the resolution of the analyses, which would decrease values for the spine base. Clearly, Na∕Ca values will also depend on the selected cross section analyzed with EPMA. The distribution plots for the spine base Na∕Ca values show a clear difference from the shell-only areas and generally higher values (Supplement Sects. S2 and S3).
Table 4Overview of spine and spine base Na∕Ca values for T. sacculifer multi-nets. Similar superscript numbers indicate that these are measurements from the same specimen.
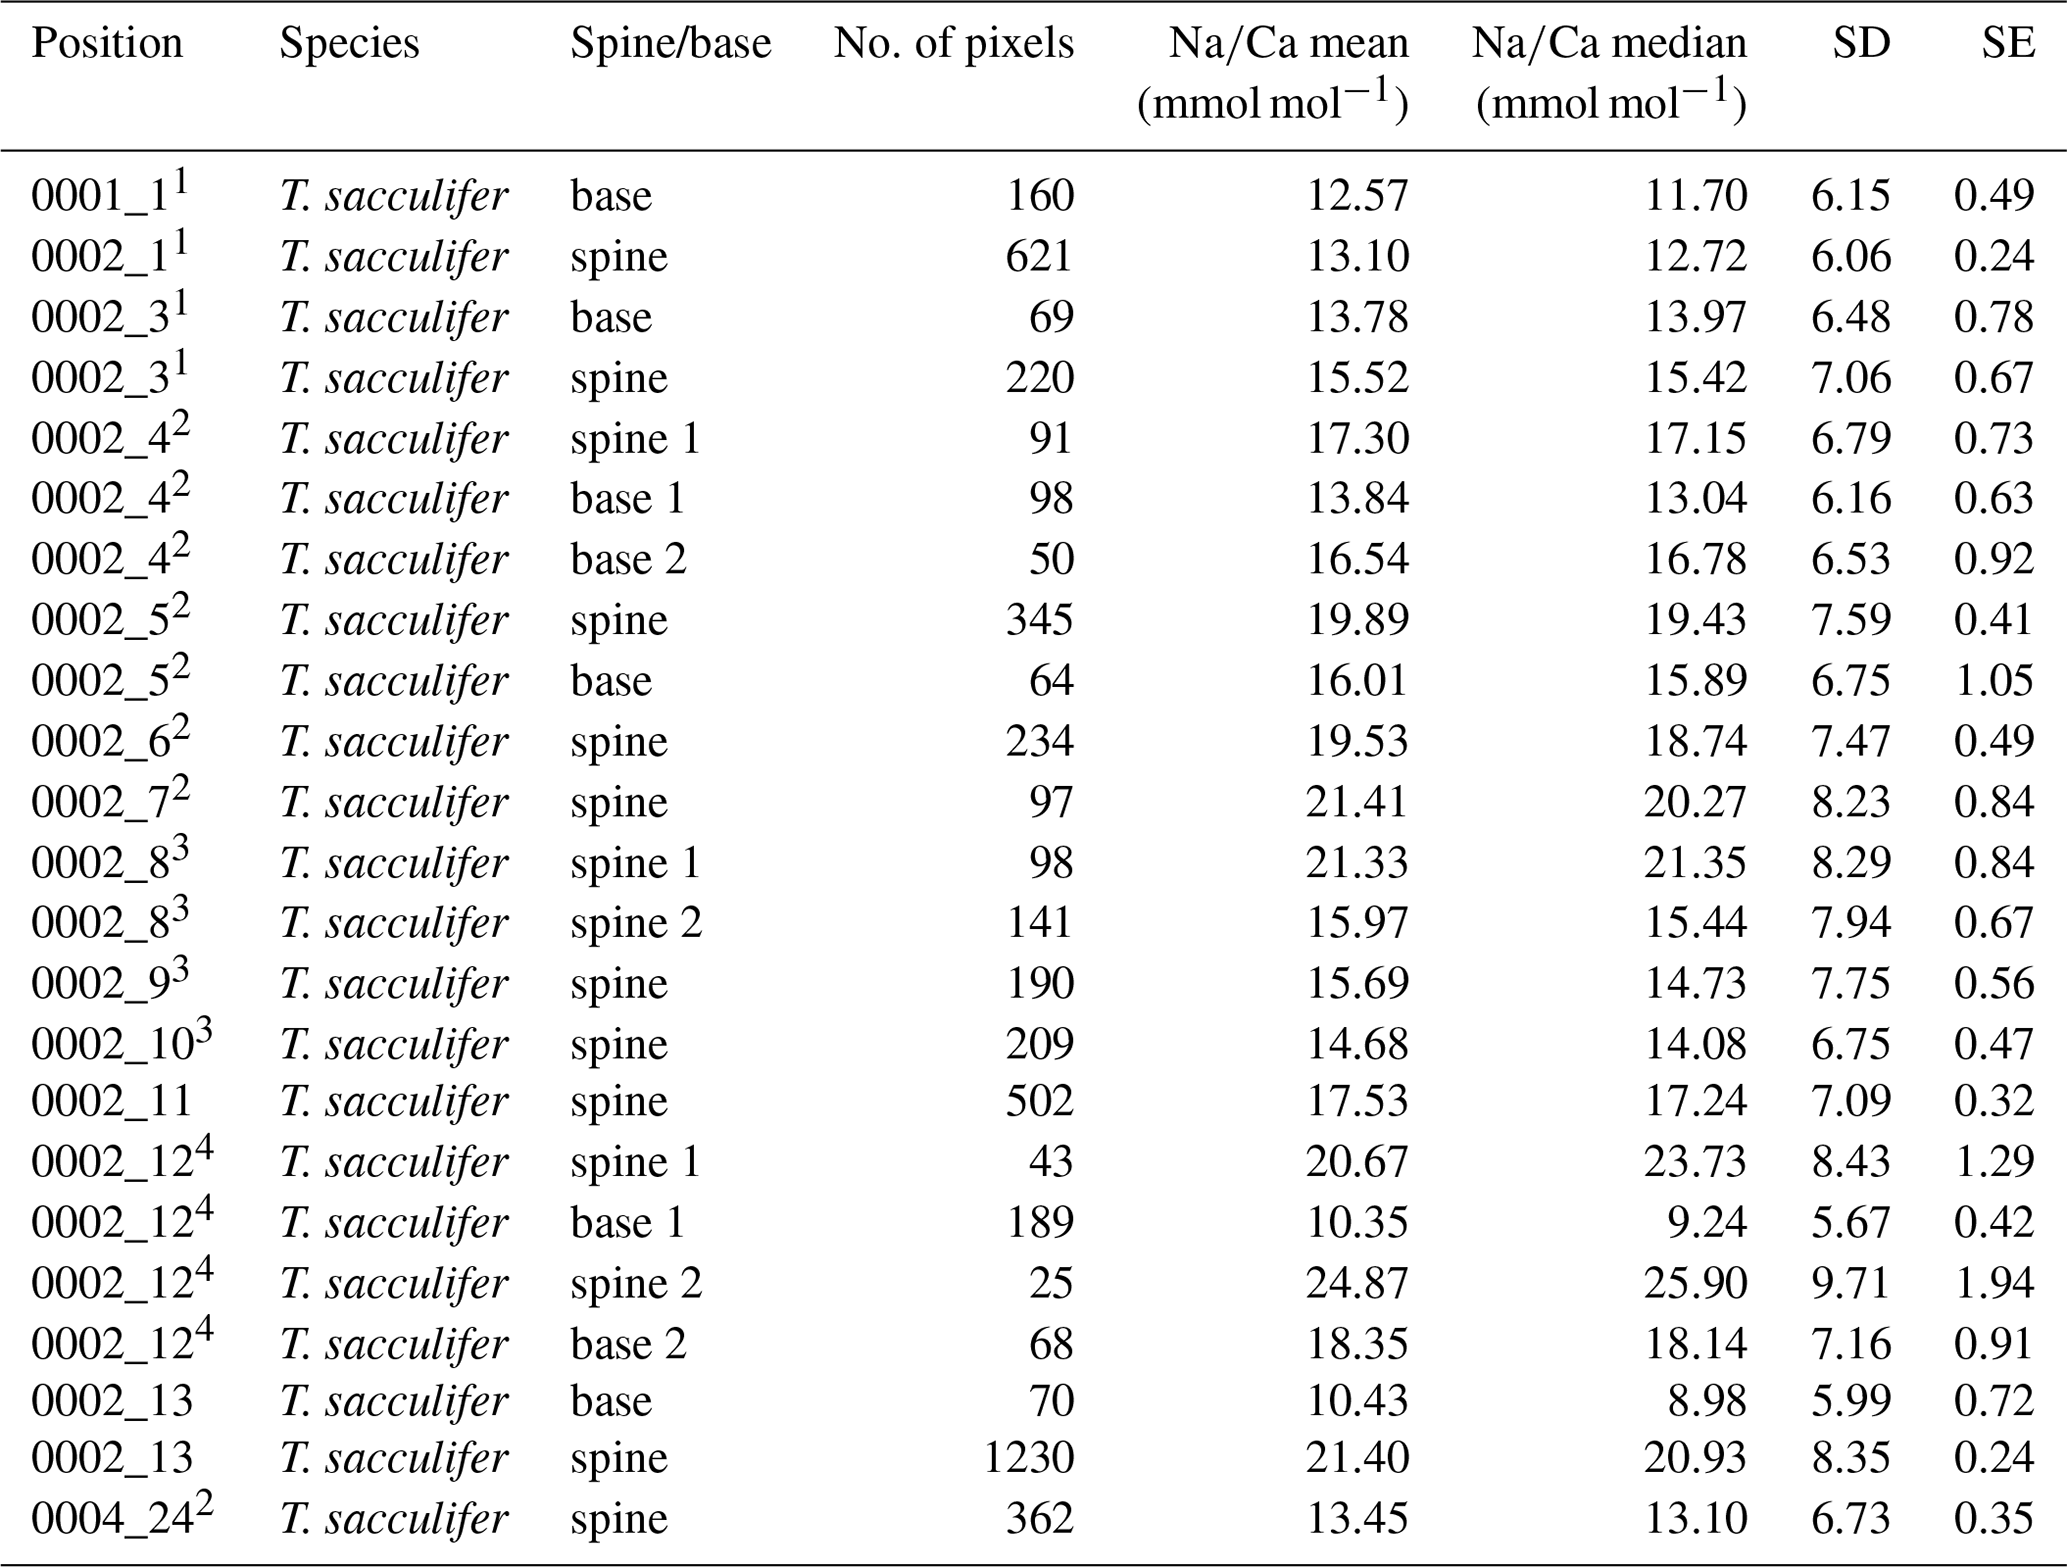
Table 5Overview of spine and spine base Na∕Ca values G. ruber multi-nets. Similar superscript numbers indicate that these are measurements from the same specimen.
3.2 SEM measurements of spine morphology and densities
In total, 125 G. ruber and 38 T. sacculifer specimens were analyzed for their spine widths and spine density at the shell surfaces. In general, the number of spines is higher for G. ruber compared to T. sacculifer, whereas spine thickness is lower (Fig. 4). Spine density varied from 0.09 to 0.30 spines µm−2 for T. sacculifer and from 0.12 to 0.30 spines µm−2 for G. ruber (Fig. 4). Spine widths show a high variability between and within specimens, ranging from 0.89 to 3.96 µm for T. sacculifer and from 0.56 to 3.78 µm for G. ruber. A weak positive correlation is observed for G. ruber and T. sacculifer between spine width and the size of the foraminiferal shell (G. ruber: R2=0.04, p < 0.0001; T. sacculifer: R2=0.04, p=0.004, based on Shapiro–Wilk test; Fig. 4). Spine width correlates negatively with salinity, based on weighted averages of the widths per salinity group for both species (G. ruber: R2=0.35, p < 0.0001; T. sacculifer: R2=0.46, p < 0.0001) (Fig. 4). Furthermore, a negative correlation is observed between Na∕Ca values and spine width (G. ruber: R2=0.016, p=0.006; T. sacculifer: R2=0.03, p=0.006).

Figure 4Results from the SEM spine density and width counts for G. ruber (red closed circles) and T. sacculifer (blue open circles) specimens, with standard errors indicated and enveloped into a 95 % certainty interval, with (a) number of spines versus the size (µm) of the foraminiferal specimen these were counted on, (b) spine width (µm) versus the size (µm) of the specimen these were counted on, (c) number of spines versus salinity, (d) spine width versus salinity, (e) number of spines and the measured whole-shell Na∕Ca composition and (f) spine width versus the measured whole-shell Na∕Ca composition.
A significant negative correlation is observed between foraminiferal shell size and the number of spines for both species (G. ruber: R2=0.17, p < 0.0001; T. sacculifer: R2=0.38, p < 0.0001; Fig. 4). Between salinity and spine density both species show a negative significant correlation (G. ruber: R2=0.24, p < 0.0001; T. sacculifer: R2=0.18, p=0.006; Fig. 4). However, average spine density values for G. ruber are not statistically different for the different salinities and therefore no correlation is observed between salinity and spine density (student t test between data points; p > 0.78 for G. ruber). For T. sacculifer, in contrast, spine density values differ statistically significantly for the highest salinity compared to the other salinities (40.1, p < 0.0375). The lowest salinity for T. sacculifer could not be taken into account for these calculations, because it only consisted of one single data point. No significant correlation is found between Na∕Ca and spine density (G. ruber: R2=0.02, p=0.1; T. sacculifer: R2=0.004, p=0.7).
3.3 Organic linings
The minor and trace elemental composition of the isolated organic linings is similar for T. sacculifer and G. ruber (Table 7). Although concentrations of Na and Mg seem enriched within the isolated organics (Table 7), when calculating their contribution to the whole-shell elemental composition, Na from the linings contributes only 5.61 ppm, or 0.024 mmol mol−1 for G. ruber and 12.03 ppm, or 0.052 mmol mol−1, for T. sacculifer to the whole-shell Na∕Ca. For Mg values the contributions from the isolated linings to the total shell concentration are 37.68 ppm, or 0.16 mmol mol−1, for G. ruber, and 69.25 ppm, or 0.28 mmol mol−1, for T. sacculifer. There is no measurable Ca concentration in the organic linings.
Table 6Overview spine base measurements of cultured and field-collected specimens (Table 1).

Table 7Elemental composition of organic linings calculated for shell weight and estimated elemental composition based on OL weight.

* Average shell Sr∕Ca and Mg∕Ca based on Mezger et al. (2016), shell Na∕Ca based on Mezger et al. (2018).
Shell-only (i.e., spine-free) Na∕Ca values of G. ruber and T. sacculifer, collected in the Red Sea from surface waters, the water column and the sediment surface, all fall within the range of previously established calibrations (Geerken et al., 2018; Allen et al., 2016; Wit et al., 2013) (Fig. 5). Average values reported here are, however, somewhat higher than results from Bertlich et al. (2018). Red Sea sediment surface Na∕Ca values measured by LA-ICP-MS and EPMA from the same specimens compare well (Mezger et al., 2018, Fig. 5). However, for the specimens collected from the sea surface, the EPMA-derived shell-only Na∕Ca values are much lower than those from the LA-ICP-MS analyses (Fig. 5). When measuring whole-shell chemistry using LA-ICP-MS, all different shell components contribute to the signal including the Na-rich spines and spine bases. It is therefore hypothesized that spine loss is responsible for the observed offset in absolute Na∕Ca between specimens from surface water and those from deeper in the water column (Mezger et al., 2018). The fact that the shell-only Na∕Ca values between core-top and surface water specimens are similar confirms this hypothesis (Fig. 5).
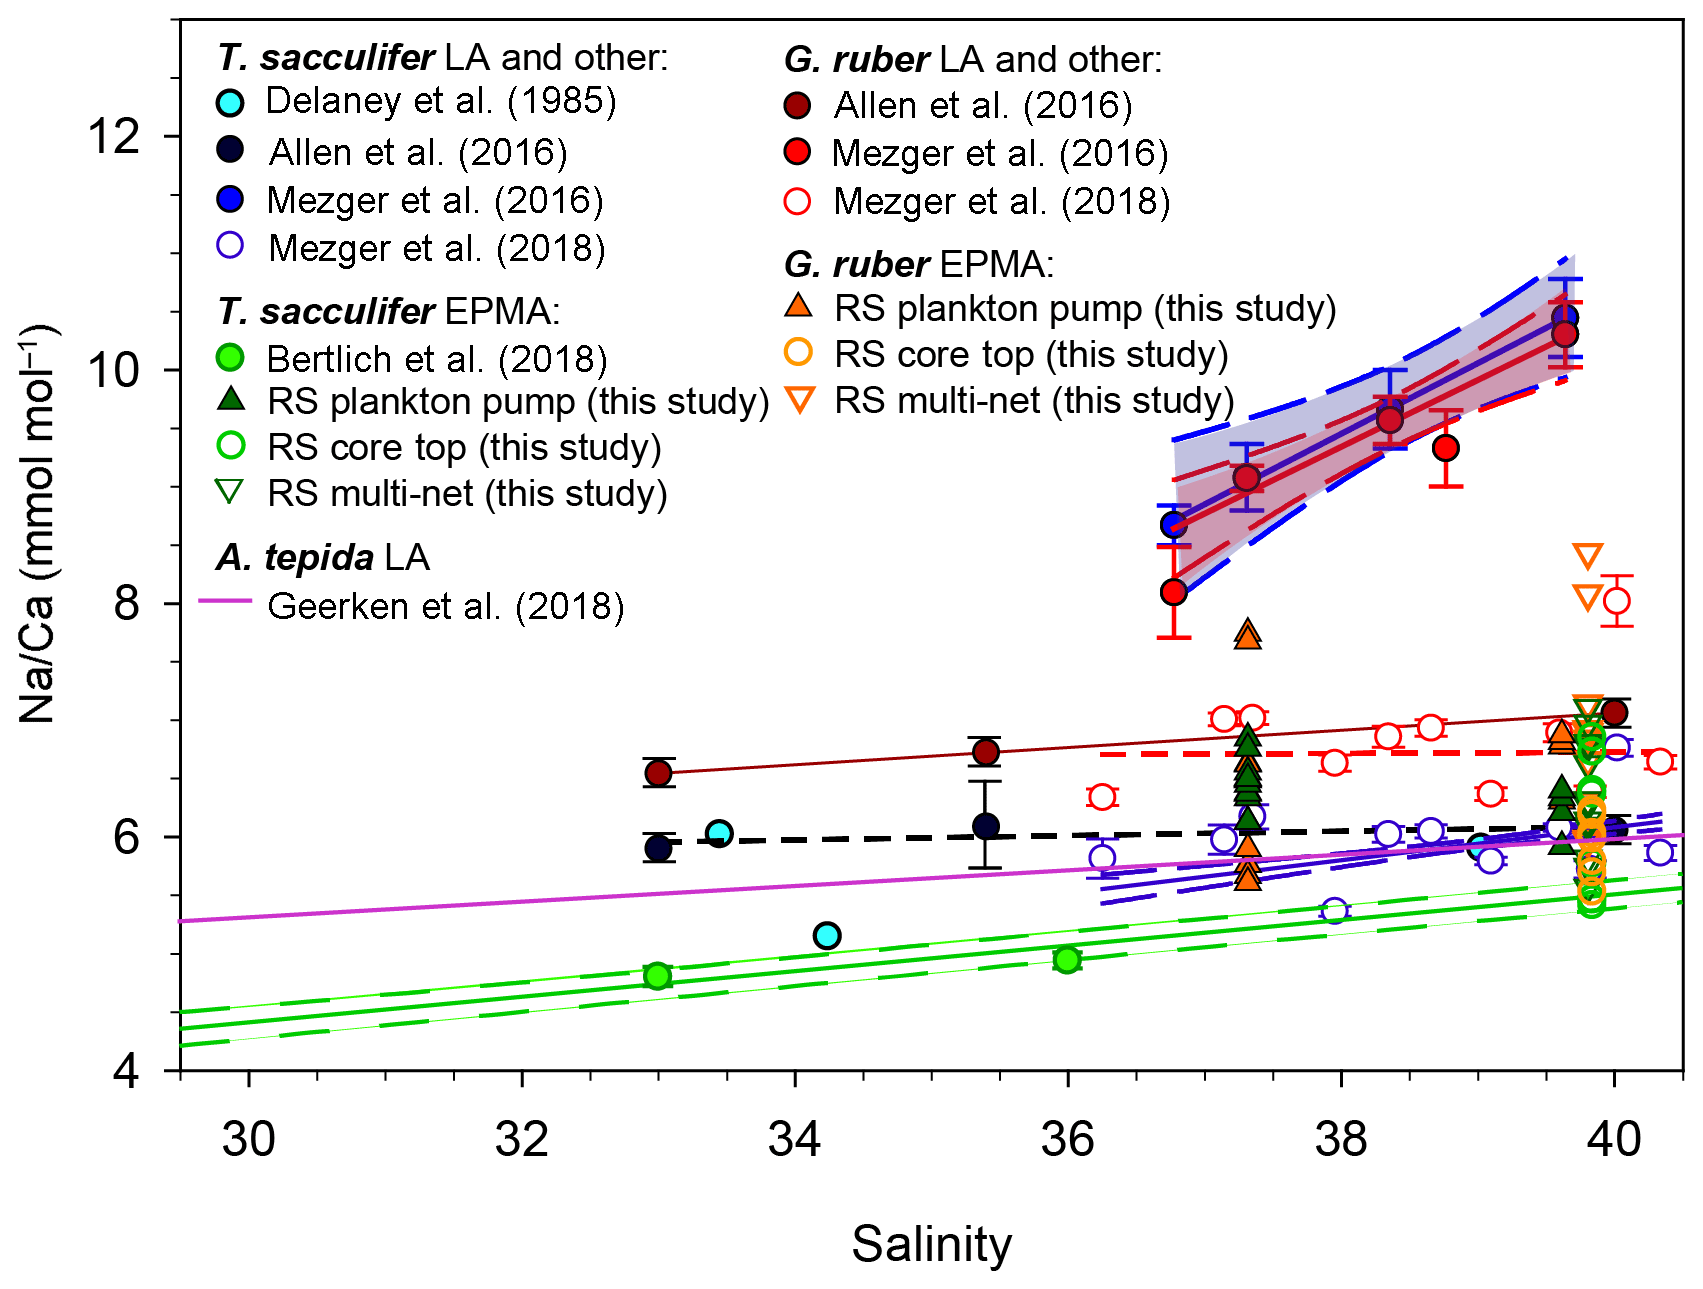
Figure 5Comparison of most existing planktonic foraminifer Na∕Ca-salinity studies, including different culture studies (Allen et al., 2016; Bertlich et al., 2018; Wit et al., 2013; Delaney et al., 1985), a field survey (Mezger et al., 2016, 2018) and a benthic culture study (Geerken et al., 2018) compared to new electron microprobe shell Na∕Ca values of Red Sea plankton pumps, core tops and multi-nets (this study). Distinction had been made between EPMA and laser ablation (LA) measurements, where EPMA measurements refer to shell-only measurements. The shown regressions are associated with the data points in the same color.
Several recent studies showed foraminiferal Na∕Ca values to vary with salinity (Geerken et al., 2018; Wit et al., 2013; Allen et al., 2016; Mezger et al., 2016, 2018; Bertlich et al., 2018) (Fig. 5). The slopes of these calibrations and absolute Na∕Ca values, however, differ between studies (Geerken et al., 2018; Allen et al., 2016; Wit et al., 2013; Delaney et al., 1985; Mezger et al., 2016, 2018; Bertlich et al., 2018). Whereas some offsets may be due to inter-species differences, potentially also caused by variability of morphospecies and genotypes (e.g., Schiebel and Hemleben, 2017; Steinke et al., 2005), other offsets reflect variability within one species. Whereas potential differences in Na incorporation between different morpho- and genotypes require further study, studies focusing on intra-shell variability in Na∕Ca have shown that there are also large differences in Na∕Ca within single shells (Branson et al., 2016; Geerken et al., 2018; Yoshimura et al., 2017; Mezger et al., 2018). Therefore, part of all this variability may be explained by uneven contributions of various parts of the foraminiferal shell, which means that the Na∕Ca composition of these parts needs to be determined independently. This allows the calculation of relative contributions of different parts of the shell to the whole-shell Na∕Ca composition from previous studies. Based on suggestions made before, we focus here on the contribution of organic linings, spines and spine bases to the overall Na composition of the foraminiferal shell.
4.1 Organic linings
Using TOF-SIMS and an atom probe, Branson et al. (2016) found Na concentrations to be enriched at foraminiferal spine bases and in (the proximity of) the organic linings. Values in the enriched areas appear approximately 1.3 times higher compared to the shell in Orbulina universa (Branson et al., 2016). Geerken et al. (2018) discovered that Na preferentially occurs in bands with concentrations 1.1–1.75 times higher compared to the surrounding layers with lower Na∕Ca values. These bands seem to coincide with Mg-rich bands, which have previously been linked to the proximity of organic linings (Branson et al., 2016; Geerken et al., 2018). Although this coincidence suggests that high Na is indeed linked to the organic calcifying matrix, the values measured on the isolated linings also indicate that their relative contribution to the overall shell Na∕Ca is negligible (Table 7). Still, the higher concentrations of these linings might explain (part of the) observed banding pattern, as the absolute concentration within the linings is similar to or higher than that of the shell carbonate. One potential pitfall of the method used here for isolating the organic linings is that minor and trace metals adsorbed and/or loosely bound to the organic linings could have been removed during the rinsing phases of the isolation.
When not directly related to the organic layers, zones of high Mg and high Na may be indirectly coupled via processes responsible for the banding. For planktonic species, chamber formation (usually at night) may be responsible for the observed banding (Fehrenbacher et al., 2017; Spero et al., 2015). Here banding in Na is only reported in one EPMA image, but not conclusive in other maps (e.g., Fig. 1, Supplement Sect. S2, specimen 31-4). Furthermore, the visual absence of organic linings in the EPMA images from this study is most likely due to the relatively low contribution (0.4 %–0.7 %) of the organic linings for these species to the total shell weight. Potentially the expression of banding is also related to the absolute Na concentrations of the shell, as banding in Ammonia tepida (lower in Na) was less pronounced than in Amphistegina lessonii (Geerken et al., 2018). Accordingly, the banding in planktonic foraminifera may also be less pronounced and hence not detectable within our approach. Irrespective of this, the relative contribution of these bands can be considered minor in comparison with the other zones of high Na∕Ca values such as the spines and spine bases, which are also clear within the limited resolution of our analytical approach.
4.2 Unraveling spines and spine base Na∕Ca
Several studies showed that Na∕Ca in foraminiferal shells is not homogeneously distributed but is present at higher concentrations in bands and also at the (bases of) spine(s) (Branson et al., 2016; Mezger et al., 2018). Accordingly, Na hotspots at spines and spine bases were selected to quantify Na∕Ca values and compare these values with Na∕Ca measured on shell-only areas. Furthermore, the preservation state of spine bases were studied, as these might still partially remain after spine shedding processes (Bé, 1980).
Spines sticking out of the shell showed Na∕Ca to be consistently much higher than shell Na∕Ca values from the same specimens. Spine base regions were selected based on backscattered and secondary electron images (Supplement Sects. S1–3). Analyses from spine base areas, however, are likely influenced by mixing with lower Na∕Ca values from adjacent regions. During EPMAs, the electron beam excites both areas/volumes in the region close to the interface between spine base and surrounding low-Na shell calcite. Moreover, EPMAs target a 2-D surface, whereas the spine is not necessarily oriented parallel to the sampling surface. Hence, in three dimensions variable amounts of spine-base related carbonate is also analyzed during EPMA. Furthermore, due to its conic shape, spine thickness decreases towards the edges of the spine, as well as within the spine base. The sampling volume and pixel size together determines the obtained spine and spine-base Na∕Ca signal. Therefore, the center of the spine – being the thickest and probably least affected by the polishing process – most likely reflects true spine base Na∕Ca values. To estimate these signals, a mathematical approach was used in which we narrow the area perpendicular to the center of the spine base for determining the Na∕Ca (Figs. 6, S3). Narrowing the width of the spine base sampling area results in increasing Na∕Ca values until they approach a plateau, which is assumed to reflect the true spine base Na∕Ca value (Figs. 6a, b, S3). When no plateau is observed, e.g., the analyzed cross section is too small, true Na∕Ca may remain unknown (Fig. 6a). Conversely, when increasing the width of the region used for calculating average values, values converge towards the shell values signal (Fig. 6a, b). As a result of decreasing the area used for calculating the average Na∕Ca, standard errors increase (Fig. 6a, b).
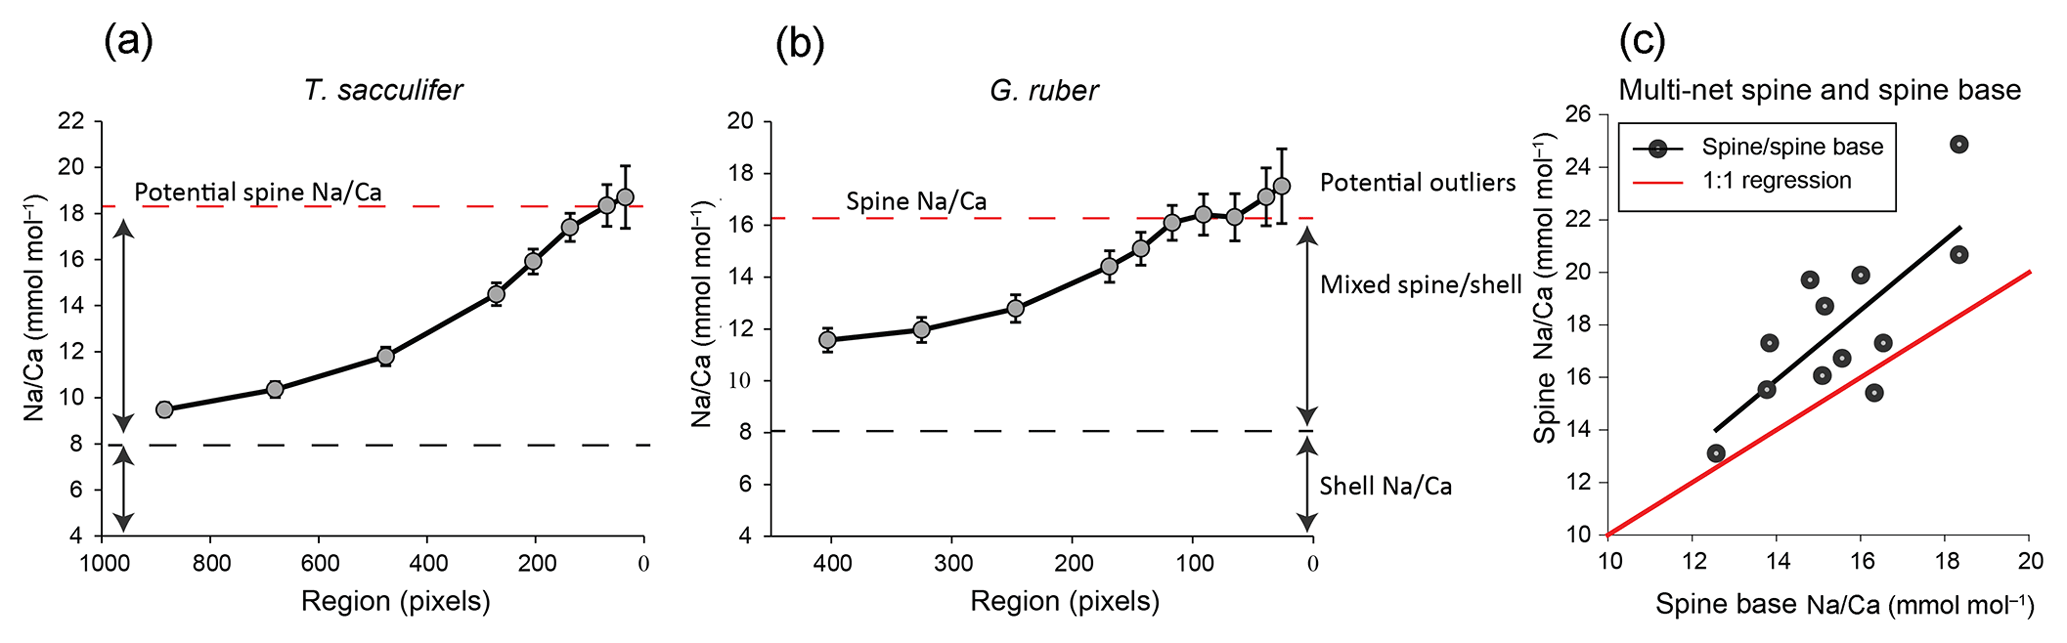
Figure 6Examples of results of our spine-base quantification method, with (a) example of the quantification of a spine base (T. sacculifer, 2_12_multinet, Table 3), (b) similar for G. ruber, (4_13_multinet, Table 4). The smaller/narrower the selected region, the higher the Na∕Ca values, resulting from confining the analysis to the core of the spine. Due to the decreasing sampling volume, standard errors also increase. Panel (c) shows the spine Na∕Ca values measured, versus the spine base Na∕Ca obtained with the method described in Sect. 6, Fig. S3 and Sect. 4.2. For panel (a) the word “potential” is used, as no plateau Na∕Ca value is reached.
Based on our quantification approach, spine base Na∕Ca values for the water-column-collected specimens range from 12.6 to 18.4 mmol mol−1 for T. sacculifer and from 15.0 to 16.1 mmol mol−1 for G. ruber (Table 4–6). Part of the variability in spine base Na∕Ca values might be explained by differences in spine morphotypes (Schiebel and Hemleben, 2017), although by far most spines seem to have a rounded cross section. Still, more research would be needed to investigate a potential effect of spine morphotype on Na incorporation. Compared to Na∕Ca values of the spines from the same specimens, spine base values are 4 % to 35 % lower (Fig. 6c). Although this offset is consistent and considerable, it cannot be excluded that it is primarily caused by the fundamental complication of estimating Na∕Ca values in the spine bases. Whereas the spine bases are surrounded by low Na∕Ca carbonate, spines are surrounded by the embedding material only, which does not affect the analyses. For the spine bases of specimens of the Red Sea surface water, sediment surface and cultured T. sacculifer specimens, Na∕Ca values vary from 9.6 to 20 mmol mol−1, with averages being consistently lower compared to laser-ablation-measured spines (Mezger et al., 2018) and parts of the spines still sticking out after embedding, measured here with EPMA (Fig. 6c, Table 6).
The relatively high concentration of Na in spines and spine bases may be attributed to relatively fast growth rates compared to shell carbonate. Inorganic precipitation experiments suggest that growth rate enhances incorporation of most minor and trace metals, including Na (Busenberg and Plummer, 1985). Moreover, analogous to spine formation in sea urchins, an amorphous precursor may be responsible for the prismatic shape of the foraminiferal spines, which rapidly transforms into calcite (Beniash et al., 1997). Such a precursor phase has also been shown by Jacob et al. (2017) to occur during foraminiferal shell calcification, with formation of vaterite. They also suggest that an amorphous precursor may have been present in two planktonic foraminiferal species (Jacob et al., 2017). Such an amorphous calcium carbonate likely contains much more minor and trace elements, although a subsequent phase transformation from amorphous calcium carbonate (ACC) to calcite (potentially via vaterite) would still affect element incorporation (Littlewood et al., 2017). Interestingly, this would not only influence Na incorporation, but also most other minor and trace metals. Application of foraminiferal trace metals for proxy reconstructions should, therefore, also address the potential effect of differences in spine chemistry.
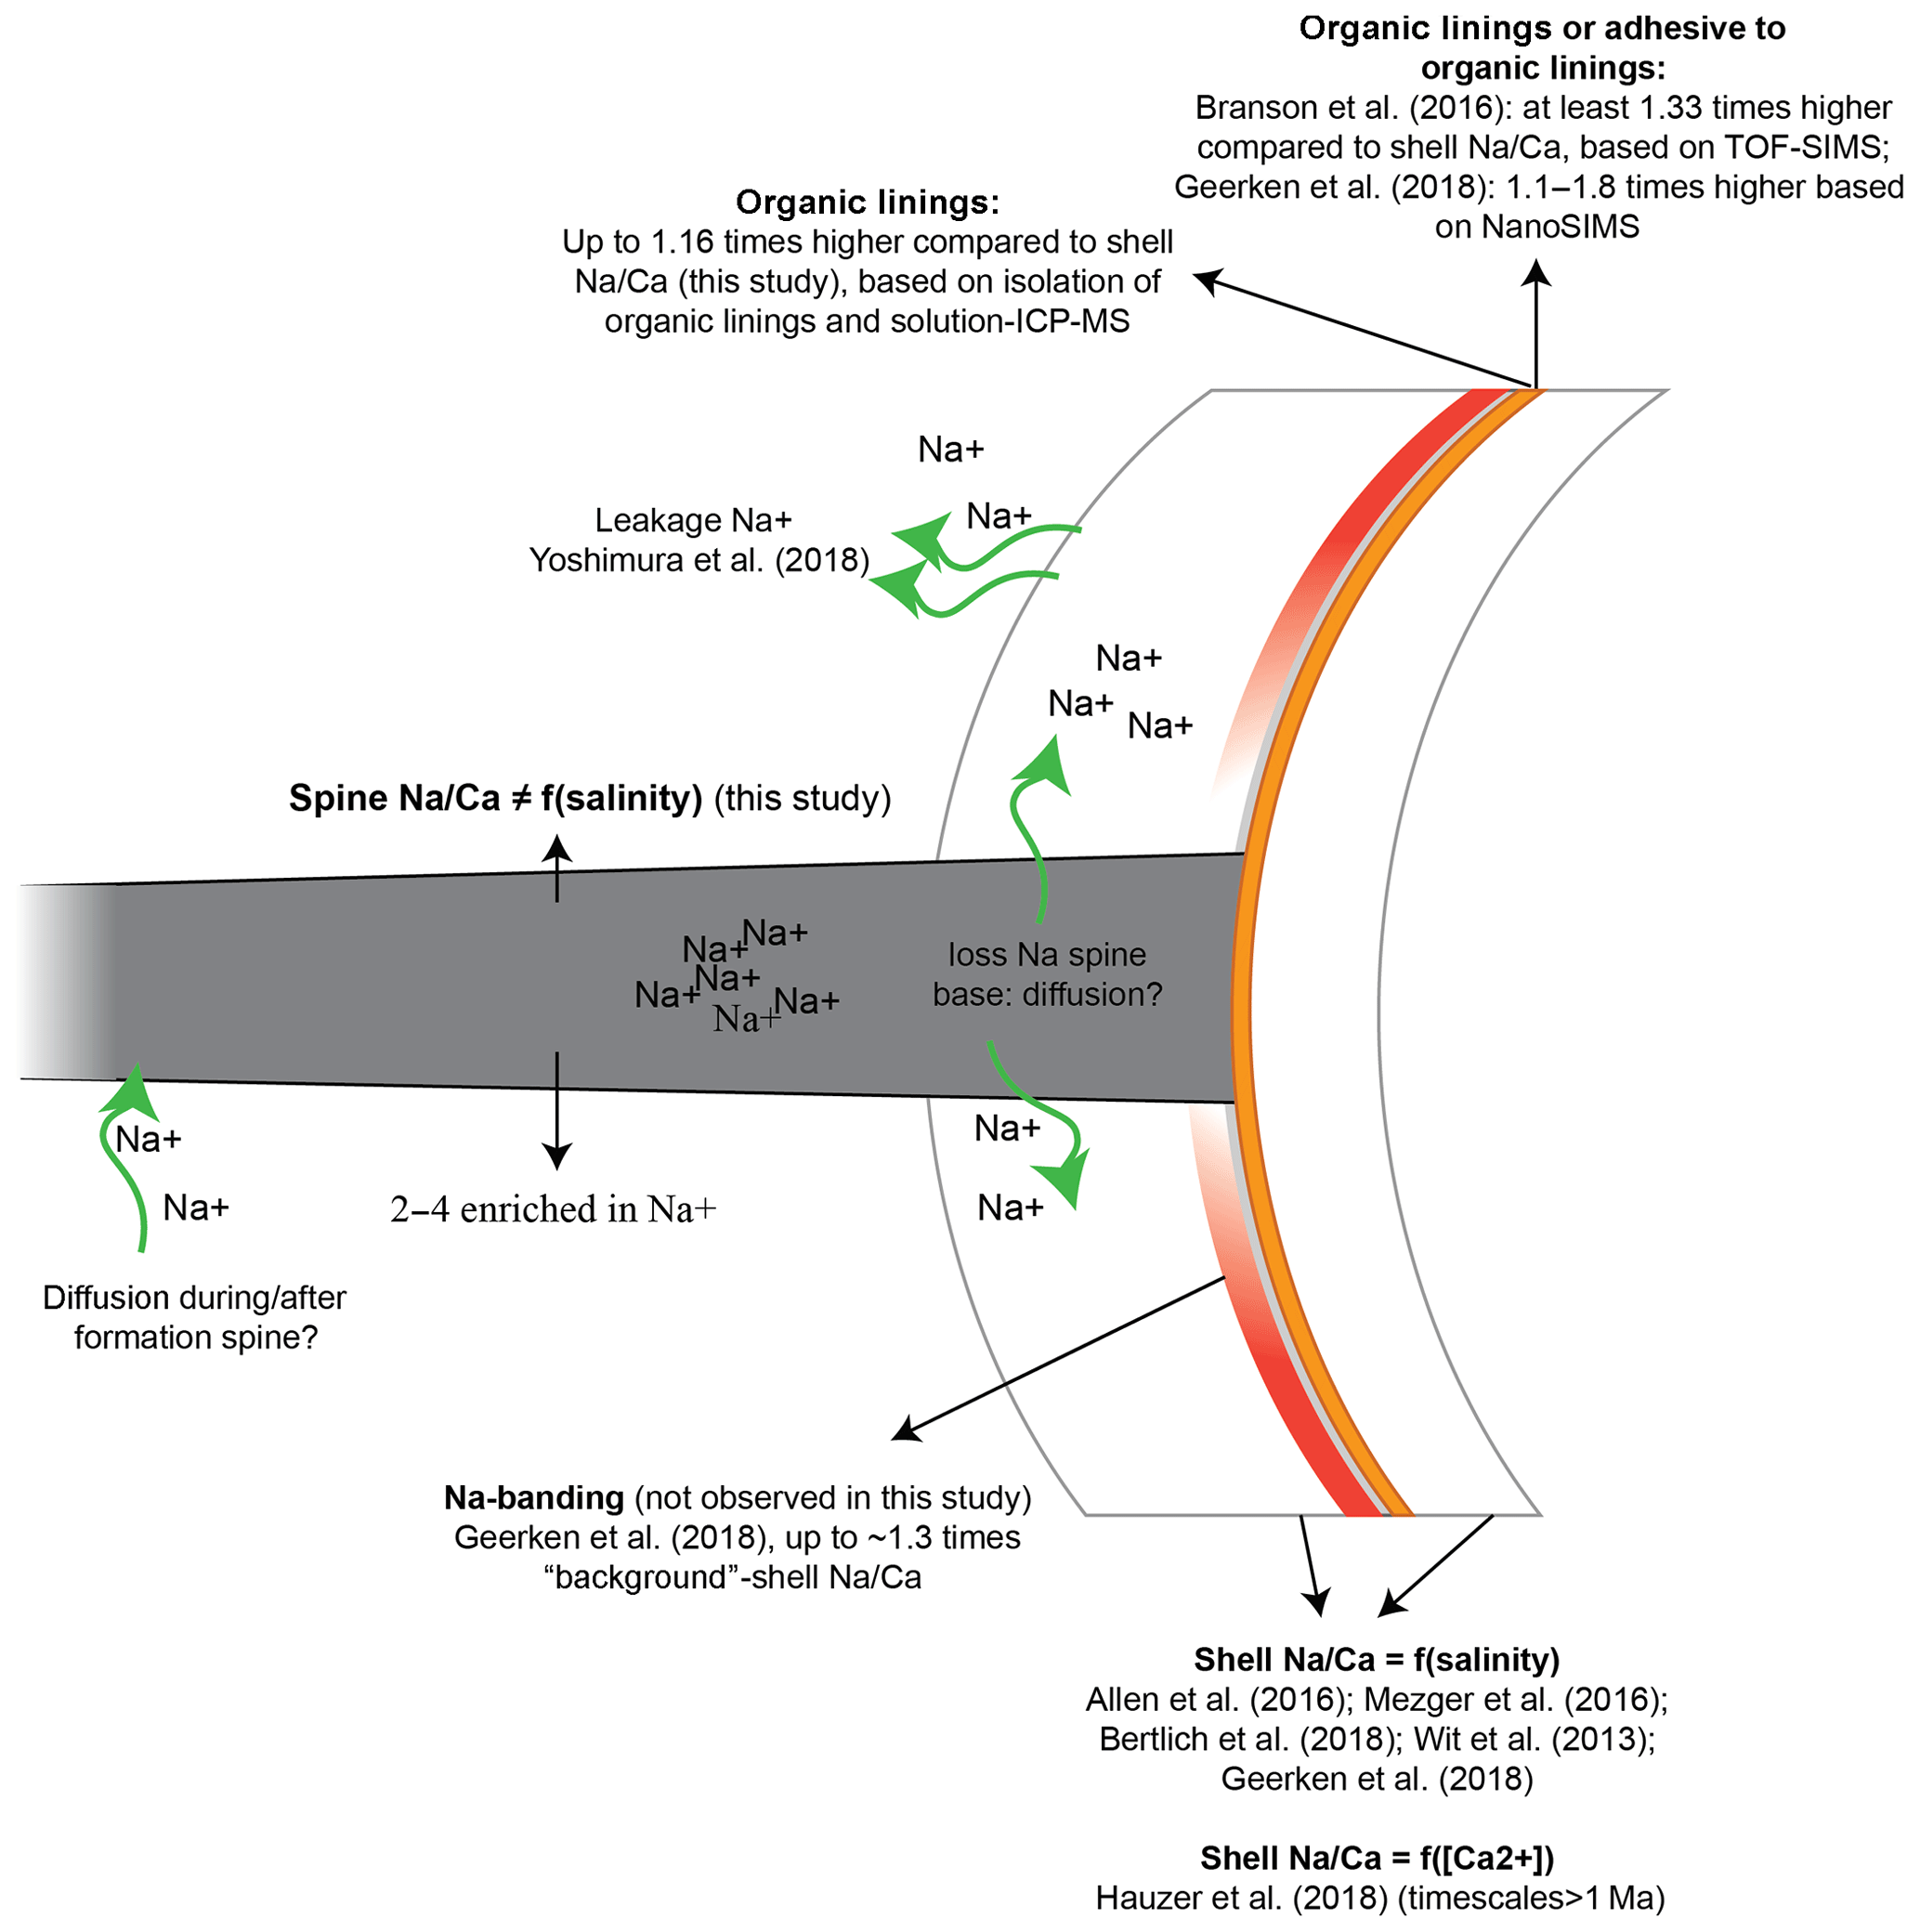
Figure 7Potential processes influencing the Na∕Ca composition of the shell, spines and organic linings. Na from spines may be transported to the surrounding seawater or into the adjacent calcite with a relatively low Na∕Ca. The latter may be difficult to distinguish from mixing of material from the spine and that of the low-Na∕Ca calcite.
Foraminiferal shell, spine (base) and organic linings differ in Na composition, potentially due to leakage (Yoshimura et al., 2017), banding (Branson et al., 2016; Geerken et al., 2018), diffusion or adhesion and may vary as a function of salinity (Allen et al., 2016; Geerken et al., 2018; Mezger et al. 2016, 2018; Wit et al., 2013) or calcium concentration of the seawater (Hauzer et al., 2018) (Fig. 7). The consistently lower Na concentration of the spine base compared to the actual spines suggests a gradual transition from low-Na∕Ca of the shell calcite to the high Na∕Ca of the spine (Figs. 6c, 7). Although our approach does not allow an analytical bias to be fully excluded, alternatively leakage or diffusion of Na from the high-Na spine base to the low-Na shell through time (Yoshimura et al., 2017) could also explain (part of) the observed intermediate values (Fig. 7). The spine would not be affected, or could even have higher Na concentrations, as Na diffusion from seawater into the spine after or during spine formation could increase the Na content of the spine. This would increase the observed gradient of the shell and spine base to the spine concentration but not influence the average whole-shell Na composition. Using synchrotron X-ray spectroscopy, Yoshimura et al. (2017) found that Na incorporation is associated with substitution for Ca in the calcite lattice. This is in contrast to what was proposed earlier, by Ishikawa and Ichikuni (1984) for example, and with the charge difference between Na+ and Ca2+ being compensated by the creation of vacancies (Yoshimura et al., 2017). These vacancies in the crystal lattice result in weaker calcite lattice spots at the locations of Na incorporation, facilitating leaching of Na from the calcite crystal on geological timescales (Yoshimura et al., 2017). However, in this study the Na∕Ca composition of the foraminiferal shells (shell-only) of the same species (Red Sea water column and core tops, as well as cultured specimens) were found here to remain similar (Fig. 5), implying no appreciable Na exchange on these relatively short timescales (thousands of years). Still, it is not clear whether the spines, with relatively high Na concentrations and hence weak calcite lattice spots and a large surface-to-volume ratio, have been affected.
4.3 Consequences of differences in spine and shell chemistry
The differences in Na∕Ca between spine, spine base and shell-only carbonate can potentially explain differences observed between calibrations (Mezger et al., 2018; Fig. 5). Differences between calibrations are observed in absolute Na∕Ca concentrations and also between the slopes as a function of salinity (Mezger et al., 2016, 2018; Bertlich et al., 2018; Allen et al., 2016). When spines fully account for the observed difference in both slopes and absolute Na∕Ca values between, for example, the cultured T. sacculifer, measured shell-only with EPMA (Bertlich et al., 2018), and planktonic foraminifera with spines (Fig. 5, Mezger et al., 2018), this implies that either Na∕Caspines must increase with increasing salinities and/or the relative contribution of spine carbonate to the integrated whole test signal must increase with increasing salinity (Fig. 8). In the case of the latter explanation this could be due to relative changes in spine density, thickness and/or length compared to the thickness of the shell wall (Fig. 8).
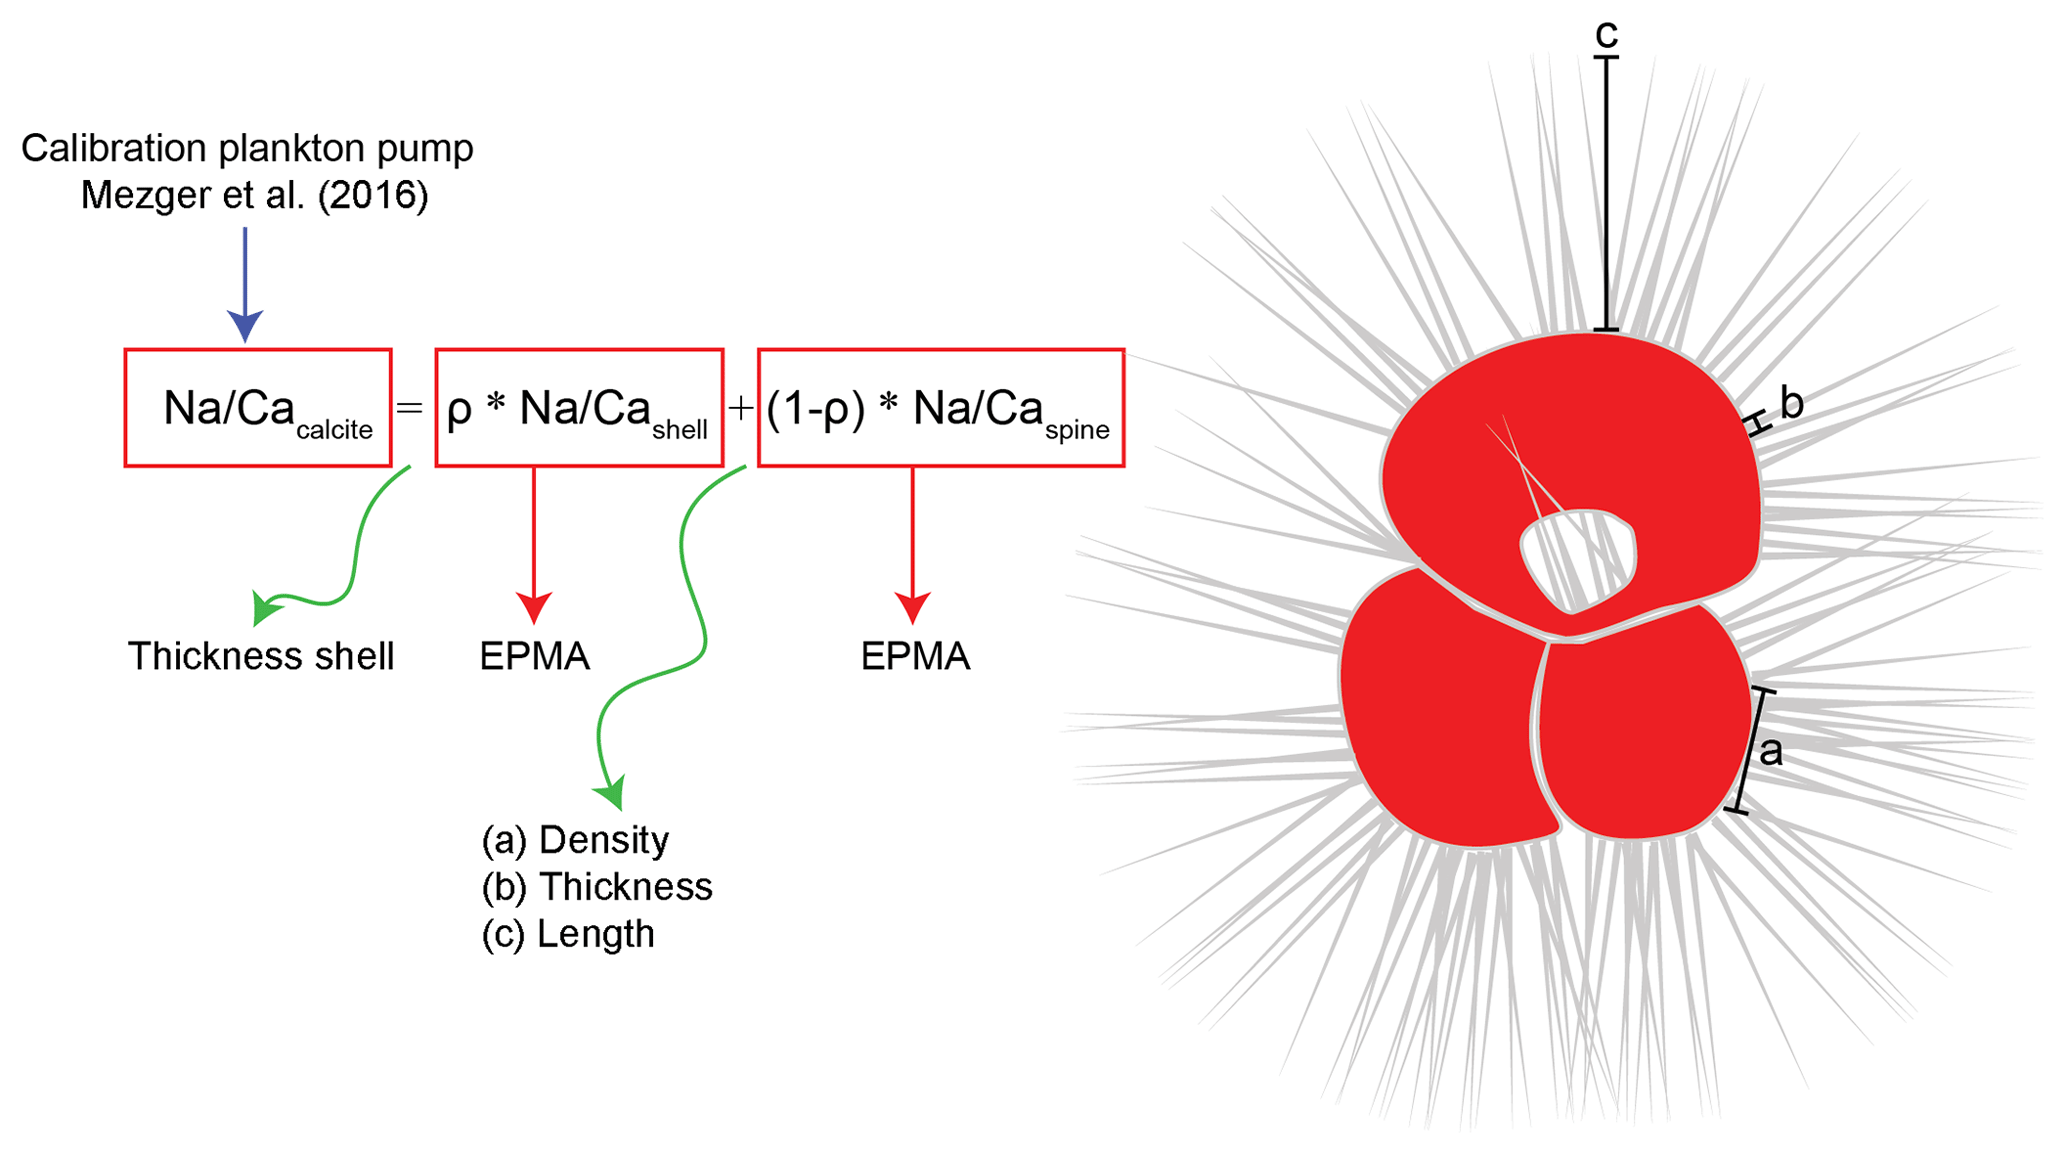
Figure 8General mass balance model combining the relative contribution (ρ) of spine (Na∕Caspine) and shell calcite (Na∕Cashell) Na∕Ca values to explain the whole-shell (Na∕Cacalcite) Na∕Ca values measured. The relative contribution of shell calcite depends on the shell thickness relative to the number of spines, whereas the relative contribution of spines depends on spine density, thickness and length. The Na composition of the individual shell parts was measured with EPMA, and the total shell Na∕Ca values are derived from laser ablation measurements on specimens still containing shell and spines (Mezger et al., 2019). Spines could be up to 2–3 mm long and are therefore not shown in their true scale in this image.
Average Na∕Ca calcite compositions of whole foraminiferal specimens reflect the relative contributions of Na∕Ca in shell calcite (ρ) plus the contribution of Na∕Ca in spine calcite (1−ρ) (Fig. 8). To determine the contribution of spines to the total Na∕Cacalcite (whole-shell Na∕Ca) (Fig. 6), chamber-specific LA-ICP-Q-MS Na∕Ca values from Red Sea surface-water-collected T. sacculifer and G. ruber specimens (Mezger et al., 2016) are compared to the Na∕Ca composition of shell-only EPMA-measured cultured T. sacculifer (Bertlich et al., 2018). Because the spines of surface-dwelling foraminifera are still largely intact, the difference in absolute values and the slope between these calibrations allows the calculation of the relative contribution of spine-bound Na to whole-shell Na∕Ca values (Figs. 5 and 8). To compare the exponential calibrations of G. ruber and T. sacculifer, the calibration of Bertlich et al. (2018) was extrapolated with an exponential calibration. The relative contribution of spines to the total Na∕Ca, based on LA-ICP-MS-measured spine Na∕Ca at a salinity of 39.6 (27.5 mmol mol−1 Na∕Ca for G. ruber and 28.5 mmol mol−1 for T. sacculifer, Mezger et al., 2018) as well as EPMA-based spine Na∕Ca at a salinity of 39.8 (on average 15.6 mmol mol−1 Na∕Ca for G. ruber and 16.9 mmol mol−1 for T. sacculifer), was calculated based on the following equations.
This suggests a relative spine and spine base contribution from 20.8 % (exp) to 19.75 % (lin) for G. ruber and from 20.63 % (exp) to 19.82 % (lin) for T. sacculifer. However, when calculating the relative spine contribution from EPMA-based spine Na∕Ca values, the relative spine contribution ranges from 46.7 % (exp) to 43.3 % (lin) for G. ruber and from 42.83 % (exp) to 42.93 % (lin) for T. sacculifer, which seem unrealistically high. To calculate the Na∕Caspine based on a constant ρ for different salinities (Fig. 8), the following equation is used.
Based on these calculations, LA-based spine Na∕Ca values should increase 1.4 to 2.1 times for G. ruber (linear to exponential), and for T. sacculifer 1.4 to 2.2 times (linear to exponential) within a natural salinity range from 30 to 40 to account for the difference in absolute values between studies (Fig. 9). Alternatively, the Na concentration of spines (1−ρ) changes with increasing salinities (Eq. 3), from 8.6 % to 21.6 % or 19.9 % to 27.8 % for G. ruber (exponential and linear) and from 7.9 % to 21.4 % or 13.4 % to 20.1 % for T. sacculifer (exponential and linear).
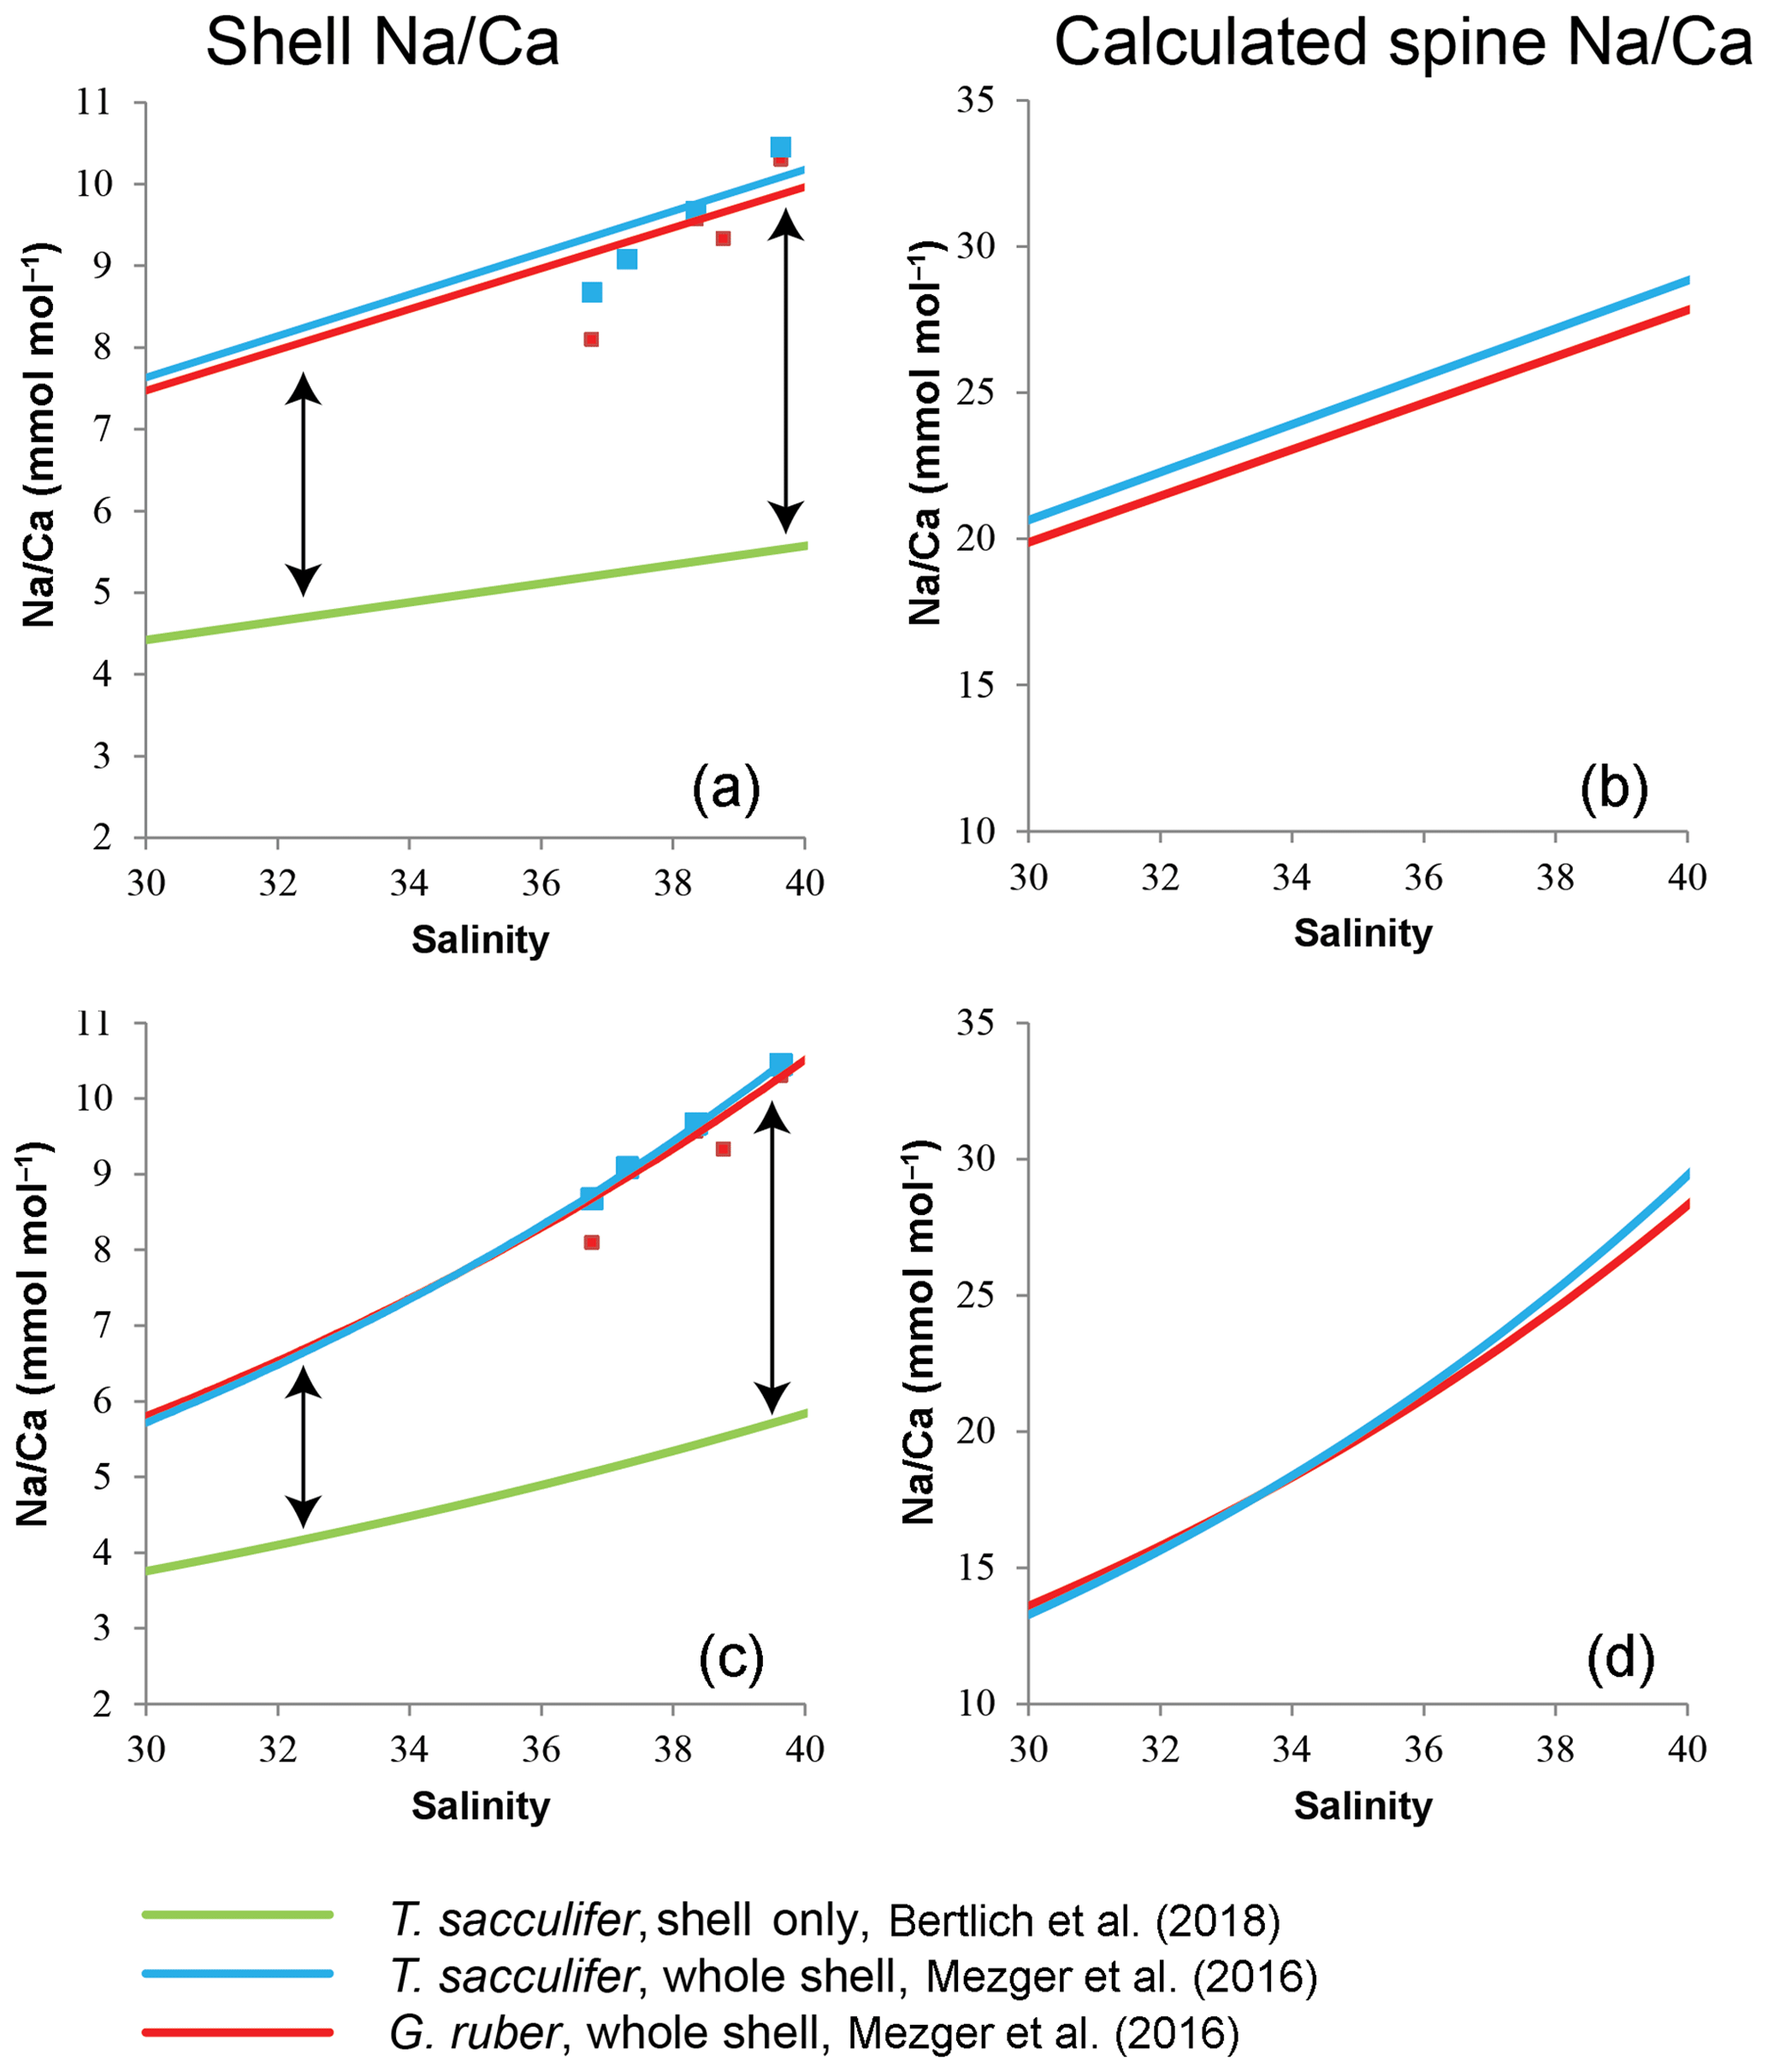
Figure 9Comparison of Na∕Ca-salinity calibrations between surface-water-collected spinose planktonic specimens still containing spines (whole-shell) (Mezger et al., 2016) and extrapolated cultured shell-only T. sacculifer (Bertlich et al., 2018). The difference in absolute values is assumed to be caused by spines (arrow) (a). (b) Theoretically calculated Na∕Ca values of the spines, in case of (a). (c) Difference in absolute values by exponential calibrations. (d) Theoretical calculated Na∕Ca values of the spines, in case of (c).
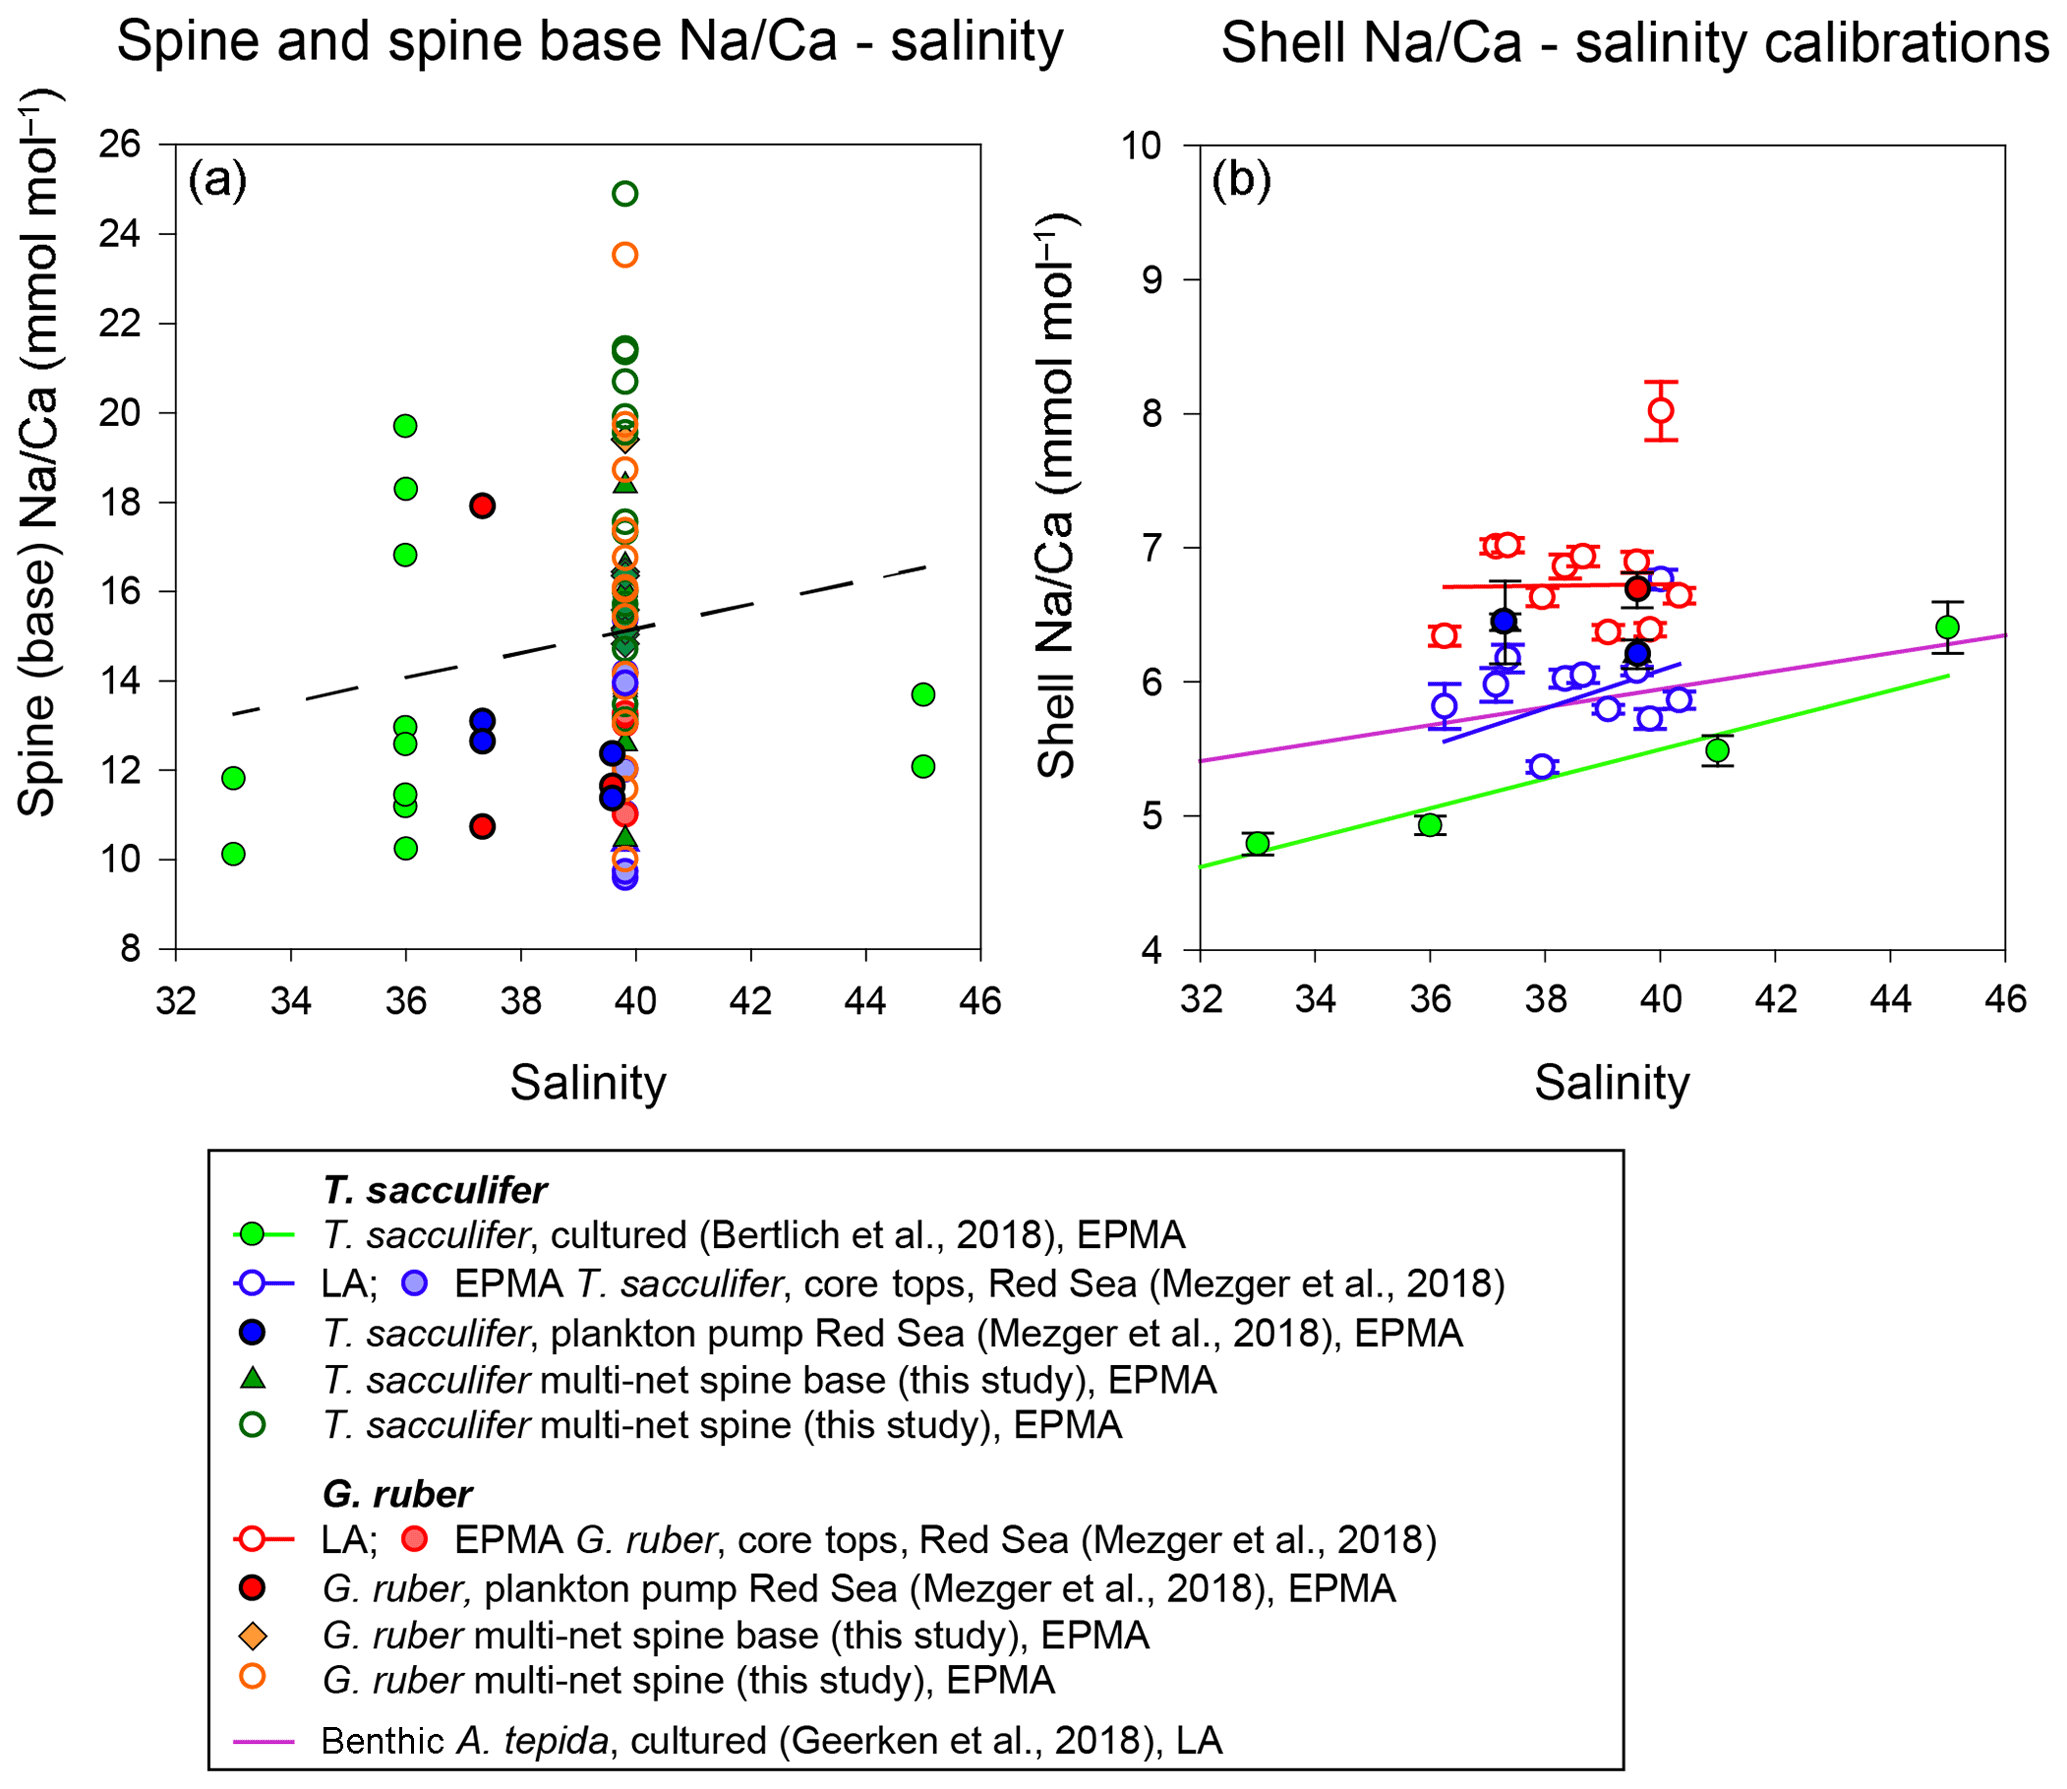
Figure 10(a) Changes of Na∕Ca spine bases and spines (multi-net only) with salinity, with the trend of all data indicated with the dashed line and (b) comparison of different existing Na∕Ca shell–salinity calibrations with indicated standard errors. The regression lines refer to the samples in the same color (also indicated in the legend). We have also separated data based on the analytical technique used, which were EPMA and laser ablation (LA) measurements, respectively.
No appreciable change in the number of spines (e.g., spine density) with increasing salinity has been observed and also the width of the spines appears to decrease rather than increase with increasing salinity (Fig. 4). Spine length could vary with salinity, but we were unable to quantify spine length as spines easily break off during sampling and sample processing. Spines are connected to the planktonic foraminiferal shell through a thin organic lining, which is easily removed during cleaning. The slight offset in absolute values between the cultured T. sacculifer and core tops can be explained by spine bases, still partially present in the shell wall after gametogenesis or burial.
Combining all spine and spine base Na∕Ca values compared to ambient salinity would suggest a trend towards higher Na incorporation with higher salinities, which is, however, not significant. Compared to shell Na∕Ca composition of the same specimens, spine Na∕Ca values are 2–4 times higher. For Red Sea core tops, no spines are observed (Mezger et al., 2018), and SEM images often show spine holes, probably associated with life-stage-related (gametogenesis) spine loss. Some spine bases remain present, allowing quantification of core-top spine base Na∕Ca. Comparing the EPMA-measured spine and spine base Na∕Ca values with values calculated using a mass balance (see Figs. 8–10) shows that measured absolute Na∕Ca values are lower and not in line with the calculated difference in slopes. This suggests that either (1) spine base Na∕Ca does not vary with salinity, (2) EPMA-measured values for spine-base and spine Na∕Ca underestimate true spine values (Fig. 10) or (3) spine base Na∕Ca values are significantly lower compared to the actual spine values. Furthermore, in this study, we analyzed a limited number of individuals and more specimens and measurements would be needed to identify a potential relationship between spine Na and salinity. Although we here show a major impact of spines and spine bases on Na∕Ca, the Na∕Ca values of the shell itself seem relatively robust (Figs. 7 and 10). Comparing both shell and spine Na∕Ca values with salinity shows that shell chemistry records salinity, albeit with a very modest slope (Figs. 5 and 10).
Whole-shell Na∕Ca values, including spines and spine bases, show an offset to shell-only values due to the (variable) contribution of spine- and spine-base-related carbonate, enriched in Na. Both absolute values and its relation to salinity show an offset between specimens with and without spines. Whereas the high Na areas may be susceptible to taphonomic or ontogenetic alteration, the chemistry of the shell itself appears relatively robust. The Na composition of foraminiferal organic linings is, although higher than shell Na∕Ca, not sufficient to significantly influence the overall Na∕Ca values measured. Neither spine Na∕Ca values nor their width or density appear to respond to changes in salinity. However, potential effects of diffusion or sampling volume errors related to EPMA could also have resulted in somewhat lower spine base compared to spine Na∕Ca values. Comparing both shell and spine Na∕Ca values with salinity shows that shell-only values still record salinity, albeit with a low sensitivity. This is relevant for the paleoapplication of Na∕Ca in reconstructing salinity since spines may not always be well preserved.
All data on which this publication is based can be found in the tables in the paper and through the following link: https://doi.org/10.4121/uuid:4aca8e7d-7e42-448b-9a77-f62c61e85049 (Metzger et al., 2019).
The supplement related to this article is available online at: https://doi.org/10.5194/bg-16-1147-2019-supplement.
GJR, LJdN and EMM designed this study. All data preparations, measurements and interpretations were executed by EMM, with daily discussions with GJR and LJdN. Part of the measurements (culture experiments) was measured together with JaB. These culture experiments were carried out by JeB. EMM analyzed the data and prepared the paper, with contributions from all co-authors.
The authors declare that they have no conflict of interest.
This research is funded by the NIOZ – Royal Netherlands Institute for Sea Research and supported by the Gravitation grant NESSC from the Dutch Ministry of Education, Culture and Science. We thank Wim Boer, Patrick Laan, Bas van der Wagt (NIOZ), Serguei Matveev and Tilly Bouten (Utrecht University) for their analytical assistance. Furthermore, we would like to thank Linda Dämmer and Siham de Goeyse (NIOZ) for their help with picking foraminiferal specimens for spine analyses, and Esmee Geerken for her assistance with EPMA data processing. We would also like to thank the editor and two reviewers, Takashi Toyofuku and Ralf Schiebel, for the constructive comments. We are also grateful to all technical staff on board of RV Pelagia cruise 64PE158 and the other cruises.
This paper was edited by Hiroshi Kitazato and reviewed by Takashi Toyofuku and Ralf Schiebel.
Allen, K. A., Hönisch, B., Eggins, S. M., Haynes, L. L., Rosenthal, Y., and Yu, J.: Trace element proxies for surface ocean conditions: A synthesis of culture calibrations with planktic foraminifera, Geochim. Cosmochim. Ac., 193, 197–221, https://doi.org/10.1016/j.gca.2016.08.015, 2016.
Bé, A. W. H.: Gametogenic calcification in a spinose planktonic foraminifer, Globigerinoides sacculifer (Brady), Mar. Micropaleontol., 5, 283–310, https://doi.org/10.1016/0377-8398(80)90014-6, 1980.
Beniash, E., Aizenberg, J., Addadi, L., and Weiner, S.: Amorphous calcium carbonate transforms into calcite during sea urchin larval spicule growth, P. Roy. Soc. Lond. B Bio., 264, 461–465, https://doi.org/10.1098/rspb.1997.0066, 1997.
Bertlich, J., Nürnberg, D., Hathorne, E. C., de Nooijer, L. J., Mezger, E. M., Kienast, M., Nordhausen, S., Reichart, G.-J., Schönfeld, J., and Bijma, J.: Salinity control on Na incorporation into calcite tests of the planktonic foraminifera Trilobatus sacculifer–Evidence from culture experiments and surface sediments, Biogeosciences, 15, 5991–6018, https://doi.org/10.5194/bg-15-5991-2018, 2018.
Bijma, J., Faber, W. W., and Hemleben, C.: Temperature and salinity limits for growth and survival of some planktonic foraminifers in laboratory cultures, J. Foramin. Res., 20, 95–116, https://doi.org/10.2113/gsjfr.20.2.95, 1990.
Branson, O., Bonnin, E. A., Perea, D. E., Spero, H. J., Zhu, Z., Winters, M., Hönisch, B., Russell, A. D., Fehrenbacher, J. S., and Gagnon, A. C.: Nanometer-Scale Chemistry of a Calcite Biomineralization Template: Implications for Skeletal Composition and Nucleation, P. Natl. Acad. Sci. USA, 113, 12934–12939, 2016.
Busenberg, E. and Plummer, L. N.: Kinetic and thermodynamic factors controlling the distribution of and Na+ in calcites and selected aragonites, Geochim. Cosmochim. Ac., 49, 713–725, https://doi.org/10.1016/0016-7037(85)90166-8, 1985.
Delaney, M. L., Bé, A. W. H., and Boyle, E. A.: Li, Sr, Mg, and Na in foraminiferal calcite shells from laboratory culture, sediment traps, and sediment cores, Geochim. Cosmochim. Ac., 49, 1327–1341, https://doi.org/10.1016/0016-7037(85)90284-4, 1985.
Elderfield, H. and Ganssen, G.: Past temperature and d18O of surface ocean waters inferred from foraminiferal Mg∕Ca ratios, Nature, 405, 442–445, https://doi.org/10.1038/35013033, 2000.
Fallet, U., Brummer, G. J., Zinke, J., Vogels, S., and Ridderinkhof, H.: Contrasting seasonal fluxes of planktonic foraminifera and impacts on paleothermometry in the Mozambique Channel upstream of the Agulhas Current, Paleoceanography, 25, 1–12, 2010.
Fehrenbacher, J. S., Russell, A. D., Davis, C. V., Gagnon, A. C., Spero, H. J., Cliff, J. B., Zhu, Z., and Martin, P.: Link between light-triggered Mg-banding and chamber formation in the planktic foraminifera Neogloboquadrina dutertrei, Nat. Commun., 8, 1–10, 2017.
Geerken, E., de Nooijer, L. J., van Dijk, I., and Reichart, G. J.: Impact of salinity on element incorporation in two benthic foraminiferal species with contrasting magnesium contents, Biogeosciences, 15, 2205–2218, https://doi.org/10.5194/bg-15-2205-2018, 2018.
Gordon, C., Carr, R., and Larson, R.: The influence of environmental factors on the sodium and manganese content of barnacle shells, Limnol. Oceanogr., 15, 461–466, 1970.
Hathorne, E. C., James, R. H., and Lampitt, R. S.: Environmental versus biomineralization controls on the intratest variation in the trace element composition of the planktonic foraminifera G. inflata and G. scitula, Paleoceanography, 24, 1–14, 2009.
Hauzer, H., Evans, D., Müller, W., Rosenthal, Y., and Erez, J.: Calibration of Na partitioning in the calcitic foraminifer Operculina ammonoides under variable Ca concentration: Toward reconstructing past seawater composition, Earth Planet. Sc. Lett., 497, 80–91, 2018.
Ishikawa, M. and Ichikuni, M.: Uptake of sodium and potassium by calcite, Chem. Geol., 42, 137–146, https://doi.org/10.1016/0009-2541(84)90010-X, 1984.
Jacob, D., Wirth, R., Agbaje, O., Branson, O., and Eggins, S.: Planktic foraminifera form their shells via metastable carbonate phases, Nat. Commun., 8, 1–9, 2017.
Kitano, Y., Okumura, M., and Idogaki, M.: Incorporation of sodium, chloride and sulfate with calcium carbonate, Geochem. J., 9, 75–84, https://doi.org/10.2343/geochemj.9.75, 1975.
Kunioka, D., Shirai, K., Takahata, N., and Yuji, S.: Microdistribution of Mg∕Ca, Sr∕Ca, and Ba∕Ca ratios in Pulleniatina obliquiloculata test by using a NanoSIMS: Implication for the vital effect mechanism, Geochem. Geophy. Geosy., 7, 1–11, 2006.
Lea, D. W., Mashiotta, T. A., and Spero, H. J.: Controls on magnesium and strontium uptake in planktonic foraminifera determined by live culturing, Geochim. Cosmochim. Ac., 63, 2369–2379, https://doi.org/10.1016/S0016-7037(99)00197-0, 1999.
Littlewood, J. L., Shaw, S., Peacock, C. L., Bots, P., Trivedi, D., and Burke, I. T.: Mechanism of Enhanced Strontium Uptake into Calcite via an Amorphous Calcium Carbonate Crystallization Pathway, Cryst. Growth Des., 17, 1214–1223, 2017.
Mertens, K. N., Bradley, L. R., Takano, Y., Mudie, P. J., Marret, F., Aksu, A. E., Hiscott, R. N., Verleye, T. J., Mousing, E. A., and Smyrnova, L. L.: Quantitative estimation of Holocene surface salinity variation in the Black Sea using dinoflagellate cyst process length, Quaternary Sci. Rev., 39, 45–59, 2012.
Mezger, E. M., Nooijer, L. J., Boer, W., Brummer, G. J. A., and Reichart, G. J.: Salinity controls on Na incorporation in Red Sea planktonic foraminifera, Paleoceanography, 31, 1562–1582, https://doi.org/10.1002/2016PA003052, 2016.
Mezger, E. M., Nooijer, L. J., Siccha, M., Kucera, M., and Reichart, G.-J.: Taphonomic and ontogenetic effects on Na∕Ca and Mg∕Ca in spinose planktonic foraminifera from the Red Sea, Geochem. Geophy. Geosy., 19, 4174–4194, https://doi.org/10.1029/2018GC007852, 2018.
Mezger, E. M., de Nooijer, L. J., and Reichart, G.-J.: Data underlying the article: Planktonic foraminiferal spine versus shell carbonate Na incorporation in relation to salinity, https://doi.org/10.4121/uuid:4aca8e7d-7e42-448b-9a77-f62c61e85049TS10, last access: 18 March 2019.
Nürnberg, D., Bijma, J., and Hemleben, C.: Assessing the reliability of magnesium in foraminiferal calcite as a proxy for water mass temperatures, Geochim. Cosmochim. Ac., 60, 803–814, https://doi.org/10.1016/0016-7037(95)00446-7, 1996.
Okai, T., Suzuki, A., Kawahata, H., Terashima, S., and Imai, N.: Preparation of a New Geological Survey of Japan Geochemical Reference Material: Coral JCp-1, Geostand. Geoanal. Res., 26, 95–99, 2002.
Prahl, F. and Wakeham, S.: Calibration of unsaturation patterns in long-chain ketone compositions for palaeotemperature assessment, Nature, 330, 367–369, https://doi.org/10.1038/330367a0, 1987.
Rohling, E. J.: Progress in paleosalinity: Overview and presentation of a new approach, Paleoceanography, 22, 1–9, https://doi.org/10.1029/2007PA001437, 2007.
Rohling, E. J. and Bigg, G. R.: Paleosalinity and δ18O: A critical assessment, J. Geophys. Res., 103, 1307–1318, https://doi.org/10.1029/97JC01047, 1998.
Rucker, J. B. and Valentine, J. W.: Salinity response of trace element concentration in Crassostrea virginica, Nature, 190, 1099–1100, https://doi.org/10.1038/1901099a0, 1961.
Sadekov, A. Y., Eggins, S. M., and De Deckker, P.: Characterization of Mg∕Ca distributions in planktonic foraminifera species by electron microprobe mapping, Geochem. Geophy. Geosy., 6, Q12P06, https://doi.org/10.1029/2005GC000973, 2005.
Schiebel, R. and Hemleben, C.: Planktic foraminifers in the modern ocean, Springer, Springer Science & Business Media, 2017.
Schouten, S., Hopmans, E. C., Schefuß, E., and Sinninghe Damste, J. S.: Distributional variations in marine crenarchaeotal membrane lipids: a new tool for reconstructing ancient sea water temperatures?, Earth Planet. Sc. Lett., 204, 265–274, https://doi.org/10.1016/S0012-821X(02)00979-2, 2002.
Schouten, S., Ossebaar, J., Schreiber, K., Kienhuis, M., Langer, G., Benthien, A., and Bijma, J.: The effect of temperature, salinity and growth rate on the stable hydrogen isotopic composition of long chain alkenones produced by Emiliania huxleyi and Gephyrocapsa oceanica, Biogeosciences, 3, 113–119, https://doi.org/10.5194/bg-3-113-2006, 2006.
Siccha, M., Trommer, G., Schulz, H., Hemleben, C., and Kucera, M.: Factors controlling the distribution of planktonic foraminifera in the Red Sea and implications for the development of transfer functions, Mar. Micropaleontol., 72, 146–156, https://doi.org/10.1016/j.marmicro.2009.04.002, 2009.
Spero, H. J., Eggins, S. M., Russell, A. D., Vetter, L., Kilburn, M. R., and Hönisch, B.: Timing and mechanism for intratest Mg∕Ca variability in a living planktic foraminifer, Earth Planet. Sc. Lett., 409, 32–42, 2015.
Steinhardt, J., de Nooijer, L. J., Brummer, G. J., and Reichart, G. J.: Profiling planktonic foraminiferal crust formation, Geochem. Geophy. Geosy., 16, 2409–2430, https://doi.org/10.1002/2015GC005752, 2015.
Steinke, S., Chiu, H. Y., Yu, P. S., Shen, C. C., Löwemark, L., Mii, H. S., and Chen, M. T.: Mg∕Ca ratios of two Globigerinoides ruber (white) morphotypes: Implications for reconstructing past tropical/subtropical surface water conditions, Geochem. Geophy. Geosy., 6, 1–12, 2005.
Vasiliev, I., Mezger, E. M., Lugli, S., Reichart, G.-J., Manzi, V., and Roveri, M.: How dry was the Mediterranean during the Messinian salinity crisis?, Palaeogeogr. Palaeocl., 471, 120–133, https://doi.org/10.1016/j.palaeo.2017.01.032, 2017.
Verleye, T. J., Mertens, K. N., Young, M. D., Dale, B., McMinn, A., Scott, L., Zonneveld, K. A., and Louwye, S.: Average process length variation of the marine dinoflagellate cyst Operculodinium centrocarpum in the tropical and Southern Hemisphere Oceans: assessing its potential as a palaeosalinity proxy, Mar. Micropaleontol., 86, 45–58, 2012.
Weldeab, S., Lea, D. W., Schneider, R. R., and Andersen, N.: 155,000 Years of West African Monsoon and Ocean Thermal Evolution, Science, 316, 1303–1307, 2007.
White, A. F.: Sodium coprecipitation in calcite and dolomite, Chem. Geol., 23, 65–72, 1978.
Wit, J. C., De Nooijer, L., Wolthers, M., and Reichart, G.-J.: A novel salinity proxy based on Na incorporation into foraminiferal calcite, Biogeosciences, 10, 6375–6387, https://doi.org/10.5194/bg-10-6375-2013, 2013.
Yoshimura, T., Tamenori, Y., Suzuki, A., Kawahata, H., Iwasaki, N., Hasegawa, H., Nguyen, L. T., Kuroyanagi, A., Yamazaki, T., and Kuroda, J.: Altervalent substitution of sodium for calcium in biogenic calcite and aragonite, Geochim. Cosmochim. Ac., 202, 21–38, https://doi.org/10.1016/j.gca.2016.12.003, 2017.
Zachos, J., Pagani, M., Sloan, L., Thomas, E., and Billups, K.: Trends, rhythms, and aberrations in global climate 65 Ma to present, Science, 292, 686–693, https://doi.org/10.1126/science.1059412, 2001.