the Creative Commons Attribution 4.0 License.
the Creative Commons Attribution 4.0 License.
 | 15 Mar 2019
Synchrony in catchment stream colour levels is driven by both local and regional climate
Brian C. Doyle
Elvira de Eyto
Mary Dillane
Russell Poole
Valerie McCarthy
Elizabeth Ryder
Eleanor Jennings
Streams draining upland catchments carry large quantities of carbon from terrestrial stocks to downstream freshwater and marine ecosystems. Here it either enters long-term storage in sediments or enters the atmosphere as gaseous carbon through a combination of biotic and abiotic processes. There are, however, increasing concerns over the long-term stability of terrestrial carbon stores in blanket peatland catchments as a result of anthropogenic pressures and climate change. We analysed sub-annual and inter-annual changes in river water colour (a reliable proxy measurement of dissolved organic carbon; DOC) using 6 years of weekly data, from 2011 to 2016. This time-series dataset was gathered from three contiguous river sub-catchments, the Black, the Glenamong and the Srahrevagh, in a blanket peatland catchment system in western Ireland, and it was used to identify the drivers that best explained observed temporal change in river colour. The data were also used to estimate annual DOC loads from each catchment. General additive mixed modelling was used to identify the principle environmental drivers of water colour in the rivers, while wavelet cross-correlation analysis was used to identify common frequencies in correlations. At 130 mg Pt Co L−1, the mean colour levels in the Srahrevagh (the sub-catchment with lowest rainfall and higher forest cover) were almost 50 % higher than those from the Black and Glenamong, at 95 and 84 mg Pt Co L−1 respectively. The decomposition of the colour datasets revealed similar multi-annual, annual and event-based (random component) trends, illustrating that environmental drivers operated synchronously at each of these temporal scales. For both the Black and its nested Srahrevagh catchment, three variables (soil temperature, soil moisture deficit, SMD, and the weekly North Atlantic Oscillation, NAO) combined to explain 54 % and 58 % of the deviance in colour respectively. In the Glenamong, which had steeper topography and a higher percentage of peat intersected by streams, soil temperature, the log of stream discharge and the NAO explained 66 % of the colour concentrations. Cross-wavelet time-series analysis between river colour and each environmental driver revealed a significant high common power relationship at an annual time step. Each relationship however, varied in phase, further highlighting the complexity of the mechanisms driving river colour in the sub-catchments. The estimated mean annual DOC loads for the Black and Glenamong rivers to Lough Feeagh were similar at 15.0 and 14.7 t C km−2 yr−1 respectively. The important role of past and current precipitation and, in particular, temperature emphasises the vulnerability of blanket peatland carbon stores to projected climate change and highlights the interaction of local and regional climate in controlling aquatic carbon export. Our results show that water colour (and hence DOC) concentrations can vary considerably between neighbouring catchments and also that regional-scale climatic drivers control the trends in intra- and inter-annual flux of DOC through the system. The combination of locally determined concentrations and regionally controlled fluxes produces aquatic DOC loads that vary over both the annual cycle and over multiple years.


Blanket peat ecosystems occur within a relatively narrow window of climatic conditions, characterised by warmer and wetter conditions, in temperate regions where precipitation exceeds potential evaporation by a ratio of about 3 : 1 (Wieder and Vitt, 2006). Under such conditions, primary production exceeds decomposition of soil organic matter, and therefore organic carbon (C) accumulates. These ecosystems are a major terrestrial carbon store (Bain et al., 2011). Blanket peats (technically a soil with peat depth > 40 cm) are now recognised as being under threat, not only from excessive erosion due to anthropogenic pressures (for example, harvesting, burning and grazing) (Renou-Wilson et al., 2011), but also from increases in C loss related to directional climate change (Gallego-Sala and Prentice, 2013). Streams and rivers are the major pathways along which organic C is conveyed from upland peatlands to downstream lakes and oceans. In most studies which have evaluated fluvial losses of both dissolved organic carbon and particulate organic carbon, DOC has been identified as the dominant C form, representing between 60 % and 88 % of the total carbon load (Hope et al., 1997a; Tipping et al., 1997; Ryder et al., 2014). Hope et al. (1997b) concluded that, for British rivers as a whole during 1993, 0.68 Mt C of the fluvial carbon load was in dissolved form, representing 77 % of total C export. In the west of Ireland, DOC was estimated to account for 60.5 % of the total fluvial C load from the Glenamong sub-catchment (Ryder et al., 2014), a site which is also used in the current study
Stream DOC concentrations draining blanket peatland catchments in Ireland typically show a distinct seasonal pattern, with highest values from late summer to early winter and lowest values in spring (e.g. Ryder et al., 2014). Longer-term patterns in DOC concentrations or in proxies for DOC have been linked to year-to-year changes in meteorological conditions at both local and regional scales. At local scales, temperature affects peat decomposition rates and therefore the availability of DOC, while higher precipitation increases the washout of DOC from soils (Jennings et al., 2006; Ryder et al., 2014). Increases in oxygen availability within peat during droughts can also lead to higher rates of aerobic decomposition (Mitchell and McDonald, 1992; Yallop and Clutterbuck, 2009; Fenner and Freeman, 2011). At regional scales, DOC concentrations have been shown to be influenced by global weather patterns; for example, DOC concentrations in certain Canadian lakes were found to be correlated with climate indices such as the Pacific Decadal Oscillation and the Southern Oscillation Index (Zhang et al., 2010). In Europe, and Ireland in particular, such correlations would be expected to be linked to the North Atlantic Oscillation (NAO). The NAO is a weather phenomenon related to fluctuations in the difference of atmospheric pressure at sea level between the Icelandic low and the Azores high (Hurrell et al., 2003). A positive phase of the NAO reflects below-normal atmospheric pressure across Greenland and Iceland and above-normal atmospheric pressure over the central North Atlantic, the eastern United States and western Europe. A negative phase reflects an opposite pattern of atmospheric pressure anomalies over these regions. High positive values of this index over north-west Europe are associated with warmer and wetter conditions during the winter, and positive index values during the summer are linked with warm, dry and relatively cloud-free periods (Folland et al., 2008). In a 28-year study, Nõges et al. (2007) found that water colour (one of the most commonly used proxies for DOC) during spring in Estonian rivers was positively related to the previous winter's North Atlantic Oscillation (NAO) index. A similar positive relationship between the winter NAO and the total organic carbon (TOC) load was reported over 25 years in Finnish rivers (Arvola et al., 2004).
Increasing trends in fluvial DOC concentrations have been observed in many peat catchments over the last 20 years (Hongve et al., 2004; Evans et al., 2005; Monteith et al., 2007; Worrall and Burt, 2007; Erlandsson et al., 2008; Jennings et al., 2006). While these changes have been attributed in part to recovery from the effects of atmospheric acid deposition on a regional scale (Monteith et al., 2007; Erlandsson et al., 2008), the trend has also been linked to changes in the key climatic drivers of DOC export. These drivers include the effect of changes in precipitation and snowmelt patterns on flushing rates (Hongve et al., 2004; Erlandsson et al., 2008) and the impact of higher temperatures (Freeman et al., 2001; Preston et al., 2011) and of drought events (Clark et al., 2005; Jennings et al., 2006) on peat decomposition. There are, however, also studies in which DOC concentrations have been shown to have decreased (Clair et al., 2008; Worrall et al., 2018), or no increase has been observed, such as within certain catchments in the UK (Worrall and Burt, 2007). Winterdahl et al. (2014) also reported increases in TOC in only half of 130 Swedish streams but with no clear geographic pattern, highlighting the need for further examination of the complex relationship between DOC concentration and climate. Given the close relationship between peat formation and peat decomposition and climate factors such as temperature, directional climate change is likely to place additional pressures on peatland systems (Clark et al., 2010a; Coll et al., 2014). Observed and projected climate changes for Ireland include higher temperatures throughout the annual cycle, a decrease in the summer water table and higher winter streamflow (Dwyer, 2012; Nolan, 2015), a combination that has been shown to have the potential to increase fluvial DOC export (Naden et al., 2010).
In Europe, Atlantic blanket bogs are found on the western fringes of the continent and are common only in Ireland and Scotland (Sheehy Skeffington and O'Connell, 1998), reflecting the dominant influence of the Atlantic on the local climate in these countries (Coll et al., 2005; Sweeney, 2014). In Ireland, up to 75 % of soil carbon storage is in peatlands, much of which is in upland blanket peat soils (Holden and Connolly, 2011; Renou-Wilson et al., 2011). Examining riverine fluxes of carbon from these catchments provides a means to quantify export of C from long-term storage in peatland ecosystems and to explore the effects of climatic variables on these C stores. The present study expands on the work described earlier of Ryder et al. (2014), firstly by comparing colour concentrations from three contiguous peat sub-catchments that differ in their catchment characteristics and secondly by including the role of the regional climatic conditions, e.g. the NAO, as a possible driver. The principal aims of the current study, using river colour data from the Burrishoole catchment in the west of Ireland, were (1) to compare the sub-seasonal, seasonal and multi-annual trends in water colour, (2) to identify the main climatic drivers of river colour and (3) to quantify the inter-annual variability in fluvial export of DOC over the study period.
2.1 Study area
2.1.1 Geology and soils
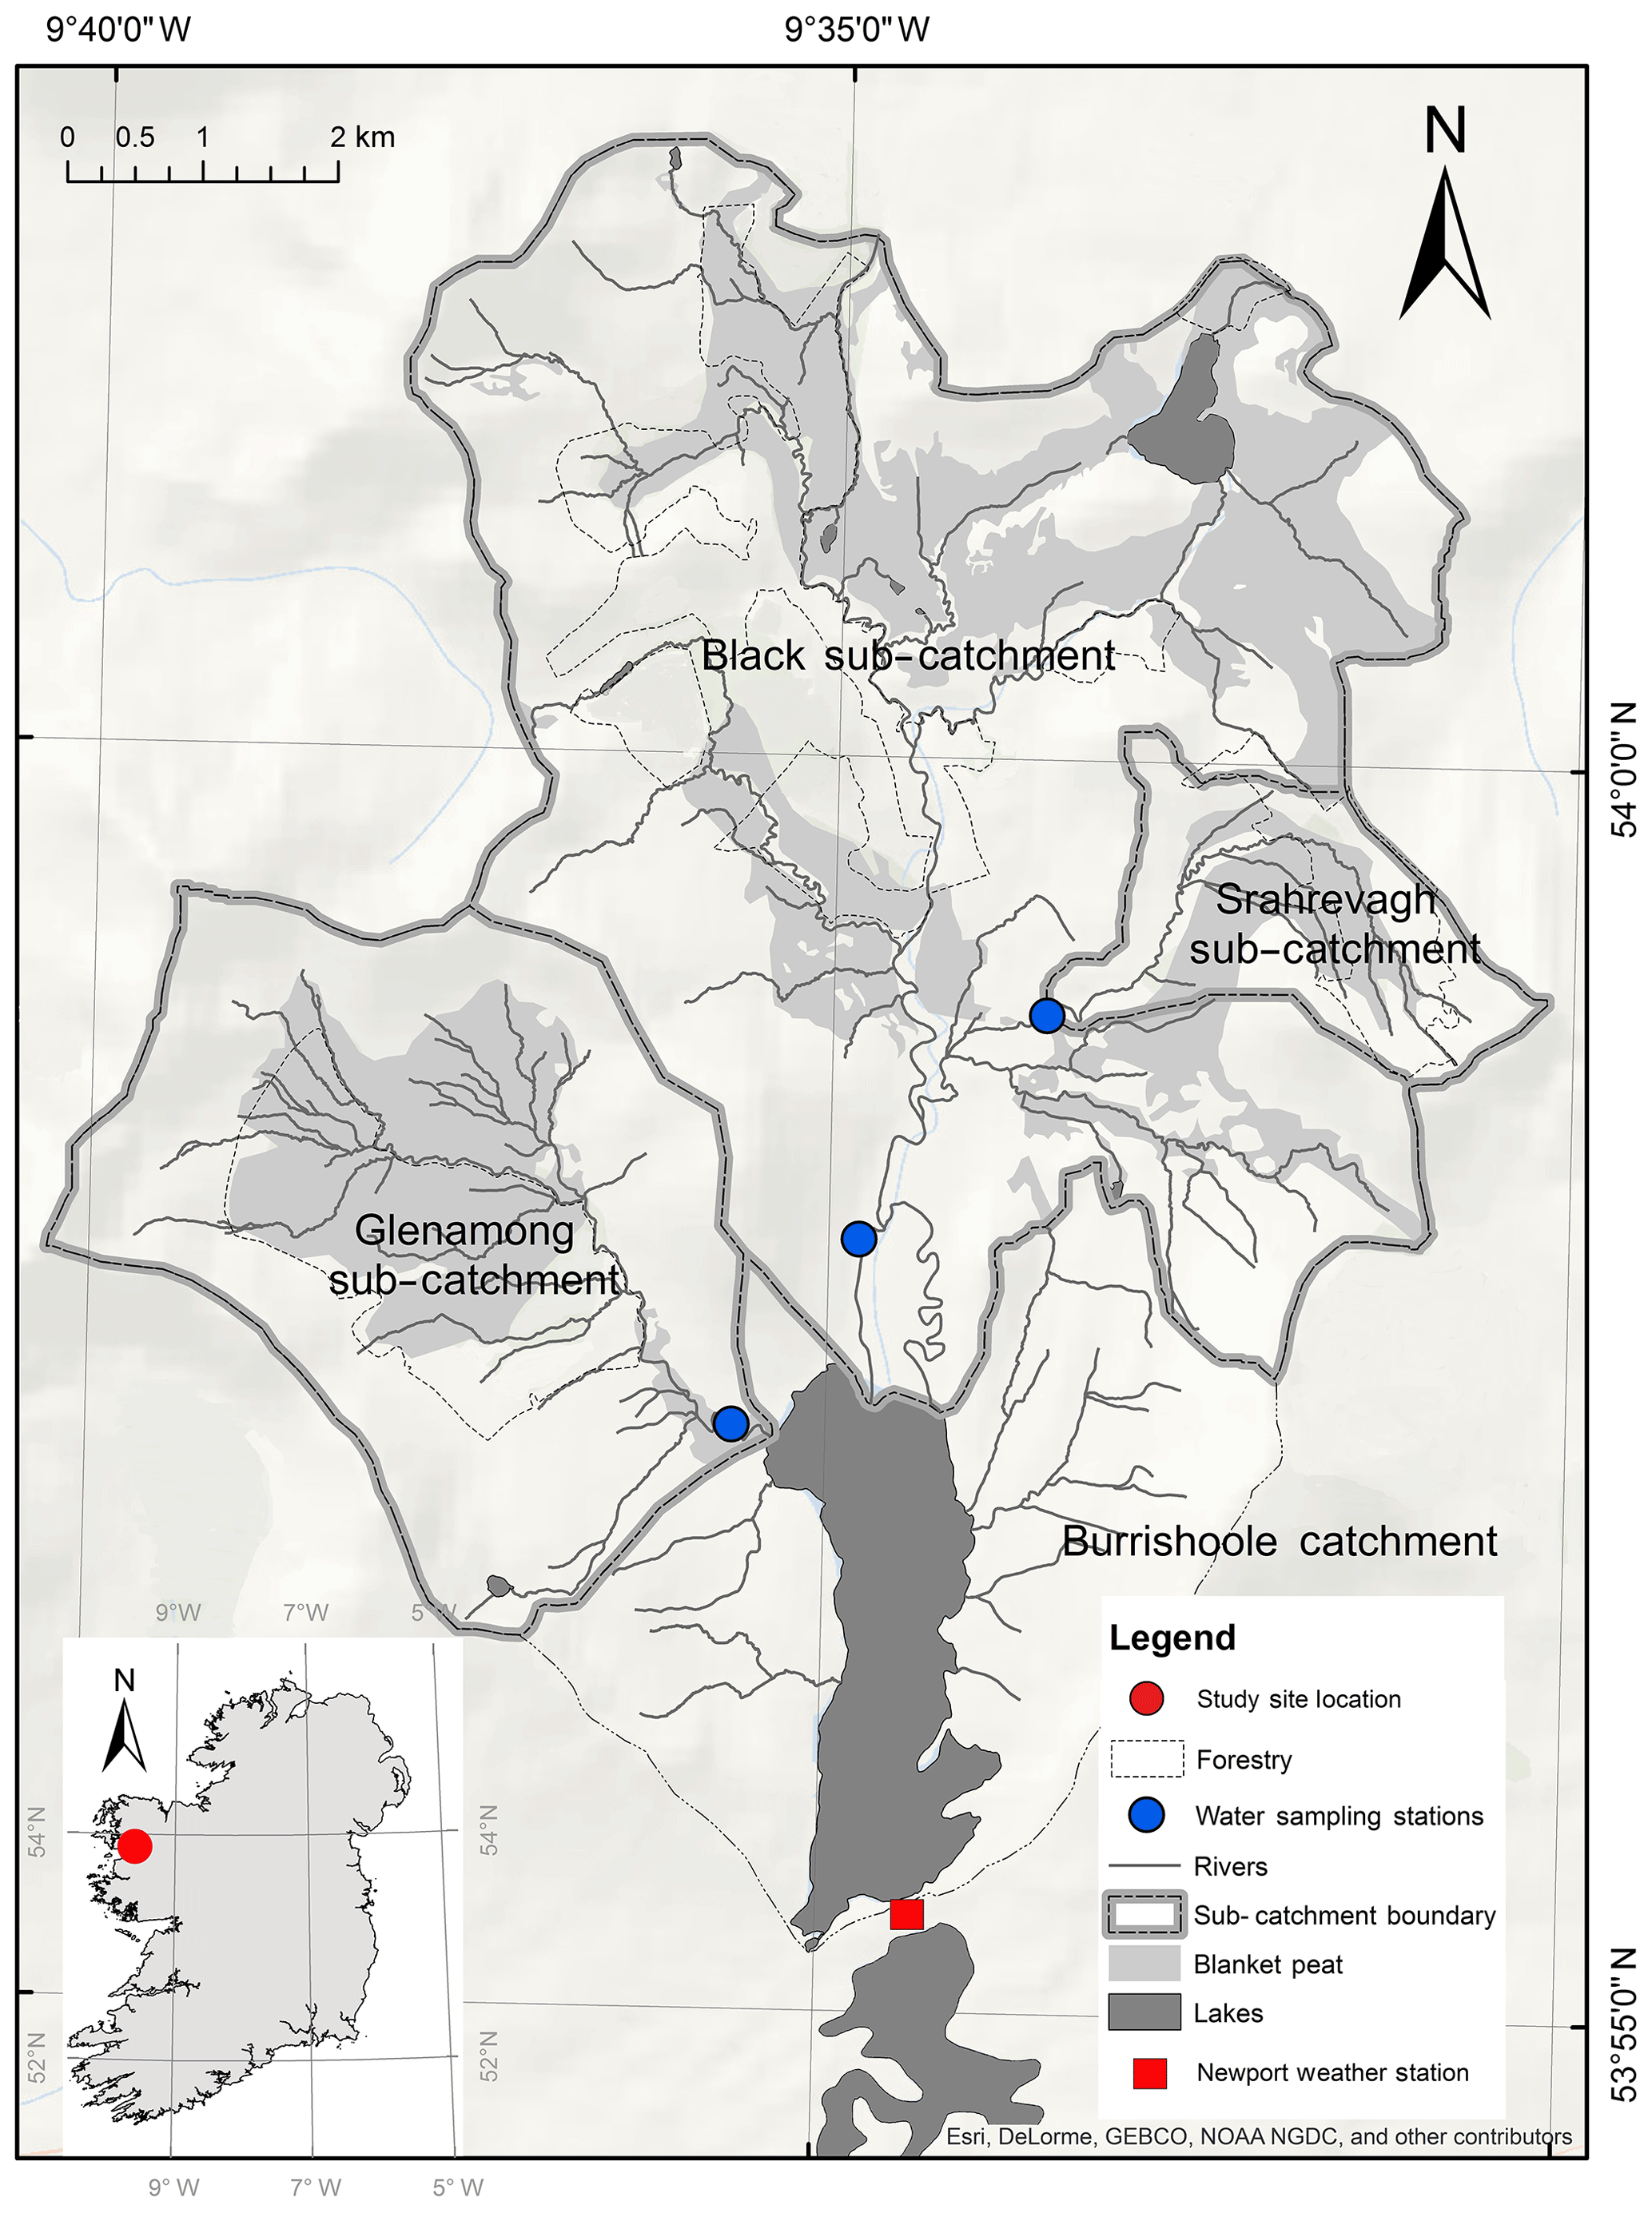
The Burrishoole catchment (∼100 km2) is a topographic basin that has been carved into the Nephin Beg mountain range over successive ice ages and comprises 21 lakes of sizes ranging from 0.04 to 395 ha and approximately 143 km of interconnecting rivers and streams (53∘55′ N 9∘55′ W). Late Precambrian metamorphic rocks and smaller areas of Palaeozoic sandstone and limestone characterise the geology of the catchment (Long et al., 1992; Parker, 1977). Rivers and streams on the western side of the catchment (Glenamong) are generally more acidic, with low buffering capacity (alkalinities on the order of −2.7 to 7.5 mg L−1 CaCO3 (Marine Institute, unpublished data) and low aquatic production. Rivers draining the east of the catchment (Black and Srahrevagh) are nearer circumneutral, with alkalinities on the order of 15–20 mg L−1 CaCO3, with consequently higher aquatic productivity. There are also significant till subsoil deposits throughout the catchment comprising unconsolidated material of lithology, reflecting that of its underlying parent bedrock (Kiely et al., 1974). The overlying soils are predominantly poorly drained gleys and peaty Podsols, with alluvial soils on the valley floors and blanket peatlands covering upland slopes (May and Place, 2005). Land cover in the catchment comprises 52 % blanket peat and 15 % forestry, with the remaining 33 % being made up of discrete parcels of transitional woodland and scrub, natural grasslands and agricultural land (CORINE, 2012). Much of the peatland area is commonage and is used for sheep grazing (Weir, 1996). Vegetation cover on the blanket peats is characterised by Calluna vulgaris, Molinia caerulea, Schoenus nigricans and Scirpus caespitosus (O'Sullivan, 1993).
2.1.2 Climate
The Burrishoole catchment is located close to the north-west coast of Ireland and experiences a temperate, oceanic climate with mild winters and relatively cool summers. A meteorological station (Newport) has been in operation in the catchment on the shores of Lough Feeagh since 1958. Long-term average annual precipitation at this station (1960–2014) was 1564 mm. Average daily rainfall for the same period was 4.3 mm (±6.2 mm SD), and 75 % of days had some measurable rainfall (de Eyto et al., 2016). The total annual precipitation at Newport between 2010 and 2016 ranged from a minimum of 1316 mm yr−1 (2013) to a maximum of 2020 mm yr−1 (2015), with an average of 1636 mm yr−1. It is also important to note that rainfall levels varied spatially across the catchment over the study years from an annual average of 2623 mm yr−1 (±386 mm yr−1 SD), recorded at an automatic rain gauge in the north-west of the catchment, to 1508 mm yr−1 (±158 mm yr−1 SD) in the south of the catchment (MI unpublished data). Seasons were defined as follows in the current study: winter is December, January and February; spring is March, April and May; summer is June, July and August; and autumn is September, October and November. Maximum summer temperatures in the Burrishoole catchment rarely exceed 20 ∘C, while minimum winter temperatures are usually between 2 and 4 ∘C (Marine Institute, unpublished data). The average annual air temperature at Newport meteorological station from 2010 to 2016 was 10.1 ∘C.
2.1.3 Catchment characteristics
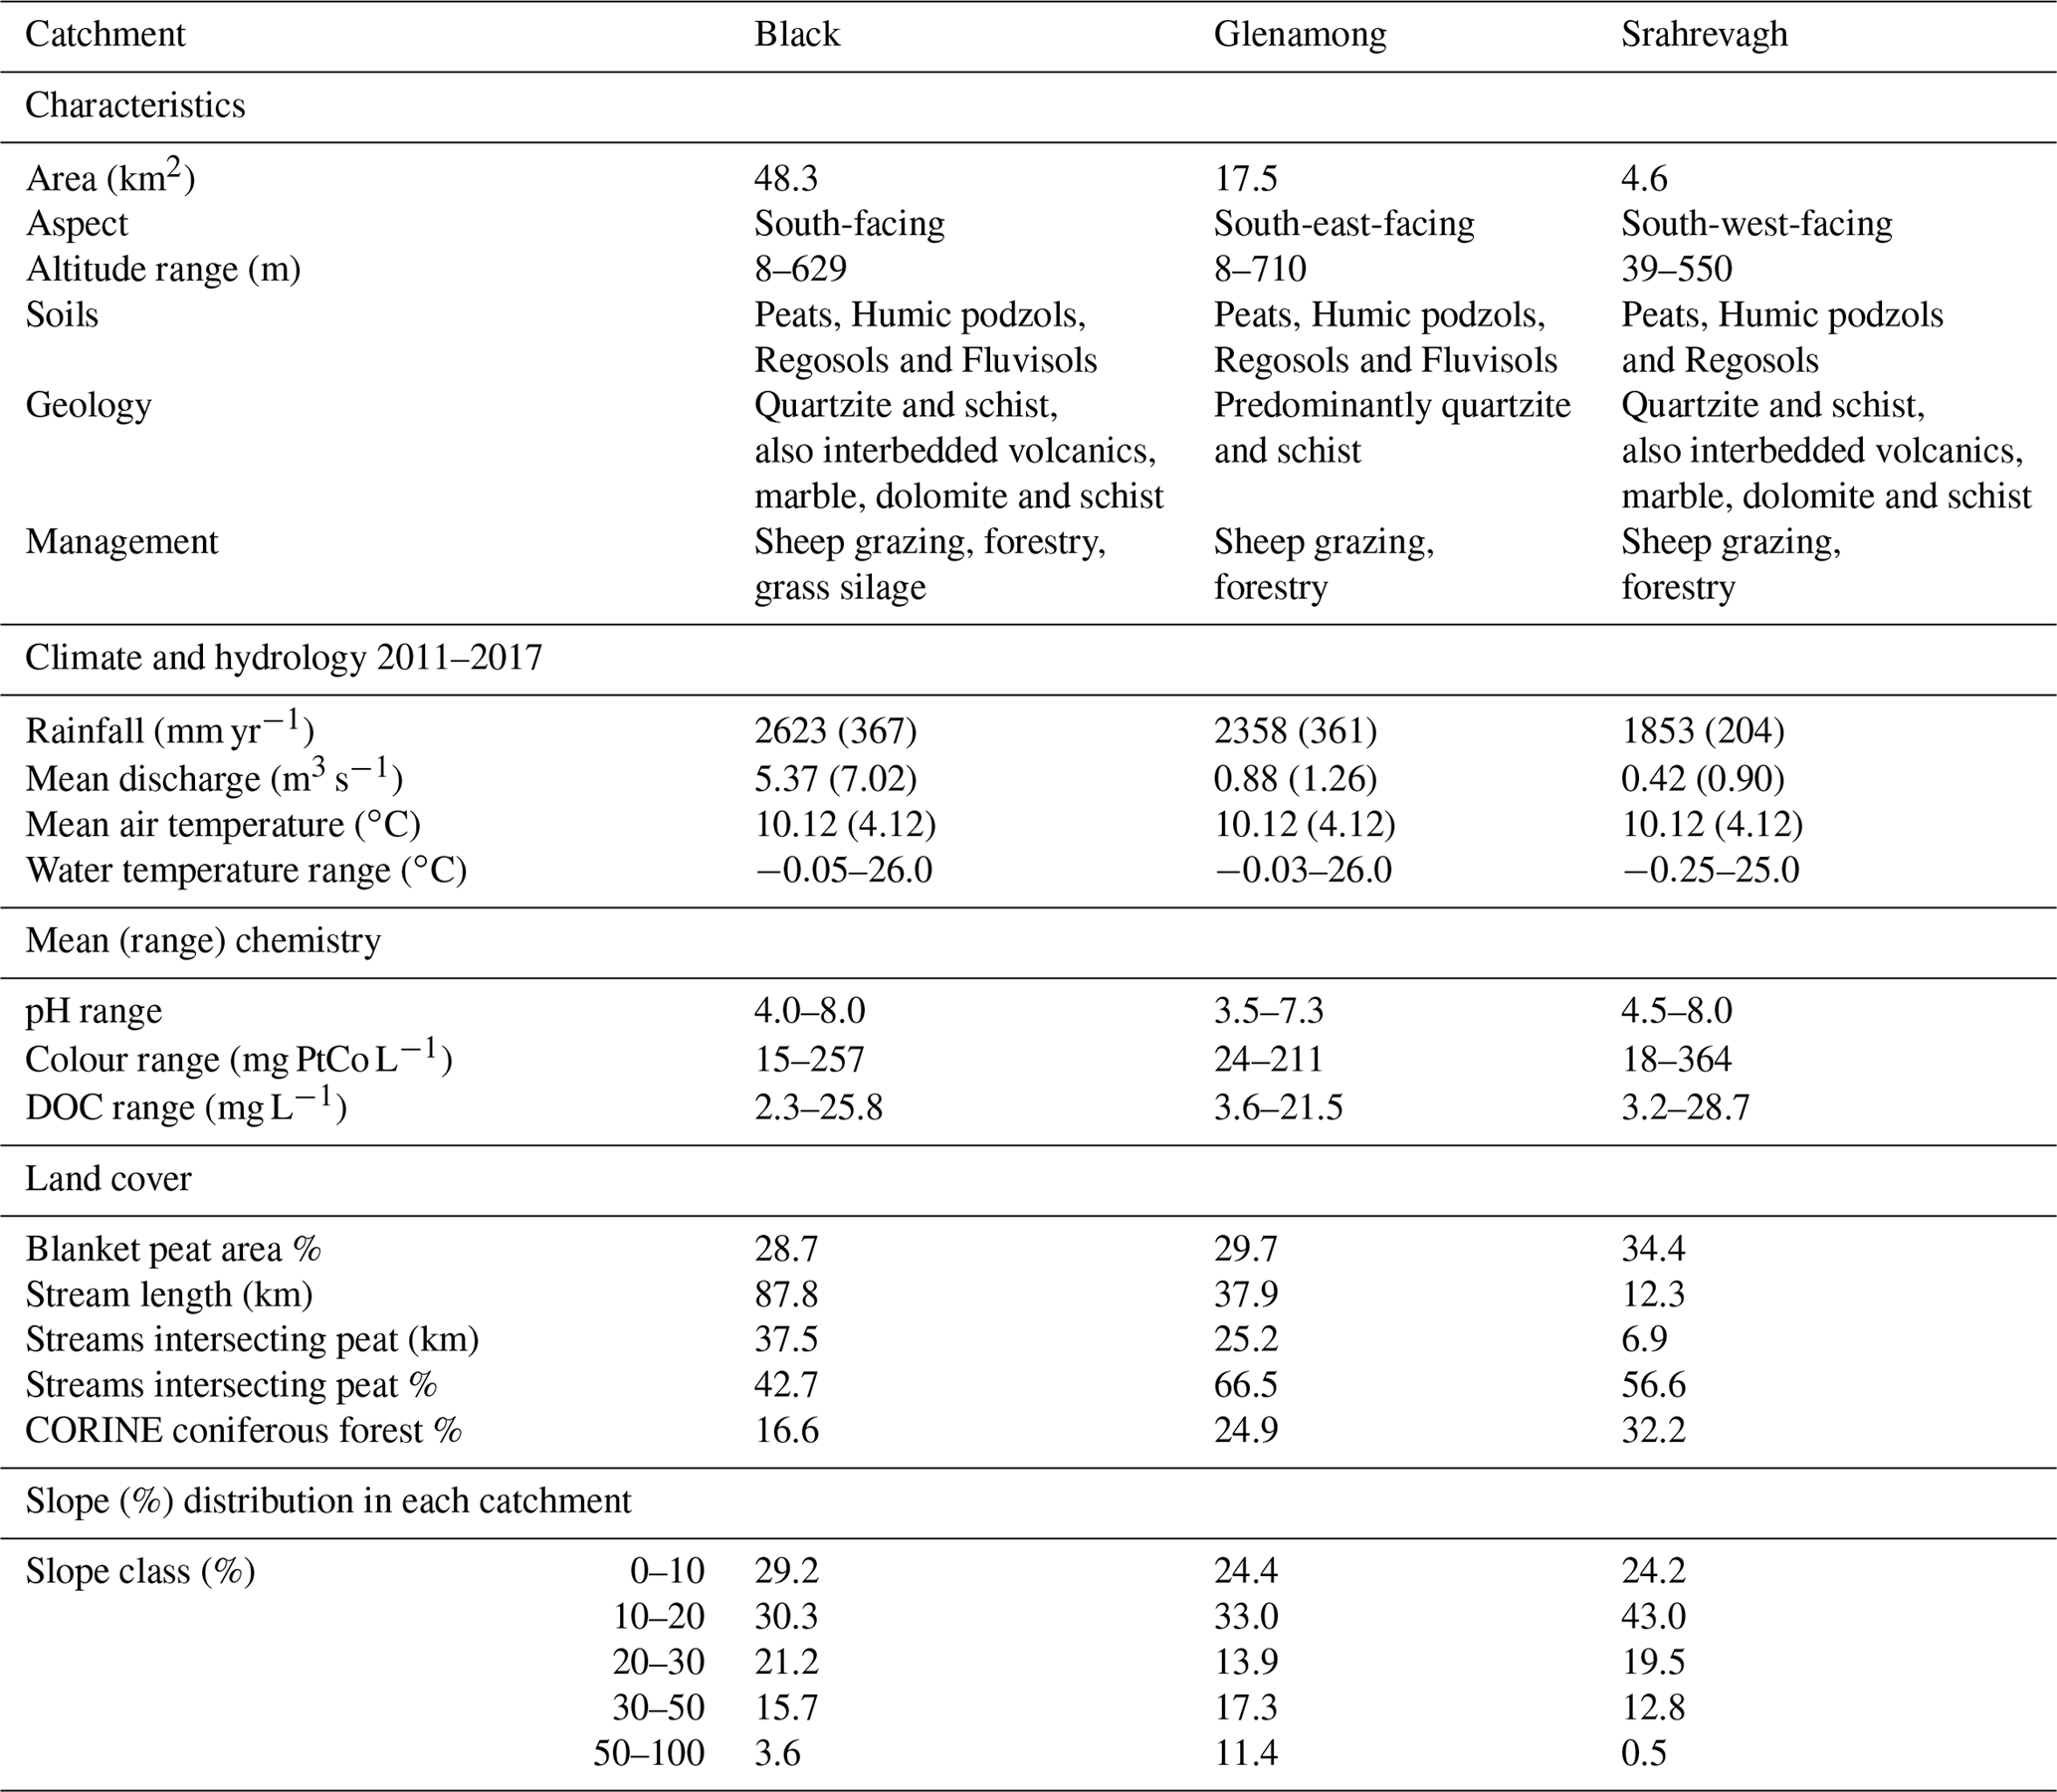
This study is focussed on three rivers and their sub-catchments in the Burrishoole catchment. The Black and the Glenamong drain directly into Lough Feeagh, whilst the third, the Srahrevagh, is nested within the larger Black sub-catchment (Fig. 1). The predominant land uses in all three sub-catchments are sheep grazing and forestry; however the Black also contains a small proportion of more intensively managed agricultural land. Soils with a peaty, carbon-rich top horizon are common throughout the Burrishoole catchment, and blanket peat covers approximately 20 % of the catchment. Blanket peat has been mapped in all three sub-catchments, with the Srahrevagh containing approximately 5 % more peat relative to its area than the other two sub-catchments (Kiely et al., 1974; Gardner and Radford, 1980) (Table 1). The Glenamong has a greater percentage of stream length intersecting blanket peat in comparison to the Black and the Srahrevagh sub-catchments (Fig. 1 and Table 1). The CORINE land-cover data show that 32 % of the Srahrevagh sub-catchment contains coniferous plantation compared to approximately 25 % and 17 % for the Glenamong and Black respectively (Table 1). The Srahrevagh sub-catchment has the greatest proportion of slopes ranging between 0 % and 20 %, while the Glenamong is the most mountainous of the three sub-catchments, having the greatest altitude range and containing the greatest proportion of slopes steeper than 50 % (Table 1). Glenamong stream water is consistently more acidic than the other two sub-catchments; however the remaining stream chemistry metrics between sub-catchments are broadly similar (Table 1). The slope distribution (as percent) for the Burrishoole catchment and each sub-catchment was calculated from a digital elevation model (DEM) at a 10 m resolution (Marine Institute Data) using the Spatial Analyst routine in ArcMap 10.3.1 (ESRI – https://www.esri.com, last access: 24 May 2018).
Table 1Sub-catchment characteristics, climate (recorded at Newport climate station) and hydrology and stream water chemistry data for the Black, Glenamong and Srahrevagh sub-catchment.
2.2 Water chemistry sampling
Water samples from the rivers were taken at weekly intervals over 6 years (2011–2016) from the same sampling sites (Fig. 1). Colour (mg PtCo L−1) was measured within hours of sampling using a HACH Dr 2000 spectrophotometer at 455 nm on water filtered through Whatman GF/C filters (pore size: 1.22 µm). Wavelength accuracy was ±2 nm from 400 to 700 nm and ±3 nm from 700 to 900 nm.
2.3 Meteorological and hydrological measurements
Daily precipitation and soil temperature data were available from the Newport weather station (Fig. 1). Water levels (cm) were recorded every 15 min at each site using OTT Hydrometry Orpheus Mini water level loggers (https://www.ott.com, last access: 24 May 2018). The levels for the Glenamong and Srahrevagh rivers were converted to volume of discharge per second (m3 s−1) using site-specific rating curves that have been developed using data collected regularly (Marine Institute, unpublished data). No reliable rating curve was available for the Black River; therefore discharge was estimated using the drainage area ratio method based on the Glenamong discharge (Hirsch, 1979).
2.4 Data analysis
2.4.1 Statistical tests
This analysis was conducted to ascertain if there were significant statistical differences between river colour in each catchment. A Mann–Whitney U test was used to test for statistical differences between mean colour concentrations in the Glenamong and Black and the Glenamong and Srahrevagh rivers. As the Black and Srahrevagh rivers are in the same river system, a non-parametric Wilcoxon signed rank test was used to test for statistical differences between their colour concentrations.
2.4.2 Time-series decomposition
The time-series datasets of weekly colour concentrations in the three rivers were examined using seasonal trend decomposition using loess (STL) (Cleveland et al., 1990) in R (R Core Team, 2017). The STL algorithm decomposes a time series into three separable elements: the trend, the seasonal variation and the residual using an additive model (Eq. 1). Loess (locally weighted smoothing) regression is a non-parametric technique that uses local weighted regression to fit a smooth curve through points in a scatter plot. An additive model was preferred over a multiplicative model because no obvious non-stationarity in the time series was observed; i.e. the amplitude of the seasonal cycle remained uniform and did not increase or decrease with the trend in the data (Fig. 3a). Variation in the time-series data was decomposed into a set of constituent elements: overall mean or level (α), trend (T), seasonal component (S) and random noise (N) (Chatfield, 1984). For a specific time series, colour concentration in surface waters can be expressed as
where Ytl is the colour concentration at time t in location l. The overall mean colour level (α) is site-specific and could vary with, for example, the soil, vegetation or land management characteristics of each catchment. Regular variation of seasonal weather, for example, precipitation and temperature, principally drives the S term, and N represents short-term, random events. Any factor that drives the production of colour in surface waters (i.e. DOC production, solubility or transport) over multiple years could drive the trend T (Clark et al., 2010b). STL analysis was also carried out on the principal explanatory drivers of water colour identified in the general additive mixed model (GAMM) analysis. The trend component of each explanatory driver, namely soil temperature, discharge, soil moisture deficit (SMD) and the NAO, was extracted and compared visually.
2.4.3 General additive mixed models
To identify the main explanatory drivers of colour in the rivers, general additive mixed models (GAMMs) with cubic smoothing regression splines and Gaussian distributions were developed using the mgcv package in R (Wood, 2006). Variance inflation factors (VIFs) less than 3 were used to exclude closely related variables (Montgomery and Peck, 1992; Zuur et al., 2009). All models were tested for violations of the assumptions of homogeneity, independence and normality, and correlation or variance structures included as appropriate. Models were examined for the effects of autocorrelation in residuals by plotting the autocorrelation function (acf) (Venables and Ripley, 2002). All analysis was carried out in R. The response variable was the weekly colour data from the three sub-catchments. Potential explanatory variables comprising climate and hydrological data were included as continuous variables. The climate variables, measured at the Newport meteorological station, were constructed as follows: the first set was the weekly mean of each climate variable calculated from the sampling week; the second set was the value of each variable measured on the day of sampling. The third set was constructed by lagging each climate variable by 1-, 2- and 4-weekly time steps. The climate variables included were maximum, minimum and mean air temperature (∘C), total precipitation (mm), wind speed (m s−1), solar radiation (kWh m−2), relative humidity (%), air pressure (hPa), soil temperature at 5, 10, 30, 50 and 100 cm depths and sun hours (h). Hydrological explanatory variables included river discharge (m3 s−1), soil moisture deficit (SMD) (mm day−1) and actual evapotranspiration (mm day−1). Soil moisture deficit was calculated using a procedure described by Brereton et al. (1996) for Irish grasslands. Potential evapotranspiration rates were first estimated based on air temperature and sunshine data using the method of Priestley and Taylor (1972), and then actual evapotranspiration was calculated as a proportion of potential evapotranspiration based on Aslyng (1965). Both weekly and monthly means of the NAO index were downloaded from the National Oceanic and Atmospheric Administration (NOAA, 2017) and used as explanatory variables in the statistical analysis. The Standardised Precipitation Index (SPI) was calculated using the R package SPEI (Vicente-Serrano et al., 2010; Beguería et al., 2014) using daily precipitation data from the Newport weather station over 21 years (1995–2016). The SPI was used to assess relative changes in rainfall and to discover the occurrence of drought events in the catchment over the study period. The SPI creates a numeric output on a monthly time step that can be subdivided into seven categories: extremely wet > 2, severely wet 1.5 to 2, moderately wet 1 to 1.5, normal −1 to 1, moderately dry −1 to −1.5, severely dry −1.5 to −2 and extremely dry < −2. Time series of the possible drivers of water colour, namely soil temperature, SMD, river discharge in the Glenamong and the weekly NAO, were also decomposed using the seasonal trend decomposition as described above.
2.4.4 Cross-wavelet transform analysis
A cross-wavelet transform analysis was carried out to further examine the trends and periodicities in colour concentrations with the explanatory drivers of colour in the rivers. Cross-wavelet transform analysis can be used as a method of examining pairs of time series that may be expected to be linked in some way. Continuous wavelet transforms from pairs of time series are used to construct the cross-wavelet transforms, revealing their common power and relative phase in time–frequency space. In particular, the analysis examines whether regions in time–frequency space with large common power have a consistent phase relationship, suggesting causality between the time-series pairs (Grinsted et al., 2004). A cross-wavelet power spectrum was calculated from the cross-wavelet transform results in order to estimate the covariance between each pair of time series as a function of frequency, and the statistical significance was also estimated as part of the analysis. The biwavelet package in R (R Core Team, 2017) was used for the bivariate wavelet analyses (Grinsted et al., 2004).
2.5 Estimation of DOC concentration from water colour concentration and calculation of carbon export
DOC (mg L−1) concentration was estimated from water colour concentration (PtCo mg L−1) using a linear model developed between water colour and DOC from the Glenamong River between April 2010 and September 2011(Ryder, 2015). There was a strong linear relationship between colour and DOC (r2=0.88, p≤0.001, n=366), indicating that water colour measurements were a good proxy for DOC concentrations in the sub-catchment rivers. DOC analysis was carried out using a Sievers 5310C total organic carbon analyser (Sievers Instruments Inc, sievers.instruments.wts@suez.com) (range 4 ppb to 50 ppm; accuracy ±2 % or ±5 ppb, whichever is greater; precision < 1 % relative standard deviation). To verify the TOC analyser performance, 10 ppm potassium hydrogen phthalate (KHP) standards were used. The mean annual loads were calculated for the Black and Glenamong sub-catchments by multiplying the calculated stream discharge volume for each week by the weekly estimated DOC concentration and summing the totals. Mean annual yield (per km2) was estimated by dividing the mean annual load by the upstream drainage-basin area.
3.1 Hydrological and meteorological conditions, 2011–2016
Weather conditions varied during the six study years, with 2013 being the driest year, with a mean daily precipitation of 3.7 mm day−1 and an annual total of 1315 mm yr−1. The wettest year was 2015, with mean daily precipitation of 5.6 mm day−1 and an annual total of 2020 mm yr−1. The lowest number of rain days (days with > 1 mm rainfall) (194) during the six study years was recorded in 2013, compared to 229 rain days recorded for 2015. The maximum air temperature at Newport meteorological station during the period was 29 ∘C on the 20 July 2013, and the minimum was −3.1 ∘C on 3 January 2011. The warmest summer over the study period was in 2013 with an average mean temperature of 15.7 ∘C, and the coolest summer was in 2011 with an average of 13.3 ∘C. The coolest winter was in 2014/2015 with an average mean temperature of 5.8 ∘C, and the warmest winter was in 2011/2012 with an average of 7.2 ∘C. The driest summer over the study period occurred in 2013 with 258 mm accumulated rainfall. The driest winter was also in 2012/2013 with 430 mm accumulated rainfall. The wettest summer was in 2012 with 373 mm accumulated rainfall and the wettest winter was in 2015/2016 with 744 mm accumulated rainfall.
A comparison of monthly precipitation values during the 6-year study period with precipitation from the previous 15 years (1995 to 2010) at the Newport station showed that the first two study years, 2011 and 2012, had near-normal precipitation totals (SPI of 1 to −1) with some short moderately wet periods (SPI of 1 to 1.5). However, the period between June 2013 and February 2015 was, when compared to the previous 15 years of data, a notable long dry spell, with SPI values ranging from near-normal to periods of moderately dry (SPI of −1 to −1.5) to extremely dry values (SPI > −2). Following this predominantly dry period, there was a moderate to extreme wet period from February 2015 to August 2015. Precipitation during the remainder of 2015 and 2016 was mostly near-normal (Fig. 2a).
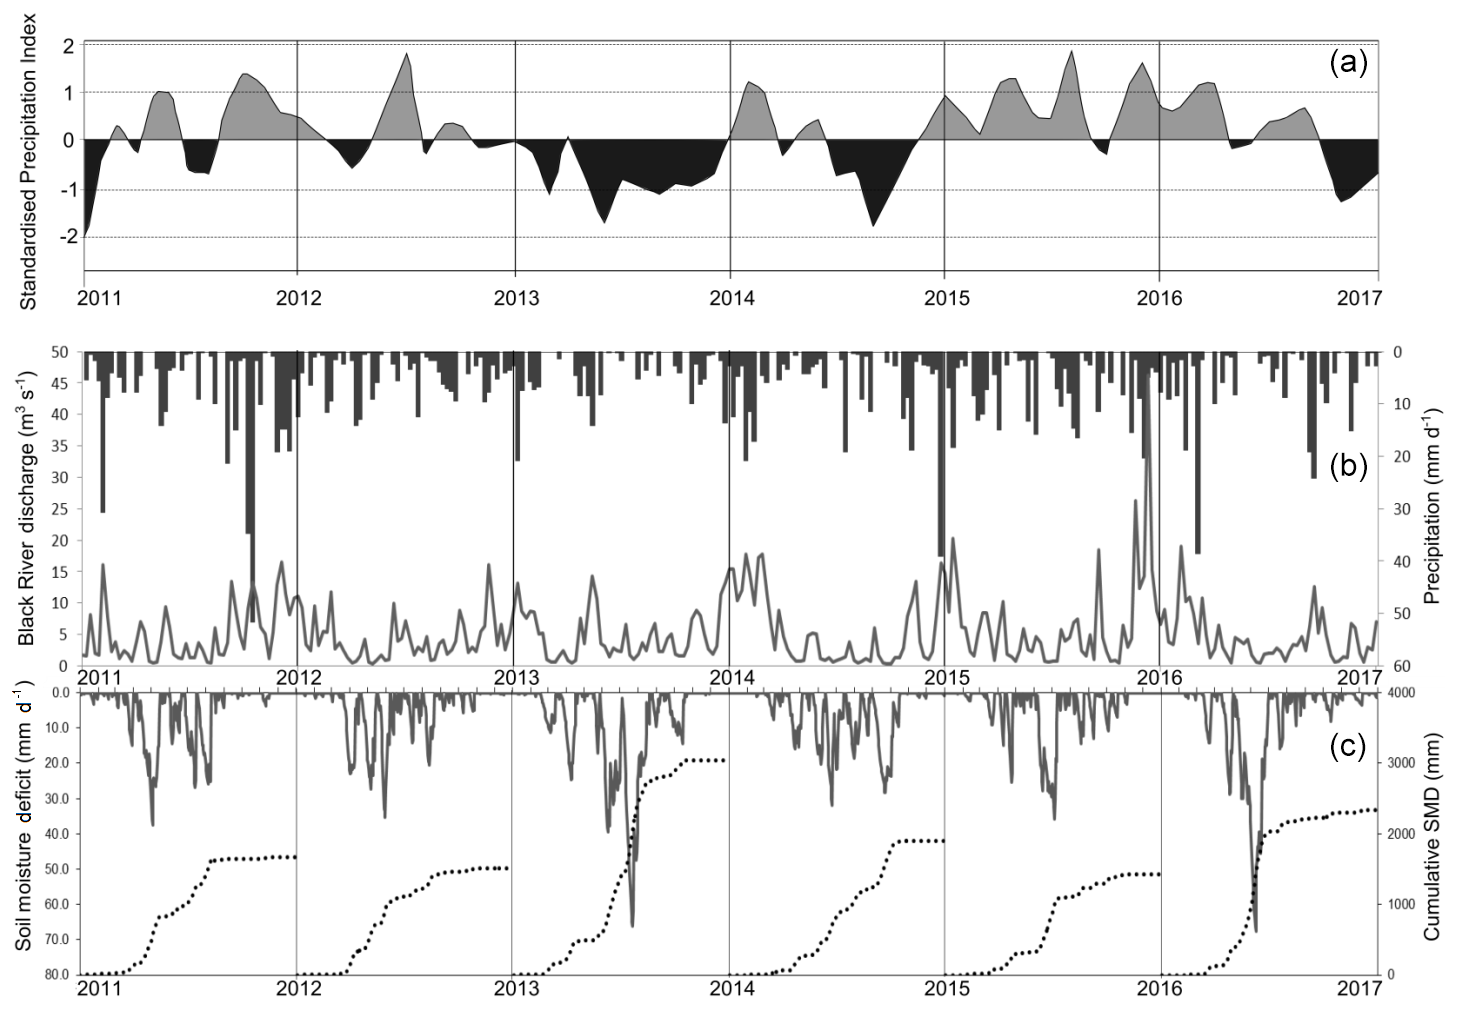
Figure 2Panel (a) shows the 1-month Standardised Precipitation Index (SPI) calculated using precipitation data from the Newport climate station (reference period 1995 to 2010). Periods during which the index is > 1 represent moderately wet conditions, and periods during which the index < −1 indicate moderately dry conditions. (b) Black River discharge (grey line; m3 s−1) and mean precipitation (black bars; mm day−1). (c) Cumulative soil moisture deficit (SMD) per year (mm; dotted line) and actual soil moisture deficit (mm day−1; grey line).
The mean stream water discharge rates for the three rivers during the study period were 1.89, 0.84 and 0.36 m3 s−1 for the Black, Glenamong and Srahrevagh rivers respectively, reflecting the difference in area for the three catchments, as well as the higher precipitation in the Black. Values greater than the 90 % percentile of discharge for the Black River were > 4.47 m3 s−1, while those less than the 10 % percentile were < 0.26 m3 s−1 (Fig. 2b). The highest discharge recorded during the study period for all three rivers occurred on the 5 December 2015, with flows of 40.6 m3 s−1 recorded for the Black River, 31.8 m3 s−1 for the Glenamong and 9.2 m3 s−1 for the Srahrevagh. These exceptional flows occurred during Storm Desmond, a 1000-year return event and one of a series of storms that tracked across the country during a 14-week cyclonic episode that began in early November 2015, which brought severe, extensive and protracted flooding to much of Ireland, Scotland and northern England (Marsh et al., 2016).
The pattern in soil moisture deficit (SMD) varied considerably over the six years, largely reflecting the varying volumes of precipitation over the catchment each year. The year with the greatest cumulative SMD was 2013, with an average daily deficit of 8.3 mm. The cumulative SMD reached a maximum of 66.2 mm in July. The least accumulated deficit occurred in 2015 with an average of 3.9 mm, with a maximum of 35.7 mm recorded in July. The maximum daily SMD recorded over the study period was 67.6 mm day−1, which occurred in June 2016; however the average daily deficit for that year was 6.4 mm day−1 (Fig. 2c).
3.2 Colour concentrations in the three rivers
The colour concentration showed a strong synchronous annual pattern for all sub-catchments, dipping to a minimum during the winter and peaking in late summer to early autumn (Fig. 3a). The Srahrevagh River had the highest colour concentrations, with a median colour concentration of 130 mg Pt Co L−1, and the Glenamong River had the lowest concentrations, with a median of 84 mg Pt Co L−1, while the Black River had median values intermediate between these two of 95 mg Pt Co L−1. Overall, the median colour measurements in the Srahrevagh River were significantly higher than those measured in the Glenamong River (Mann–Whitney U test, W=20 317, p< 0.01) and Black River (Wilcoxon signed rank test, V=892.5, p< 0.01). Colour in the Glenamong River was also marginally significantly lower than that measured in the Black River (Mann–Whitney U test, W=37 604, p< 0.05).
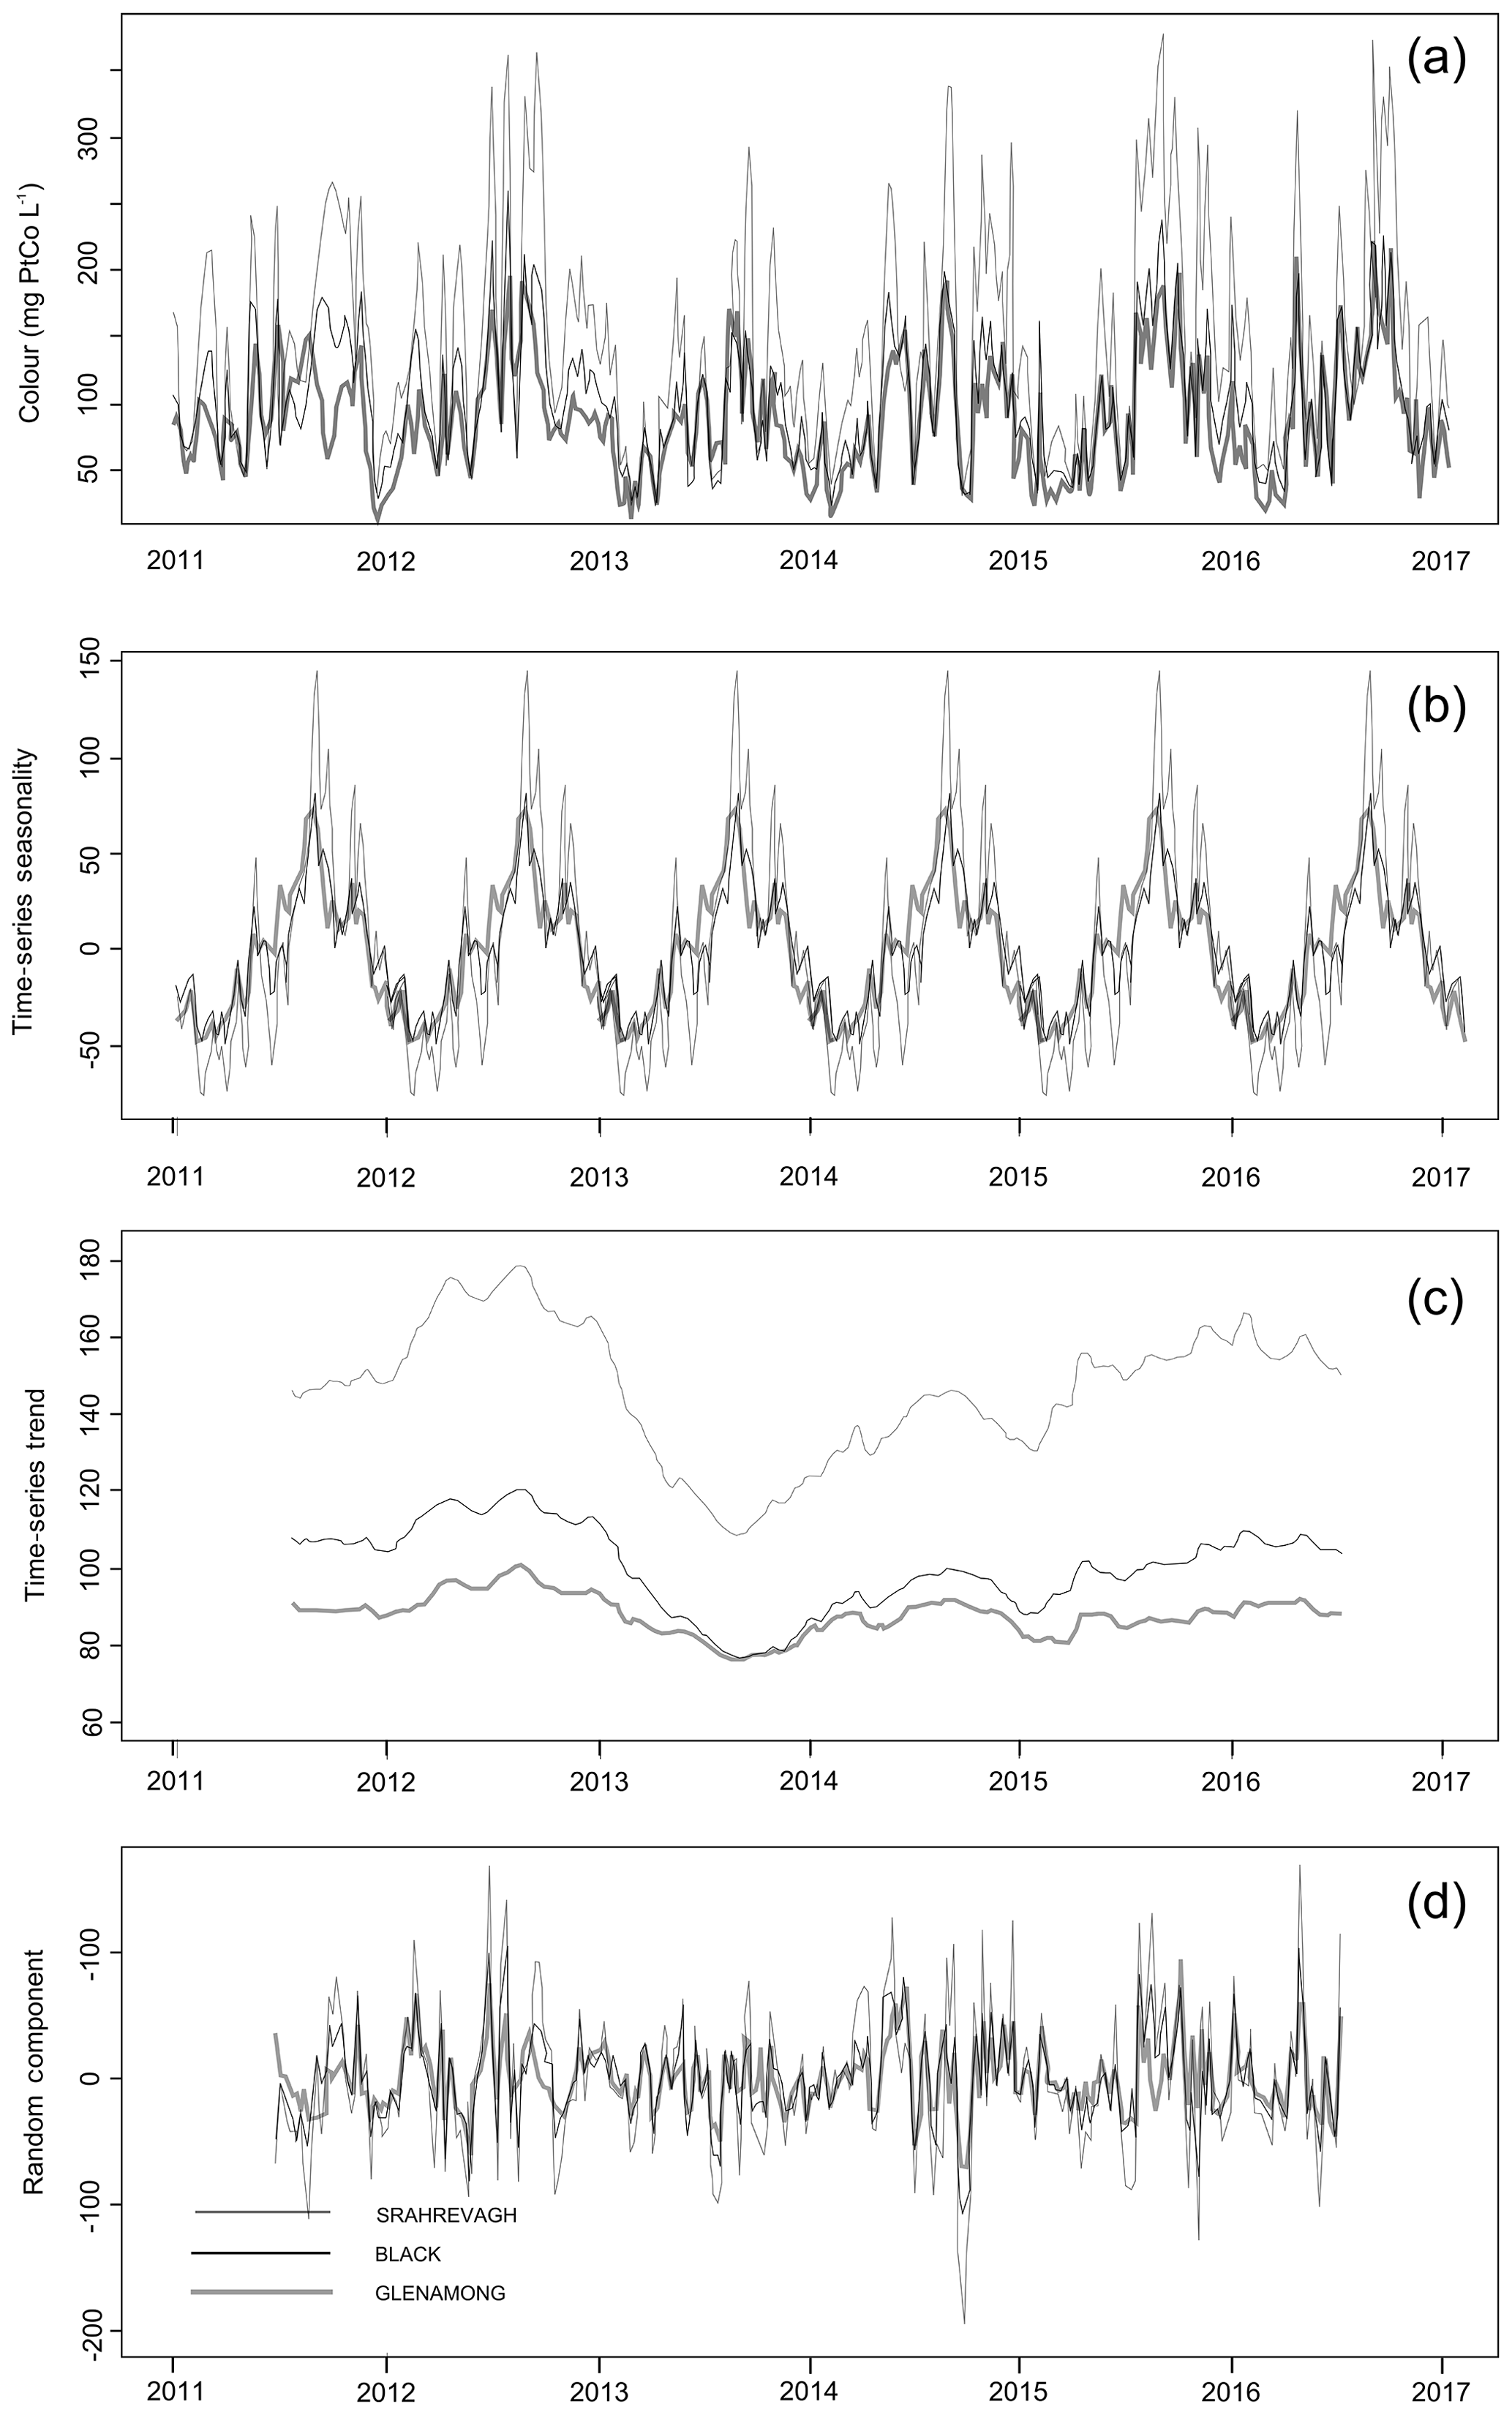
Figure 3(a) Time series of colour concentrations (mg PtCo L−1) measured weekly in the Black, Glenamong and Srahrevagh rivers from 2011 to 2017. Decomposition of the weekly water colour concentrations to the (b) inter-annual trend, (c) seasonal component and (d) random component.
The inter-annual trend in colour concentration (Fig. 3b) was also synchronous across all three sub-catchments. There was a peak during the summer of 2012 before it descended to a minimum for all three catchments in the late summer and early autumn of 2013. The trend generally increased from this low point to the beginning of 2016, with the exception of a minor dip in colour concentration in January 2015. The seasonal patterns were also almost identical for all three sites (Fig. 3c), with highest concentrations in late summer and lowest values in January and February of each year. The Srahrevagh again displayed the greatest range of seasonal variation, and the seasonal variation of the Black and Glenamong was largely similar. The decomposed random component of the colour time series (Fig. 3d) also displayed a broad synchronicity in timing across all three sub-catchments over the six years, indicating that the mechanisms controlling short-term spikes and dips in colour were also synchronous across all three sub-catchments. Similar to the pattern of the seasonal variation, the greatest range of variation in the random component was from the Srahrevagh River (−200 to 169), while the range of variation in the other two rivers was broadly similar (−109 to 107 and −71 to 96 for the Black and Glenamong respectively).
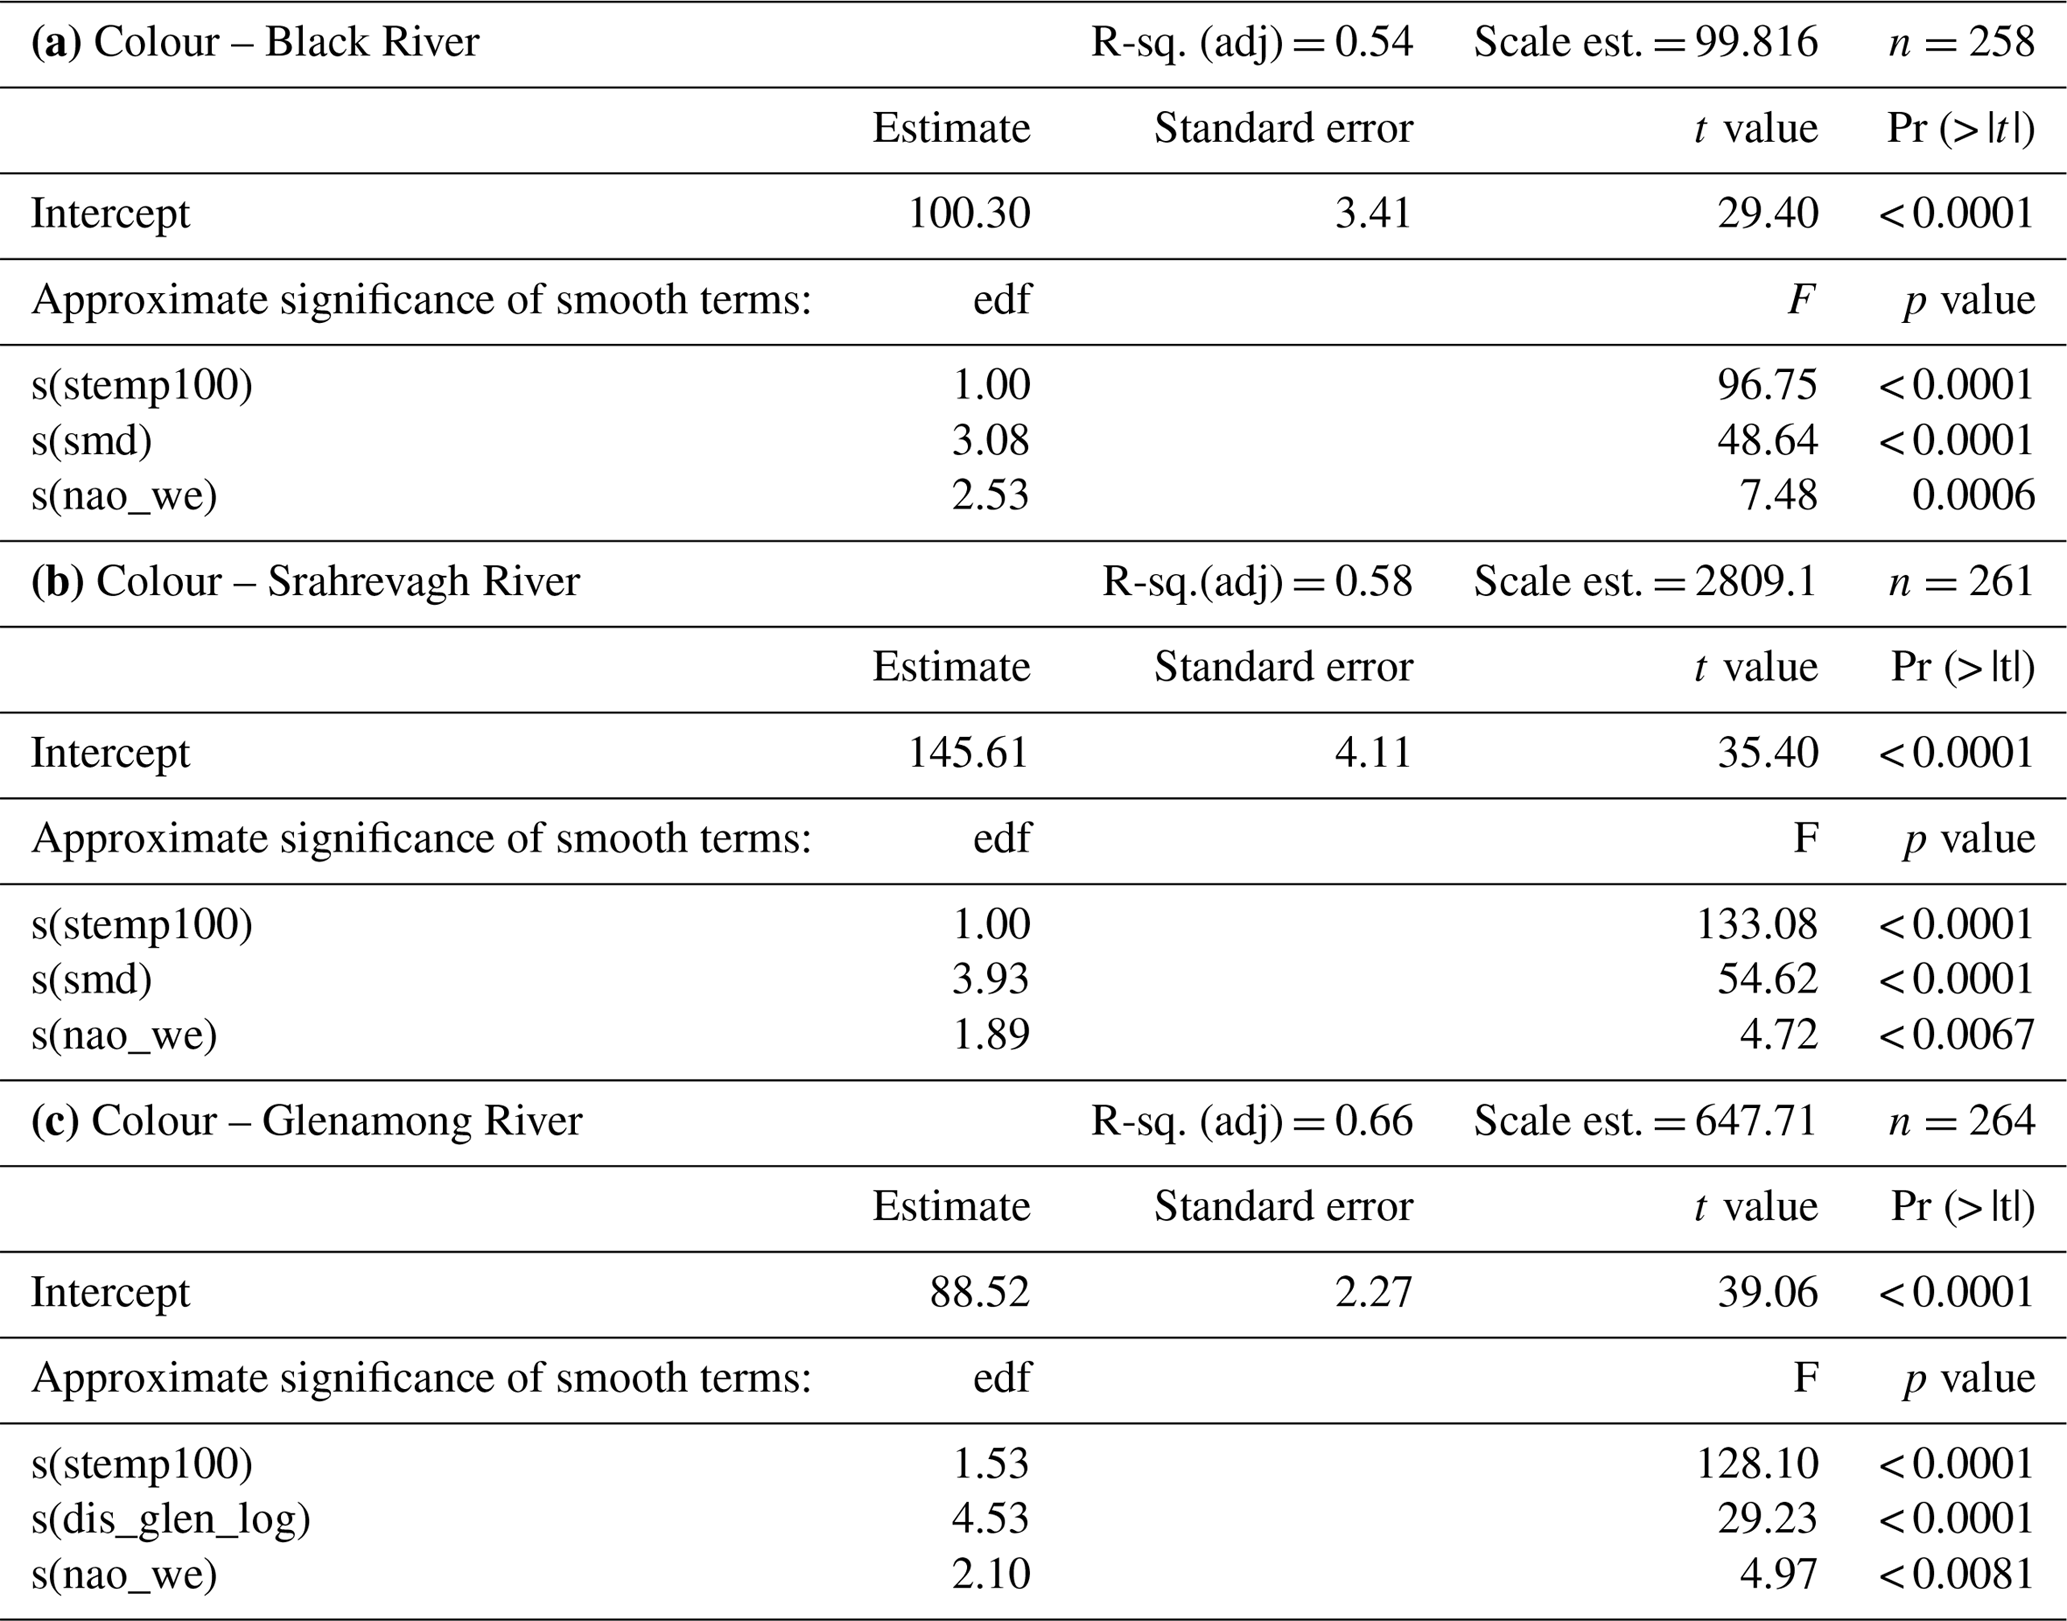
Table 2Results of generalised additive mixed models (GAMMs) applied to colour in the Black River (a), the Srahrevagh River (b) and the Glenamong River (c) between 2011 and 2016. The (s) refers to the scaled smoother for each explanatory variable. Stemp100 refers to soil temperature at 100 cm depth, smd refers to soil moisture deficit, dis_glen_log refers to the log of the discharge of the Glenamong River and nao_we refers to weekly mean values of the NAO index; edf is the estimated degrees of freedom.
3.3 Drivers of water colour variation
The optimal GAMM for the colour in the Black River included three smoothers, soil temperature at 100 cm depth, soil moisture deficit, and the weekly mean NAO (Fig. 4). This model explained 54 % of the deviance in water colour over the study period (Table 2). Explanatory variables that were measured on the day of sampling resulted in a better model fit than weekly means for the previous week. Lagging the explanatory variables by 1, 2 and 4 weeks did not improve the model. The smoother explaining the relationship between soil temperature and colour was linear in the model (estimated degrees of freedom of 1) and positive, indicating that colour increases with increasing temperature. The smoother describing the relationship between colour and soil moisture deficit was, in contrast, generally negative, indicating that colour concentrations in the river decreased with increasing SMD, while notably that describing the relationship between NAO and colour indicated that colour decreased in positive phases of the North Atlantic Oscillation. The optimal GAMM for the Srahrevagh River had the same three smoothers as the Black, soil temperature at 100 cm, SMD and the weekly NAO (Fig. 4), and the model explained 58 % of the deviance in water colour over the study period (Table 2). Again the subset of explanatory variables that were measured on the day of sampling provided the optimum model. The smoothers in the Srahrevagh River model also showed the same patterns in relationship to colour, i.e. a positive relationship between colour and soil temperature and a negative relationship between SMD and the weekly NAO.
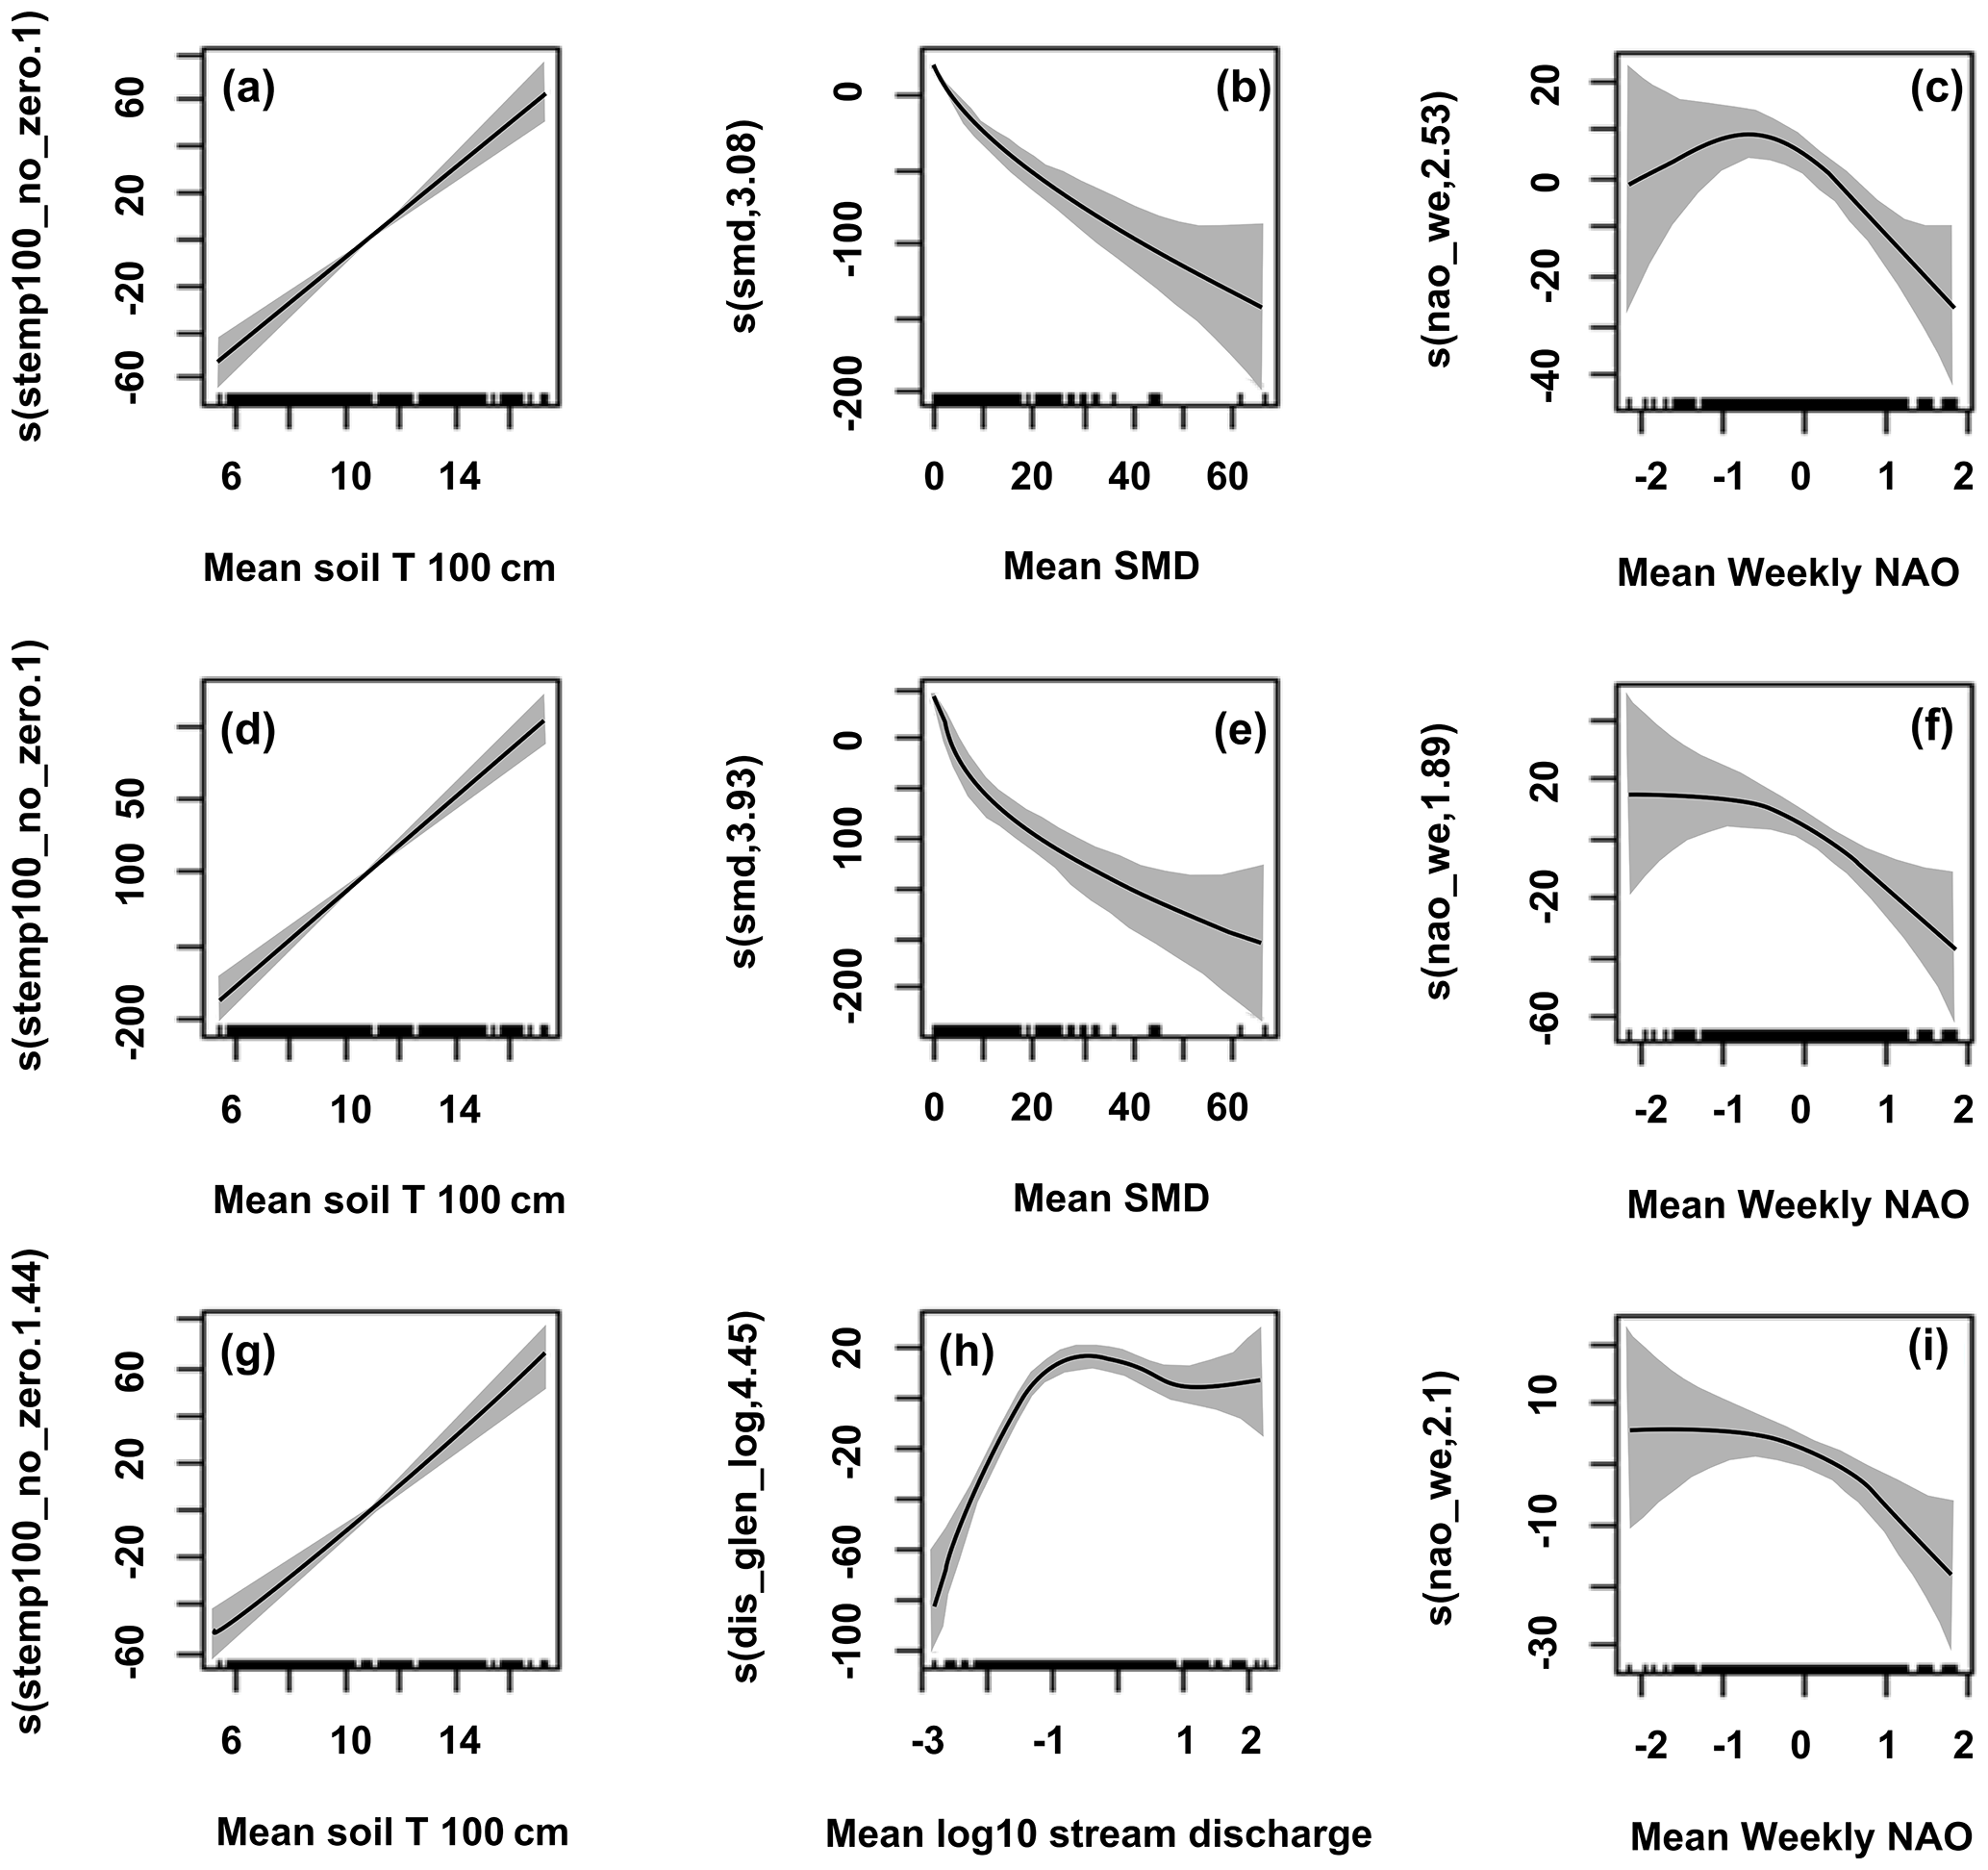
Figure 4Selected smoothers for the contribution of explanatory variables for the optimal GAMM explaining water colour in each sub-catchment river: Black (a–c): (a) soil temperature, (b) soil moisture deficit (SMD) and (c) NAO; Srahrevagh (d–f): (d) soil temperature, (e) soil moisture deficit and (f) weekly NAO; Glenamong (g–i): (g) soil temperature, (h) log of discharge and (i) NAO. The solid line is the smoother, and the shaded area shows the 95 % confidence bands. The y axis units are the scaled smoother (s) for each explanatory variable with the variable name followed by the estimated degrees of freedom within the parentheses.
The optimal GAMM for colour in the Glenamong River also had three smoothers but differed in that it included the log of river discharge rather than SMD (Fig. 4). The model explained 66 % of the deviance in water colour over the study period (Table 2), with again the subset of explanatory variables that were measured on the day of sampling providing the optimum result. The shape of the smoother describing the relationship between colour and discharge indicated that colour concentrations in the river increased to a point and then stabilised at higher discharges. The smoother describing the relationship between the NAO and colour was similar to that found in the other two models and decreased for positive phases of the North Atlantic Oscillation (Fig. 4g). The models described above produced the optimum R2 values for the set of explanatory variables chosen. It is important to note that the log of river discharge was also found to be a significant variable in the models for the Black and Srahrevagh; however, as it was correlated with SMD both explanatory variables could not be used within the same model. When the SMD was used instead of the log of discharge for the Black and Srahrevagh, the revised optimum model variables still included soil temperature and the NAO in both cases with log of discharge but explained only 48 % and 47 % of the variance respectively. Conversely, SMD was found to be significant when swapped with the log of river discharge in the Glenamong model; however, the R2 value reduced slightly to 64 % from the optimum value of 66 %.
Of note also was the relative importance of the explanatory variables in each of the models. For example, in the optimum model for the Black sub-catchment, out of the total of 54 % of the variance explained by the model, soil temperature contributed 34 %, SMD contributed 17 % and the NAO contributed 3 %. For the Srahrevagh, out of the 58 % total, soil temperature contributed 40 % of the variance, SMD contributed 16 % and the NAO contributed 2 %. Out of the 66 % total of explained variance for the Glenamong, soil temperature contributed 52 %, the log of river discharge contributed 11 % and the NAO contributed 3 %. The multi-annual trend plots for the NAO, soil temperature, discharge and water colour all had similar patterns that included a distinct dip in the period from late 2012 to mid-2013 and a general upward trend after these low points (Fig. 5). These low points were sequential for the different variables, with the dip in the NAO occurring in the early winter of 2012, that in soil temperature occurring in early 2013 and that in mean colour concentrations (mean based on data for all three sites) in midsummer 2013. The trends for river discharge, here using the Glenamong as an example, had a less defined low point, which ran from early summer to midsummer 2013 (Fig. 5c). The trend in SMD displayed a distinct plateau for each year, with 2013 having the highest levels and 2015 the lowest levels (Fig. 5d).
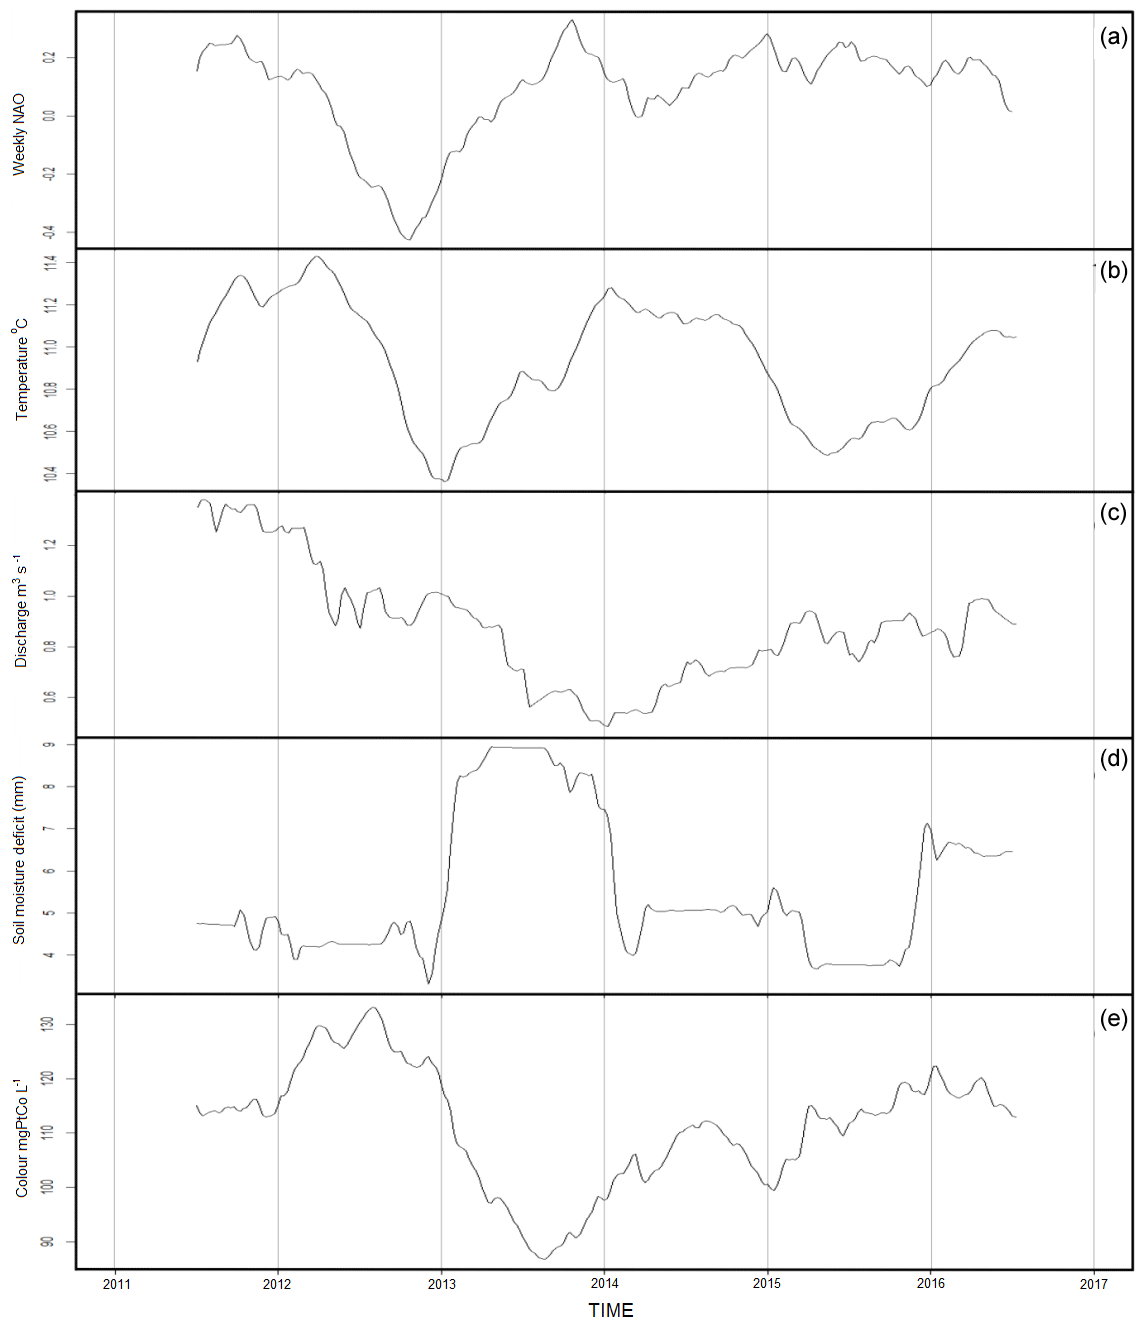
Figure 5(a) Trend of weekly NAO during the study period, (b) trend of weekly soil temperature, (c) trend of weekly discharge in the Glenamong River, (d) trend of weekly soil moisture deficit (SMD) and (e) trend of mean weekly mean colour concentration in the three sub-catchment rivers.
3.4 Cross-wavelet power analysis
In the cross-wavelet analysis, there was a significant common power between river colour at the annual (52 week) timescale for all four variables, with additional significant zones occurring intermittently at higher frequencies (ca. 2–16 weeks) that were most notable for SMD and for the NAO (Fig. 6). For soil temperature, the width of the orientation at the annual time step was relatively consistent with phase arrows that all pointed right; i.e. there was a positive correlation between soil temperature and river colour that was consistent at the annual scale (Fig. 6a). The orientation of the phase arrows (i.e. downward) for stream discharge indicated that river colour was leading river discharge by 90∘, indicating they both had seasonal cycles in which river colour peaked half an annual cycle before river discharge. The orientation of the phase arrows for the NAO, in contrast, showed a consistent anti-phase or negative correlation with river colour at an annual time step. Notably this weakened between weeks 100 and 150, i.e. during 2013. For SMD (Fig. 6b) the orientation of the phase arrows at the annual time step, in contrast, showed SMD leading river colour by 90∘; therefore, colour peaked half an annual cycle after a peak in SMD. The areas of common power with river colour at higher frequencies (i.e. at periods of 2 to 16 weeks) were most notable for SMD: these were predominantly negative and occurred during summer periods, when SMD was higher. There were also regular areas of common power at frequencies between 2 and 16 weeks between the NAO and river water colour; however their phase relationship was variable from area to area, with no consistent pattern.
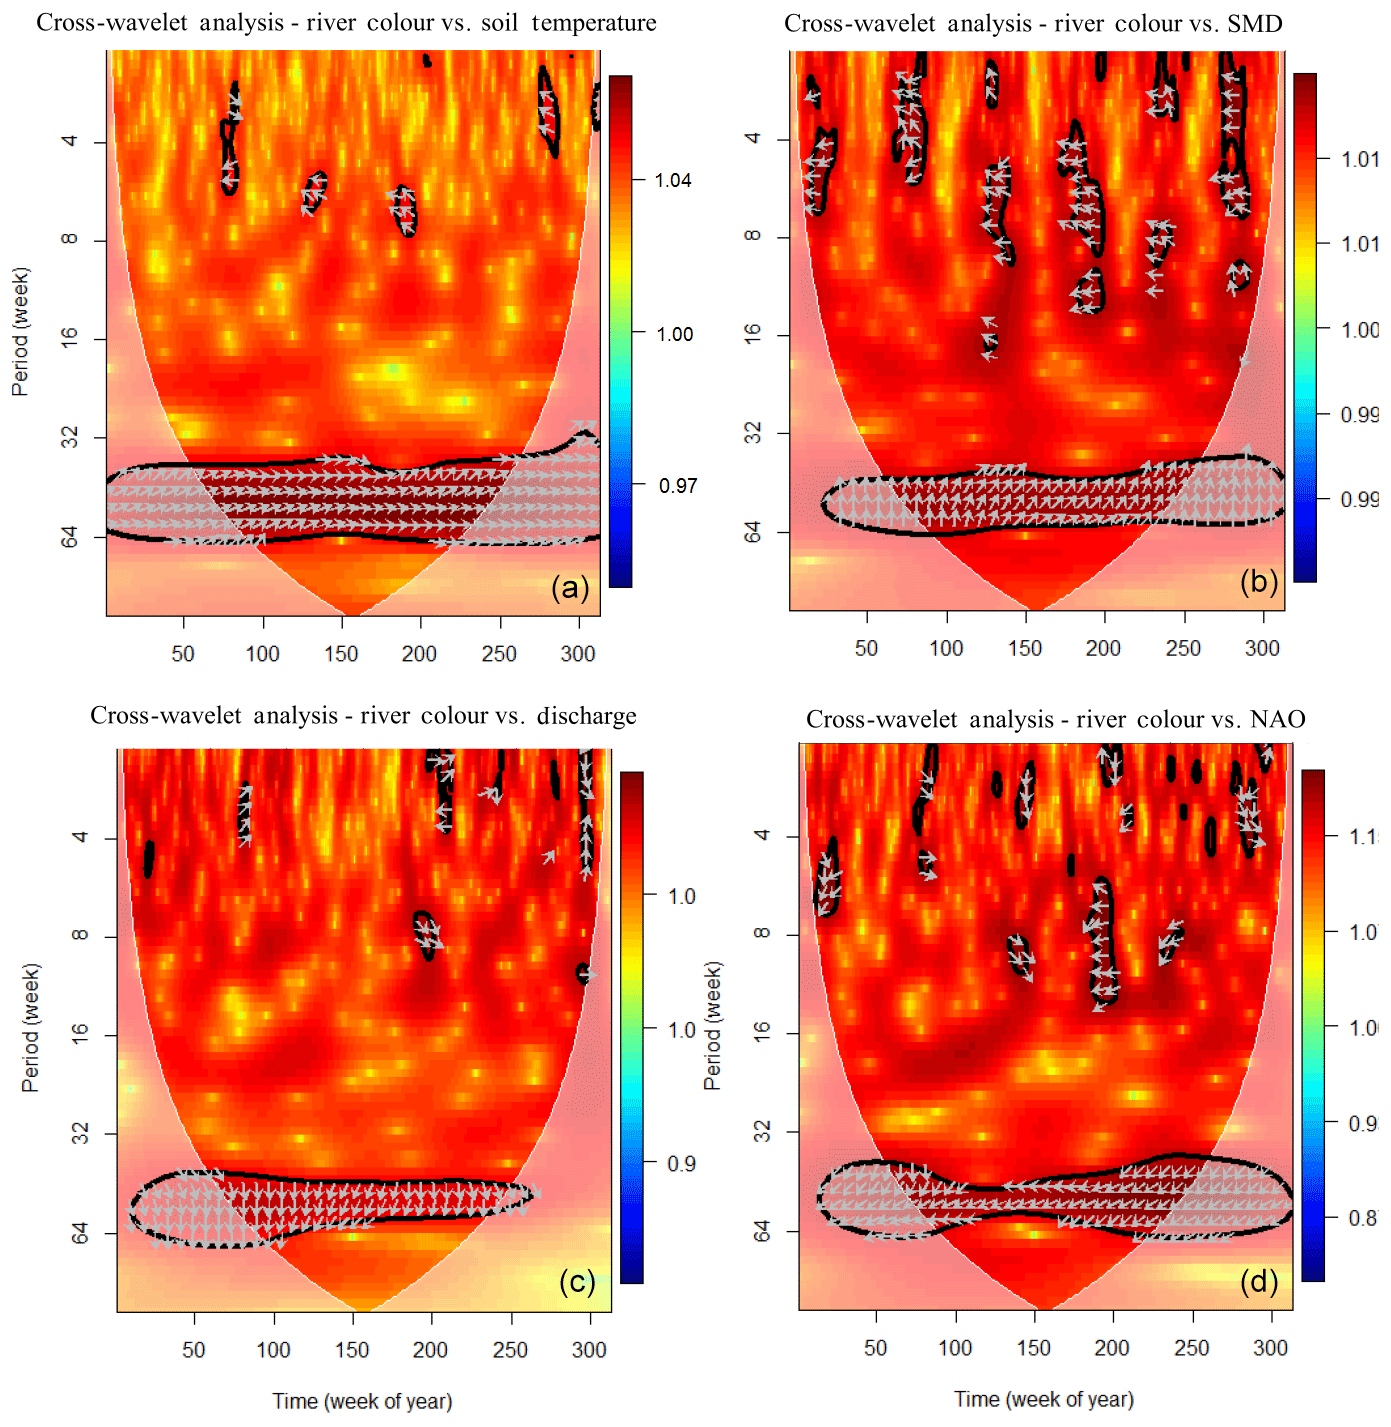
Figure 6Cross-wavelet power spectrum of soil temperature at 1 m depth (a), soil moisture deficit (SMD) (b), river discharge in the Glenamong (c) and NAO (d) with river colour. Colour contours represent cross-wavelet power, and vectors indicate the relative phase relationship between the two time series (with in-phase pointing right, anti-phase pointing left, or a variable leading or following river colour by 90∘ pointing straight down or up). The 5 % significance level is shown as a thick contour. Pink regions on either end indicate areas where the analysis is unreliable as there are no data before and after the study period.
3.5 Estimated DOC loads from the sub-catchments
There was a wide range in the annual estimated loads exported from the three sub-catchments over the six study years, both at an annual and seasonal scale (Table 3). The higher colour concentrations in the Srahrevagh River translate into the highest DOC exports of any of the sub-catchments, even when the loads are area-weighted. The highest annual load was estimated for the Srahrevagh in 2015 (38.6 t C km2 yr−1), while the lowest was recorded in the Glenamong in 2013 (11.6 t C km2 yr−1). The smallest loads across all sub-catchments were recorded in 2013. Based on these data (the sum of the Black and Glenamong loads), a total of 5898 t of DOC was exported into Lough Feeagh during the six study years. In other words, just under 1000 t of DOC is transferred from land to water in the Burrishoole catchment every year.
Table 3Estimated DOC load (t C km2 yr−1) from the Black, Srahrevagh and Glenamong catchments between 2011 and 2016. Seasonal loads are linked to the years in the table header. Winter (D, J, F) stands for December, January, February, etc.
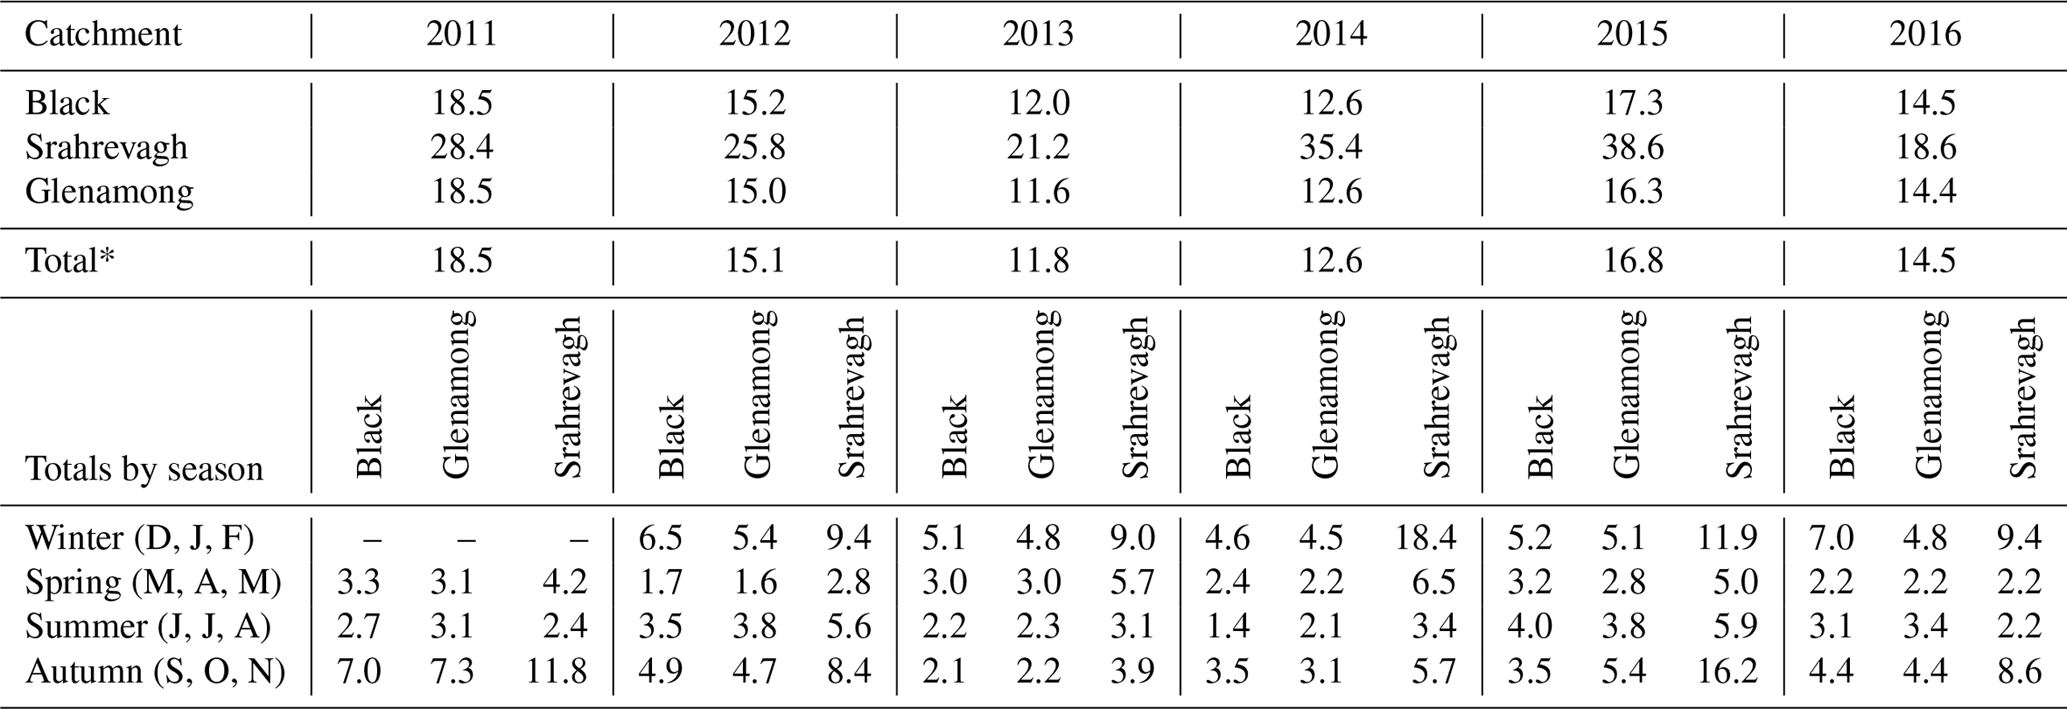
* Totals were calculated as the area-weighted average for the Black and Glenamong sub-catchments only (which are in-flows to Lough Feeagh, the main lake shown in Fig. 1).
This study highlighted the dominant influence of local and regional climate on water colour as a proxy for DOC levels. Weather-related factors explained between 54 % and 66 % of the variability in all three sub-catchment datasets, and there was strong synchronicity in these climate signals across the Burrishoole catchment. It also showed, however, that despite this synchronicity, colour concentrations in one sub-catchment (the Srahrevagh) were significantly higher than the other two monitoring sites, a difference that was consistent over seasons and the six years of the study. Colour, and therefore DOC, in these headwater rivers probably originates almost exclusively from the surrounding catchment soils, and the consistent difference in colour concentrations between each sub-catchment during the study was most likely a function of individual sub-catchment properties such as the extent of peat within catchments (Hope et al., 1997a), land use (Findlay et al., 2001), local run-off (Dillon and Molot, 2005), vegetation type (Sobek et al., 2007) and the unique morphology and geology of the sub-catchment landscape (Moore, 1998). Forestry is also known to influence DOC release from soils, and it has been observed that both afforestation and forest clearfelling result in increased DOC concentrations and that these increases may continue for several years after the initial event (Cummins and Farrell, 2003; Schelker et al., 2012). The extent of peat soils in the study catchments, the length of streams intersecting the peat, slope analysis and CORINE land cover may explain the higher levels of colour found in the Srahrevagh. However, an additional factor could be the distance between a given sampling point and the source of any coloured compounds. Dawson et al. (2002) previously observed decreases in TOC (both DOC and POC) concentrations in the Upper Hafren (a headwater stream in mid-Wales) downstream from the source that were stated to be related to a decrease in peat depth with altitude, combined with in-stream processing of DOC. A similar process may contribute to the difference in concentration between the upstream Srahrevagh and downstream Black sampling points, although there are other studies that reported no clear decrease in DOC concentration as water travelled downstream (Temnerud and Bishop, 2005; Creed et al., 2015; Winterdahl et al., 2016).
4.1 Local climate effects
The local climate effects identified in this study included strong positive linear correlations between colour concentrations in the three rivers and soil temperature. There was also a consistent positive relationship between soil temperature and colour at the annual scale in the cross-wavelet analysis. Soil temperature was common to all three GAMMs, and so was the dominant explanatory variable, emphasising how dissolved organic carbon is released by peat soils via decomposition processes that are temperature-dependent (Christ and David, 1996; Neff and Hooper, 2002). This temperature effect is complicated, however, by an interaction between peat decomposition and the water table level. Peat soils during low-water-level conditions show increased rates of decomposition, brought about by changes in the oxygen status within the peat and subsequent changes in the microbial community structures within the soil (Mäkiranta et al., 2009). The lowered water table reduces the hydrological connection, i.e. the transport of DOC along active flow pathways in the soil. This breaks the connection between the source of DOC production and its eventual destination. Increasing temperature, therefore, will increase DOC production in the peat but only if the increase in temperature does not result in a large drawdown of the water table. The strong relationship displayed between soil temperature and water colour concentrations in the three rivers, and the significant and high common power with river colour at the yearly timescale in the cross-wavelet analysis, indicated that soil temperature was the primary driver of the seasonal pattern in water colour during the study period in this catchment. It is interesting to note that in general no relationship between seasonality and DOC concentration has been reported in some other studies (e.g. Winterdahl et al., 2014). However, these results are consistent with observations of DOC dynamics in some surface waters, whereby seasonal variation has been found to be the largest source of DOC variation in catchments with high DOC concentrations (Clark et al., 2010b; Ryder et al., 2014). Of note were also the strong similarities in the pattern in multi-annual trends of river colour and soil temperature, particularly in the first four years of the study when the pronounced sequential dip was observed in temperature and then in water colour, indicating, as might be expected, that temperature also acts at a multi-annual scale.
The relationship of colour with SMD in the Black and Srahrevagh optimal GAMM models indicated that as soil moisture decreased, DOC concentrations also decreased. The cross-wavelet analysis indicated a significant continuous relationship at a yearly time step when SMD led colour by 90∘; that is, colour peaked after higher SMDs. More notably there were intermittent, shorter periods during the summer months in which the relationship between the two variables was consistently negative, in line with the GAMM results. The multi-annual trends in decomposed colour concentrations and SMD over the study period also broadly confirmed this negative relationship, whereby lower colour concentrations corresponded with higher values in SMD. A drought effect has previously been reported in the Glenamong catchment, whereby low DOC concentrations in the river were associated with an extremely dry winter and spring during 2010 (Ryder et al., 2014). Hydrology has a direct control on DOC via its influence on soil residence time and transfer from soil to stream. For example, the transfer from more lateral drainage routes to vertical pathways with decreasing precipitation would consequently increase the potential for adsorption of DOC by ion exchange complexes in mineral soil horizons (Moore and Jackson, 1989). There are also indirect effects of hydrology on DOC concentrations such as the availability of water for biogeochemical cycling, biological production and chemical controls on solubility (Clark et al., 2010a). Decreased DOC export has been observed from peat soils during drought conditions under which the drawdown of the water table causes the oxidation of organic sulfur to sulfate (Clark et al., 2005; Daniels et al., 2008). This drought-induced soil water acidification reduces DOC solubility in soil water and therefore concentrations. However, immediately following periods of dry weather or drought, pronounced increases in DOC concentrations have been observed in peatland streams (Watts et al., 2001). Ryder et al. (2014) also reported a significant step-change increase in DOC concentrations in the Glenamong sub-catchment during moderately wet conditions during the summer of 2010 following a very dry spring that year.
River discharge was a significant explanatory variable in the optimum model for the Glenamong, and in alternative models for the Black and the Srahrevagh rivers, further emphasising the complex effects of hydrology on colour, and therefore DOC concentrations, in the catchment. The reasons why river discharge superseded SMD as an explanatory variable for the Glenamong are likely to be its more westerly location, with higher precipitation, and more mountainous topography. The effect of precipitation has been shown to operate at sub-catchment spatial scales and short temporal scales in the Burrishoole catchment. De Eyto et al. (2016) described the effects of an intense episodic rainfall event on the ecology of Lough Feeagh, whereby anomalous high amounts of rain fell in the east side of the catchment (the Black and Srahrevagh), while relatively moderate amounts were recorded in the west (the Glenamong). However, that event was not associated with any increase in water colour, while in contrast, Jennings et al. (2012) described a large increase in DOC concentrations in the Glenamong during increased precipitation in summer 2006. Short-duration high discharge events were also less likely to have been picked up in the weekly sampling regime of the current study. The GAMM smoother for colour concentration in the Glenamong versus discharge showed that colour increases with increasing discharge to an optimum point where it levels off and even decreases slightly at very high discharges. The cross-wavelet time-series analysis between river colour and river discharge in the Glenamong indicates a significant continuous relationship at a yearly time step, with colour concentrations leading discharge by 90∘. This high common power relationship is however unlikely to be causal, since colour cannot result in changes in discharge, but it emphasises the co-occurrence of seasonal patterns in both datasets.
4.2 Regional climatic effects and the NAO
The current study indicated variable results for the effect of NAO on water colour. There was a negative relationship with the NAO indicated in both the GAMMs, and in the common power at an annual time step in the cross-wavelet analysis, but also a lagged positive effect indicated in the plots of the multi-annual trends. The effects of the NAO on the local climate and lake water temperatures have previously been described for the Burrishoole catchment (Jennings et al., 2000; Blenckner et al., 2007). Jennings et al. (2000) reported that a range of meteorological variables at two lake sites in the west of Ireland (Lough Feeagh, Co. Mayo, and Lough Leane, Co. Kerry) were influenced by the winter NAO, including positive relationships with mean winter air temperature and surface water temperature, mean winter wind speed and winter rainfall. These relationships were also apparent but to a lesser degree in the following spring and summer. Kiely (1999) also showed that positive phases of the winter NAO led to increased run-off in Irish rivers. During the construction of the GAMMs, both the weekly and monthly NAO index values were tested in the analysis. The models using the weekly data consistently explained more of the deviance in the model. This most likely reflects the proximity of the site to the Atlantic coast and the time frame over which weather systems associated with the NAO pressure difference generally reach the study location. Although the weekly NAO improved the optimum models by only between 2 % and 4 %, it was significant at the 99.9 % level in all of the models. The smoothers for the weekly NAO in the GAMMs indicated that colour decreased during positive phases of the NAO. This appears to be contrary to the literature for more northern sites, whereby DOC has been shown to increase during positive NAO phases, a relationship that has been linked to higher winter precipitation (Arvola et al., 2004; Nõges et al., 2007). However, some studies have also suggested that positive phases of the NAO during the summer are associated with warm and dry rather than warm and wet conditions over north-west Europe, in particular the UK and much of Scandinavia (Folland et al., 2008). It is possible that this negative relationship was reflected in the strong effect of SMD on colour in the current study. However, the negative relationship apparent in the cross-wavelet time-series analysis at the annual time step may also merely reflect the fact that both time series have seasonal patterns but are not linked by any causal mechanism. Examination of the multi-annual trend of the decomposed NAO values also showed a large and sustained swing in the index to negative values, beginning in late spring 2012 until spring 2013, with a subsequent return to positive values. Negative NAO values during the winter generally correspond to relatively cold and dry conditions, and dry weather was observed throughout 2013, reflected in the SPI, beginning during the winter of 2012/2013. Cold conditions were also confirmed by the sharp dip in the multi-annual trend of soil temperature observed during the same winter period. This overall trend was mirrored in the pattern in water colour but lagged by ca. 6 months, suggesting that the NAO actually has a lagged but positive effect on water colour at this timescale. Further analysis with a longer multi-annual dataset would be required to explore the effect of the NAO on water colour and therefore DOC export at this site.
4.3 Carbon export from the sub-catchments
The minimum annual total DOC load from the Burrishoole catchment was 11.8 t C km2 yr−1 in 2013, while the maximum was 18.5 t C km2 yr−1 in 2011, giving a range of 6.7 t C km2 yr−1 during the study period. This considerable variability in total annual load from the Burrishoole catchment was most likely linked to climate variability over the study period. For example, the driest year of the study period, 2013, displayed the minimum yield. The estimated annual yields reported here are broadly in line with the 9.5 and 13.7 t C km2 yr−1 estimated DOC export from the Glenamong sub-catchment in 2010 and 2011 respectively (Ryder et al., 2014) and broadly within the ranges reported in other studies from peatland catchments (Clark et al., 2007; Koehler et al., 2009; Naden et al., 2010).
4.4 Conclusions
The results of this study emphasised how colour concentrations, and therefore DOC levels, respond to common climatic drivers which operate at both a local and regional scale. In the Burrishoole catchment, temporal changes in stream colour levels were driven by variation in soil temperature, by hydrology (discharge and/or SMD) and by the NAO, an overarching regional climate pattern. These effects lead directly to variability in aquatic DOC concentrations in the sub-catchments that will ultimately affect the carbon budget of the downstream receiving waters of Lough Feeagh. The results presented here serve to further strengthen the well-established link between climate and aquatic carbon concentrations in peatland catchments and the vulnerability of blanket peatlands to climate change.
The underlying research data can be found in Doyle et al. (2018).
BD, MD, ED and ER collected the field data. MD maintained all of the field equipment and measuring infrastructure. BD, ER and MD carried out lab calibrations and analysis. RP manages the long-term ecological monitoring program in Burrishoole. ED, VM and EJ supervise BD's doctoral work and contributed technical advice and guidance throughout the project implementation. EJ attained the grant award. BD collated and analysed the data and wrote the first draft of the paper with contributions from EJ and ED. All other authors contributed during the paper writing stages.
The authors declare that they have no conflict of interest.
This study was supported by the Marine Institute's Cullen PhD fellowship and
core research and development programmes, grant no. CF/15/05. We would like to thank the local landowners for allowing access to
the rivers and providing sites for monitoring stations. Acknowledgement is
also due to the staff at the Marine Institute, Furnace, Co. Mayo, and the
Dundalk Institute of Technology, Dundalk, Co. Louth, without whom this work
would not have been possible.
Edited by: Tom
J. Battin
Reviewed by: two anonymous referees
Arvola, L., Raike, A., Kortelainen, P., and Jarvinen, M.: The effect of climate and landuse on TOC concentrations in Finnish rivers, Boreal. Environ. Res., 9, 381–387, 2004.
Aslyng H. C.: Evaporation, evapotranspiration and water balance investigations at Copenhagen 1955–64, Acta Agr. Scand., 15, 284–300, 1965.
Bain, C. G., Bonn, A., Stoneman, R., Chapman, S., Coupar, A., Evans, M., Gearey, B., Howat, M., Joosten, H., Keenleyside, C., Labadz, J., Lindsay, R., Littlewood, N., Lunt, P., Miller, C. J., Moxey, A., Orr, H., Reed, M., Smith, P., Swales, V., Thompson, D. B. A., Thompson, P. S., Van de Noort, R., Wilson, J. D., and Worrall, F.: IUCN UK Commission of Inquiry on Peatlands, IUCN UK Peatland Programme, Edinburgh, UK, 2011.
Beguería, S., Vicente-Serrano, S. M., Reig, F., and Latorre, B.: Standardized precipitation evapotranspiration index (SPEI) revisited: parameter fitting, evapotranspiration models, tools, datasets and drought monitoring, Int. J. Climatol., 34, 3001–3023, 2014.
Blenckner, T., Adrian, R., Livingstone, D. M., Jennings, E., Weyhenmeyer, G. A., Nic Aonghusa, C., George, D. G., Jankowski, T., Järvinen, M., Nõges, T., Straile, D., and Teubner, K.: Large-scale climatic signatures in lakes across Europe, a meta-analysis, Glob. Change Biol., 13, 1313–1314, 2007.
Brereton, A. J., Danilov, S. A., and Scott, D.: Agrometerology of grass and grasslands in middle latitudes, Technical note no. 197, World Meterological Organization, Geneva, Switzerland, 36 pp., 1996.
Chatfield, C.: The analysis of time series: an introduction, Chapman and Hall, London, UK, 286 pp., 1984.
Christ, M. J. and David, M. B. Temperature and moisture effects on the production of dissolved organic carbon in a Spodosol, Soil Biol. Biochem., 28, 1191–1199, 1996.
Clair, T. A., Dennis, I. F., Vet, R., and Laudon, H.: Long-term trends in catchment organic carbon and nitrogen exports from three acidified catchments in Nova Scotia, Canada, Biogeochemistry, 87, 83–99, 2008.
Clark, J. M., Chapman, P. J., Adamson, J. K., and Lane, S. N.: Influence of drought-induced acidification on the mobility of dissolved organic carbon in peat soils, Glob. Change Biol., 11, 791–809, 2005.
Clark, J. M., Lane, S. N., Chapman, P. J., and Adamson, J. K.: Export of dissolved organic carbon from an upland peatland during storm events: implications for flux estimates, J. Hydrol., 347, 438–447, 2007.
Clark, J. M., Gallego-Sala, A. V., Allott, T. E. H., Chapman, S. J., Farewell, T., Freeman, C., House, J. I., Orr, H. G., Prentice, I. C., and Smith, P.: Assessing the vulnerability of blanket peat to climate change using an ensemble of statistical bioclimatic envelope models, Clim. Res., 45, 131–150, 2010a.
Clark, J. M., Bottrell, S. H., Evans, C. D., Monteith, D. T., Bartlett, R., Rose, R., Newton, R. J., and Chapman, P. J.: The importance of the relationship between scale and process in understanding long-term DOC dynamics, Sci. Total. Environ., 408, 2768–2775, 2010b.
Cleveland, R. B., Cleveland, W. S., McRae, J. E., and Terpenning, I.: STL: A Seasonal-Trend Decomposition Procedure Based on Loess, J. Off. Stat., 6, 3–73, 1990.
Coll, J., Gibb, S. W., and Harrison, J.: Modelling future climates in the Scottish Highlands – an approach integrating local climatic variables and regional climate model outputs, in: Mountains of northern Europe: conservation, management, people and nature, edited by: Thompson, D. B. A., Price, M. F., and Galbraith, C. A., TSO Scotland, Edinburgh, UK, 103–119, 2005.
Coll, J., Bourke, D., Skeffington, S. M., and Gormally, M.: Projected loss of active blanket bogs in Ireland, Clim. Res., 59, 103–115, https://doi.org/10.3354/cr01202, 2014.
CORINE: Datasets downloaded from the Environmental Protection Agency, Ireland (EPA) Geoportal website, available at: http://gis.epa.ie (last access: 25 May 2018), 2012.
Creed, I. F., McKnight, D. M., Pellerin, B. A., Green, M. B., Bergamaschi, B. A., Aiken, G. R., Burns, D. A., Findlay, S. E. G., Shanley, J. B., Striegl, R. G., Aulenbach, B. T., Clow, D. W., Laudon, H., McGlynn, B. L., McGuire, K. J., Smith, R. A., and Stackpoole, S. M.: The river as a chemostat: fresh perspectives on dissolved organic matter flowing down the river continuum, Can. J. Fish. Aquat. Sci., 72, 1272–1285, https://doi.org/10.1139/cjfas-2014-0400, 2015.
Cummins, T. and Farrell, E. P.: Biogeochemical impacts of clearfelling and reforestation on blanket-peatland streams: Major ions and dissolved organic carbon, Forest Ecol. Manag., 180, 557–570, 2003.
Daniels, S. M., Evans, M. G., Agnew, C. T., and Allott, T. E. H.: Sulphur leaching from headwater catchments in an eroded peatland, South Pennines, UK, Sci. Total. Environ., 407, 481–496, 2008.
Dawson, J. J. C., Billett, M. F., Neal, C., and Hill, S.: A comparison of particulate, dissolved and gaseous carbon in two contrasting upland streams in the UK, J. Hydrol., 257, 226–246, 2002.
de Eyto, E., Jennings, E., Ryder, E., Sparber, K., Dillane, M., Dalton, C., and Poole, R.: Response of a humic lake ecosystem to an extreme precipitation event: physical, chemical, and biological implications, Inland Waters, 6, 483–498, 2016.
Dillon, P. J. and Molot, L. A.: Long-term trends in catchment export and lake retention of dissolved organic carbon, dissolved organic nitrogen, total iron and total phosphorus: The Dorset, Ontario study, 1978–1998, J. Geophys. Res-Biogeo., 110, G01002, https://doi.org/10.1029/2004JG000003, 2005.
Doyle, B., Dillane, M., de Eyto, E., Cooney, J., Hughes, P., Murphy, M., Nixon, P., Sweeney, D., Poole, R., Ryder, E., and Jennings, E.: Burrishoole catchment water colour measurements, and associated environmental drivers: Marine Institute, Ireland, https://doi.org/10.20393/fa37ec81-7aec-4e9d-92f2-c79ff36716fb, 2018.
Dwyer, N.: The Status of Ireland's Climate,: EPA Report No. 26. Environmental Protection Agency, Johnstown Castle, Ireland, available at: http://www.epa.ie/pubs/reports/research/climate/CCRP26 - Status of Ireland's Climate 2012.pdf (last access: 12 May 2018), 2012.
Erlandsson, M., Buffam, I., Fölster, J., Laudon, H., Temnerud, J., Weyhenmeyer, G., and Bishop, K.: Thirty-five years of synchrony in the organic matter concentrations of Swedish rivers explained by variation in flow and sulphate, Glob. Change Biol., 14, 1191–1198, 2008.
Evans, C. D., Monteith, D. T., and Cooper, D. M.: Long-term increases in surface water dissolved organic carbon: observations, possible causes and environmental impacts, Environ. Pollut., 137, 55–71, 2005.
Fenner, N. and Freeman, C.: Drought-induced carbon loss in peatlands, Nat. Geosci., 4, 895–900, https://doi.org/10.1038/ngeo1323, 2011.
Findlay, S. J. M., Quinn, J. M., Hickey, C. W., Burrell, G., and Downes, M.: Effects of landuse and riparian flowpath on delivery of dissolved organic carbon to streams, Limnol. Oceanogr., 46, 345–355, 2001.
Folland, C. K., Knight, J., Linderholm, H. W., Fereday, D., Ineson, S., and Hurrell, J. W.: The Summer North Atlantic Oscillation: Past, Present, and Future, J. Climate, 22, 1082–1103, 2008.
Freeman, C., Evans, C. D., Monteith, D. T., Reynolds, B., and Fenner, N.: Export of organic carbon from peat soils, Nature, 412, 785 https://doi.org/10.1038/35090628, 2001.
Gallego-Sala, A. and Prentice, I. C.: Blanket peat biome endangered by climate change, Nat. Clim. Change, 3, 152–155, https://doi.org/10.1038/nclimate1672, 2013.
Gardiner, M. J. and Radford, T.: Soil associations of Ireland and their land use potential, Soil Survey Bulletin, No. 36, Dublin, Ireland, 1980.
Grinsted, A., Moore, J. C., and Jevrejeva, S.: Application of the cross wavelet transform and wavelet coherence to geophysical time series, Nonlinear Processes in Geophysics, European Geosciences Union (EGU), 11, 561–566, 2004.
Hirsch, R. M.: An evaluation of some record reconstruction techniques, Water Resour. Res., 15, 1781–1790, 1979.
Holden, N. M. and Connolly, J.: Estimating the carbon stock of a blanket peat region using a peat depth inference model, Catena, 86, 75–85, 2011.
Hongve, D., Riise, G., and Kristiansen, J. F.: Increased colour and organic acid concentrations in Norwegian forest lakes and drinking water – a result of increased precipitation?, Aquat. Sci., 66, 231–238, 2004.
Hope, D., Billett, M. F., and Cresser, M. S.: Exports of organic carbon in two river systems in NE Scotland, J. Hydrol., 193, 61–82, 1997a.
Hope, D., Billett, M. F., Milne, R., Brown, A. W., and Thomas, T. Exports of organic carbon in British Rivers, Hydrol. Process., 11, 325–344, 1997b.
Hurrel, G., Ottersen, G., and Visbeck, M.: The North Atlantic Oscillation; Climate Significance and Environmental Impacts, 134 Geophysical Monographs Series, American Geophysical Union, Washington, DC, USA, 1–35, 2003.
Jennings, E., Allott, N., McGinnity, P., Poole, R., Quirke, W., Twomey, H., and George, G.: The North Atlantic Oscillation: Effects on freshwater systems in Ireland, Biol. Environ., 100B, 149–157, 2000.
Jennings, E., Nic Aongusa, C., Allott, C., Naden, P., O'Hea, B., Pierson, D., and Schneiderman, E. Future climate change and water colour in Irish peatland catchments: results from the CLIME project, Proceedings of the National Hydrology Seminar 2006: Water Resources in Ireland and Climate Change, Tullamore, Co Offaly, Ireland, 2006.
Jennings, E., Jones, S., Arvola, L., Staehr, P., Gaiser, A., Jones, I. D., Weathers, K., Weyhenmeyer, G. A., Chiu, C., and De Eyto, E.: Effects of weather-related episodic events in lakes: an analysis based on high-frequency data, Freshwater Biol., 57, 589–601, 2012.
Kiely, G.: Climate change in Ireland from precipitation and streamflow observations, Adv. Water Resour., 23, 141–151, 1999.
Kiely, J., Diamond, S., Burke, P. J., and Collins, T.: Soil Map of West Mayo, An Foras Talúntais, Dublin, Ireland, 1974.
Koehler, A. K., Murphy, K., Kiely, G., and Sottocornola, M.: Seasonal variation of DOC concentration and annual loss of DOC from an Atlantic blanket bog in South Western Ireland, Biogeochemistry, 95, 231–242, 2009.
Long, C. B., MacDermot, C. V., Morris, J. H., Sleeman, A. G., Tietzsch-Tyler, D., Aldwell, C. R., Daly, D., Flegg, A. M., McArdle, P. M., and Warren, W. P.: Geology of North Mayo, Geological Survey of Ireland, 56 pp., 1992.
Mäkiranta, P., Laiho, R., Fritze, H., Hytones, J., Laine, J., and Minkkinen, K.: Indirect regulation of heterotrophic peat soil respiration by water level via microbial community structure and temperature sensitivity, Soil Biol. Biochem., 41, 695–703, 2009.
Marsh, T. J., Kirby, C., Muchan, K., Barker, L., Henderson, E., and Hannaford, J.: The winter floods of 2015/2016 in the UK – a review, Centre for Ecology and Hydrology, Wallingford, UK, 37 pp., 2016.
May, L. and Place, C.: A GIS-based model of soil erosion and transport, Freshwater Forum, 23, 48–61, 2005.
Mitchell, G. and McDonald, A. T.: Discoloration of water by peat following induced drought and rainfall simulation, Water Res., 26, 321–326, 1992.
Monteith, D. T., Stoddard, J. L., Evans, C. D., de Wit, H. A., Forsius, M., Hogasen, T., Wilander, A., Skjelkvale, B. L., Jeffries, D. S., Vuorenmaa, J., Keller, B., Ko-pacek, J., and Vesely, J.: Dissolved organic carbon trends resulting from changes in atmospheric deposition chemistry, Nature, 450, 537–540, 2007.
Montgomery, D. C. and Peck, E. A.: Introduction to linear regression analysis (2nd ed.), John Wiley and Sons, New York, USA, 1992.
Moore, T. R.: Dissolved organic carbon: sources, sinks, and fluxes and the role in the soil carbon cycle, in: Soil processes and the carbon cycle, edited by: Lal, R., CRC Press, Boca Raton, FL, USA, 281–292, 1998.
Moore, T. R. and Jackson, R. J.: Dynamics of dissolved organic carbon in forested and disturbed catchments, Westland, New Zealand: 2. Larry River Water Resour. Res., 25, 1331–1339, https://doi.org/10.1029/WR025i006p01331, 1989.
Naden, P. S., Allott, N., Arvola, L., Järvinen, M., Jennings, E., Moore, K., Nic Aonghusa, C., Pierson, D., and Schneiderman, E.: Modelling the Impacts of Climate Change on Dissolved Organic Carbon, in: The Impact of Climate Change on European Lakes, edited by: Glen, G., Springer, Dordrecht, Heidelberg, London, New York, 221–253, 2010.
Neff, J. C. and Hooper, D. U.: Vegetation and climate controls on potential CO2, DOC and DON production in northern latitude soils, Glob. Change Biol., 8, 872–884, 2002.
NOAA.: National Oceanic and Atmospheric Administration, National weather service, Climate Prediction Centre, available at: http://www.cpc.ncep.noaa.gov/products/precip/CWlink/pna/nao.shtml, last access: 28 November 2017.
Nõges P., Kägu M., Nõges T. Role of climate and agricultural practice in determining matter discharge into large, shallow Lake Võrtsjärv, Estonia, in: Eutrophication of Shallow Lakes with Special Reference to Lake Taihu, China, edited by: Qin, B., Liu, Z., and Havens, K., Developments in Hydrobiology, vol. 194, Springer, Dordrecht, https://doi.org/10.1007/978-1-4020-6158-5_14, 2007.
Nolan, P.: Ensemble of Regional Climate Model Projections for Ireland, Environmental Protection Agency, Johnstown Castle, Ireland, 2015.
O'Sullivan, A: Site synopsis, Owenduff/Nephin Complex, National Parks and Wildlife Service, 51 St Stephens Green, Dublin 2, Ireland, 1993.
Parker, M. M.: Lough Furnace, County Mayo; physical and chemical studies of an Irish saline lake, with reference to the biology of Neomysis integer, PhD Thesis, Dublin University, Dublin, Ireland, 1977.
Preston, M. D., Eimers, C., and Watmough, S. A.: Effect of moisture and temperature variation on DOC release from a peatland: Conflicting results from laboratory, field and historical data analysis, Sci. Total Environ., 409, 1235–1242, https://doi.org/10.1016/j.scitotenv.2010.12.027, 2011.
Priestly, C. H. and Taylor, R. J.: On the Assessment of Surface Heat Flux and Evaporation Using Large-Scale Parameters, Mon. Weather Rev., 100, 81–92, https://doi.org/10.1175/1520-0493, 1972.
R Core Team.: R: A language and environment for statistical computing, R Foundation for statistical Computing, Vienna, Austria, available at: https://www.R-project.org/ (last access: 24 May 2018), 2017.
Renou-Wilson, F.: BOGLAND: Sustainable Management of Peatlands in Ireland. Available at: Secure Archive for Environmental Research Data (SAFER) managed by Environmental Protection Agency Ireland, available at: http://erc.epa.ie/safer/resource?id=a07e0103-46da-102f-8c70-b53a025bc1b8 (last access: 18 April 2018), 2011.
Ryder, E.: Estimating carbon pools and processing in a humic Irish lake, PhD thesis, Dundalk Institute of Technology, Dundalk, Ireland, 2015.
Ryder, E., de Eyto, E., Dillane, M., Poole, R., and Jennings, E.: Identifying the role of environmental drivers in organic carbon export from a forested peat catchment, Sci. Total Environ., 490, 28–36, 2014.
Schelker, J., Eklöf, K., Bishop, K., and Laudon, H.: Effects of forestry operations on dissolved organic carbon concentrations and export in boreal first-order streams, J. Geophys. Res., 117, G01011, https://doi.org/10.1029/2011JG001827, 2012.
Sheehy Skeffington, M. J. and O'Connell, C.: Peatlands of Ireland, Studies in Irish Limnology, edited by: Giller, P., Societas Internationalis Limnologiae (SIL), Dublin, Ireland, 39–66, 1998.
Sobek, S., Tranvik, L. J., Prairie, Y. T., Kortelainen, P., and Cole, J. J.: Patterns and regulation of dissolved organic carbon: an analysis of 7500 widely distributed lakes, Limnol. Oceanogr., 52, 1208–1219, 2007.
Sweeney, J.: Regional weather and climates of the British Isles – Part 6: Ireland, Weather, 69, 20–27, 2014.
Temnerud, J. and Bishop, K., Spatial variation of streamwater chemistry in two C14 BGD Interactive comment Printer-friendly version Discussion paper Swedish boreal catchments: Implications for environmental assessment, Environ. Sci. Technol., 39, 1463–1469, https://doi.org/10.1021/es040045q, 2005.
Thurman, E. M.: Organic geochemistry of natural waters, Junk Publishers, Dordrecht, the Netherlands, 497 pp., 1985.
Tipping, E., Marker, A. F. H., Butterwick, C., Collett, G. D., Cranwell, P. A., Ingram, J. K. G., Leach, D. V., Lishman, J. P., Pinder, A. C., Rigg, E., and Simon, B. M.: Organic carbon in the Humber rivers, Sci. Total Environ., 194–195, 345–355, 1997.
Venables, W. N. and Ripley, B. D.: Modern Applied Statistics with S, Fourth Edition, Springer, the Netherlands, ISBN 0-387-95457-0, 2002.
Vicente-Serrano, S. M., Beguería, S., and López-Moreno, J. I.: A Multiscalar Drought Index Sensitive to Global Warming: The Standardized Precipitation Evapotranspiration Index, J. Climate, 23, 1696–1718, https://doi.org/10.1175/2009JCLI2909.1, 2010.
Watts, C. D., Naden, P. S., Machell, J., and Banks, J.: Long term variation in water colour from Yorkshire catchments, Sci. Total Environ., 278, 57–72, 2001.
Weir, G.: Sheep overgrazing in the Nephin Begs, MSc Thesis, Trinity College Dublin, Dublin, Ireland, 1996.
Wieder, R. K. and Vitt, D. H.: Boreal peatland ecosystems, Springer, Berlin, Germany, 2006.
Winterdahl, M., Erlandsson, M., Futter, M. N., Weyhenmeyer, G. A., and Bishop, K.: Intra-annual variability of organic carbon concentrations in running waters: Drivers along a climatic gradient, Global Biogeochem. Cy., 28, 451–464, https://doi.org/10.1002/2013GB004770, 2014.
Winterdahl, M., Wallin, M. B., Karlsen, R. H., Laudon, H., Öquist, M., and Lyon, S. W.: Decoupling of carbon dioxide and dissolved organic carbon in boreal headwater streams, J. Geophys. Res.-Biogeo., 121, 2630–2651, https://doi.org/10.1002/2016JG003420, 2016.
Wood, S. N.: Generalized Additive Models: An Introduction R: Chapman and Hall/CRC, Boca Raton, FL, USA, ISBN 1-58488-474-6, 2006.
Worrall, F. and Burt, T. P.: Flux of dissolved organic carbon from UK rivers, Global Biogeochem. Cy., 21, GB1013, https://doi.org/10.1029/2006GB002709, 2007.
Worrall, F., Howden, N. J. K., Burt, T. P., and Bartlett, R.: Declines in the dissolved organic carbon (DOC) concentration and flux from the UK, J. Hydrol., 556, 775–789, https://doi.org/10.1016/j.jhydrol.2017.12.001, 2018.
Yallop, A. R. and Clutterbuck, B.: Land management as a factor controlling dissolved organic carbon release from upland peat soils 1: Spatial variation in DOC productivity, Sci. Total Environ., 407, 3803–3813, 2009.
Zhang, J., Hudson, J., Neal, R., Sereda, J., Clair, T., Turner, M., Jeffries, D., Dillon, P., Molot, L., Somers, K., and Hesslein, R.: Long-term patterns of dissolved organic carbon in lakes across eastern Canada: Evidence of a pronounced climate effect, Limnol. Oceanogr., 55, 30–42, 2010.
Zuur, A. F., Ieno, E. N., and Walker, N.: Mixed effects models and extensions in ecology with R, Springer, New York, NY, USA, 2009.