the Creative Commons Attribution 4.0 License.
the Creative Commons Attribution 4.0 License.
 | 10 Dec 2018
Meso-zooplankton structure and functioning in the western tropical South Pacific along the 20th parallel south during the OUTPACE survey (February–April 2015)
François Carlotti
Marc Pagano
Loïc Guilloux
Katty Donoso
Valentina Valdés
Olivier Grosso
Brian P. V. Hunt
The western tropical South Pacific (WTSP) is one of the most understudied oceanic regions in terms of the planktonic food web, despite supporting some of the largest tuna fisheries in the world. In this stratified oligotrophic ocean, nitrogen fixation may play an important role in supporting the plankton food web and higher trophic level production. In the austral summer (February–April) of 2015, the OUTPACE (Oligotrophy to UlTra-oligotrophy PACific Experiment) project conducted a comprehensive survey of 4000 km along 20∘ S, from New Caledonia to Tahiti, to determine the role of N2 fixation on biogeochemical cycles and food web structure in this region. Here, we characterize the zooplankton community and plankton food web processes at 15 short-duration stations (8 h each) to describe the large-scale variability across trophic gradients from oligotrophic waters around Melanesian archipelagoes (MAs) to ultra-oligotrophic waters of the South Pacific gyre (GY). Three long-duration stations (5 days each) enabled a more detailed analysis of processes and were positioned (1) in offshore northern waters of New Caledonia (MA), (2) near Niue Island (MA), and (3) in the subtropical Pacific gyre (GY) near the Cook Islands. At all stations, meso-zooplankton was sampled with a bongo net with 120 µm mesh size to estimate abundance, biomass, community taxonomy and size structure, and size fractionated δ15N. Subsequently, we estimated zooplankton carbon demand, grazing impact, excretion rates, and the contribution of diazotroph-derived nitrogen (DDN) to zooplankton biomass. The meso-zooplankton community showed a general decreasing trend in abundance and biomass from west to east, with a clear drop in the GY waters. Higher abundance and biomass corresponded to higher primary production associated with complex mesoscale circulation in the Coral Sea and between 170–180∘ W. The taxonomic structure showed a high degree of similarity in terms of species richness and abundance distribution across the whole region, with, however, a moderate difference in the GY region, where the copepod contribution to meso-zooplankton increased. The calculated ingestion and metabolic rates allowed us to estimate that the top–down (grazing) and bottom–up (excretion of nitrogen and phosphorous) impact of zooplankton on phytoplankton was potentially high. Daily grazing pressure on phytoplankton stocks was estimated to remove 19 % to 184 % of the total daily primary production and 1.5 % to 22 % of fixed N2. The top–down impact of meso-zooplankton was higher in the eastern part of the transect, including GY, than in the Coral Sea region and was mainly exerted on nano- and micro-phytoplankton. The regeneration of nutrients by zooplankton excretion was high, suggesting a strong contribution to regenerated production, particularly in terms of N. Daily excretion accounted for 14.5 % to 165 % of phytoplankton needs for N, whereas excretion accounted for only 2.8 % to 34 % of P needs. From zooplankton δ15N values, we estimated that the DDN contributed to up to 67 % and 75 % to the zooplankton biomass in the western and central parts of the MA regions, respectively, but strongly decreased to an average of 22 % in the GY region and down to 7 % in the easternmost station. Thus, the highest contribution of diazotrophic microorganisms to zooplankton biomass occurred in the region of highest N2 fixation rates and when Trichodesmium dominated the diazotrophs community (MA waters). Our estimations of the fluxes associated with zooplankton were highly variable between stations and zones but very high in most cases compared to literature data, partially due to the high contribution of small forms. The highest values encountered were found at the boundary between the oligotrophic (MA) and ultra-oligotrophic regions (GY). Within the MA zone, the high variability of the top–down and bottom–up impact was related to the high mesoscale activity in the physical environment. Estimated zooplankton respiration rates relative to primary production were among the highest cited values at similar latitudes, inducing a high contribution of migrant zooplankton respiration to carbon flux. Despite the relatively low biomass values of planktonic components in quasi-steady state, the availability of micro- and macronutrients related to physical mesoscale patterns in the waters surrounding the MA, the fueling by DDN, and the relatively high rates of plankton production and metabolism estimated during OUTPACE may explain the productive food chain ending with valuable fisheries in this region.
- Article
(4316 KB) -
Supplement
(61 KB) - BibTeX
- EndNote


The western tropical South Pacific (WTSP) is a vast oceanic area extending from the Coral Sea in the west to the western boundary of the South Pacific Subtropical Gyre Province (SPSG) in the east, centered on the 20th parallel south. It is one of the most understudied oceanic regions in terms of the planktonic food web, despite supporting some of the largest tuna fisheries in the world and showing variable production in response to El Niño–Southern Oscillation (ENSO) events (Longhurst, 2006; Le Borgne et al., 2011; Smeti et al., 2015; Houssard et al., 2017).
Over the last decade, the WTSP has been the subject of a number of studies concerning the biogeographical distributions of picoplankton (see Buitenhuis et al., 2012, for the data synthesis; Campbell et al., 2005) and diazotrophs (Shiozaki et al., 2014; Bonnet et al., 2015, 2017), due to their key roles in biogeochemical cycling and the functioning of oligotrophic subtropical pelagic ecosystems. In this stratified oligotrophic ocean, a major source of new N for the pelagic food web appears to be N2 fixation by unicellular (Zehr et al., 2001; Campbell et al., 2005; Bonnet et al., 2015) and filamentous cyanobacteria (Bonnet et al., 2009; Moisander et al., 2010; Dupouy et al., 2011). This latter form may accumulate substantial biomass after massive blooms in the summer (Campbell et al., 2005; Dupouy et al., 2011). The contribution of blooms of cyanobacteria to the food web appears to be highly variable and remains controversial (Le Borgne et al., 2011). Abundances of zooplankton have been linked to blooms of Trichodesmium (Landry et al., 2001), but in most cases, a high biomass of cyanobacteria does not result in an increase in zooplankton biomass because some cyanobacteria are toxic or unpalatable (Turner, 2014). Grazing on Trichodesmium has been considered as a food source for only a few zooplankton species, mainly harpacticoid copepods (Hawser et al., 1992; O'Neil and Roman, 1994; O'Neil, 1998); however, recent studies provided evidence of zooplankton species feeding on various types of diazotrophs. In the Amazon River plume, copepods were shown to consume diatom–diazotroph assemblages (DDAs) (Hemiaulus–Richelia and Rhizosolenia–Richelia, diatom–diazotroph, respectively), diazotrophic unicellular cyanobacteria UCYN-A Candidatus Atelocyanobacterium thalassa, UCYN-B Crocosphaera watsonii, and the colonial cyanobacterium Trichodesmium (Conroy et al., 2017). Recently, the consumption of UCYN-C by zooplankton was observed in a mesocosm experiment performed in the oligotrophic Nouméa Lagoon in the southwest Pacific (Hunt et al., 2016), while the nifH gene, indicative of N2 fixation, was measured in the gut of zooplankton, including the copepods Pleuromamma, Pontella, and Euchaeta, in the western equatorial and subtropical Pacific waters (Azimuddin et al., 2016).
Concomitant surveys planned to identify both diazotroph blooms and zooplankton distributions are rare. The multidisciplinary ANACONDAS program (Amazon River influence on nitrogen fixation and export production in the western tropical North Atlantic) was dedicated to investigating the role of the Amazon plume in stimulating offshore nitrogen fixation, including nitrogen supplied by nitrogen-fixing bacteria, and export production during the river's high-discharge period (May–June 2010). That study showed clear evidence of the consumption of DDAs, Trichodesmium, and unicellular cyanobacteria by calanoid copepods (Weber et al., 2017; Conroy et al., 2017). In another recent paper, Azimuddin et al. (2016) presented data analysis to understand the diversity and abundance of potentially diazotrophic microorganisms associated with marine zooplankton, especially copepods. That study was based on the nifH gene in zooplankton samples, mainly copepods, collected at 12 locations in the Pacific Ocean, four stations in the subarctic and subtropical North Pacific, including the ALOHA station, and eight stations in the tropical and subtropical areas of the South Pacific.
If we consult the “Copepod database” (https://www.st.nmfs.noaa.gov/copepod/, last access: November 2018), the tropical South Pacific Ocean is among the least sampled regions in the world ocean for zooplankton investigation. The most complete ecosystem studies in the region were performed by the US (Murray et al., 1995) and French JGOFS programs (Le Borgne and Landry, 2003), in the equatorial South Pacific (see the review by Le Borgne et al., 2002). These programs included dedicated observations on zooplankton distribution and associated fluxes (White et al., 1995; Zhang et al., 1995; Le Borgne and Rodier, 1997; Le Borgne et al., 1999, 2003). One joint program, Zonal Flux (15 April–14 May 1996), was an equatorial transect cruise made during a La Niña event (April–May 1996) in the equatorial Pacific upwelling. In the WTSP, zooplankton studies are rare and largely confined to the Coral Sea (Le Borgne et al., 2010; Smeti et al., 2015). In the eastern tropical South Pacific, regular campaigns by the Scripps Institution of Oceanography in the 1960s have provided information on zooplankton taxon distributions (see the review by Fernández-Álamo and Färber-Lorda, 2006).
The OUTPACE survey (Oligotrophy to UlTra-oligotrophy PACific Experiment, 18 February and 3 April 2015), aboard the RV L'Atalante, was designed specifically to sample a variety of trophic conditions along a west–east transect covering 4000 km in the SE Pacific Ocean, from the western part of the Melanesian archipelago (New Caledonia) to the western boundary of the South Pacific gyre (French Polynesia). The aims of the OUTPACE project (Moutin et al., 2017) were (1) to characterize the zonal changes in biogeochemistry and biological diversity across the WTSP during austral summer conditions; (2) to quantify primary production and the fate of organic matter (including carbon export) in three contrasting trophic regimes with increasing oligotrophy, with a particular emphasis on the role of dinitrogen fixation in areas of Trichodesmium blooms; and (3) to obtain a representation of the main biogeochemical fluxes and dynamics of the planktonic trophic network.
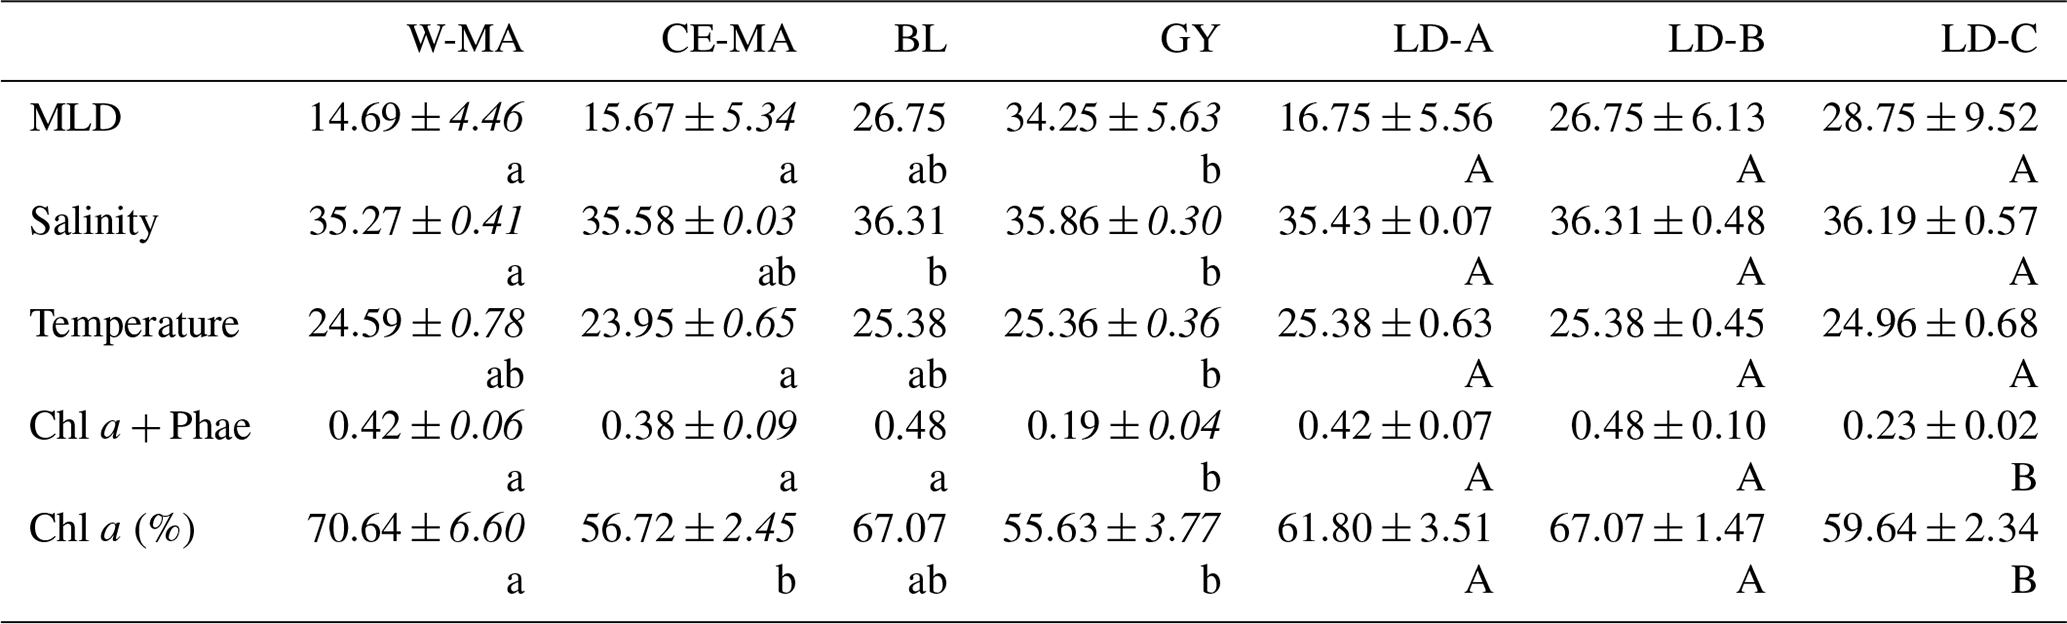
Table 1Mean values (± standard deviation, in italics) of salinity, temperature (∘C), total chlorophyll a and phaeophytin (Chl a and Phae in µg L−1), % Chl a, and mixed layer depth (MLD) (m) found at the stations for the four clusters defined in the PCA on environmental variables (see Fig. 1) and for the three long-duration stations. W-MA: western Melanesian archipelago; CE-MA: central and eastern Melanesian archipelago; BL: station B (blooming conditions); GY: subtropical gyre. Letters below the mean values indicate homogeneous groups between zones (small letters) or LD stations (capital letters) according to post hoc Scheffé tests.
The primary aims of the present study dedicated to meso-zooplankton observations were (1) to document zooplankton density, species diversity, and biomass along the OUTPACE transect, (2) to analyze the relationships between diazotrophic microorganisms and zooplankton, and (3) to characterize the trophic pathways from primary production to meso-zooplankton and the contribution of diazotroph-derived nitrogen (DDN) to zooplankton biomass and in this way to contribute to these three main aims.
2.1 Study site and sampling strategy
The OUTPACE survey was performed aboard the RV L'Atalante during austral summer conditions between 18 February and 3 April 2015 in the WTSP Ocean, from New Caledonia (western part of the Melanesian archipelago) to French Polynesia, along a west–east transect covering ca. 4000 km between 17 and 22∘ S (Fig. 1). This region is impacted by ENSO, known to be the most important mode of sea surface temperature (SST) variability on interannual to decadal timescales (Sarmiento and Gruber, 2006). The year 2015 was classified as an El Niño event, which was reflected in SST and Chl a satellite data (Moutin et al., 2017). Along this transect, two types of stations were sampled (Fig. 1): 15 short-duration stations (SD1 to SD15, 8 h) dedicated to a large-scale description and 3 long-duration stations for Lagrangian process studies. These three stations are as follows: station LD-A (19∘12.8′ S–164∘41.3′ E, 25 February–2 March) positioned in western Melanesian archipelago waters in the western part of the transect, offshore of New Caledonia; station LD-B (18∘14.4′ S–170∘51.5′ W, 15–20 March) in the eastern part of Melanesian archipelago waters, near Niue Island; and station LD-C (18∘25.2′ S–165∘56.4′ W, 23–28 March) in the eastern part of the transect, in the subtropical Pacific gyre, near the Cook Islands. All general characteristics of the stations are presented in Moutin et al. (2017, their Table 1).
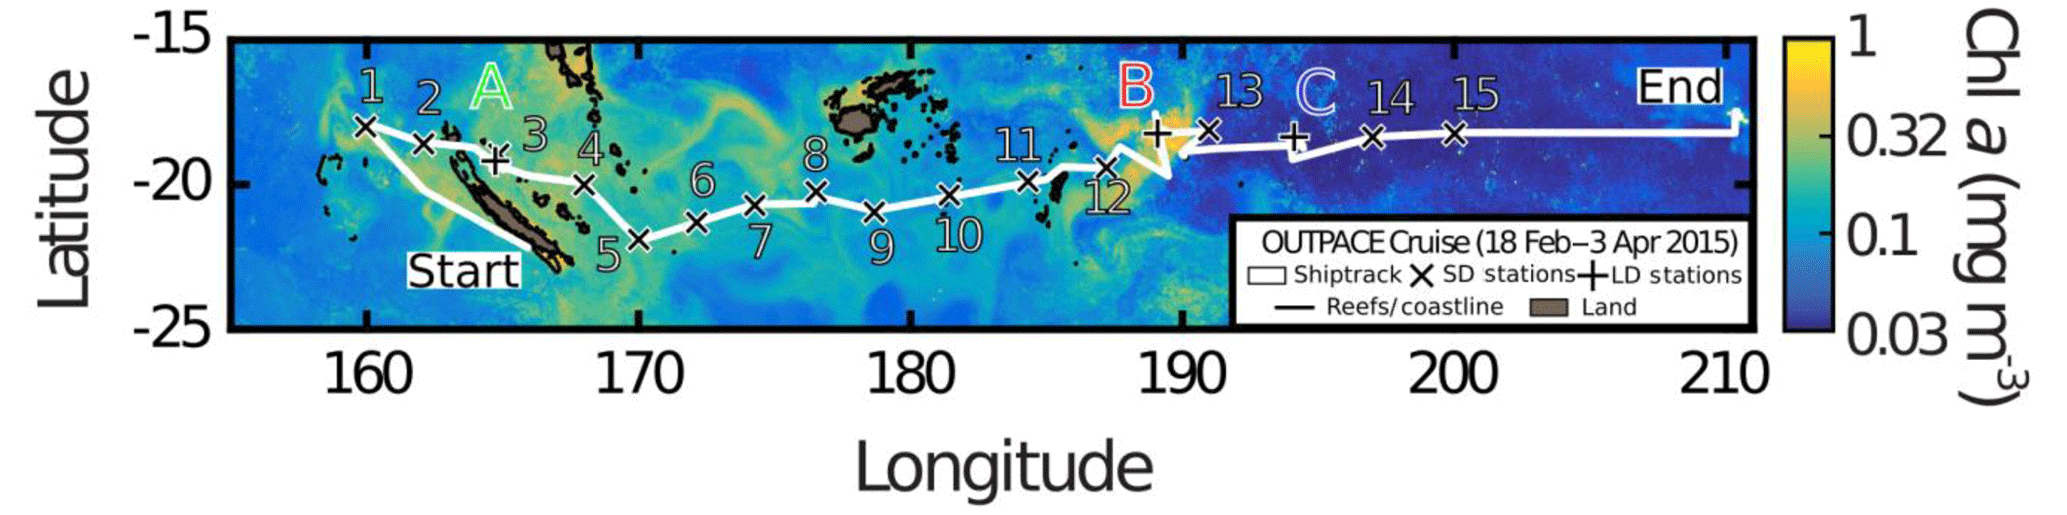
Figure 1Transect of the OUTPACE cruise superimposed on quasi-Lagrangian-weighted mean Chl a of the WTSP during OUTPACE (see details in Moutin et al., 2017), with the two types of stations: short-duration stations 1 to 15 (×) and long-duration stations A, B and C (+). Along the transect, zooplankton samples were collected once at each short-duration station, whereas day–night sampling was performed each day at three strategic long-duration stations. Longitude is expressed as ∘E. OUTPACE cruise (https://dx.doi.org/10.17600/15000900, Moutin et al., 2017).
Real-time satellite images (altimetry, SST, ocean color) combined with drifter trajectories initiated during the first part of the cruise were used to define the best positions of these three stations on the basis of two criteria: sea surface chlorophyll levels to characterize the main sampled regions and minimum current intensity in each region to increase the chance of sampling a homogeneous water mass (Moutin et al., 2017; De Verneil et al., 2018). Stations LD-A and LD-B were characterized by local maxima of sea surface Chl a typical of the Melanesian archipelago zone, whereas Chl a minima characterized LD-C, representing typical waters of the subtropical gyre.
2.2 Meso-zooplankton sampling
Zooplankton collection was conducted at 14 of the SD stations (station SD-13 was not sampled for zooplankton) and at the 3 LD stations. SD stations were generally sampled during the day, except for SD-04 and SD-05, whereas LD stations were sampled once during the day and once during the night for each of the 5 days of station occupation. Sampling was done with a bongo net (70 cm mouth diameter) with 120 µm mesh nets mounted with filtering cod ends. The nets were equipped with HYDRO-BIOS flowmeters. Hauls were done from 200 m depth to the surface at a speed of 1 m s−1. One of the cod ends was used for biomass measurements. The second one was preserved in 4 % buffered formaldehyde for later taxonomic identification, abundance, and size spectrum analyses. Volume filtered by the nets (V) was calculated using the formula , combining the flowmeter counts (R; one count is a tenth of revolution), the mouth area of the net (S=0.38 m2), and the pitch of the impeller of the flowmeter (K) provided by the manufacturer, and it is equal to a 0.03 m count−1.
2.3 Dry weight measurement
The biomass sample was processed onboard. Just after collection, each sample was filtered onto a pre-weighed GF/F filter (47 mm) and oven-dried at 60 ∘C for 2 days. The average biomass concentration (in mg DW m−3) in the upper 200 m was calculated from the zooplankton dry weight (mg), obtained as the difference between the weight of the filter with and without the sample, taking into account the water-column-sampled volume. Biomass was also expressed in carbon, using a C∕DW ratio equal to 0.45 (Hansen et al., 1997).
2.4 Identification, abundance, and individual size and weight of the zooplankton taxa
The taxonomic composition was determined for each formalin sample. Samples were split using a Motoda box, and at least 100 individuals of the most abundant taxa were counted in each subsample under a dissecting microscope, a LEICA MZ6. Species/genus identification was done according to Rose (1933), Tregouboff and Rose (1957), and Razouls et al. (2005–2017). The abundance of the various taxa (groups, genera, or species) was divided by the sample volume to determine the concentration of individuals per cubic meter (ind. m−3). The diversity of the zooplankton was determined using the Shannon–Weaver index (Shannon and Weaver, 1949).
Approximates of the individual size (total length) and relative dimensions (length/width) of the different taxa were computed from literature values: summarized data for copepod species from Razouls et al. (2005–2017) and the mean size values of the other taxa from Tregouboff and Rose (1957) and Conway et al. (2003).
For comparison with ZooScan results (see below), we computed the body area of each taxon (A) from its dimensions to calculate its equivalent circular diameter (ECD):
We also estimated individual dry weight (DW) from the area (A) using the relationships obtained by Lehette and Hernández-León (2009) for subtropical copepods and meso-zooplankton.
2.5 Abundance, biomass, and size structure determined with the ZooScan
Samples were digitized with the ZooScan digital imaging system (Gorsky et al., 2010) to determine the size structure of the zooplankton communities, as detailed in Donoso et al. (2017). Each sample was divided into two fractions (<1000 and >1000 µm) and each fraction was then split using a Motoda box until it contained approximately 1000 objects. The resulting samples were poured onto the scanning cell, and zooplankton organisms were manually separated with a wooden spine in order to avoid overlapping organisms. After scanning, each image was processed using Zooprocess and the image analysis software Image-J (Grosjean et al., 2004; Gorsky et al., 2010). Only objects having an equivalent circular diameter (ECD) of >300 µm were detected and processed. Finally, the Plankton Identifier software (http://www.obs-vlfr.fr/~gaspari/Plankton_Identifier/index.php, last access: November 2018) was used for automatic classification of zooplankton into 12 categories. Among them, two categories of non-zooplankton organisms, aggregates, and fibers were grouped as detritus. A training set of about 1000 objects selected automatically from different scans was used to discriminate between and classify organisms, aggregates, and fibers. Afterwards, each scan was corrected using the automatic analysis of images.
Zooplankton abundance estimated from ZooScan (ind. m−3) was calculated from the number of validated vignettes in ZooScan samples, taking into account the scanned fraction and the sampled volume from the net tows. The zooplankton-estimated dry weight of each vignette was calculated from its area using the regression equation obtained for meso-zooplankton by Lehette and Hernández-León (2009).
Below, the terms “ZOOSCAN abundance” and “ZOOSCAN biomass” will indicate values derived from the laboratory ZooScan processing. The abundance and biomass of organisms were first calculated for four size fractions (<500, 500–1000, 1000–2000, and >2000 µm) based on their ECD and then summed to deliver the total average abundance and biomass per sample over the upper 200 m.
2.6 Stable isotope analyses
Nitrogen isotope ratios (δ15N) were measured for the zooplankton size fractions collected for biomass measurement, and for particulate organic matter (POM) samples collected at 5 m depth at each station. Zooplankton samples were first homogenized using a mortar and pestle and packaged into ∼1 mg subsamples. For POM analyses, water samples were collected in 4.4 L polycarbonate bottles at depths corresponding to 50 % and 1 % of light attenuation. The samples were immediately filtered on pre-burnt (450 ∘C, 4 h) 25 mm GF/F filters. Stable isotope analysis was performed with an Integra CN, SerCon Ltd. EA-IRMS (elemental analyzer isotope-ratio mass spectrometry). δ15N values were determined in parts per thousand (‰) relative to the external standard of atmospheric N. Repeated measurements of an internal standard indicated measurement precision of ±0.13 ‰ for δ15N.
The mean δ15N value for each station was calculated as the mean of all size fractions, weighted by size fraction biomass. Subsequently, the contribution of DDN (%) to zooplankton δ15N (ZDDN) values at each station was calculated using a two-source mixing model as follows (Sommer et al., 2006):
where δ15Nzpl is the isotopic signature of the zooplankton collected; TEF is the trophic enrichment factor; δ15Ndiazo is the isotopic signature of diazotrophs; δ15Nzplref is the isotopic signature of zooplankton assuming nitrate-based phytoplankton production. TEF and δ15Ndiazo were set, respectively, at 2.2±0.3 ‰ (McCutchan et al., 2003; Vanderklift and Ponsard, 2003) and within a range of −1 ‰ to −2 ‰ (Montoya et al., 2002). δ15Nzplref was set at 6 ‰ for the Melanesian archipelago stations – a value calculated for the ocean west of New Caledonia where nitrogen fixation is reduced (Hunt et al., 2015) – and at 10.73 ‰ for the South Pacific gyre (GY) samples – the mean value of POM samples in the GY+2.2 ‰ trophic enrichment for the primary consumer level. Minimum, average, and maximum % ZDDN were estimated using the lower, mean, and upper limits of TEF and the δ15Ndiazo values cited above.
2.7 Ancillary data from OUTPACE survey used for interpretations and comparisons
The acquisition of environmental data used in the present paper is presented in different companion papers. Briefly, temperature, salinity, and density were collected with a CTD (conductivity–temperature–depth) SeaBird SBE 9 and particle distribution with an underwater vessel profiler (UVP), both mounted on a rosette (de Verneil et al., 2018), whereas chlorophyll a and phaeophytin concentrations were estimated for different depths from Niskin bottle water samples using the fluorometric method (as described in Dupouy et al., 2018). The depth of the mixed layer (MLD) was calculated using a threshold density deviation of 0.03 kg m−3 from the value at a reference depth (de Verneil et al., 2018).
Integrated Chl a and POC (particulate organic carbon) were calculated from water samples collected at standard depths from the surface to 200 m, using Niskin bottles (see Spungin et al., 2018, for methodological details). Phytoplankton carbon biomass was estimated from Chl a using a C∕Chl a ratio of 50:1 (Wang et al., 2009). Abundance and distribution of unicellular (UCYN-A1, UCYN-A2, UCYN-B, and UCYN-C) and filamentous heterocystous (het-1) and non-heterocystous (Trichodesmium) diazotrophic microorganisms for all stations were taken from Stenegren et al. (2018, their Fig. 2). Primary productivity was determined using a 14C labeling method according to Van Wambeke et al. (2018).
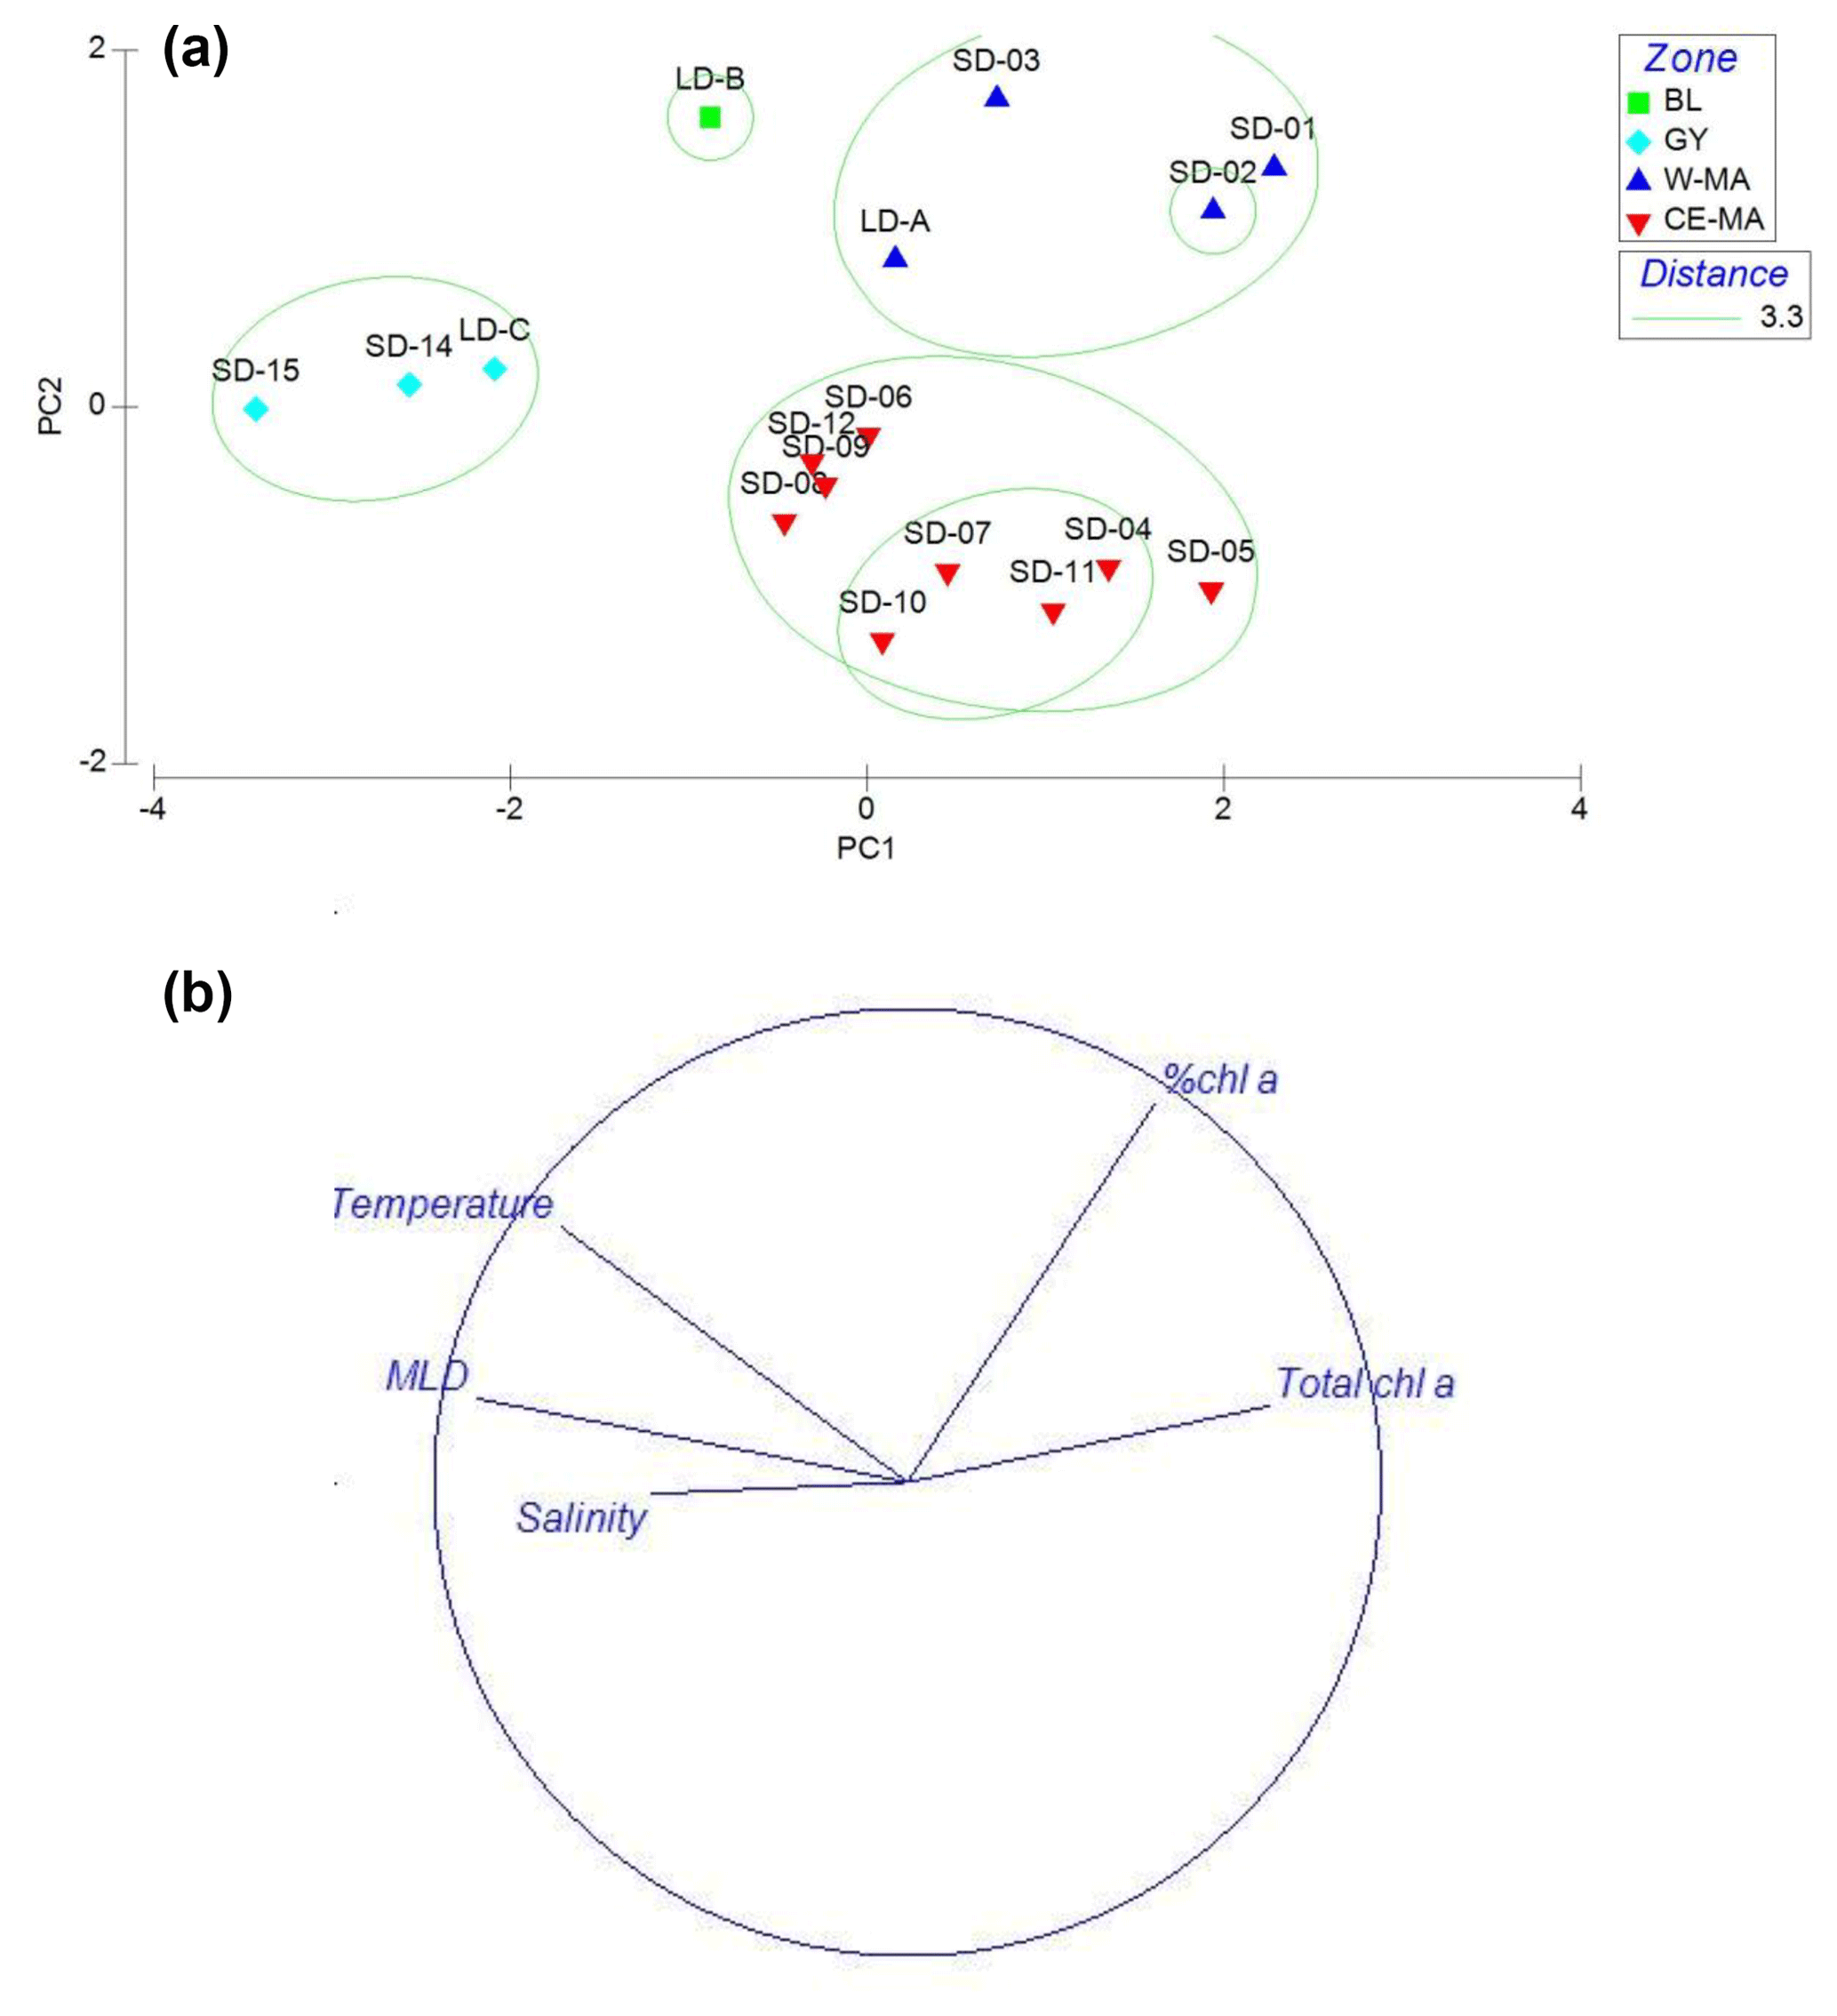
Figure 2PCA on environmental variables: mixed-layer depth (MLD); total Chl a concentration (Chl a + Phae), % Chl a (ratio Chl a/Chl a + Phae), temperature, salinity averaged over the upper 0–200 m of the water column. Plots of the 15 stations (a) and variables (b) on the first factorial plan. The green circles delimit the clusters defined at a distance of 3.3: W-MA: western Melanesian archipelago; CE-MA: central and eastern Melanesian archipelago; BL: station B, blooming conditions; GY: subtropical gyre.
A drifting array equipped with three PPS5 sediment traps and various captors was deployed at each LD station for 5 days at three depths (see Caffin et al., 2018a). Swimmers found in the trap were quantified and genera identified and weighed. Zooplankton C (Zoo-C), N (Zoo-N), and P (Zoo-P) mass was measured at each depth at each station (see methods in Caffin et al., 2018a). Only data from the sediment trap located at 150 m depth were used here.
2.8 Estimation of zooplankton carbon demand and grazing impact and of zooplankton excretion and respiration rates
The zooplankton carbon demand (ZCD in mgC m−3 d−1) was computed based on estimates of biomass and of ration for each taxon:
where Bzoo is the biomass of zooplankton in mgC m−3, and Ration (d−1) is the amount of food consumed per unit of biomass per day, calculated as
where gz is the growth rate of zooplankton, r is the weight-specific respiration, with basal (rb) and active (ra) components, and A is assimilation efficiency.
Following Nival et al. (1975), we considered constant values of A=0.7 d−1. For respiration, we applied a constant value for basal respiration (rb=0.20 d−1) derived from Hernández-León et al. (2008) for 20∘ S zooplankton and assumed an activity-dependent respiration proportional to growth rate (ra=0.25gz) following Kiørboe et al. (1985).
gz was calculated following Zhou et al. (2010):
as a function of sea water temperature (T, ∘C), food availability (Ca, mgC m−3, estimated from Chl a), and weight of zooplankton individuals (w, mgC). Ca was used for herbivorous and omnivorous zooplankton taxa and replaced by POC for carnivorous zooplankton.
ZCD was thus estimated for each taxon and then summed to estimate the ZCD of total zooplankton. We considered two components: one for herbivorous and omnivorous zooplankton (ZCDH) and one for carnivorous zooplankton (ZCDC). To estimate the potential clearance of phytoplankton by zooplankton, we compared ZCDH to the phytoplankton stock, converted to carbon assuming a classical C:Chl a ratio of 50:1, and to the phytoplankton primary production estimated by Van Wambeke et al. (2018). To estimate the grazing impact on phytoplankton size classes (pico-, nano-, and micro-phytoplankton), we applied the empirical relationship given by Wirtz (2012) to estimate the optimum prey size (Dopt, as µm equivalent spherical diameter) from the predator size (DZ, as µm ESD (equivalent spherical diameter)):
According to the root mean square deviations in log(Dopt) of the Wirtz regression model, we assumed a ±60 % food-size range around Dopt for each zooplankton taxon. When the calculated size range straddles the separation value between two phytoplankton size classes (e.g., 2 µm between pico- and nanoplankton), we assume that the grazing pressure on each phytoplanktonic class is proportional to the distance between the limit of the range and this separation value. Therefore, for each grazer, we implicitly assumed a constant clearance over the prey particle-size range.
Ammonium and phosphorus excretion rates were estimated for each taxon and station from the multivariate regression equations by Ikeda (1985), in which independent variables are animal body weight (carbon) and temperature. The daily and excretion values by total zooplankton equal the sum of values for all taxa. We estimated the potential contribution of zooplankton excretion to nitrogen and phosphorous requirements for phytoplankton from primary production using Redfields's ratios.
The contribution of migrating zooplankton to carbon export by respiration and excretion in deep water during the day was estimated at the long-duration stations by applying the respiration and excretion rates over 12 h to the biomass migrating at depth (difference of integrated 0–200 m zooplankton net biomass between night and day).
2.9 Statistical methods
Principal component analysis (PCA) was used to explore spatial patterns of the environmental variables data characterizing the zooplankton habitat: temperature, salinity, chlorophyll a, percentage of chlorophyll a (ratio ) (average values of chlorophyll a and phaeophytin between 0 and 200 m depth, to be consistent with the net haul depth), and MLD. The data were normalized before the analyses were run using the Primer 6.0 software.
One-way or two-way analyses of variance were run, to explore the differences between day and night samples and between stations or zones for the environmental and zooplankton parameters. Post hoc Scheffé tests were performed to analyze paired differences. Spearman's rank correlations (Rs) were computed to test relationships between zooplankton variables and environmental parameters. Diversity was calculated for zooplankton and copepod taxa using the Shannon–Wiener diversity index.
Spatial variations in the zooplankton community composition were investigated using multivariate analysis, specifically nonmetric multidimensional scaling (NMDS). A Bray–Curtis matrix “species – stations” of square root transformed abundance data was used to estimate station similarity. The similarity matrix was then ordinated using NMDS. A SIMPER (percentage of similarity) analysis was performed to identify the species contributing most to similarity or dissimilarity between stations for the station groups identified by NMDS.
Finally, to select the environmental variables “best explaining” community patterns, we used the BEST procedure with the BIOENV algorithm, which maximizes a rank correlation between the environmental and zooplankton resemblance matrices. The environmental variables used are the same as those used in the PCA, and we also considered the abundance of Trichodesmium, derived from Stenegren et al. (2018). Analyses were run using Primer 6 for PCA and NMDS and with Statistica v.6 for ANOVA (analysis of variance), regression, and correlation.

Figure 3Zooplankton abundance and biomass along the OUTPACE west–east transect. (a) Abundance (ind. m−3) of small (ECD < 300 µm) and large (ECD > 300 µm) zooplankton determined by microscope counting (vertical bars) and of large zooplankton (ECD > 300 µm) determined by ZooScan (dark line). Averaged integrated Chl a concentrations (green line). (b) Cumulated zooplankton and detritus biomasses. Red line – values of total dry weight determined by weighing at each station. Black line total zooplankton biomass determined from microscopic counting. The zooplankton biomass fraction < 300 µm was determined from microscopic counting. Zooplankton biomass fractions > 300 µm (four fractions) and detritus biomass were estimated from ZooScan biovolumes. SD-01 to 15: short-duration stations. LD-A, LD-B, and LD-C: long-duration stations (average value and standard deviation over the 5-day sampling).
3.1 Hydrology and trophic conditions along the transect
In the PCA of environmental data, the first two axes explained 70 % of the total variance, of which 50 % was accounted for by the first axis (Fig. 2). The first axis clearly separated the GY stations (stations LD-C, SD-14, SD-15), characterized by low Chl a but high temperature, salinity, and MLD values, from the stations of the Melanesian archipelago (MA). The second axis opposed two clusters of stations within this latter group: the first included the western stations close to Nouméa and Loyalty Islands (W-MA), and LD-B sampled in “blooming” conditions (called BL) characterized by a higher percentage of Chl a to total pigments (>67 %); the second cluster (57±0.09 % Chl a) grouped the stations referred to as central and eastern MA stations (CE-MA). Mean values of environmental data in each cloud are given in Table 1. Salinity was significantly lower in NA than in GY and BL (ANOVA; p<0.05), temperature was significantly lower in MA than in GY, and MLD was significantly deeper in GY than in W-MA and CE-MA (p<0.05). Chl a was significantly lower in GY than in the three other zones and % Chl a was significantly higher in W-MA and BL than in GY and CE-MA.
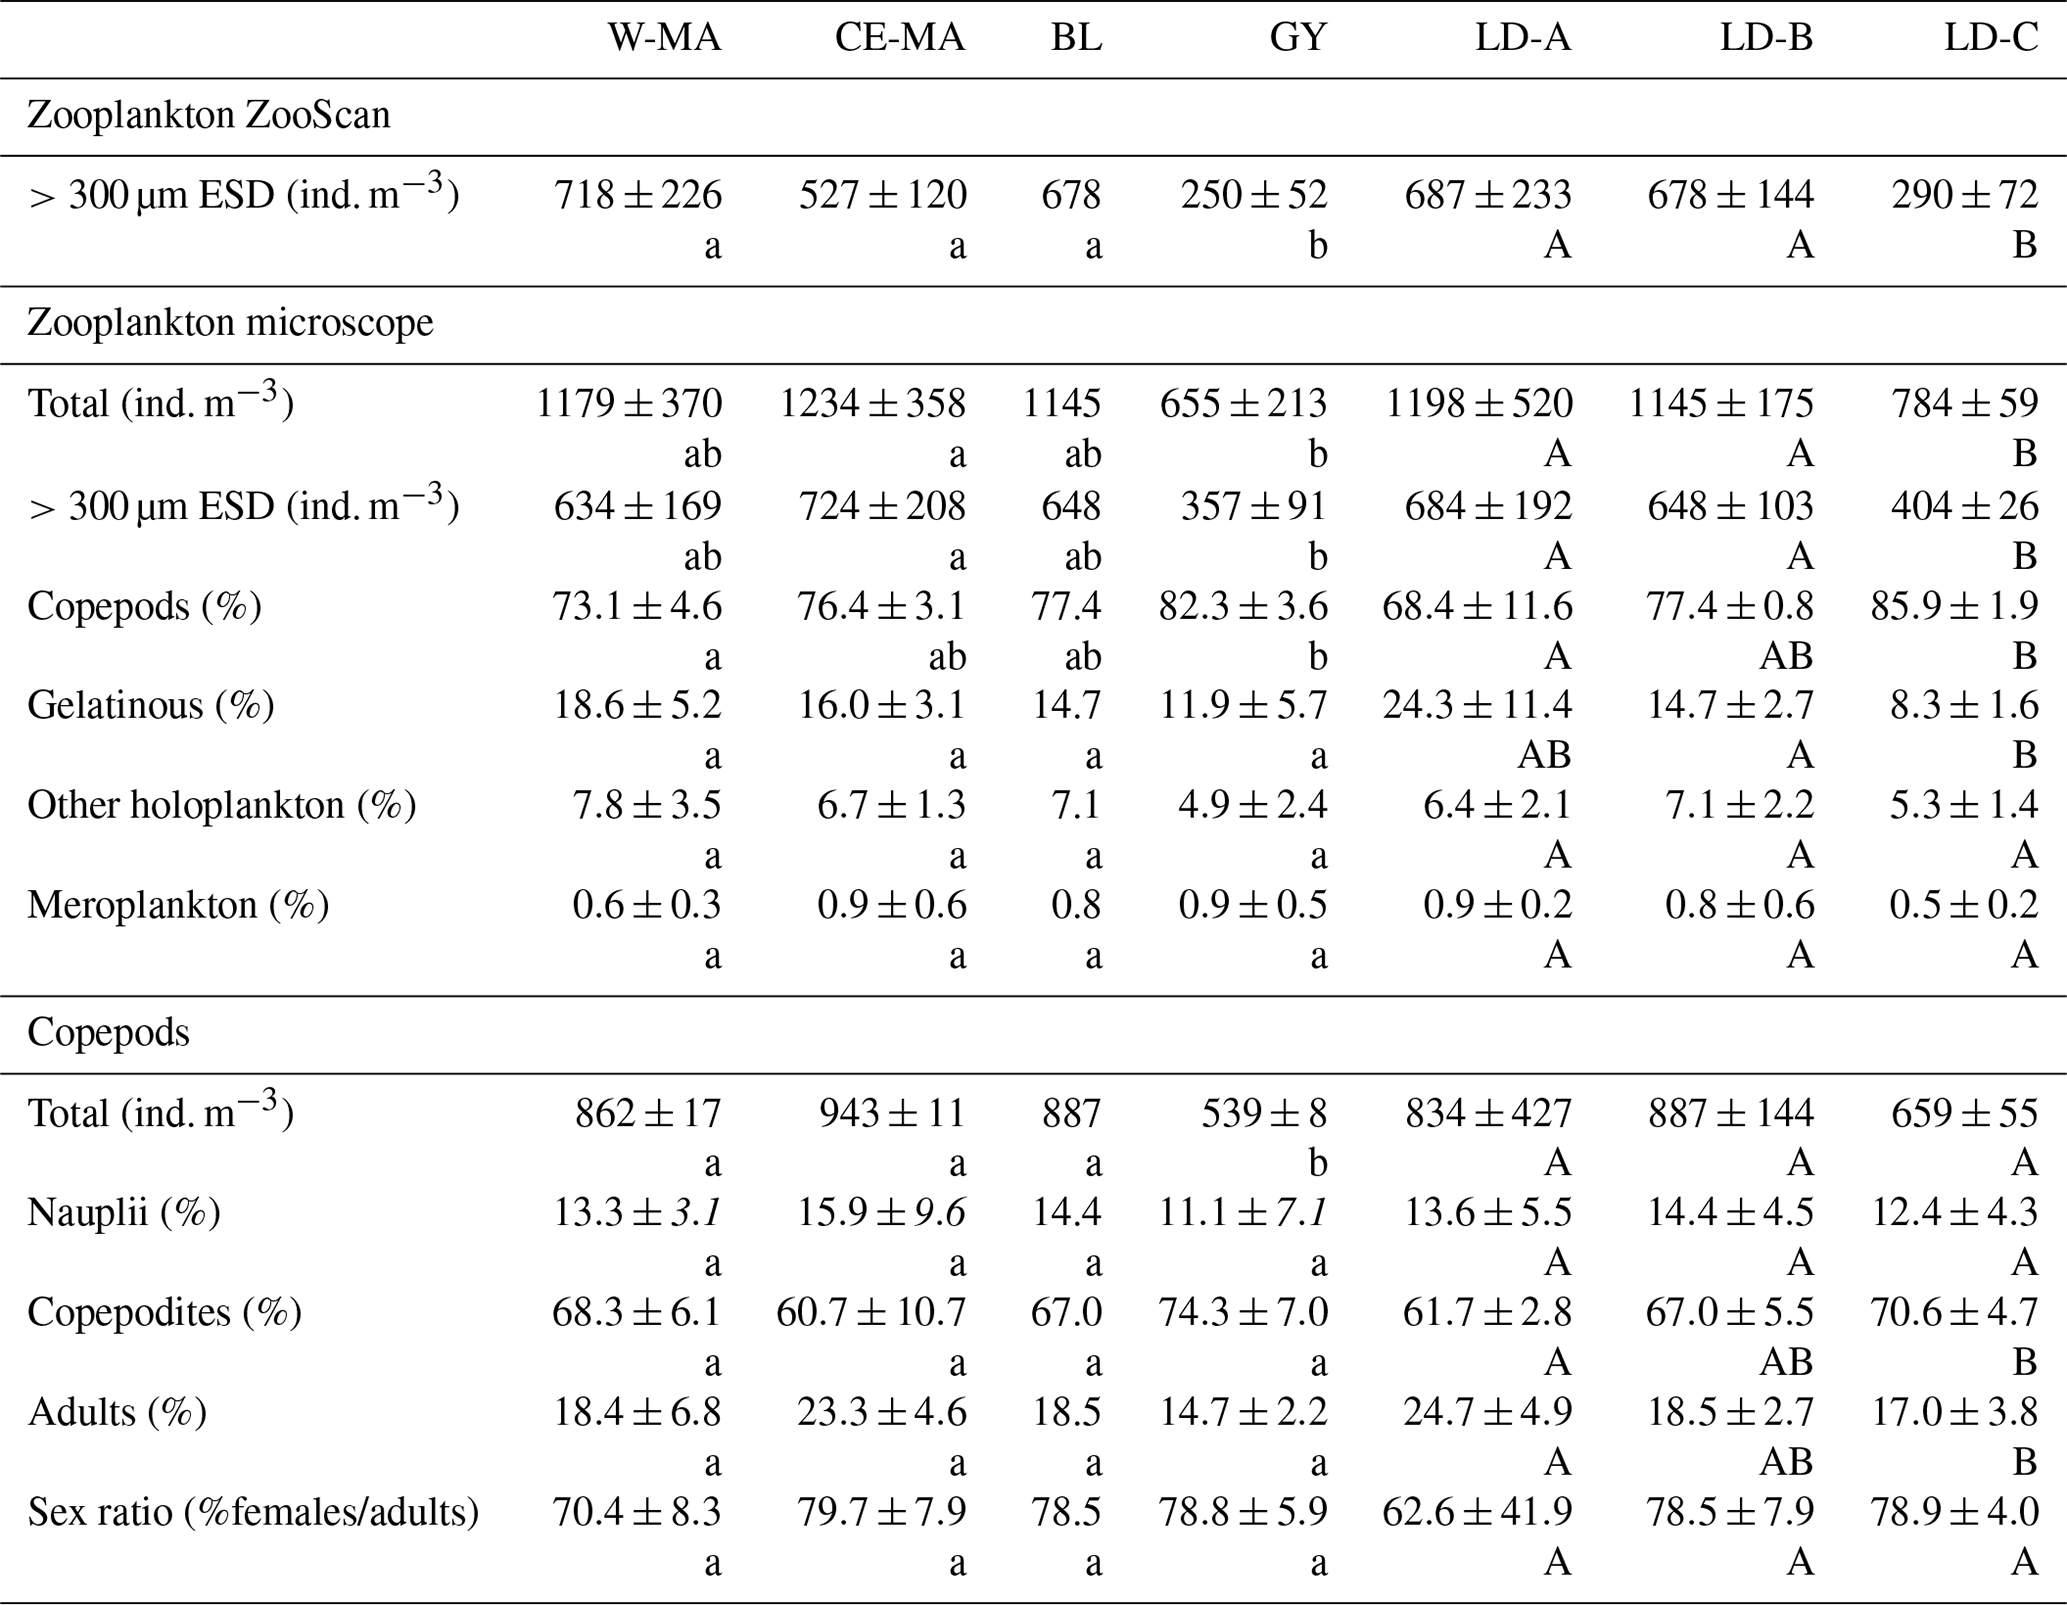
Table 2Mean values (± standard deviation) of zooplankton abundances from ZooScan and microscopic counts, percentage of taxonomic groups, and total copepod demographic parameters at the stations for the four clusters defined in the PCA on environmental variables (see Fig. 2) and for the three long-duration stations. W-MA: western Melanesian archipelago; CE-MA: central and eastern Melanesian archipelago; BL: station B (blooming conditions); GY: subtropical gyre. Letters below the mean values indicate homogeneous groups between zones (small letters) or LD stations (capital letters) according to post hoc Scheffé tests.
3.2 Spatial variations in zooplankton, abundance biomass, and size structure
The total zooplankton abundance estimated from microscope counting (Fig. 3a) and the total zooplankton biomass estimated from the cumulated biovolumes of organisms counted with the microscope (total or fraction < 300 µm) and ZooScan (fraction > 300 µm) (Fig. 3b) showed a general decreasing trend from west (SD-1) to east (SD-15), with local increases sometimes linked with Chl a increase (Tables 2 and 3). Detritus biomass (estimated with ZooScan) was also particularly high (40 %–50 %) in the Coral Sea region (SD-1 to SD-5 and LD-A), compared to other regions (17 % to 44 %) (Fig. 3b and Table 3). With the exception of stations SD-2, SD-3, and SD-9, total dry weights estimated from the biovolumes of counted organisms and particles (from binocular for ECD < 300 µm and from ZooScan for ECD > 300 µm) showed a good correspondence to measured total dry weight (Rs=0.721, p=0.001). In addition, total dry weights estimated from the ZooScan were well correlated with those estimated from binocular counting for the same size fraction (ECD > 300 µm): Rs=0.657, p=0.02. The total zooplankton abundance varied from 409 to 2017 ind. m−3 (Fig. 3a and Table 2). The highest values, but high variability as well, were observed in the New Caledonia region (SD1 to 4 and LD-A). There was a clear drop in abundance at GY stations (LD-C, SD-14, and SD-15) compared to all the other zones (W-MA, CE-MA, and BL; p<0.05). Microscope abundance showed relatively good agreement with ZOOSCAN abundance for the size fraction > 300 µm ECD (Rs=0.627, p=0.007). This fraction represented 49 % to 63 % of the total microscope counted zooplankton abundance (Fig. 3a and Table 2), whereas it represented 88 % to 98 % in terms of zooplankton biomass and was equally distributed in the different size classes, although with stronger variations for the >200 µm size class. The ratio of abundance of zooplankton size fractions above and below 300 µm ECD did not show any spatial trend.
Table 3Mean values (± standard deviation) among stations of each cluster defined in the PCA on environmental variables (see Fig. 2) of zooplankton biomass (top part of table, “Biomass (mg DW m−3)”) and percentage of total biomass for the different size fractions (bottom part of table, “Zooplankton biomass (%)”) and for the three long-duration stations. Zooplankton biomass estimated from weighing and from biovolume measurements from microscope and ZooScan observations. W-MA: western Melanesian archipelago; CE-MA: central and eastern Melanesian archipelago; BL: station B (blooming conditions); GY: subtropical gyre. Letters below the mean values indicate homogeneous groups between zones (small letters) or LD stations (capital letters) according to post hoc Scheffé tests.
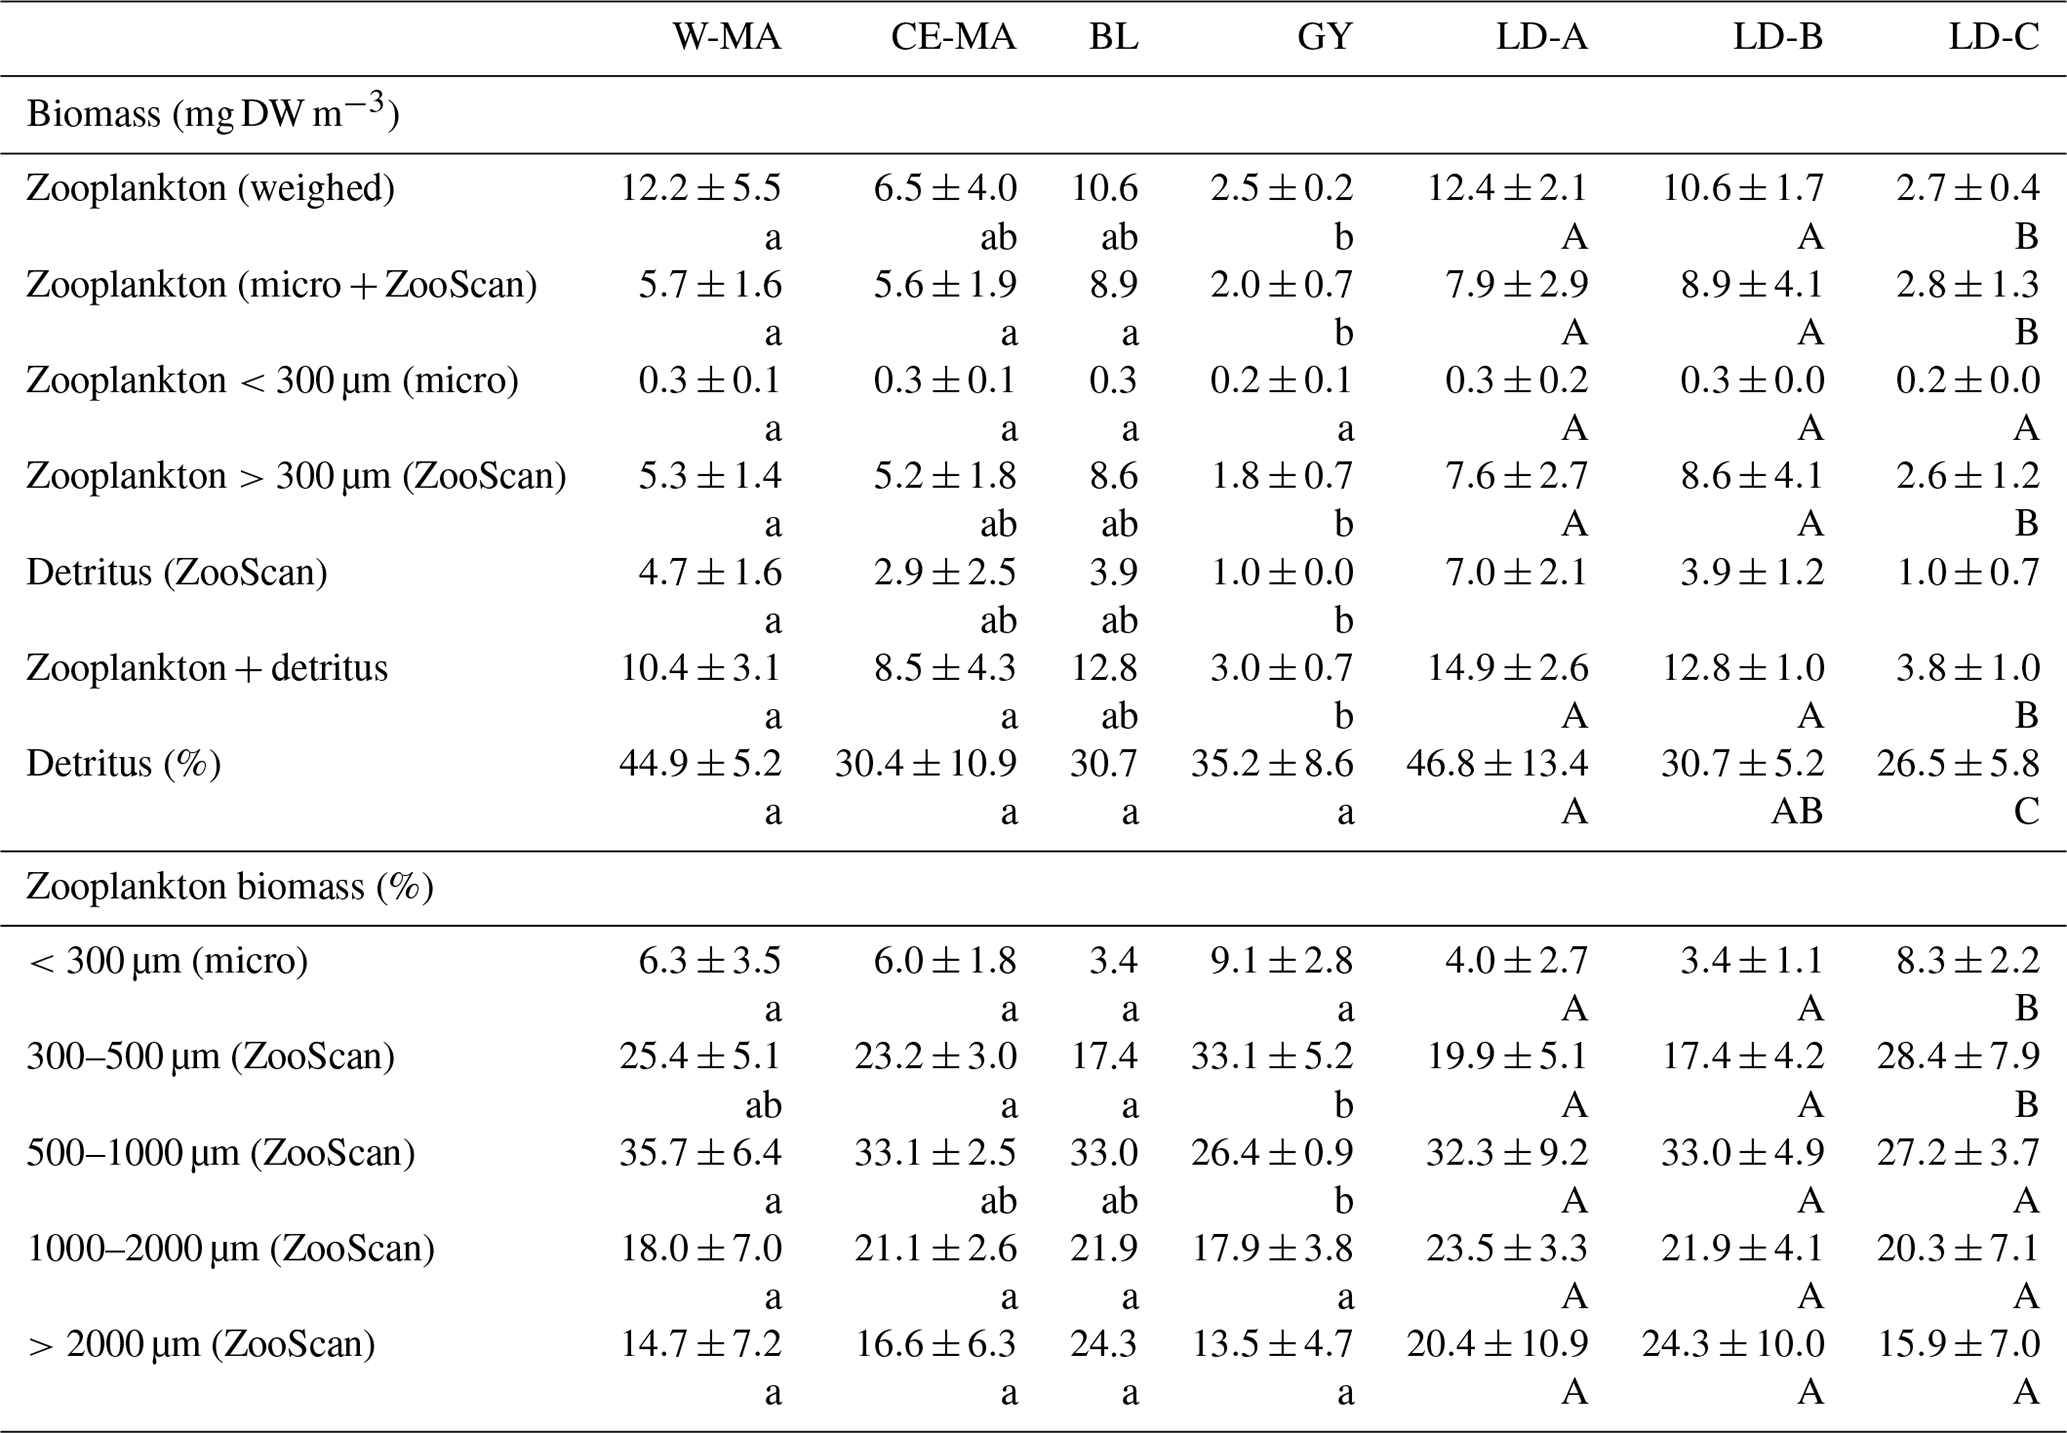
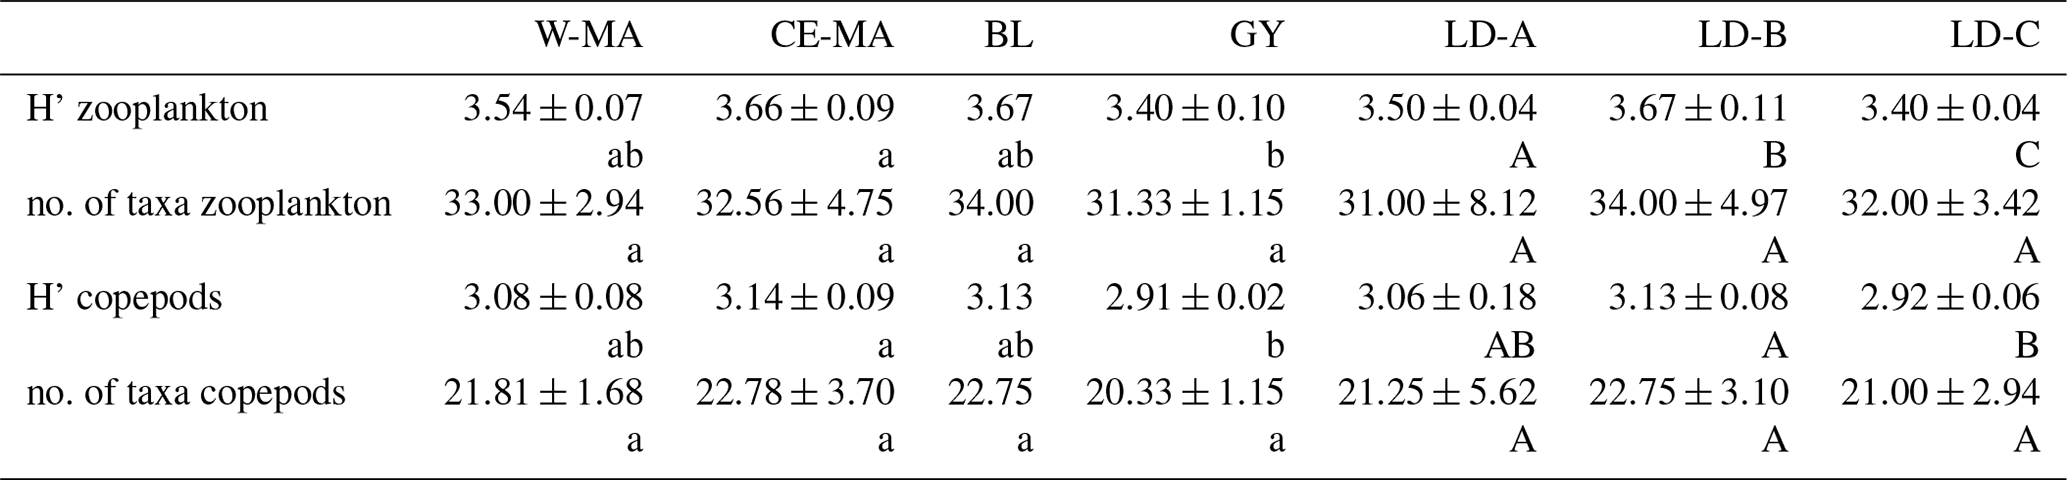
Table 4Mean values (± standard deviation) per region of taxonomic diversity (H': Shannon index) and taxonomic richness (no. of taxa per sample) calculated for total zooplankton and copepod communities. W-MA: western Melanesian archipelago; CE-MA: central and eastern Melanesian archipelago; BL: station B, blooming conditions; GY: subtropical gyre. Letters below the mean values indicate homogeneous groups between zones (small letters) or LD stations (capital letters) according to post hoc Scheffé tests.
Zooplankton abundance was negatively correlated with water column temperature (, p=0.028) and MLD (, p=0.000). It was positively correlated with Chl a (Rs=0.498, p=0.042) when considering all of the transect stations, but the correlation was negative for stations in the New Caledonia region (SD1 to 4 and LD-A; ; p=0.037) and highly positive for other stations (SD-5 to SD-15, LD-B, and LD-C; RS=0.804; p=0.002). Dry weight (weighed) as well as ZooScan zooplankton biomass (Fig. 3b and Tables 1 and 3) were both positively correlated with Chl a (RS=0.588, p=0.013 and RS=0.68, p=0.002, respectively). As for abundance, better correlations were found when considering stations SD-5 to SD-15 and LD-C (RS=0.783, p=0.002 for both variables), whereas negative correlation was found with ZooScan zooplankton biomass for stations in the Coral Sea (, p=0.035). Interestingly, detritus biomass was also well correlated with Chl a when considering the whole transect data (Rs=0.721, p=0.001) and data from stations outside the Coral Sea (Rs=0.755, p=0.004).
3.3 Taxonomic diversity in the different oceanic regions along the transect
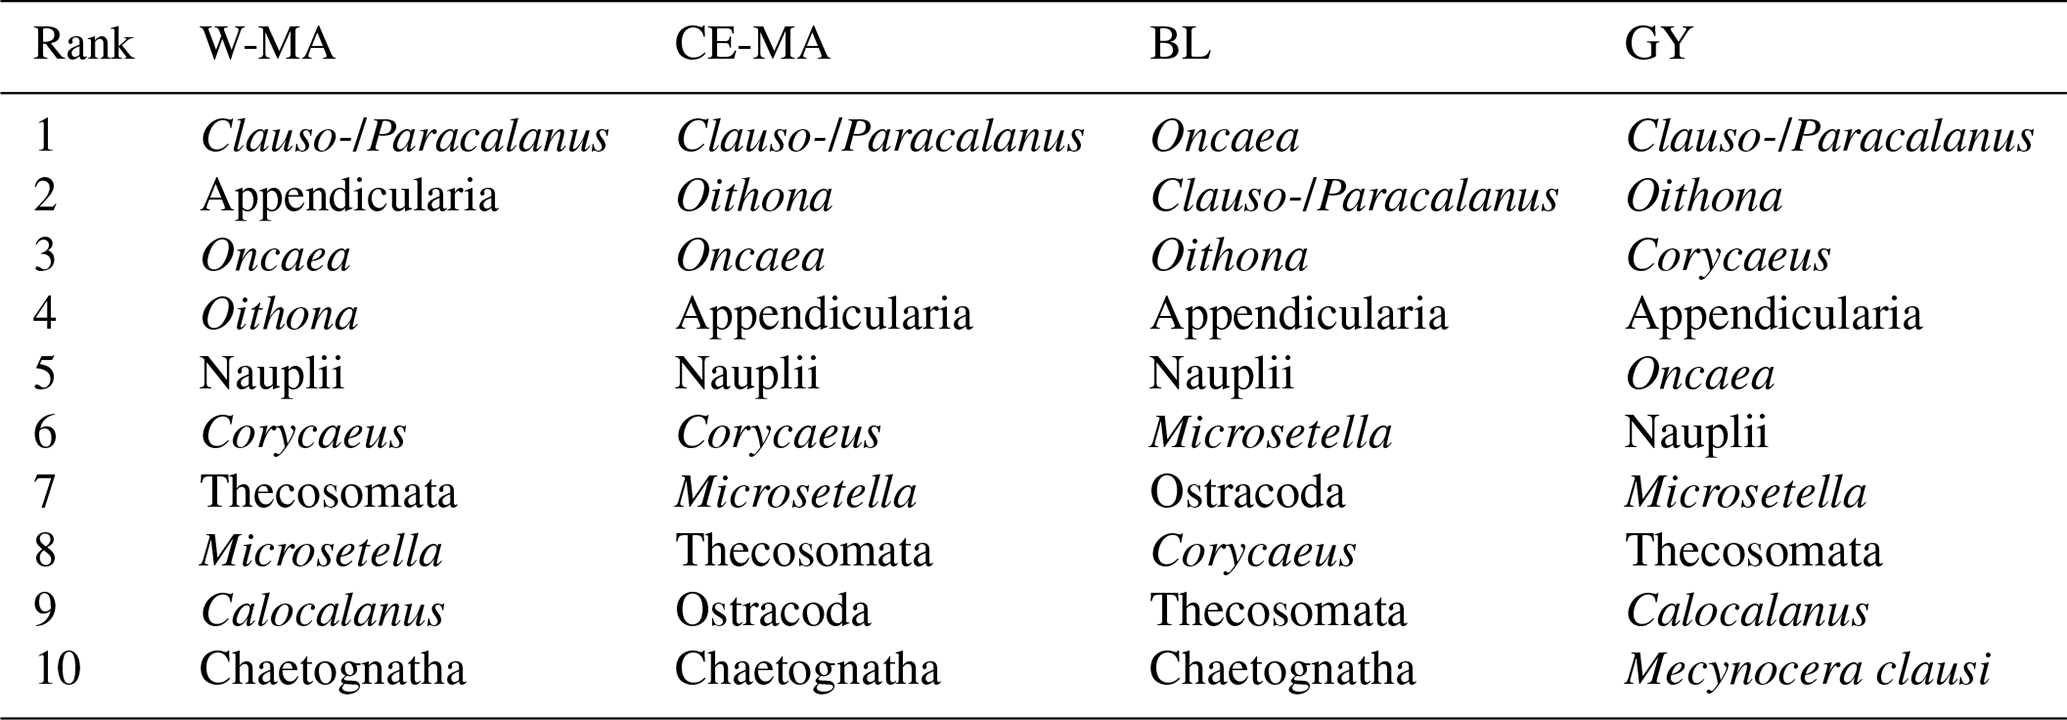
From the 120 µm mesh size bongo net, 66 zooplankton taxa were identified (see Table S1), with 41 genera/species of copepods plus miscellaneous nauplii and copepodites). The total number of zooplankton taxa per sample varied from 25 to 40, and the Shannon index varied between 3.3 and 3.76 bit ind.−1 (Table 4). These two variables displayed their minimum mean values in the GY zone. Copepods were the most abundant group (68 % to 86 % of total abundance), with a slight increase in their contribution from west to east (see Table 2), with a corresponding decrease in other contributors (gelatinous plankton and other holoplankton). Thus, copepod dominance was more prominent in the GY zone (79 % to 86 %) than at the other sites (<80 %). Among copepods, early life stages were dominant (69 %–88 % of copepod abundance) and included mostly copepodites (42 %–82 %). In the GY zone, the proportion of adults (mean = 15±2 %) was lower than in the three other zones (mean > 18 %), whereas the percentage of adult females was the lowest in W-MA. Clausocalanus/Paracalanus (25 % of copepod abundance), Oithona (19 %), Oncaea (18 %), Corycaeus (7.6 %), and Microsetella (4.6 %) were the most abundant copepod genera and were present at all stations sampled. All of these copepod taxa were listed in the top 10 species with respect to frequency of abundance for the four regions (Table 5), along with appendicularians, Thecosomata, and chaetognaths (except GY). Gelatinous zooplankton represented 8.3 % to 24.3 % of zooplankton abundance (see Table 2), with the lowest contributions at stations LD-C and SD-15 in the GY zone. They were dominated by appendicularians (8 %–17 %) and chaetognaths (0.8 %–3.3 %), whereas siphonophores, doliolids, salps, and hydrozoans represented <0.5 % of the total zooplankton abundance. Chaetognaths were rare in the GY zone (<1 %) and at SD-1 (0.2 %). Other holoplanktonic taxa (2.3 %–12.7 %) included Thecosomata (1.2 %–10.2 %), ostracods (1 %–4 %), and euphausiids (<1 %). Meroplankton was mostly polychaete larvae (0.2 %–0.5 %) and lamellibranch larvae (0.1 %–0.4 %), present in the four zones.
Table 5Top 10 taxa in frequency abundance for the four regions (W-MA: western Melanesian archipelago; CE-MA: central and eastern Melanesian archipelago; BL: station B, blooming conditions; GY: subtropical gyre).
The NDMS ordinations based on the relative abundance of the zooplankton taxa discriminated GY stations from the other stations (Fig. 4a; dissimilarity 20 %), mainly due to the contributions of Corycaeus (7 %) and Clausocalanus/Paracalanus (6.3 %) which were positively correlated to GY, and appendicularians (5.6 %), and chaetognaths (5 %), which were correlated to the other stations (Fig. 4b). However, the analysis did not discriminate between groups among W-MA, BL, and CE-MA stations, despite these groups being distinguishable on the basis of environmental data.

Figure 4NDMS of the main zooplankton taxa (>0.1 % abundance). (a) Plot of the stations with different colors between the regions identified with the environmental clustering (four regions: W-MA – western Melanesian archipelago; CE-MA – central and eastern Melanesian archipelago; BL – blooming conditions, station LD-B; GY – subtropical gyre). (b) Plot of the taxa.
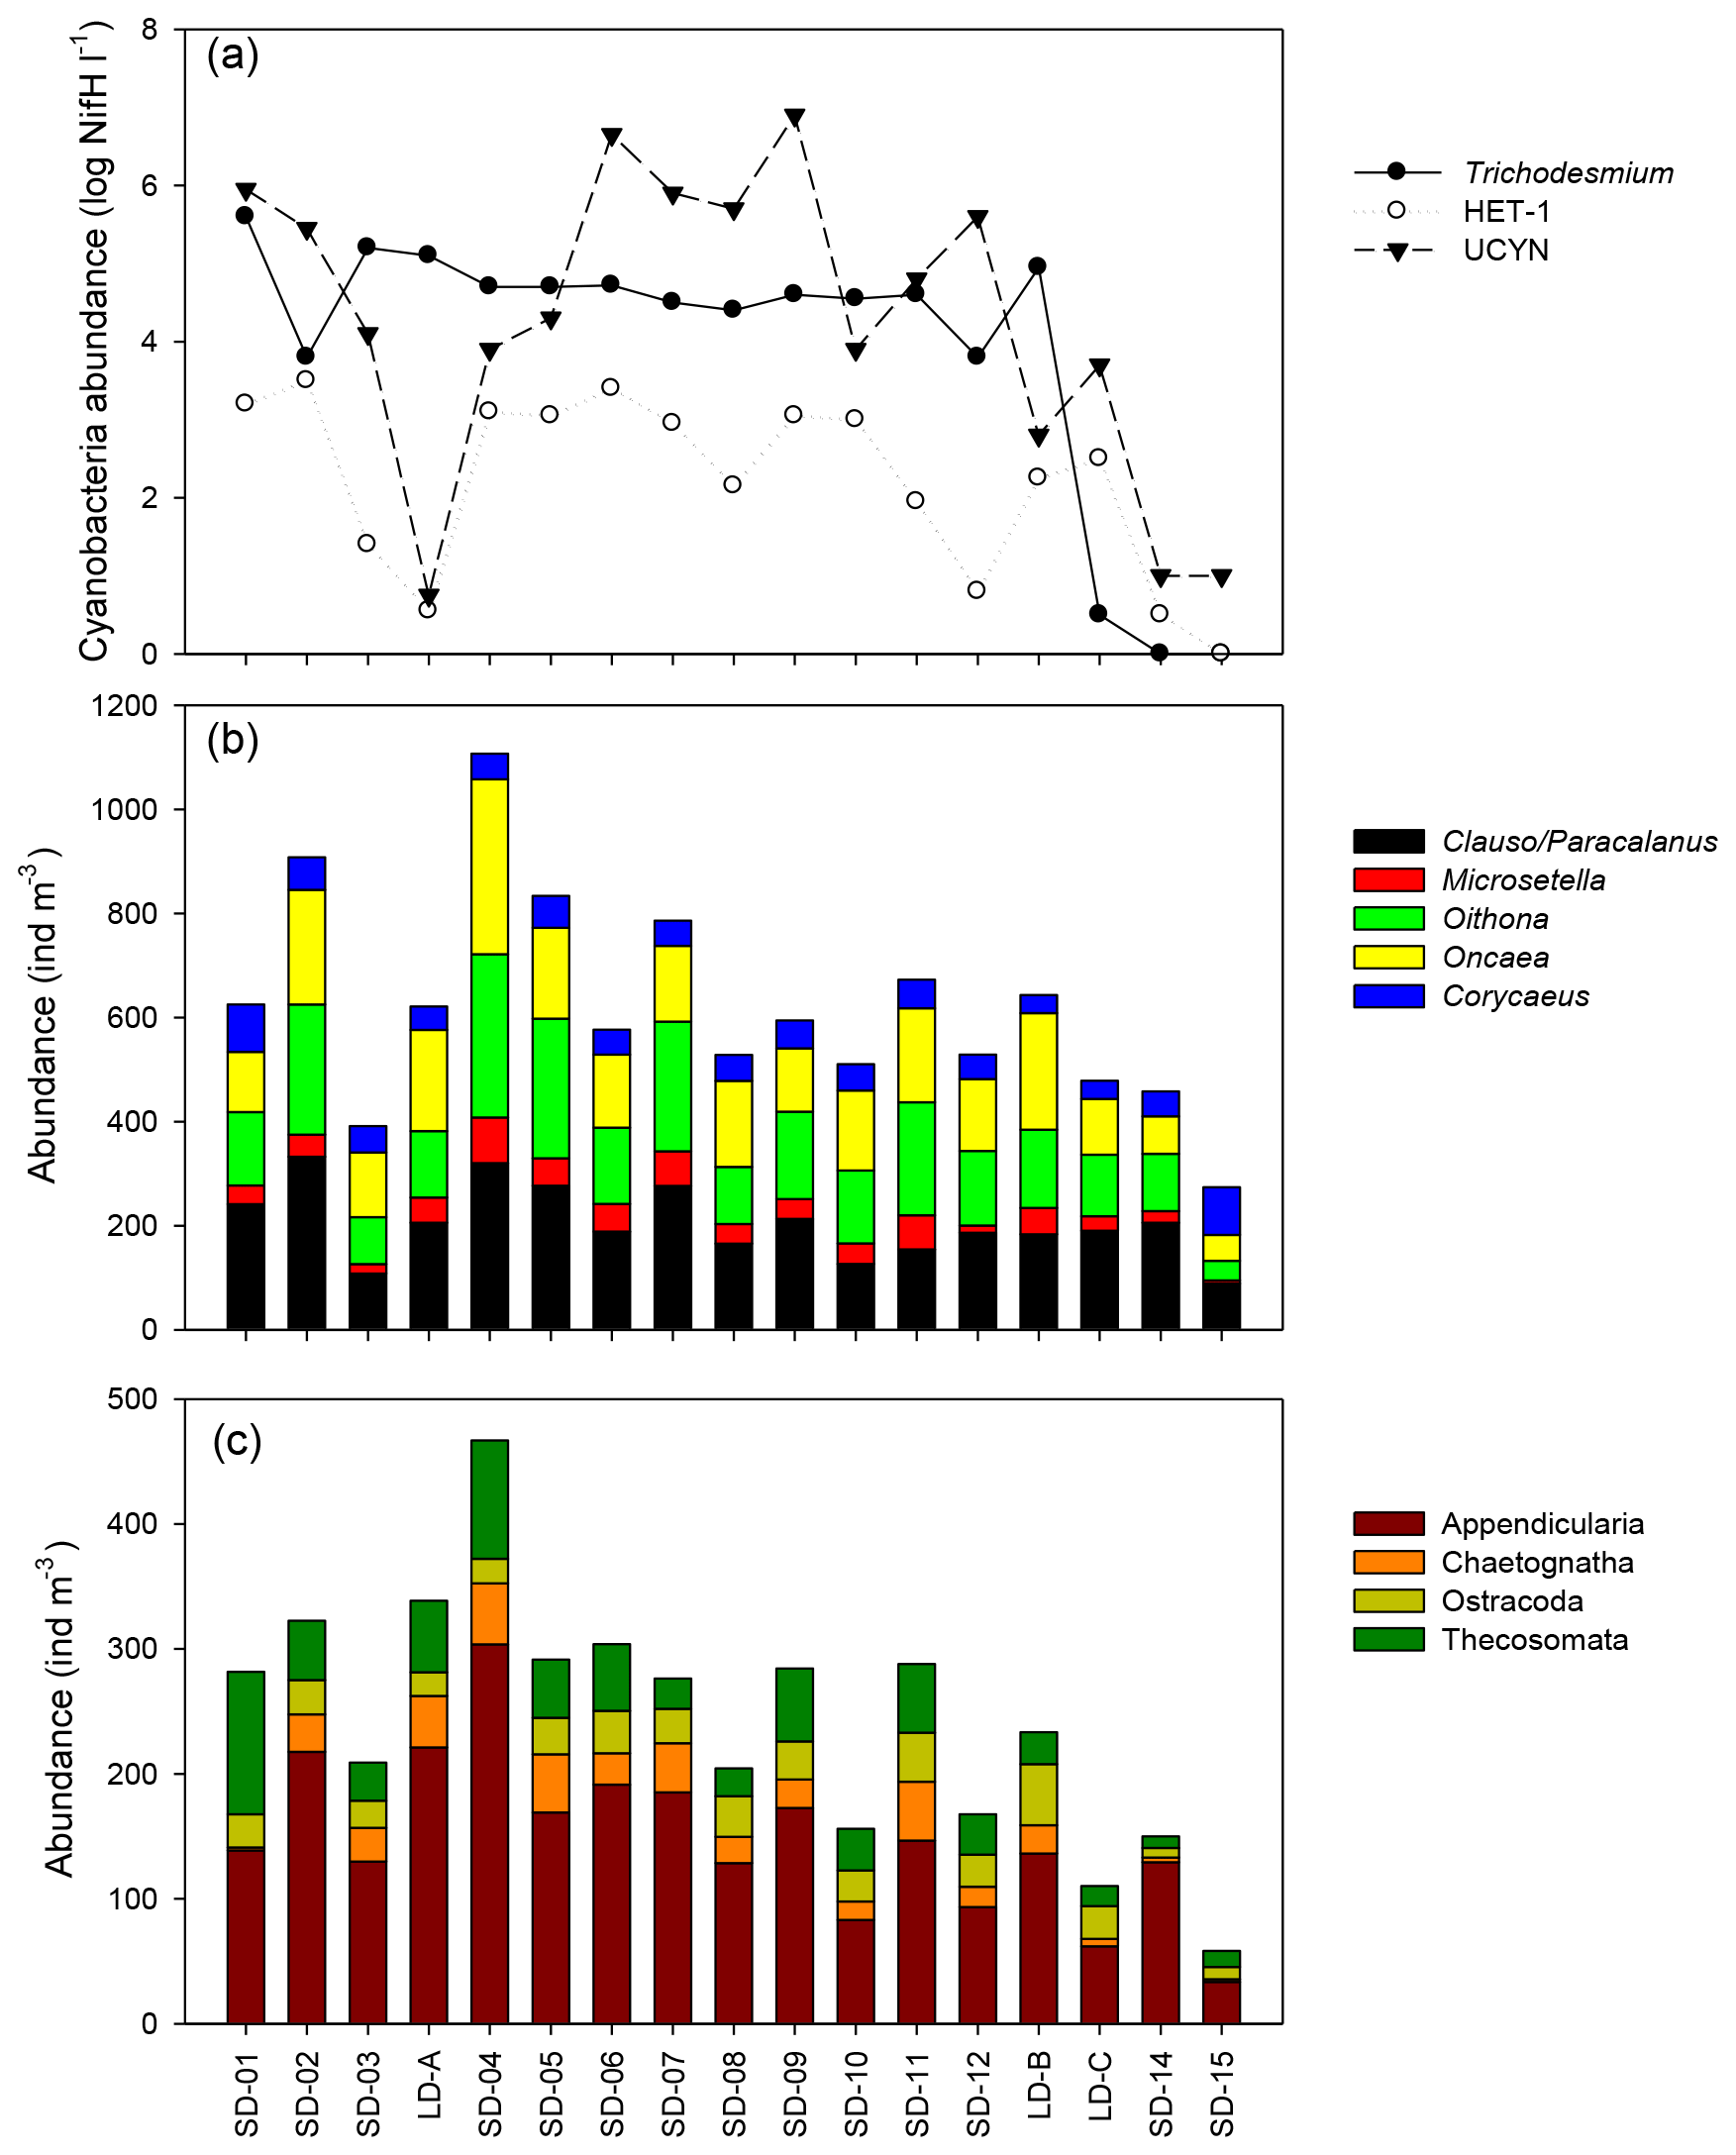
Figure 5Spatial variation in (a) log10 transformed mean nifH abundance values for three groups of diazotrophs across the transect: Trichodesmium, HET-1 , and UCYN-A and UCYN-B (adapted from Stenegren et al., 2018, their Fig. 2b). Abundance of (b) main copepod taxa and (c) main other zooplankton taxa.
3.4 Relationships between zooplankton taxa and diazotrophic microorganisms
According to the BEST procedure, the environmental variables best explaining the zooplankton community pattern were Trichodesmium abundance, MLD, and Chl a (r=0.593, p=0.05), whereas temperature, salinity, and unicellular (UCYN) or heterocystous (het-1) cyanobacteria were not selected. The abundance of major zooplankton taxa along the transect showed a strong positive link with the abundance of diazotrophic microorganisms (Fig. 5). Positive correlations were found between heterocystous cyanobacteria HET-1 and Microsetella (Rs=0.52; p=0.032), Clauso-/Paracalanus (Rs=0.61; p=0.009), Oithona (Rs=0.66; p=0.004), and Appendicularia (Rs=0.53; p=0.030) and between UCYN-B and Ostracoda (Rs=0.61; p=0.009. Only Macrosetella gracilis (Rs=0.684, p=0.002) and Oncaea (Rs=0.484, p=0.049) showed a significant relationship with Trichodesmium. Among non-copepod taxa, only Thecosomata, showed a positive correlation with Trichodesmium (Rs=0.631, p=0.007) and displayed significant lower abundance in GY compared to W-MA, CE-MA, and BL.
3.5 Temporal dynamics of zooplankton at the three long-duration stations and comparison with sediment trap content
At LD-A and LD-B, the zooplankton biomass observed each day (Fig. 6a) showed a dome-shaped pattern, with an increase over the 3 first days followed by a decrease. At both stations, successive day–night samples showed a biomass increase during the night, mainly due to the size fraction >2000 µm (euphausids, large copepods, etc.). At station LD-C, the zooplankton biomass was rather stable over the 6 days, without day–night variations. At LD-A and LD-B, the proportion of detritus found in the sample was high and appeared to increase at LD-A. At LD-A, we observed a much higher abundance at day 5 that at day 1, which did not follow the biomass pattern, whereas at LD-B and LD-C, the abundance was rather stable (Fig. 6b). Interestingly, the taxonomic distribution at the three stations (Fig. 7a) showed a stable structure for LD-B and LD-C but a relative increase in small forms (nauplii, small copepods) parallel to a Chl a increase for LD-A. At LD-B, abundance and biomass of zooplankton did not respond to the strong decrease in the bloom within the last 2 days. At LD-C the stability of both abundance and biomass was parallel to the stability of Chl a.
In the sediment traps situated at 150 m, there was a greater relative contribution of copepods at LD-C compared to LD-A and LD-B, as observed in the water column (Fig. 7b). In contrast, appendicularians were a major contributor of the swimmers found in the LD-C trap compared to their frequency in the water column, and by comparison with their respective frequencies at LD-A and LD-B. At LD-B, there was a sharp decrease in swimmers over time in the traps mainly due to copepods but a relative increase in Ostracod. Pteropods had high relative contribution in the traps (20 %–30 % at LD-A, around 10 % at LD-B and LD-C), whereas their relative abundance in the water column was low (1 %–4 %).
Table 6Mean values (± standard deviation) of plankton stocks, zooplankton weight-specific ingestion, respiration and excretion rates, zooplankton grazing, excretion and respiration fluxes, and zooplankton vertical fluxes. W-MA: western Melanesian archipelago; CE-MA: central and eastern Melanesian archipelago; BL: station B, blooming conditions; GY: subtropical gyre. Letters below the mean values indicate homogeneous groups between zones (small letters) or LD stations (capital letters) according to post hoc Scheffé tests. Zooplankton stocks are estimated from the cumulated biovolume of binocular-counted organisms. Swimmer biomass in sediment trap from Caffin et al. (2018a).
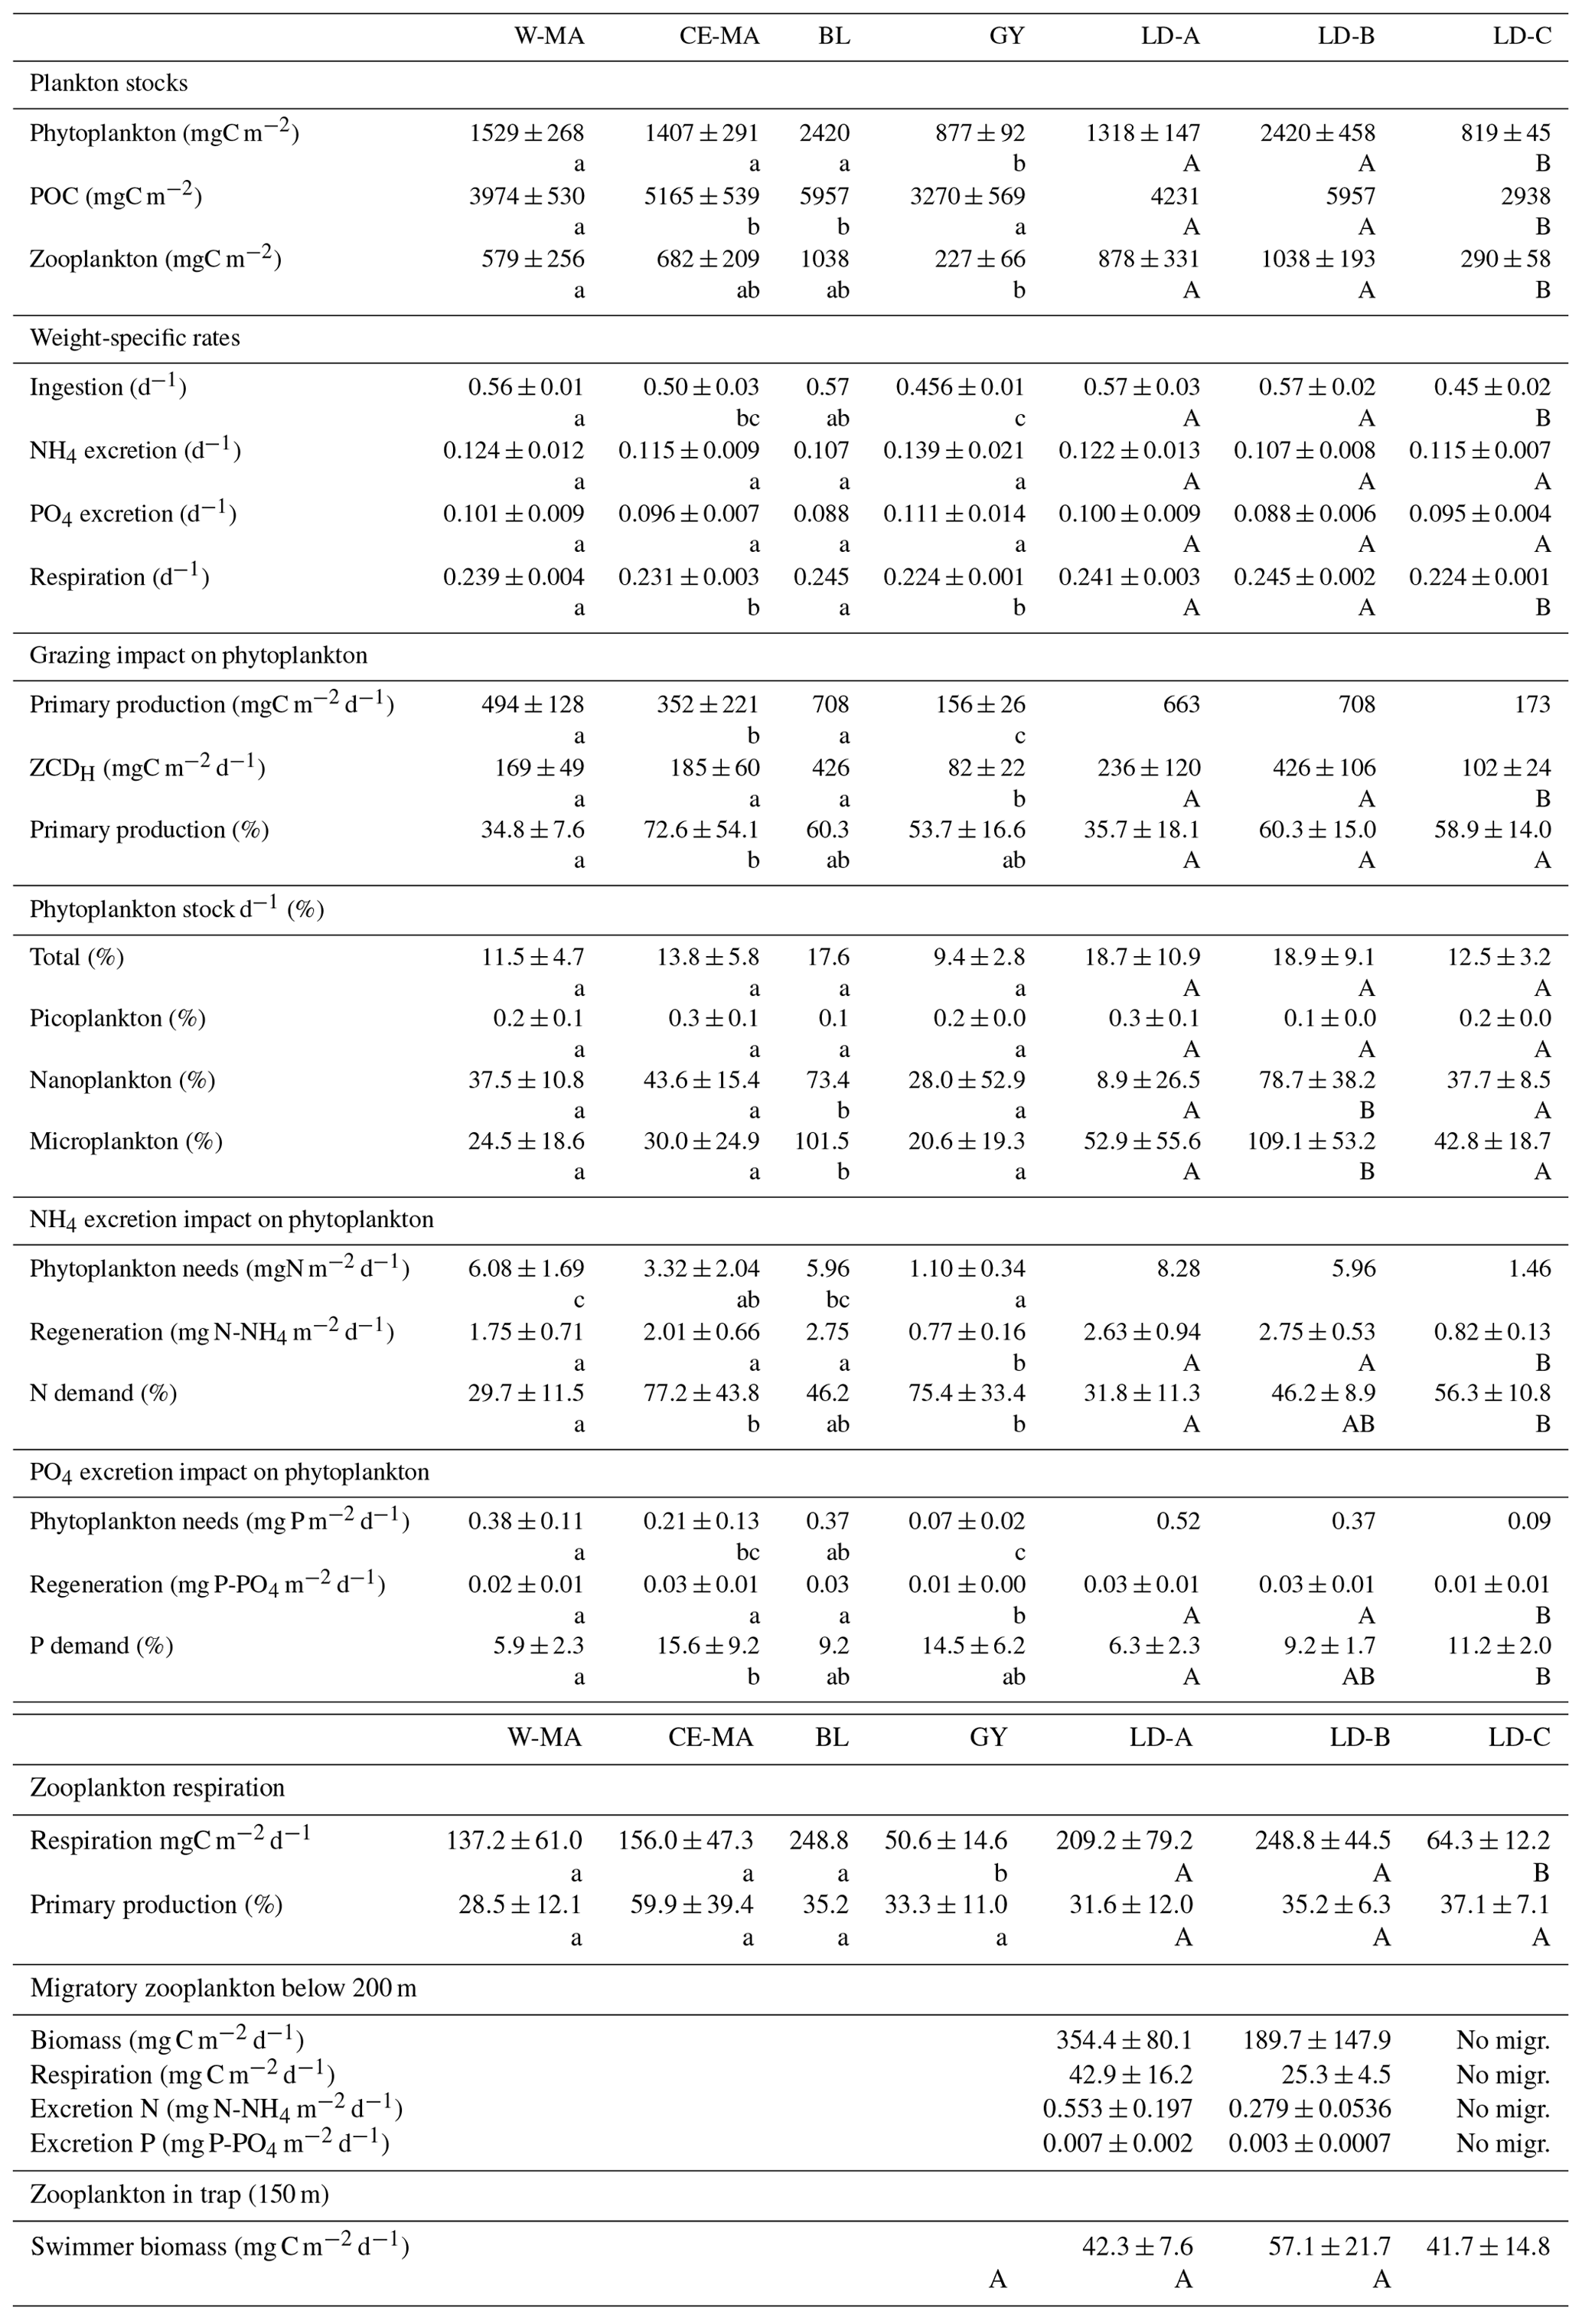
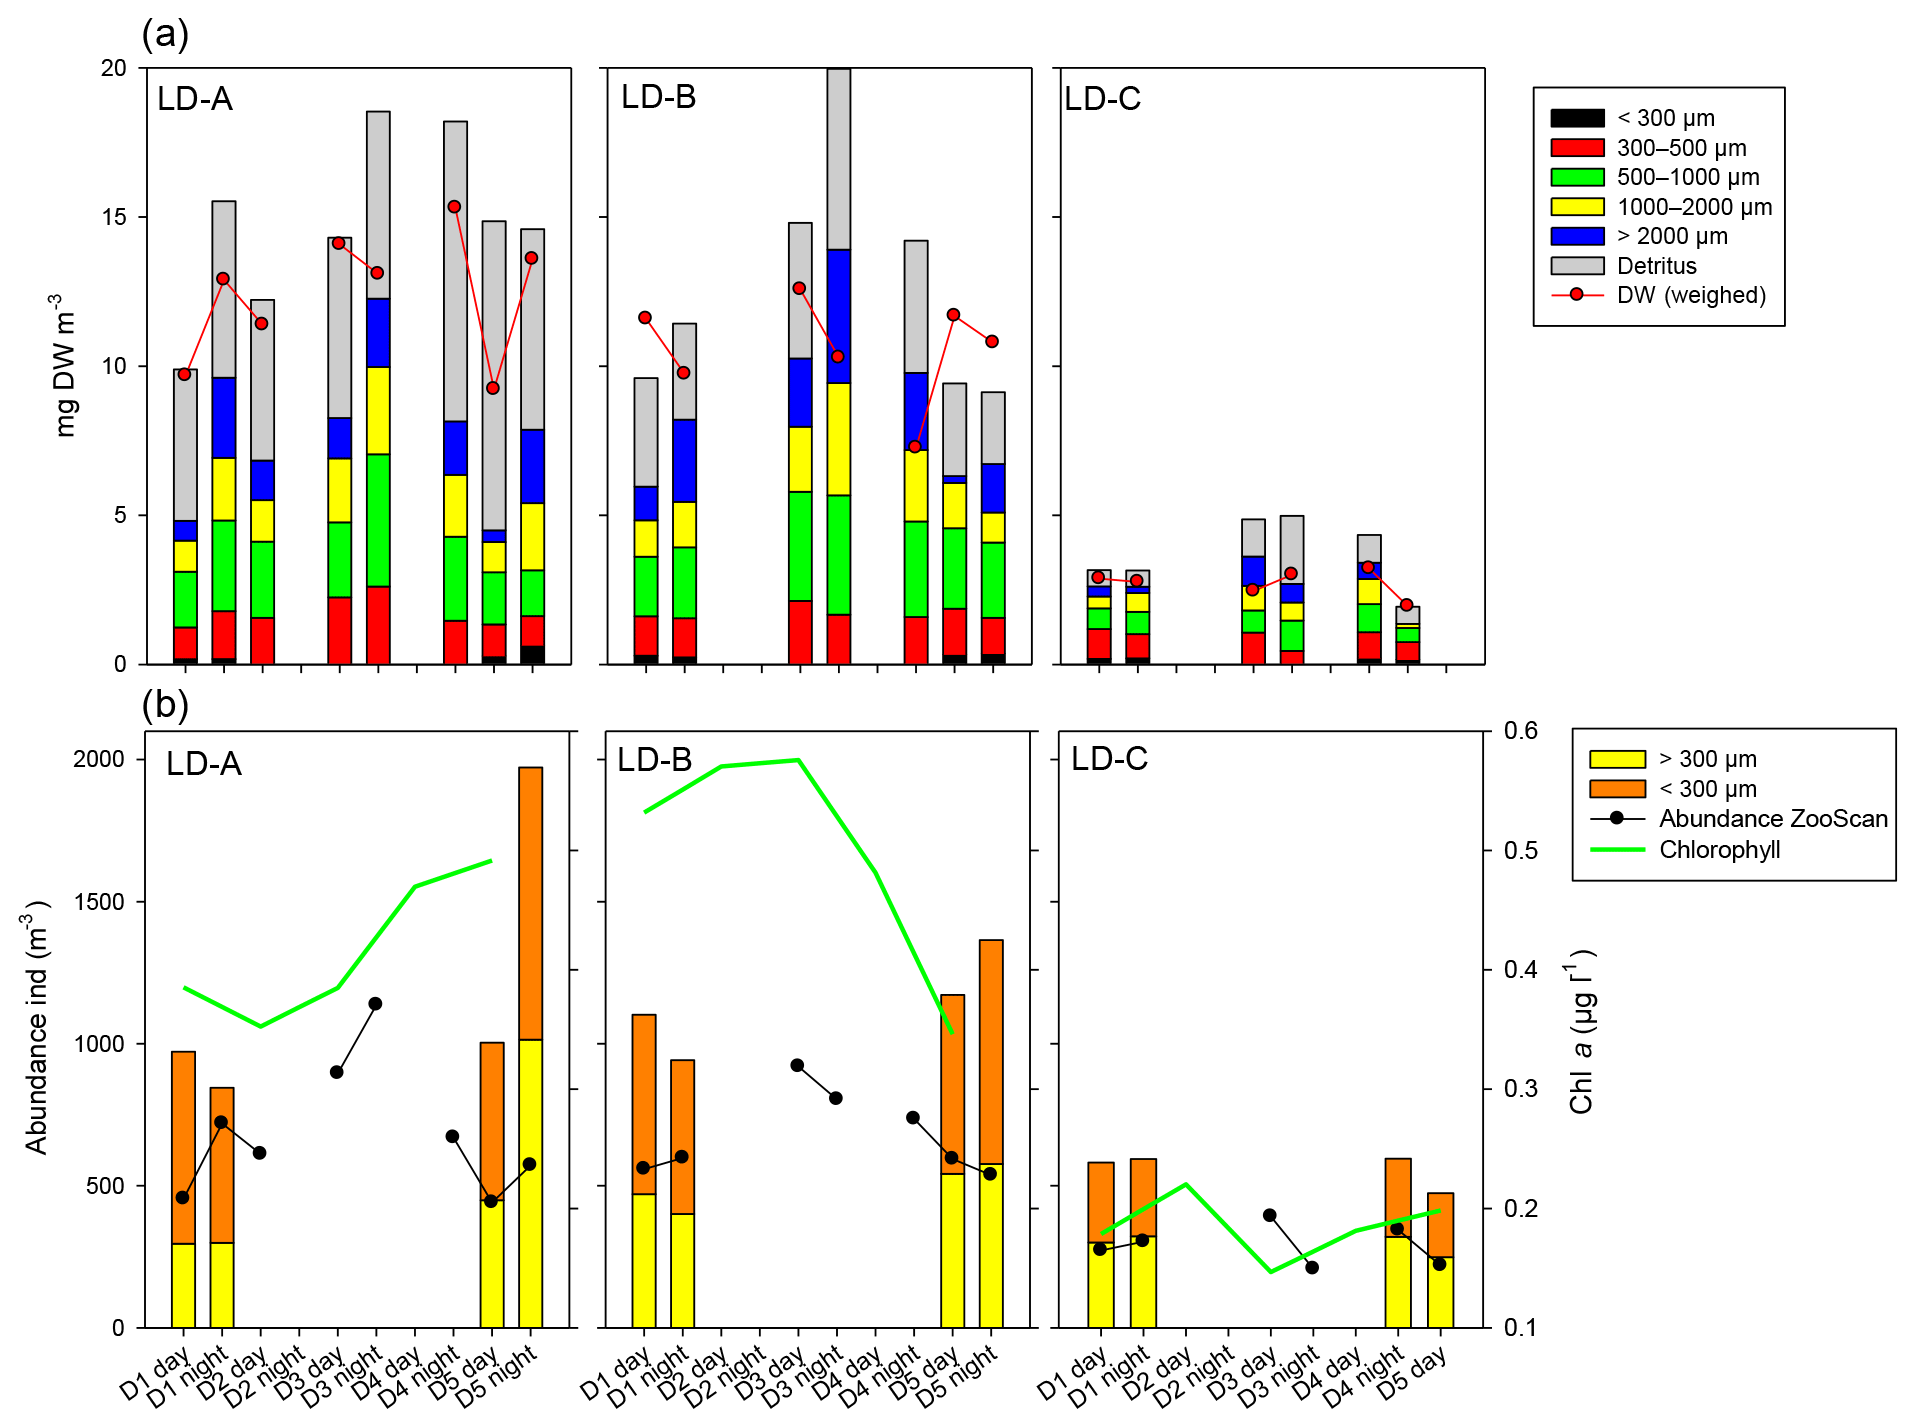
Figure 6Temporal variation in zooplankton abundance and biomass over 5 days at each of the three long-duration stations (LD-A, LD-B, and LD-C from left to right). (a) Abundance (ind. m−3) of small (ECD < 300 µm) and large (ECD > 300 µm) zooplankton determined by microscope counting (vertical bars – only for days 1 and 5) and of large zooplankton (ECD > 300 µm) determined by ZooScan (dark line). Chl a concentrations (green line). (b) Cumulated zooplankton biomass and detritus sampled. Red line – values of total dry weight determined by weighing at each station. The zooplankton biomass fraction < 300 µm was determined from microscopic counting. Zooplankton biomass fractions > 300 µm (four fractions) and detritus biomass were estimated from ZooScan biovolumes.

Figure 7Comparison of zooplankton abundance (orange triangles) and percentage of main taxa (bars) of zooplanktonic organisms (a) in the water column (0–200 m) and (b) in the sediment trap (“swimmers”) at 150 m depth at each of the three long-duration stations (LD-A, LD-B, and LD-C) from left to right. Sediment trap data at day 5 cannot be considered for the analysis (see Caffin et al., 2018a).
3.6 Estimation of fluxes related to meso-zooplankton
Biomass-weighted zooplankton δ15N values were lower in the regions W-MA and CE-MA, averaging 2.7 ‰ and 2 ‰, respectively, than in the GY, where zooplankton δ15N values averaged 8.5 ‰ (Fig. 8a). The δ15N values of the zooplankton corresponded with those of the POM, being lower west of the GY and increasing in the GY. We estimated that DDN contributed an average of 67 % and 75 % to zooplankton biomass in the W-MA and CE-MA regions, respectively (Fig. 8b). In the GY, the diazotroph contribution to zooplankton biomass decreased to an average of 22 % and showed a declining trend from west to east, with the lowest value of 7 % occurring at SD-15. The integrated phytoplankton standing stock derived from the water-column-integrated content of total chlorophyll a within the euphotic layer (Table 6) was highest at the LD-B and the lowest in the GY, although the stock generally decreased from west to east along the transect, as seen in Fig. 3a with the Chl a distribution pattern. Interestingly, regions with the lowest phytoplankton stocks (GY and CE-MA) presented the highest POC∕phytoplankton biomass ratio (3.73 and 3.67, respectively), whereas this ratio decreased to 2.46 in BL and to 2.60 in W-MA. The average zooplankton weight-specific rates of ingestion, and excretion, and respiration (Table 6) determined from allometric relationships for all zooplankton taxa (see “Material and methods”) were found to be rather stable over the different regions – although the test identified different ingestion in W-MA and GY, which reflected narrow variations in temperature and optimum available food supply (considering the contribution of phytoplankton and POC for the whole zooplankton community). The ingestion by herbivorous/omnivorous zooplankton (ZCDH) represented between 19 % and 183 % of the estimated primary production over all stations, but this percentage was very heterogeneous in CE-MA (with an average of 72.6 %), more stable in other regions, and fell to 34.8 % in W-MA including LD-A. The grazing impact on the phytoplankton stock increased from east to west but was less in GY (9.4 %) than BL (17.6 %). The impact on picoplankton was low (<0.25 % stock d−1) at all locations, and the grazing was distributed between nano- and microplankton in comparable proportions, with values particularly high in BL (mean was 73.45 % and 101.54 % of the stock per day for nano- and microplankton, respectively).

Figure 8(a) Biomass-weighted zooplankton and POM (5 m depth) nitrogen isotope ratios (δ15N). (b) Average percent contribution of diazotroph-derived nitrogen (DDN) to zooplankton biomass (ZDDN). W-MA: western Melanesian archipelago; CE-MA: central and eastern Melanesian archipelago; GY: subtropical gyre.
Weight-specific excretion rates varied between 0.11 and 0.14 d−1 for and between 0.09 and 0.11 d−1 for . Daily regeneration by zooplankton represented between 29.7 % and 77.2 % of phytoplankton needs for N and between 5.9 % and 165.6 % for P. The lowest and highest impacts of zooplankton on phytoplankton in terms of grazing and regeneration were found in the W-MA and CE-MA, respectively. Depth-integrated zooplankton respiration varied between 50.6 and 248.8 mgC m−2 d−1 and was significantly lower in GY than in W-MA, CE-MA, and BL (Table 6). The percentage of estimated zooplankton respiration rates to primary production was lowest in the W-MA region (7 % to 25 %), compared to the rates in the CE-MA (12 % to 112 %), BL (30 %), and GY regions (26 % to 52 %).
The biomass of migratory zooplankton to deep water during the 12 h daylight period was estimated from the difference of night and day biomass at the three long-duration stations (LD-A, LD-B, and LD-C), along with associated fluxes. The strongest impact of diel migration was observed at LD-A where half of the zooplankton biomass migrated, injecting 20 % of the surface zooplankton carbon biomass through respiration below 200 m. The biomass of migratory zooplankton and respiration below 200 m was reduced to half at LD-B, whereas no migration could be estimated at LD-C from our net tows. However, in terms of the percentage of primary production, the carbon released by zooplankton respiration below 200 m was comparable at the two stations LD-A and LD-B (3 % and 3.75 %, respectively). The daily biomass of zooplankton trapped in the sediment traps situated at 150 m at the LD stations was around 50 mgC m−2 d−1 , with no significant difference between stations (Table 6). At LD-A and LD-B, it represented, respectively, 12.7 % and 30.1 % of the migrating biomass.
4.1 What the OUTPACE transect contributes to the characterization of Longhurst's (2006) provinces ARCH and SPSG
The OUTPACE campaign delivered a unique 4000 km zonal transect across the southwestern tropical Pacific, straddling 20∘ S. This transect spanned two regions previously defined by Longhurst (2006): the southeastern part of the Archipelago Deep Basins Province (ARCH), a province of diverse basins of the Indo-Pacific archipelago, of which the Coral Sea visited during OUTPACE is the largest one; and the northwestern part of the South Pacific Subtropical Gyre Province (SPSG). Along the 20th parallel south, the transition between the two regions during OUTPACE was estimated to be west of Niue Island (19∘05′ S, 169∘52′ W) between the LD-B and LD-C stations (Moutin et al., 2017). The LD-C station was situated in a cyclonic eddy in the most oligotrophic part of the OUTPACE transect, close to the Cook Islands, and our PCA grouped it in a cluster of stations including SD-14 and SD-15 (GY), which clearly belong to the SPSG region. The position of LD-B relative to the region ARCH or SPSG is more debatable. LD-B was situated east of the Tonga Trench, whereas SD-12 was just north of the trench and SD-11 west of Tonga, with a bottom depth of 2500 m. The PCA situated the LD-B station between LD-C (GY group) and SD-12 (CE-MA group) on the first axis (see Fig. 2); however, due to the high Chl a values, LD-B was excluded from GY and CE-MA. The LD-B position was chosen on board, the survey strategy being modified by the development of Tropical Cyclone Pam, and was further east than initially planned. Therefore, it is possible that at this latitude (20∘ S), the position of the limit between ARCH and SPSG is west of LD-B, at the level of the Tonga Trench, and that LD-B presented special conditions due to the storm in the most western part of SPSG.
As mentioned by Longhurst (2006), the ARCH province is a mosaic of different regions. During OUTPACE, two sub-regions were differentiated by PCA (Fig. 2). The first, W-MA, is to the north of New Caledonia (SD-1 to 3 and LD-A – MAW in Moutin et al., 2018), and the second, CE-MA, extends through the tropical islands east of New Caledonia (eastern part of the Coral Sea), south of Vanuatu and Fiji, and north as far as Tonga (SD-4 to SD-12 – MAE in Moutin et al., 2018). The limit between the two regions in the Coral Sea is linked to the seasonal position of the South Fiji Jet and the bathymetry (Ceccarelli et al., 2013). During OUTPACE, SD-4 and SD-5, at the northern frontier of the Norfolk ridge and over the New Hebrides trench, under the influence of the South Fiji Jet, were grouped with the CE-MA station in our PCA.
4.2 Spatial structure of zooplankton biomass and abundance related to the physical and biogeochemical environment
The distribution of meso-zooplankton abundances and biomasses during OUTPACE presented a decreasing west–east gradient. The pattern followed the sea surface chlorophyll gradient, which in turn reflected the oligotrophic gradient, with higher values obtained at W-MA, intermediate values at CE-MA, and lowest values at GY (Moutin et al., 2017). We found a positive correlation between zooplankton biomass (and abundance) and Chl a from stations SD-5 to SD-11, but a negative correlation at the Coral Sea stations SD-1 to SD-4. During OUTPACE, the highest zooplankton biomass was found in the CE-MA region (LD-A, SD4, and SD5), but high values were also found at LD-B and to a lesser extent at SD-9. In all cases, these higher values were associated with productivity enrichment linked to mesoscale features (Rousselet et al., 2018, their Fig. 3, top panel). The survey path from stations SD1 to SD5 passed through a succession of cyclonic and anticyclonic eddies, but the distance between sampling stations was unfortunately not well enough resolved to map them. A few studies have related the impact of mesoscale structure on zooplankton distribution in the region (Le Borgne et al., 1985; Smeti et al., 2015). Around Maré (the southernmost of the Loyalty Islands), Le Borgne et al. (1985) found similar zooplankton enrichment, not correlated with chlorophyll increase but associated with diverse mesoscale processes, and in particular the island mass effect leeward (west) of Maré. It can be expected that such patterns are general features in regions where zooplankton aggregations occur more in flow-disturbed areas than in free stream jets (Rissik et al., 1997). In such regions, nutrient injections into the euphotic layer may cause intermittent short-lived phytoplankton production enhancement. However, zooplankton biomass increase may lag behind the phytoplankton production increase by a couple of weeks, a duration equivalent to the average development time of zooplanktonic organisms at local temperatures. At the long-duration stations LD-A and LD-B, chosen to elucidate the impact of ephemeral blooms on the ecosystem response and fate of primary production, the zooplankton population responded with high production of larval forms over the 5-day station occupation, but this response yielded limited biomass changes. Other mesoscale activities were observed in the CE-MA region during OUTPACE between 170 and 180∘ W (Rousselet et al., 2018), which could explain the relative increase in zooplankton biomass at SD-9. In general, the zooplankton biomass and abundance and the taxonomic distribution vary from the center to the edge of an eddy, whether it is cyclonic or anticyclonic in nature (Riandey et al., 2005), but the sampling resolution during OUTPACE did not allow us to take into account this mesoscale variability.
Station LD-B was selected because of a large surface Chl a signal observed by satellite (de Verneil et al., 2017) for several weeks prior to sampling, and its sampling occurred at an advanced bloom stage with high N2 fixation rates as the source of new production (Caffin et al., 2018a). Due to the late stage of this bloom when it was sampled, the potential physical processes that induced its formation cannot be definitively established (de Verneil et al., 2017). Chlorophyll decreased sharply during the period of observation, demonstrating a collapsing Trichodesmium bloom (Caffin et al., 2018a). Concomitantly, the abundance and taxonomic composition of zooplankton remained homogeneous in the water column. But the abundance of swimmers in the sediment traps decreased by half (Caffin et al., 2018a), suggesting an associated reduced zooplankton activity (production, vertical migration) not associated with high mortality. In contrast, the abundance and biomass of zooplankton in the ultra-oligotrophic waters of the GY, were substantially lower than the MA region (W-MA and CE-MA), linked to a far lower primary production, mainly concentrated at a deeper chlorophyll maximum (115–150 m depth) in the GY waters (Van Wambeke et al., 2018; Moutin et al., 2018) and associated with a reduced contribution of DDN.
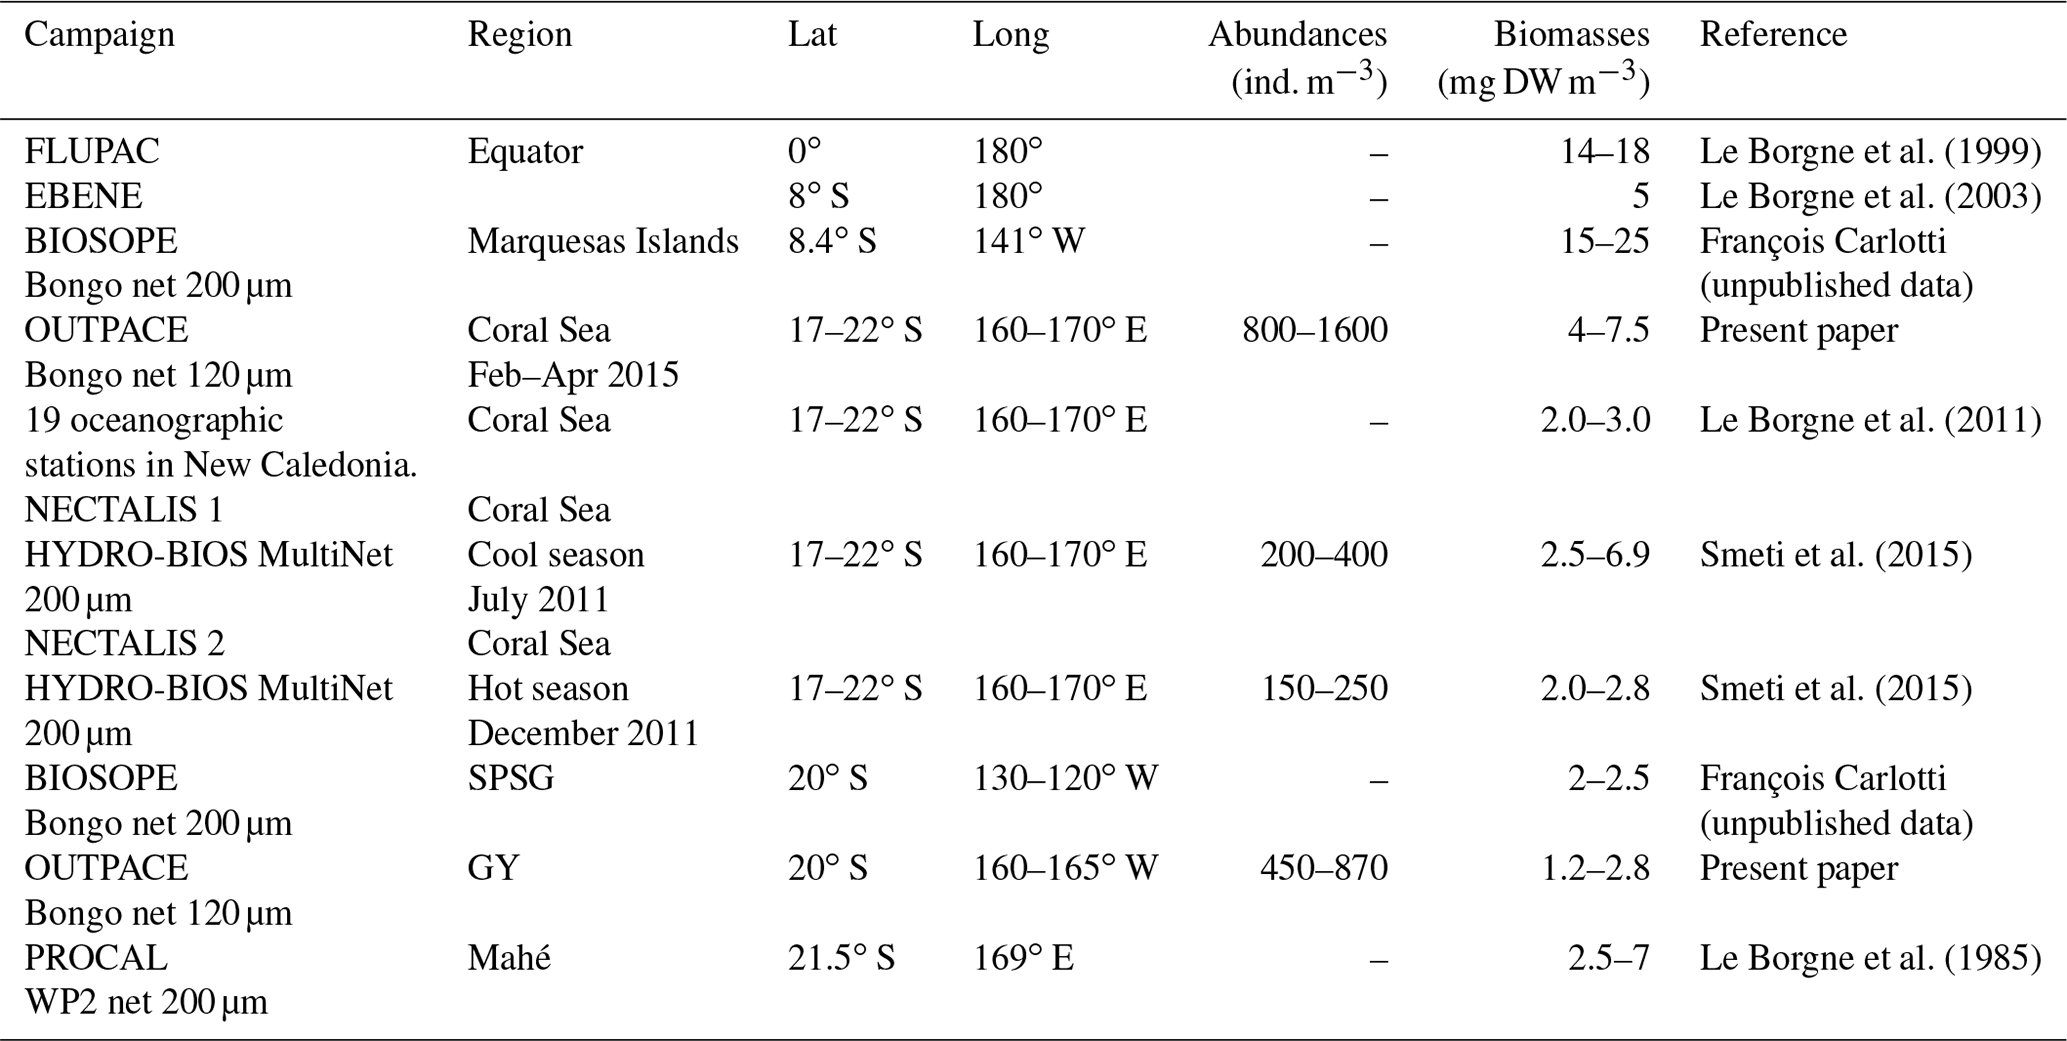
Table 7Average zooplankton abundance and biomass values from different regions of the western and central tropical South Pacific around the 20th parallel south.
The taxonomic structure found during OUTPACE (April–May) in the four zones (W-MA, CE-MA, BL, and GY) showed a high degree of similarity in terms of species richness and abundance distribution across the whole region. A moderate difference was observed in the GY, where the copepod contribution to meso-zooplankton was higher than in MA and LD-B, mostly in the small size classes (see our Table 3). In W-MA and CE-MA, the sampling of teleost eggs and juveniles of Euphausiacea, although certainly under-sampled with our bongo net, indicated the presence of higher trophic levels in deeper waters in this region (Roger, 1994; Bertrand et al., 1999). In the Coral Sea, Rissik et al. (1997) and Smeti et al. (2015) found similar taxonomic composition showing relative stability in zooplankton composition, despite spatial and temporal heterogeneity in environmental conditions. Our results suggest that this taxonomic stability in zooplankton assemblage remains valid for the extended WTSP. Interestingly, the analysis by Dolan et al. (2016) of the tintinnid ciliate community at stations LD-B and LD-C during OUTPACE found similar species richness, abundance distribution, and size structure, with only the morphological diversity presenting some differences.
Data on the abundances and biomasses of meso-zooplankton in the WTSP (Table 7) are scarcer than in the equatorial waters (Le Borgne et al., 2011) and the eastern subtropical Pacific (Fernández-Álamo and Färber-Lorda, 2006). Table 7 shows a general consistency between all these data for the tropical area, although variations could be discussed with respect to sampling season, regional spatiotemporal physical patterns, and sampling methods. Our data for the Coral Sea are comparable to those Smeti et al. (2015) and Le Borgne et al. (1985, 2011) obtained at different seasons in oceanic waters around New Caledonia. Smeti et al. (2015) observed that the stations situated between New Caledonia and the Loyalty Islands registered the highest abundance and biomass values during the cold season but also the widest variations between stations. Around Mahé, Le Borgne et al. (1985) found values ranging from 2.5 to 7 mg DW m−3. In contrast, Le Borgne et al. (2011) found slightly lower biomass values than those observed during OUTPACE for oceanographic stations situated nearer to New Caledonia. All of these results highlight that the various mesoscale structures linked to flow disturbance in these oligotrophic bodies of water such as the Coral Sea have a significant effect on the distribution and abundance of zooplankton, imparting substantial heterogeneity, while also being the main seasonal driver of productivity in the region (Menkes et al., 2015; Smeti et al., 2015). On the eastern side of the OUTPACE transect, few data between 120 and 140∘ W, near the Marquesas Islands, give comparable low biomass levels (2 to 2.5 mg DW m−3; BIOSOPE survey – Table 7). During the EastroPac cruise at 20∘ N–20∘ S and 110∘ W, Longhurst (1976) found abundance values ranging between 100 and 900 ind. m−3, similar to our observations. He noted that copepods were the dominant taxa, followed by chaetognaths and euphausiids. Between these two ends of the OUTPACE transect, no data were found for comparison with our observations. The obvious increased abundance and biomass in the MA (W-MA and CE-MA) region compared to the GY region is linked to waters of the Melanesian archipelago being enriched by contact with multiple islands compared to the ultra-oligotrophic characteristics of the gyre (Rousselet et al., 2018). There is somehow more information on zooplankton biomass and abundance in the equatorial Pacific collected during the JGOFS program (Murray et al., 1995, and Le Borgne and Landry, 2003). Le Borgne et al. (1999) studied the zonal variability of zooplankton and particle export in April–May 1996 in the equatorial Pacific upwelling between 165∘ E and 150∘ W. This parallel transect to OUTPACE showed a general decreasing trend of zooplankton biomass from 14.4 mg DW m−3 at the eastern end to 8 mg DW m−3 at the western end (Le Borgne et al., 1999, their Fig. 3), which was associated with a decrease in Chl a. Almost all studies comparing zooplankton biomass sampled from the Equator towards the tropic also show a strong zooplankton decrease parallel to the decrease in Chl a (Ikeda, 1985, his Fig. 3b; Dai et al., 2016; White et al., 1995; Fernández-Álamo and Färber-Lorda, 2006; Le Borgne et al., 2003).
4.3 Zooplankton association with diazotrophs
The OUTPACE transect was undertaken in a region known for its high N2 fixation (Dupouy et al., 2011), which can contribute 30 %–50 % of new production (Karl et al., 2002). During austral summer conditions, the Melanesian archipelago (New Caledonia, Vanuatu, Fiji; Niue, our W-MA and CE-MA regions) is known for its recurrent large Trichodesmium blooms, which dominate the diazotroph community (Bonnet et al., 2015), complemented by high abundances of UCYN-B (Bonnet et al., 2015; Moisander et al., 2010). During OUTPACE, very high values of N2 fixation were recorded in most of the W-MA and CE-MA stations, particularly in the upper 25 m, with a slight decrease at SD-9 and SD-10 (Bonnet et al., 2018, their Fig. 2e). Conversely, in the GY region, the N2 fixation rates dropped to much lower values, with maximum levels occurring deeper in the water column (∼50–60 m). In the W-MA and CE-MA regions, N2 fixation was mainly attributed to high concentrations of Trichodesmium and to a lesser extent UCYN-B (Stenegren et al., 2018; Caffin et al., 2018a) and contributed circa 8 %–12 % of primary production (Caffin et al., 2018a). In the GY region, heterotrophic proteobacteria and UCYN-A types were responsible for N2 fixation (Stenegren et al., 2018), and the N2 fixation contribution to primary production fell to 3 % (Caffin et al., 2018a). Until recently, Trichodesmium were thought to be grazed by relatively few meso-zooplankton species (Carpenter et al., 1999; Conroy et al., 2017), although new molecular techniques to detect diazotrophs in zooplankton gut content are extending this list (Scavotto et al., 2015; Azimuddin et al., 2016; Hunt et al., 2016; Conroy et al., 2017). Such analyses were not performed during OUTPACE, and we limit our discussion to the observed correlations of key zooplankton species distribution with diazotroph distributions, particularly those among the top 10 species with respect to frequency of abundance (Table 4).
An abundant diazotroph community is expected to change the structure of the ecosystem, particularly the relative abundance and species composition of grazers and microbial population. The strong relationship found between Trichodesmium and the zooplankton community spatial structuration during OUTPACE (BEST analysis) was characterized by positive correlations with the Harpacticoid copepods M. gracilis and Miracia efferata and the poecilostomatoid copepod Oncaea. The association of M. gracilis with the colonial cyanobacterium Trichodesmium has been shown in several studies. This has been interpreted as reflecting a successful way of living within the plankton, using filaments as a physical substrate for juvenile development and/or as a food source, and is facilitated by M. gracilis being immune to cyanobacterial toxins harmful to other species of copepods (O'Neil and Roman, 1994; Eberl and Carpenter, 2007). A relationship between Oncaea and Trichodesmium was previously suggested by Dupuy et al. (2016) in the Indian Ocean around Madagascar, based on stable isotope data. However, we found no significant relationship for Pleuromamma and Euchaeta, despite their association with Trichodesmium observed by Azimuddin et al. (2016) in the western Pacific, nor for Corycaeus. It is worth noting that we found a positive correlation between pteropods (Thecosomata) and Trichodesmium, with decreasing abundance of this zooplankton group in GY compared to the other zones. Pteropods were in the top 10 rank taxa in each zone, representing 1 % to 10 % of the total zooplankton abundance in the water column and up to 35 % of the swimmers in the sediment traps (see Fig. 7a and b for comparison). As far as we are aware, a direct trophic link between pteropods and Trichodesmium has never been established.
In the present study, we did not consider a possible association between zooplankton taxa and non-Trichodesmium diazotrophs, but Hunt et al. (2016) provided evidence for direct ingestion and assimilation of UCYN-C-derived N by zooplankton from15N2 labeled grazing experiments. Recent observations suggested the consumption of UCYN-A and UCYN-B by diverse calanoid copepods (Scavotto et al., 2015; Conroy et al., 2017). From the quantification of DDN to zooplankton δ15N values, we estimated that DDN contributed up to 67 % and 75 % to zooplankton biomass in the W-MA and CE-MA regions, respectively, but strongly decreased to an average of 22 % in the GY region, down to 7 % in the easternmost station. Thus, the highest contribution of diazotrophic microorganisms to zooplankton occurred in the region of highest N2 fixation and when Trichodesmium dominated the diazotrophs (74 % to 100 % in W-MA and CE-MA regions), whereas UCYN-B showed higher biomass in the GY region (37 %–86 %). This is consistent with Caffin et al. (2018b), who showed that at the ecosystem level, even if the DDN transfer efficiency to zooplankton from UCYN-B (15 %) is higher from Trichodesmium, the quantity of DDN ultimately transferred to secondary producers is higher when Trichodesmium dominates, as cell-specific N2 fixation rates of Trichodesmium are far higher than those of UCYN-B. The highest values of ZDDN were comparable with the highest value (73 %) observed during the VAHINE mesocosm experiment in the oligotrophic New Caledonia Lagoon (Hunt et al., 2016), associated with a mixed diazotroph community of UCYN-C, Trichodesmium spp., and DDA (Richelia associated with the diatoms Rhizosolenia and Hemiaulus at lower concentrations).
4.4 Fluxes associated with zooplankton
The estimated weight-specific rates of ingestion and and excretion from the relationships of Ikeda (1985) were found to be quite stable within and between regions. The range of these rate values were fully consistent with literature values for meta-zooplankton and copepods in the intertropical zone (Ikeda, 1985; Dam et al., 1995; Mauchline, 1998; Hernández-León et al., 2008; McKinnon et al., 2015). The estimated ingestion and metabolic rates enabled us to estimate that the top–down (through grazing) and bottom–up impact of zooplankton (through excretion of N and P) on phytoplankton was potentially high in the OUTPACE zone. Zooplankton grazing represented a daily removal of 6 % to 27 % of the phytoplankton stock and of 19 % to 184 % of primary production. The top–down impact of meso-zooplankton was higher than 50 % of the daily primary production in CE-MA, BL, and GY, with particularly high values in the CE-MA zone (up to 184 %), but fell to 34 % in the W-MA region. In general, for all regions, our estimated meso-zooplankton grazing related to primary production values were in the upper range of the global comparative analysis by Calbet (2001, his Fig. 1), suggesting a strong top–down pressure by zooplankton. During OUTPACE, this pressure was mainly exerted on nano- and micro-phytoplankton (see our Table 6). The grazing impact on picoplankton was probably exerted by microzooplankton, which also displayed high abundances in this area (Dolan et al., 2016). As a whole, this grazing process may lead to an equilibrium between phytoplankton production and grazing by meso-zooplankton, as observed in the equatorial Pacific (Landry et al., 2001). From our results, we can also estimate that the top–down impact of zooplankton on N2 fixers must be high. Caffin et al. (2018a, b) estimated that N2 fixation contributed circa 8 %–12 % of primary production in the MA region and 3 % in the GY water and sustained nearly all new primary production at all stations. As zooplankton grazing removed 19 % to 184 % of the total primary production daily, we can estimate that 1.5 % to 22 % of N2 fixing organisms were removed daily. At the long-duration stations, the fecal pellet production was estimated to be 71, 128, and 31 mg C m−2 d−1 for LD-A, LD-B, and LD-C, respectively, considering an assimilation efficiency of 0.7 on the ZCDH (see Table 6). These values are much higher than measured mean values of particle vertical export of 27.1, 3.5, and 3.8 mg C m−2 d−1, respectively, for the same stations (Caffin et al., 2018a). This would mean that only a very small percentage of zooplankton fecal pellets are collected in sediment traps and could partly explain the disequilibrium between new and export production observed by Caffin et al. (2018a).
The regeneration of nutrients by zooplankton excretion was high, suggesting a high contribution to regenerated production, particularly in terms of nitrogen. Valdés et al. (2018) demonstrated that the copepod metabolism (mainly excretion) can provide substantial amounts of ammonium, dissolved organic nitrogen (DON), and dissolved organic phosphorus (DOP) in the WTSP, which microbial communities can directly use at a short response time, enhancing bacterioplankton remineralization. Daily excretion represented 14.5 % to 165 % of phytoplankton needs for N, whereas excretion accounted for only 2.8 to 34 of P needs. These estimates for regeneration are in the upper range of literature data for the world's oceans summarized by by Hernández-León et al. (2008) and Le Borgne (1986) and higher than those reported for the central tropical Pacific (up to 17 %; Dam et al., 1995; Zhang et al., 1995), the equatorial Pacific (31 %–36 %; Gaudy et al., 2003), and the North Pacific central gyre (40 %–50 %; Eppley et al., 1973) but similar to values recorded in the Atlantic Ocean between 50∘ N and 30∘ S (31 %–100 %; Isla et al., 2004). Our estimates of the contribution of phosphorous excretion to phytoplankton requirements are also in the range of the literature values reviewed by Le Borgne et al. (1985). Ammonium is recognized as the primary nitrogenous excretory product of zooplankton. However, zooplankton can excrete substantial amounts of organic nitrogen and phosphorus (DON and DOP), exceeding even the ammonium and phosphate excretion (Steinberg and Saba, 2008). Thus, the impact of ammonia excretion on phytoplankton nitrogen demands could be substantially higher than our estimations, and even more so if we considered that zooplankton can contribute to the new and regenerated production through different pathways, such as sloppy feeding and leaching from fecal pellets, that was not determined in this study. In addition, the impact of zooplankton excretion is not limited to the upper layers as zooplankton conducts diel vertical migrations through the water column. Thus, the impact of the zooplankton metabolism (excretion and grazing) on biogeochemical fluxes could be much higher that we have been able to estimate in this study, and further studies are necessary to determine the fate of the different products derived from the zooplankton metabolism in WTSP.
During OUTPACE, there was no clear spatial trend in top–down (grazing) vs. bottom–up (N and P regeneration) zooplankton impact on phytoplankton, although both processes appeared important at all sites. Finally, despite the relatively low biomass values of planktonic components in quasi-steady state, the availability of micro- and macronutrients related to physical mesoscale patterns in the waters surrounding the Melanesian archipelago, the fueling by DDN, and the relatively high rates of plankton production may explain why it is the basis of a productive trophic chain culminating in valuable fisheries. This trophic link with upper trophic levels is realized through the process of zooplankton diel vertical migration and their predation by mesopelagic fish (Rissik and Suthers, 2000; Menkes et al., 2015).
The percentage of estimated zooplankton respiration rates relative to primary production (averaging 29 % and 60 %, respectively, depending on the region; see Table 6), was high but within the range of global depth-integrated values reported by Calbet (2001). The lower rate recorded at the station west of New Caledonia (7 %, SD-1) was comparable to the 8 % measured by McKinnon et al. (2015) in the Great Barrier Reef waters, NE Australia. Our observations also clearly support diel vertical migration of zooplankton in the MA zone, as epipelagic zooplankton biomass increased in night samples compared to day samples at LD-A and LD-B, with a contribution of all size classes (see Fig. 6). The migratory zooplankton biomasses estimated at the two stations were within the upper range of values observed at low latitudes (Le Borgne and Rodier, 1997; Steinberg et al., 2000). Consequently, the carbon flux associated with the respiration of migrants was also among the highest values obtained in similar studies (see review by Steinberg et al., 2000), probably linked to the contribution of all size classes to the migrating biomass. Other contributions of the meso-zooplankton to the carbon flux through DOC excretion and mortality have not been assessed in our study. The strong grazing impact on primary producers and the high metabolic losses, partly realized in mesopelagic waters due to diurnal migrations, emphasize the role of zooplankton in the sink of atmospheric CO2 in tropical regions, as underlined by Steinberg et al. (2000) and hypothesized by Moutin et al. (2018) in their carbon budget at the OUTPACE long-term stations.
Finally, our estimations of the top–down (ingestion) and bottom–up (excretion) impact (expressed in percentages in Table 6) and of the fluxes (expressed in biomass per day in Table 6) associated with zooplankton, were highly variable between stations and zones, but high in comparison to literature data in most cases (Hernández-León and Ikeda, 2005; Hernández-León et al., 2008). These high values can be attributed to high ingestion and metabolic rates in relation to the high contribution of small taxonomic forms in our samples (partly linked to the mesh of sampling – 120 µm mesh) and to our taxon-based calculation of rates (see “Material and methods”). The highest values of phyto- and zooplankton biomasses and of primary production during OUTPACE were found at the boundary between the oligotrophic and ultra-oligotrophic regions (LD-B and LD-C). However, the grazing and excretion impact of zooplankton on phytoplankton was very similar between the two zones, partly due to a similar ratio of biomass to production and to comparable specific ingestion and metabolic rates linked to similar community structures. In the MA zone, as plankton biomasses and community structure were rather stable, the high variability of the top–down (ingestion) and bottom–up (excretion) impact found in this area might be attributed to the high mesoscale activity, leading to temporal and spatial shifts between phytoplankton and zooplankton biomass and production.
All data and metadata are available at the French INSU/CNRS LEFE CYBER database (scientific coordinator: Hervé Claustre; data manager, webmaster: Catherine Schmechtig) at the following web address: http://www.obs-vlfr.fr/proof/php/outpace/outpace.php (last access: December 2018), INSU/CNRS LEFE CYBER (2018).
The supplement related to this article is available online at: https://doi.org/10.5194/bg-15-7273-2018-supplement.
FC and MP conceived and designed the investigation and wrote the paper with contributions from all coauthors. KD and VV participated in the collection of samples; LG and OG participated in the analysis of samples. FC, MP, VV, and BPVH participated in the data analysis.
The authors declare that they have no conflict of interest.
This article is part of the special issue “Interactions between planktonic organisms and biogeochemical cycles across trophic and N2 fixation gradients in the western tropical South Pacific Ocean: a multidisciplinary approach (OUTPACE experiment)”. It is not associated with a conference.
This is a contribution of the OUTPACE (Oligotrophy from
Ultra-oligoTrophyPACific Experiment) project funded by the French national
research agency (ANR-14-CE01-0007-01), the LEFE-CyBER program (CNRS-INSU),
the GOPS program (IRD), and the CNES (BC T23, ZBC 4500048836) and by the
European FEDER Fund under project 1166-39417 The OUTPACE cruise
(https://doi.org/10.17600/15000900) was managed by Thierry Moutin and Sophie Bonnet
from the MIO (Mediterranean Institute of Oceanography). The authors thank to
the crew of the R/V L'Atalante for outstanding shipboard operation.
This work was supported by the Comisión Nacional de Investigación
Científicas y Tecnológicas (CONICYT) through grants FONDECYT no.
1130511 and 1150891 and Instituto Milenio de Oceanografía (IMO) grant
IC120019. Valentina Valdés and Katty Donoso were funded by a CONICYT
scholarship. Brian P. V. Hunt was funded in part from the European Union's
Seventh Framework Programme for research, technological development and
demonstration under grant agreement no. 302010 – project ISOZOO. The authors
thank France Van Wambeke, Cécile Dupouy, and Marcus Stenegren for sharing
their data on primary production chlorophyll and diazotroph abundance, which
helped in interpretation and comparison with our results. The authors thank
both referees and the scientific associate editor for their many constructive
suggestions and Michael Paul for improvement of the English.
Edited by: Sophie Bonnet
Reviewed by: Antonio
Bode and one anonymous referee
Azimuddin, K. M., Hirai, J., Suzuki, S., Haider, M. N., Tachibana, A., Watanabe, K., Kitamura, M., Hashihama, F., Takahashi, K., and Hamasaki, K.: Possible association of diazotrophs with marine zooplankton in the Pacific Ocean, Microbiology Open, 5, 1016–1026, https://doi.org/10.1002/mbo3.385, 2016.
Bertrand, A., Le Borgne, R., and Josse, E.: Acoustic characterization of micronekton distribution in French Polynesia, Mar. Ecol.-Prog. Ser., 191, 127–140, 1999.
Bonnet, S., Biegala, I. C., Dutrieux, P., Slemons, L. O., and Capone, D. G.: Nitrogen fixation in the western equatorial Pacific: Rates, diazotrophic cyanobacterial size class distribution, and biogeochemical significance, Global Biogeochem. Cy., 23, GB3012, https://doi.org/10.1029/2008GB003439, 2009.
Bonnet, S., Rodier, M., Turk-Kubo, K. A., Germineaud, C., Menkes, C., Ganachaud, A., Cravatte, S., Raimbault, P., Campbell, E., Quéroué, F., Sarthou, G., Desnues, A., Maes, C., and Eldin, G.: Contrasted geographical distribution of N2 fixation rates and nifHphylotypes in the Coral and Solomon Seas (southwestern Pacific) during austral winter conditions, Global Biogeochem. Cy., 29, 2015GB005117, https://doi.org/10.1002/2015GB005117, 2015.
Bonnet, S., Caffin, M., Berthelot, H., and Moutin, T.: Hot spot of N2 fixation in the western tropical South Pacific pleads for a spatial decoupling between N2 fixation and denitrification, P. Natl. Aad. Sci. USA, 114, E2800–E2801, https://doi.org/10.1073/pnas.1619514114, 2017.
Bonnet, S., Caffin, M., Berthelot, H., Grosso, O., Benavides, M., Helias-Nunige, S., Guieu, C., Stenegren, M., and Foster, R. A.: In-depth characterization of diazotroph activity across the western tropical South Pacific hotspot of N2 fixation (OUTPACE cruise), Biogeosciences, 15, 4215–4232, https://doi.org/10.5194/bg-15-4215-2018, 2018.
Buitenhuis, E. T., Li, W. K. W., Vaulot, D., Lomas, M. W., Landry, M. R., Partensky, F., Karl, D. M., Ulloa, O., Campbell, L., Jacquet, S., Lantoine, F., Chavez, F., Macias, D., Gosselin, M., and McManus, G. B.: Picophytoplankton biomass distribution in the global ocean, Earth Syst. Sci. Data, 4, 37–46, https://doi.org/10.5194/essd-4-37-2012, 2012.
Caffin, M., Moutin, T., Foster, R. A., Bouruet-Aubertot, P., Doglioli, A. M., Berthelot, H., Guieu, C., Grosso, O., Helias-Nunige, S., Leblond, N., Gimenez, A., Petrenko, A. A., de Verneil, A., and Bonnet, S.: N2 fixation as a dominant new N source in the western tropical South Pacific Ocean (OUTPACE cruise), Biogeosciences, 15, 2565–2585, https://doi.org/10.5194/bg-15-2565-2018, 2018a.
Caffin, M., Berthelot, H., Cornet-Barthaux, V., Barani, A., and Bonnet, S.: Transfer of diazotroph-derived nitrogen to the planktonic food web across gradients of N2 fixation activity and diversity in the western tropical South Pacific Ocean, Biogeosciences, 15, 3795–3810, https://doi.org/10.5194/bg-15-3795-2018, 2018b.
Calbet, A.: Mesozooplankton grazing effect on primary production: A global comparative analysis in marine ecosystems, Limnol. Oceanogr., 46, 1824–1830, 2001.
Campbell, L., Carpenter, E. J., Montoya, J. P., Kustka, A. B., and Capone, D. G.: Picoplankton community structure within and outside a Trichodesmium bloom in the southwestern Pacific Ocean, Vie Milieu, 55, 185–195, 2005.
Carpenter, E. J., Montoya, J. P., Burns, J., Mulholland, M. R., Subramaniam, A., and Capone, D. G.: Extensivebloom of a N2-fixing diatom/cyanobacterial association in the tropical Atlantic Ocean, Mar. Ecol.-Prog. Ser., 185, 273–283, 1999.
Ceccarelli, D. M., McKinnon, A. D., Andrefouet, S., Allain, V., Young, J., Gledhill, D. C., Flynn, A., Bax, N. J., Beaman, R., Borsa, P., Brinkman, R., Bustamante, R. H., Campbell, R., Cappo, M., Cravatte, S., D'Agata, S., Dichmont, C. M., Dunstan, P. K., Dupouy, C., Edgar, G., Farman, R., Furnas, M., Garrigue, C., Hutton, T., Kulbicki, M., Letourneur, Y., Lindsay, D., Menkes, C., Mouillot, D., Parravicini, V., Payri, C., Pelletier, B., de Forges, B. R., Ridgway, K., Rodier, M., Samadi, S., Schoeman, D., Skewes, T., Swearer, S., Vigliola, L., Wantiez, L., Williams, A., Williams, A., and Richardson, A. J.: Chapter IV: The Coral Sea: Physical Environment, Ecosystem Status and Biodiversity Assets, in: Advances in Marine Biology, edited by: Lesser, M., Vol. 66, AMB, Academic Press, UK, 213–290, 2013.
Conroy, B. J., Steinberg, D. K., Song, B., Kalmbach, A., Carpenter, E. J., and Foster, R. A.: Mesozooplankton Graze on Cyanobacteria in the Amazon River Plume and Western Tropical North Atlantic, Front. Microbiol., 8, https://doi.org/10.3389/fmicb.2017.01436, 2017.
Conway, D. V., White, R. G., Hugues-Dit-Ciles, J., Gallienne, C. P., and Robins, D. B.: Guide to the coastal and surface zooplankton of the south-western Indian Ocean, Occasional Publication of the Marine Biological Association, Plymouth, UK, No. 15, 2003.
Dai, L. P., Li, C. L., Yang, G., and Sun, X. X.: Zooplankton abundance, biovolume and size spectra at western boundary currents in the subtropical North Pacific during winter 2012, J. Marine Syst., 155, 73–83, https://doi.org/10.1016/j.jmarsys.2015.11.004, 2016.
Dam, H. G., Roman, M. R., and Youngbluth, M. J.: Downward export of respiratory carbon and dissolved inorganic nitrogen by diel-migrant mesozooplankton at the JGOFS Bermuda time-series station, Deep-Sea Res. Pt. I, 42, 1187–1197, https://doi.org/10.1016/0967-0637(95)00048-B, 1995.
de Verneil, A., Rousselet, L., Doglioli, A. M., Petrenko, A. A., and Moutin, T.: The fate of a southwest Pacific bloom: gauging the impact of submesoscale vs. mesoscale circulation on biological gradients in the subtropics, Biogeosciences, 14, 3471–3486, https://doi.org/10.5194/bg-14-3471-2017, 2017.
de Verneil, A., Rousselet, L., Doglioli, A. M., Petrenko, A. A., Maes, C., Bouruet-Aubertot, P., and Moutin, T.: OUTPACE long duration stations: physical variability, context of biogeochemical sampling, and evaluation of sampling strategy, Biogeosciences, 15, 2125–2147, https://doi.org/10.5194/bg-15-2125-2018, 2018.
Dolan, J. R., Gimenez, A., Cornet-Barthaux, V., and Verneil, A.: Community Structure of Tintinnid Ciliates of the Microzooplankton in the South West Pacific Ocean: Comparison of a High Primary Productivity with a Typical Oligotrophic Site, J. Eukaryot. Microbiol., 63, 813–822, 2016.
Donoso, K., Carlotti, F., Pagano, M., Hunt, B. P. V., Escribano, R., and Berline, L.: Zooplankton community response to the winter 2013 deep convection process in the NW Mediterranean Sea, J. Geophys. Res.-Oceans, 122, 2319–2338, https://doi.org/10.1002/2016JC012176, 2017.
Dupouy, C., Benielli-Gary, D., Neveux, J., Dandonneau, Y., and Westberry, T. K.: An algorithm for detecting Trichodesmium surface blooms in the South Western Tropical Pacific, Biogeosciences, 8, 3631–3647, https://doi.org/10.5194/bg-8-3631-2011, 2011.
Dupouy, C., Frouin, R., Tedetti, M., Maillard, M., Rodier, M., Lombard, F., Guidi, L., Picheral, M., Neveux, J., Duhamel, S., Charrière, B., and Sempéré, R.: Diazotrophic Trichodesmium impact on UV–Vis radiance and pigment composition in the western tropical South Pacific, Biogeosciences, 15, 5249–5269, https://doi.org/10.5194/bg-15-5249-2018, 2018.
Dupuy, C., Pagano, M., Got, P., Domaizon, I., Chappuis, A., Marchessaux, G., and Bouvy, M.: Trophic relationships between metazooplankton communities and their plankton food sources in the Iles Eparses (Western Indian Ocean), Mar. Environ. Res., 116, 18–31, https://doi.org/10.1016/j.marenvres.2016.02.011, 2016.
Eberl, R. and Carpenter, E. J.: Association of the copepod Macrosetella gracilis with the cyanobacterium Trichodesmium spp. in the North Pacific Gyre, Mar. Ecol.-Prog. Ser., 333, 205–212, 2007.
Eppley, R. W., Renger, E. H., Venrick, E. L., and Mullin, M. M.: A study of plankton dynamics and nutrient cycling in the central gyre of the North Pacific Ocean, Limnol. Oceanogr., 18, 534–551, 1973.
Fernández-Álamo, M. A. and Färber-Lorda, J.: Zooplankton and the oceanography of the eastern tropical Pacific: A review, Prog. Oceanogr., 69, 318–359, https://doi.org/10.1016/j.pocean.2006.03.003, 2006.
Gaudy, R., Champalbert, G., and Le Borgne, R.: Feeding and metabolism of mesozooplankton in the equatorial Pacific high-nutrient, low-chlorophyll zone along 180, J. Geophys. Res.-Oceans, 108, 8144, https://doi.org/10.1029/2000JC000743, 2003.
Gorsky, G., Ohman, M. D., Picheral, M., Gasparini, S., Stemmann, L., Romagnan, J. B., Cawood, A., Pesant, S., Pesant, C., and Prejger, F.: Digital zooplankton image analysis using the ZooScan integrated system, J. Plankton Res., 32, 285–303, 2010.
Grosjean, P., Picheral, M., Warembourg, C., and Gorsky, G.: Enumeration, measurement, and identification of net zooplankton samplesusing the ZOOSCAN digital imaging system, ICES J. Mar. Sci., 61, 518–525, 2004.
Hansen, P. J., Bjornsen P. K., and Hansen B. W.: Zooplankton grazing and growth: scaling within the 2–2000-µm body size range, Limnol. Oceanogr., 42, 687–704, 1997.
Hawser, S. P., O'Neil, J. M., Roman, M. R., and Codd, G. A.: Toxicity of blooms of the cyanobacterium Trichodesmium to zooplankton, J. Appl. Phycol., 4, 79–86, https://doi.org/10.1007/BF00003963, 1992.
Hernández-León, S. and Ikeda, T.: A global assessment of mesozooplankton respiration in the ocean, J. Plankton Res., 27, 153–158, 2005.
Hernández-León, S., Fraga, C., and Ikeda, T.: A global estimation of mesozooplankton ammonium excretion in the open ocean, J. Plankton. Res., 30, 577–585, https://doi.org/10.1093/plankt/fbn021, 2008.
Houssard, P., Lorrain, A., Tremblay-Boyer, L., Allain, V., Graham, B. S., Menkes, C. E., Pethybridge, H., Couturier, L. I. E., Point, D., Leroy, B., Receveur, A., Hunt, B. P. V., Vourey, E., Bonnet, S., Rodier, M., Raimbault, P., Feunteun, E., Kuhnert, P. M., Munaron, J.-M., Lebreton, B., Otake, T., and Letourneur, Y.: Trophic position increases with thermocline depth in yellowfin and bigeye tuna across the Western and Central Pacific Ocean, Prog. Oceanogr., 154, 49–63, https://doi.org/10.1016/j.pocean.2017.04.008, 2017.
Hunt, B. P. V., Allain, V., Menkes, C., Lorrain, A., Graham, B., Rodier, M., Pagano, M., and Carlotti, F.: A coupled stable isotope-size spectrum approach to understanding pelagic food-web dynamics: A case study from the southwest sub-tropical Pacific, Deep-Sea Res. Pt. II, 113, 208–224, https://doi.org/10.1016/j.dsr2.2014.10.023, 2015.
Hunt, B. P. V., Bonnet, S., Berthelot, H., Conroy, B. J., Foster, R. A., and Pagano, M.: Contribution and pathways of diazotroph-derived nitrogen to zooplankton during the VAHINE mesocosm experiment in the oligotrophic New Caledonia lagoon, Biogeosciences, 13, 3131–3145, https://doi.org/10.5194/bg-13-3131-2016, 2016.
Ikeda, T.: Metabolic rates of epipelagic marine zooplankton as a function of body mass and temperature, Mar. Biol., 85, 1–11, 1985.
INSU/CNRS LEFE CYBER: available at: http://www.obs-vlfr.fr/proof/php/outpace/outpace.php, last access: December 2018.
Isla, J. A., Llope, M., and Anadón, R.: Size-fractionated mesozooplankton biomass, metabolism and grazing along a 50∘ N–30∘ S transect of the Atlantic Ocean, J. Plankton Res., 26, 1301–1313, 2004.
Karl, D., Michaels, A., Bergman, B., Capone, D., Carpenter, E., Letelier, R., Lipschultz, F., Paerl, H., Sigman, D., and Stal, L.: Dinitrogen fixation in the world's oceans, in: The Nitrogen Cycle at Regional to Global Scales, edited by: Boyer, E. W. and Howarth, R. W., Springer, Dordrecht, 47–98, 2002
Kiørboe, T., Mohlenberg, F., and Hamburger, K.: Bioenergetics of the planktonic copepod Acartiatonsa: relation between feeding, egg production and respiration, and composition of specific dynamic action, Mar. Ecol.-Prog. Ser., 26, 85–97, 1985.
Landry, M. R., Al-Mutairi, H., Selph, K. E., Christensen, S., and Nunnery, S.: Seasonal patterns of mesozooplankton abundance and biomass at Station ALOHA, Deep-Sea Res. Pt. II, 48, 2037–2061, 2001.
Le Borgne, R.: The release of soluble end products of metabolism, in: The BiologicalChemistry of Marine Copepods, edited by: Corner, E. D. S. and O'Hara, S. C. M., Clarendon, 109–164, 1986.
Le Borgne, R. and Landry, M. R.: EBENE: A JGOFS investigation of plankton variability and trophic interactions in the equatorial Pacific (180∘), J. Geophys. Res., 108, 8136, https://doi.org/10.1029/2001JC001252, 2003.
Le Borgne, R. and Rodier, M.: Net zooplankton and the biological pump: a comparison between the oligotrophic and mesotrophic equatorial Pacific, Deep-Sea Res. Pt. II, 44, 2003–2023, https://doi.org/10.1016/S0967-0645(97)00034-9, 1997.
Le Borgne, R., Dandonneau, Y., and Lemasson, L.: The problem of the island mass effect on chlorophyll and zooplankton standing crops around Mare (Loyalty Islands) and New Caledonia, B. Mar. Sci., 37, 450–459, 1985.
Le Borgne, R., Rodier, M., Le Bouteiller, A., and Murray, J. W.: Zonal variability of plankton and particle export flux in the equatorial Pacific upwelling between 165∘ E and 150∘ W, Oceanol. Acta, 22, 57–66, 1999.
Le Borgne, R., Feely, R. A., and Mackey, D. J.: Carbon fluxes in the equatorial Pacific: a synthesis of the JGOFS programme, Deep-Sea Res. Pt. II, 49, 2425–2442, https://doi.org/10.1016/S0967-0645(02)00043-7, 2002.
Le Borgne, R., Champalbert, G., and Gaudy, R.: Mesozooplankton biomass and composition in the equatorial Pacific along 180∘, J. Geophys. Res., 108, 8143, https://doi.org/10.1029/2000JC000745, 2003.
Le Borgne, R., Douillet, P., Fichez, R., and Torréton, J.-P.: Hydrography and plankton temporal variabilities at different time scales in the southwest lagoon of New Caledonia: A review, Mar. Pollut. Bull., 61, 297–308, https://doi.org/10.1016/j.marpolbul.2010.06.022, 2010.
Le Borgne, R., Allain, V., Matear, R. J., Griffiths, S. P., McKinnon, A. D., Richardson, A. J., and Young, J. W.: Vulnerability of open ocean food webs in the tropical Pacific to climate change, in: Vulnerability of Fisheries and Aquaculture in the Tropical Pacific to Climate Change, edited by: Bell, J., Johnson, J. E., and Hobday, A. J., Secr. of the Pac. Community, Noumea, 2011.
Lehette, P. and Hernández-León, S.: Zooplankton biomass estimation from digitized images: a comparison between subtropical and Antarctic organisms, Limnol. Oceanogr.-Meth., 7, 304–308, 2009.
Longhurst A. R.: Interactions between zooplankton and phytoplankton profiles in the eastern tropical Pacific Ocean, Deep-Sea Res., 23, 729–754, 1976.
Longhurst, A. R.: Ecological Geography of the Sea, Academic Press, San Diego, Calif, 560 pp., 2006.
McCutchan, J. H., Lewis, W. M., Kendall, C., and McGrath, C. C.: Variation in trophic shift for stable isotope ratios of carbon, nitrogen, and sulfur, Oikos, 102, 378–390, 2003.
McKinnon, A. D., Doyle, J., Duggan, S., Logan, M., Lønborg, C., and Brinkman, R.: Zooplankton Growth, Respiration and Grazing on the Australian Margins of the Tropical Indian and Pacific Oceans, PLoS ONE, 10, e0140012, https://doi.org/10.1371/journal.pone.0140012, 2015.
Mauchline, J.: The Biology of Calanoid Copepods, Adv. Mar. Biol., 33, 1–710, 1998.
Menkes, C. E., Allain, V., Rodier, M., Gallois, F., Lebourges-Dhaussy, A., Hunt, B. P. V., Smeti, H., Pagano, M., Josse, E., Daroux, A., Lehodey, P., Senina, I., Kestenare, E., Lorrain, A., and Nicol, S.: Seasonal oceanography from physics to micronekton in the south-west Pacific, Deep-Sea Res. Pt. II, 113, 125–144, https://doi.org/10.1016/j.dsr2.2014.10.026, 2015.
Moisander, P. H., Beinart, R. A., Hewson, I., White, A. E., Johnson, K. S., Carlson, C. A., Montoya, J. P., and Zehr, J. P.: Unicellular Cyanobacterial Distributions Broaden the Oceanic N2 Fixation Domain, Science, 327, 1512–1514, https://doi.org/10.1126/science.1185468, 2010.
Montoya, J. P., Carpenter, E. J., and Capone, D. G.: Nitrogen fixation and nitrogen isotope abundances in zooplankton of the oligotrophic North Atlantic, Limnol. Oceanogr., 47, 1617–1628, https://doi.org/10.4319/lo.2002.47.6.1617, 2002.
Moutin, T., Doglioli, A. M., de Verneil, A., and Bonnet, S.: Preface: The Oligotrophy to the UlTra-oligotrophy PACific Experiment (OUTPACE cruise, 18 February to 3 April 2015), Biogeosciences, 14, 3207–3220, https://doi.org/10.5194/bg-14-3207-2017, 2017 (data available at: https://doi.org/10.17600/15000900).
Moutin, T., Wagener, T., Caffin, M., Fumenia, A., Gimenez, A., Baklouti, M., Bouruet-Aubertot, P., Pujo-Pay, M., Leblanc, K., Lefevre, D., Helias Nunige, S., Leblond, N., Grosso, O., and de Verneil, A.: Nutrient availability and the ultimate control of the biological carbon pump in the western tropical South Pacific Ocean, Biogeosciences, 15, 2961–2989, https://doi.org/10.5194/bg-15-2961-2018, 2018.
Murray, J. W., Johnson, E., and Garside, C.: A U.S. JGOFS process study in the equatorial Pacific (EqPac): Introduction, Deep-Sea Res. Pt. II, 42, 275–293, 1995.
Nival, P., Nival, S., and Thiriot, A.: Influence des conditions hivernales sur les productions phyto-et zooplanctoniques en Méditerranée Nord-Occidentale. V. Biomasse et production zooplanctonique – relations phyto-zooplancton, Mar. Biol., 31, 249–270, 1975.
O'Neil, J. M.: The colonial cyanobacterium Trichodesmium as a physical and nutritional substrate for the harpacticoid copepod Macrosetella gracilis, J. Plankton Res., 20, 43–59, https://doi.org/10.1093/plankt/20.1.43, 1998.
O'Neil, J. M. and Roman, M. R.: Ingestion of the Trichodesmium spp. by pelagic harpacticoid copepods Macrosetella, Miracia and Oculosetella, in: Ecology and Morphology of Copepods, 235–240, Springer, Dordrecht, 1994.
Razouls, C., De Bovée, F., Kouwenberg, J., and Desreumaux, N.: Diversity and geographic distribution of marine planktonic copepods, http://copepodes.obs-banyuls.fr/en (last access: November 2018), 2005–2017.
Riandey, V., Champalbert, G., Carlotti, F., Taupier-Letage, I., and Thibault-Botha, D.: Zooplankton distribution related to the hydrodynamic features in the Algerian Basin (western Mediterranean Sea) in summer 1997, Deep-Sea Res. Pt. I, 52, 2029–2048, 2005.
Rissik, D. and Suthers, I. M.: Enhanced feeding by pelagic juvenile myctophid fishes within a region of island-induced flow disturbance in the Coral Sea, Mar. Ecol.-Prog. Ser., 203, 263–273, 2000.
Rissik, D., Suthers, I. M., and Taggart, C. T.: Enhanced zooplankton abundance in the lee of an isolated reef in the south Coral Sea: the role of flow disturbance, J. Plankton Res., 19, 1347–1368, 1997.
Roger, C.: Relationships among yellowfin and skipjack tuna, their prey-fish and plankton in the tropical western Indian Ocean, Fish. Oceanogr., 3, 133–141, https://doi.org/10.1111/j.1365-2419.1994.tb00055.x, 1994.
Rose, M.: Copépodes pélagiques, Faune de France, 26th Edn., P. Lechevalier Paris, 374 pp., 1933.
Rousselet, L., de Verneil, A., Doglioli, A. M., Petrenko, A. A., Duhamel, S., Maes, C., and Blanke, B.: Large- to submesoscale surface circulation and its implications on biogeochemical/biological horizontal distributions during the OUTPACE cruise (southwest Pacific), Biogeosciences, 15, 2411–2431, https://doi.org/10.5194/bg-15-2411-2018, 2018.
Sarmiento, J. L. and Gruber, N.: Ocean Biogeochemical Dynamics, Princeton University Press, Princeton, New Jersey, 2006.
Scavotto, R. E., Dziallas, C., Bentzon-Tilia, M., Riemann, L., and Moisander, P. H.: Nitrogen-fixing bacteria associated with copepods in coastal waters ofthe North Atlantic Ocean, Environ. Microbiol., 17, 3754–3765, https://doi.org/10.1111/1462-2920.12777, 2015.
Shannon, C. E. and Weaver, G.: The Mathematical Theory of Communication, Univ. of Ill. Press, Urbana, 1949.
Shiozaki, T., Kodama, T., and Furuya, K.: Large-scale impact of the island mass effect through nitrogen fixation in the western South Pacific Ocean, Geophys. Res. Lett., 41, 2907–2913, https://doi.org/10.1002/2014GL059835, 2014.
Smeti, H., Pagano, M., Menkes, C., Lebourges-Dhaussy, A., Hunt, B. P. V., Allain, V., Rodier, M., de Boissieu, F., Kestenare, E., and Sammari, C.: Spatial and temporal variability of zooplankton off New Caledonia (Southwestern Pacific) from acoustics and net measurements, J. Geophys. Res.-Oceans., 120, 2676–2700, https://doi.org/10.1002/2014JC010441, 2015.
Sommer, S., Hansen, T., and Sommer, U.: Transfer of diazotrophic nitrogen to mesozooplankton in Kiel Fjord, Western Baltic Sea: a mesocosm study, Mar. Ecol.-Prog. Ser., 324, 105–112, 2006.
Spungin, D., Belkin, N., Foster, R. A., Stenegren, M., Caputo, A., Pujo-Pay, M., Leblond, N., Dupouy, C., Bonnet, S., and Berman-Frank, I.: Programmed cell death in diazotrophs and the fate of organic matter in the western tropical South Pacific Ocean during the OUTPACE cruise, Biogeosciences, 15, 3893–3908, https://doi.org/10.5194/bg-15-3893-2018, 2018.
Stenegren, M., Caputo, A., Berg, C., Bonnet, S., and Foster, R. A.: Distribution and drivers of symbiotic and free-living diazotrophic cyanobacteria in the western tropical South Pacific, Biogeosciences, 15, 1559–1578, https://doi.org/10.5194/bg-15-1559-2018, 2018.
Steinberg, D. K. and Saba, G. K.: Nitrogen consumption and metabolism in marine zooplankton, in: Nitrogen in the Marine Environment, edited by: Capone, D. G., Academic Press, Boston, 1135–1196, 2008.
Steinberg, D. K., Carlson, C. A., Bates, N. R., Goldthwait, S. A., Madin, L. P., and Michaels, A. F.: Zooplankton vertical migration and the active transport of dissolved organic and inorganic carbon in the Sargasso Sea, Deep-Sea Res. Pt. I, 47, 137–158, 2000.
Tregouboff, G. and Rose, M.: Manuel de Planctonologie Méditerranéenne, tome II Centre National de la Recherche Scientifique Paris, Tomes I et II, 1–181, 1957.
Turner, J. T.: Planktonic marine copepods and harmful algae, Harmful Algae, 32, 81–93, https://doi.org/10.1016/j.hal.2013.12.001, 2014.
Valdés, V., Carlotti, F., Escribano, R., Donoso, K., Pagano, M., Molina, V., and Fernandez, C.: Nitrogen and phosphorus recycling mediated by copepods and response of bacterioplankton community from three contrasting areas in the western tropical South Pacific (20∘ S), Biogeosciences, 15, 6019–6032, https://doi.org/10.5194/bg-15-6019-2018, 2018.
Vanderklift, M. A. and Ponsard, S.: Sources of variation in consumer-diet δ15N enrichment: a meta-analysis, Oecologia, V136, 169–182, 2003.
Van Wambeke, F., Gimenez, A., Duhamel, S., Dupouy, C., Lefevre, D., Pujo-Pay, M., and Moutin, T.: Dynamics and controls of heterotrophic prokaryotic production in the western tropical South Pacific Ocean: links with diazotrophic and photosynthetic activity, Biogeosciences, 15, 2669–2689, https://doi.org/10.5194/bg-15-2669-2018, 2018.
Wang, X. J., Behrenfeld, M., Le Borgne, R., Murtugudde, R., and Boss, E.: Regulation of phytoplankton carbon to chlorophyll ratio by light, nutrients and temperature in the Equatorial Pacific Ocean: a basin-scale model, Biogeosciences, 6, 391–404, https://doi.org/10.5194/bg-6-391-2009, 2009.
Weber, S. C., Carpenter, E. J., Coles, V. J., Yager, P. L., Goes, J., and Montoya, J. P.: Amazon River influence on nitrogen fixation and export production in the western tropical North Atlantic: Amazon River influence on nitrogen fixation, Limnol. Oceanogr., 62, 618–631, https://doi.org/10.1002/lno.10448, 2017.
White, J. R., Zhang, X., Welling, L. A., Roman, M. R., and Dam, H. G.: Latitudinal gradients in zooplankton biomass in the tropical Pacific at 140∘ W during the JGOFS EqPac study: Effects of El Niño, Deep-Sea Res. Pt. II, 42, 715–733, https://doi.org/10.1016/0967-0645(95)00033-M, 1995.
Wirtz, K. W.: Who is eating whom? Morphology and feeding type determine the size relations between planktonic predators and their ideal prey, Mar. Ecol.-Prog. Ser., 445, 1–12, 2012.
Zehr, J. P., Waterbury, J. B., Turner, P. J., Montoya, J. P., Omoregie, E., Steward, G. F., Hansen, A., and Karl, D. M.: Unicellular cyanobacteria fix N2 in the subtropical North Pacific Ocean, Nature, 412, 635, https://doi.org/10.1038/35088063, 2001.
Zhang, X., Dam, H. G., White, J. R., and Roman, M. R.: Latitudinal variations in mesozooplankton grazing and metabolism in the central tropical Pacific during the U.S. JGOFS EqPac study, Deep-Sea Res. Pt. II, 42, 695–714, https://doi.org/10.1016/0967-0645(95)00032-L, 1995.
Zhou, M., Carlotti, F., and Zhu, Y.: A size-spectrum zooplankton closure model for ecosystem modelling, J. Plankton Res., 32, 1147–1165, https://doi.org/10.1093/plankt/fbq054, 2010.