the Creative Commons Attribution 4.0 License.
the Creative Commons Attribution 4.0 License.
 | 02 Nov 2018
Evaluation of the seasonal formation of subsurface negative preformed nitrate anomalies in the subtropical North Pacific and North Atlantic
Robert T. Letscher
Tracy A. Villareal
Summertime mixed-layer drawdown of dissolved inorganic carbon in the absence of measurable nutrients in the ocean's subtropical gyres and non-Redfieldian oxygen : nitrate relationships in the underlying subsurface waters are two biogeochemical phenomena that have thus far eluded complete description. Many processes are thought to contribute to one or both, including lateral nutrient transport, carbon overconsumption or non-Redfield organic matter cycling, heterotrophic nutrient uptake, and the actions of vertically migrating phytoplankton. To obtain insight into the likely magnitude of potential contributing mechanisms that can remove nitrate from the nutricline while supporting dissolved inorganic carbon (DIC) drawdown tens of meters higher in the water column, we investigated the seasonal formation rates for negative preformed nitrate (preNO3) anomalies (oxygen consumption without stoichiometric nitrate release) in the subsurface and positive preformed nitrate anomalies (oxygen production without stoichiometric nitrate drawdown) in the euphotic zone at the subtropical ocean time series stations ALOHA (A Long-Term Oligotrophic Habitat Assessment) in the North Pacific and BATS (Bermuda Atlantic Time-series Study) in the North Atlantic. Non-Redfield stoichiometry for dissolved organic matter (DOM) remineralization accounts for up to ∼15 mmol N m−2 yr−1 of negative preNO3 anomaly formation at both stations. We present a new formulation for calculating preNO3 (residual preNO3) that includes components resulting from non-Redfield DOM cycling. Residual negative preNO3 anomalies in excess of that which can be accounted for by non-Redfield DOM cycling are found to accumulate at a rate of ∼32–46 mmol N m−2 yr−1 at Station ALOHA and ∼46–87 mmol N m−2 yr−1 at the BATS station. These negative anomaly formation rates are in approximate balance with residual positive preNO3 anomaly formation rates from the euphotic zone located immediately above the nutricline in the water column. We evaluate three mechanisms to explain these anomalies, calculating that transparent exopolymer particle (TEP) cycling and heterotrophic nitrate uptake can contribute to the formation of both residual preNO3 anomalies. However, a significant fraction, estimated at ∼50 %–95 %, is unexplained by the sum of these processes. Vertically migrating phytoplankton possess the necessary distribution, nutrient acquisition strategy, and biogeochemical signature to simultaneously remove nitrate at depth and transport it above the nutricline. Reported transport rates by known migrators equal or exceed the residual preNO3 anomaly formation rates and potentially explain both the negative and positive residual preNO3 anomalies as well as the mixed-layer DIC drawdown at the stations ALOHA and BATS within the limits of scarce detailed abundance profiles. However, the three processes examined are not independent and mutually exclusive. The model Rhizosolenia mat system (and perhaps other migrators) produces TEPs, suggesting that migration could provide accelerated vertical transport of TEPs and provide labile carbon for heterotrophic nitrate uptake. These results based on geochemical distributions suggest that, in the absence of additional mechanisms and rates, phytoplankton vertical migrators, although rare and easily overlooked, play a larger role in subtropical ocean nutrient cycling and the biological pump than generally recognized.
- Article
(4487 KB) -
Supplement
(6621 KB) - BibTeX
- EndNote


Subtropical ocean gyre ecosystems exhibit low rates of primary productivity caused by thermal stratification of the water column that acts as an impediment to sustained nutrient supply to the surface ocean. Yet these regions exhibit significant annual net community production (ANCP), estimated at 3±1 mol C m−2 yr−1 for Station ALOHA (A Long-Term Oligotrophic Habitat Assessment) in the North Pacific and the BATS station (Bermuda Atlantic Time-series Study) in the North Atlantic (Emerson, 2014), contributing about half of the global biological carbon pump (Emerson et al., 1997). A seasonal drawdown of mixed-layer dissolved inorganic carbon (DIC) occurs at these two well-characterized time series sites during the summer and early autumn months that is attributed to net community production with minor contributions from lateral mixing and air–sea CO2 exchange (Gruber et al., 1998, 2002; Keeling et al., 2004; Williams et al., 2013).
The nutrient sources supporting this seasonal DIC drawdown at the time series sites have eluded oceanographers since the phenomenon was first documented (Michaels et al., 1994; Toggweiler, 1994; Gruber et al., 1998; Keeling et al., 2004), and identifying the nutrient sources is essential to understanding how the drawdown occurs. Numerous nutrient input mechanisms have been investigated, including vertical mixing, N2 fixation, atmospheric deposition, and eddy movements, with their sum still falling short of explaining the observed DIC drawdown or a stoichiometric equivalent subsurface oxygen consumption (Jenkins and Goldman, 1985; Jenkins and Doney, 2003; Johnson et al, 2010) assuming Redfield stoichiometry between organic matter production and remineralization. More recently, episodic vertical mixing events and lateral advection are two physical mechanisms that have been proposed to supply the surface subtropical gyres with the “missing” nutrients to explain observed ANCP (Johnson et al., 2010; Letscher et al., 2016). However, in order to explain the observed summertime DIC drawdown from the subtropical gyre mixed layer, these two physical mechanisms must supply nutrients, carbon, and oxygen in non-Redfield stoichiometries. Letscher et al. (2016) reported a C-deficient, non-Redfieldian supply of inorganic carbon and nutrients within the lateral nutrient streams reaching the subtropical gyres, but this mechanism still falls short of explaining the observed DIC drawdown at the stations ALOHA and BATS, even after accounting for non-Redfield stoichiometry of organic matter production. Johnson et al. (2010) observed episodic, near-monthly, vertical mixing events near Station ALOHA that supply nitrate from the nutricline upwards into the euphotic zone to a depth of ∼75–100 m. They concluded that the upper 250 m is in approximate balance between nutrient supply and demand and suggested that there are processes that redistribute nitrate within this region. To explain the surface DIC drawdown, these authors suggested the non-Redfieldian supply of nitrate into the mixed layer above ∼50 m could be carried out by large, non-flagellated phytoplankton that migrate between the nutricline and the surface as part of their life-history strategy for nutrient acquisition (Villareal et al., 1993; 2014).
The oxygen:nitrate distributions in the nutricline provide clues to the possible supply mechanism supporting DIC drawdown. Subtropical gyres exhibit a deficit of sub-euphotic-zone nitrate as expected from observed oxygen consumption and Redfield organic matter remineralization stoichiometry. This phenomenon is revealed when examining spatiotemporal patterns of the preformed nitrate (preNO3) tracer (all abbreviations are defined in the Supplement). preNO3 is traditionally calculated as , where AOU is the apparent oxygen utilization and R is the stoichiometric ratio of oxygen consumed to N regenerated for the remineralization of Redfieldian organic matter, e.g., 150 : 16 (Anderson, 1995). preNO3 quantifies the fraction of measured nitrate in a water parcel not attributable to remineralization of Redfieldian organic matter and was initially formulated as a conservative tracer for examining the distribution of water masses involved in the global thermohaline circulation (termed “NO” by Broecker, 1974). Negative preNO3 (NPN) anomalies occur within upper mesopelagic depths (∼100–300 m) of the subtropical ocean, suggesting there are non-Redfieldian processes affecting the in situ dissolved oxygen and nitrate pools (Abell et al., 2005; Johnson et al., 2010). That is, the observed negative anomalies are the result of oxygen consumption without concurrent Redfieldian nitrate accumulation. Johnson et al. (2010) suggested that the subsurface NPN anomaly (calculated using a modified Redfield ratio) could be sustained by vertical separation between nitrate uptake in the nutricline and oxygen production from net community production near the surface. These authors concluded that observed mixed-layer net community production is mediated by (1) directly observed episodic vertical physical mixing events that deliver nitrate above 125 m and (2) inferred transport by vertically migrating phytoplankton transporting this nitrate upwards along a near-zero concentration gradient within the euphotic zone. Working in the same ecosystem, Ascani et al. (2013) further reinforced this, noting that upper-euphotic-zone oxygen : nitrate anomalies at Station ALOHA could not be supported by ammonium or DON sources. However, Abell et al. (2005) approximated non-Redfieldian dissolved organic matter (DOM) cycling and concluded that production, export, and remineralization of DOM with elevated C : N stoichiometry could quantitatively explain the subsurface preNO3 anomaly distribution in the subtropical North Pacific.
To date, no work has attempted to partition the contribution of the multiple mechanisms to formation of the negative preNO3 anomaly and their linkage to DIC drawdown in subtropical ocean gyres. Multiple lines of evidence indicate that a subset of the oceanic flora is migrating (Villareal et al., 2014) and transports new nitrogen into the euphotic zone (Villareal et al., 1993, 1996; Richardson et al., 1998). Abundance and physiological data require specialized in situ collections and/or optical enumeration methods (Villareal et al., 2014). As a result, neither time series station collects data on this flora. Other hypotheses that have been advanced to explain the DIC drawdown and/or the subsurface NPN anomaly include heterotrophic uptake of nitrate and spatially segregated transparent exopolymer production and consumption.
In this work, we expand the examination of preNO3 anomalies to the BATS station in the North Atlantic and revisit the missing nutrient and NPN anomaly spatiotemporal distribution at both Station ALOHA and the BATS station. We build on the approach of Abell et al. (2005) by explicitly calculating the non-Redfield remineralization stoichiometry of DOM and incorporating it into the preNO3 equation. This reformulated tracer (residual preNO3) quantifies the preNO3 distribution remaining after accounting for non-Redfield DOM remineralization stoichiometry. Positive or negative anomalies indicate regions where DOM and particulate organic matter (POM) recycling is unable to explain the residual preNO3 values. Using this new tracer, we identify seasonal formation of a sub-euphotic-zone residual negative preNO3 (rNPN) anomaly at the BATS station and a persistent sub-euphotic-zone rNPN anomaly at Station ALOHA within the nutricline, qualitatively similar to previous results in the subtropical North Pacific using older formulations of preNO3 (Abell et al., 2005; Johnson et al., 2010). In addition, residual positive preNO3 (rPPN) anomalies not previously reported are observed within the euphotic zone (0 to ∼80 or ∼100 m) at both sites, with integrated rates of formation that are in approximate stoichiometric balance with the rNPN anomalies located immediately below in the water column. These rNPN and rPPN anomalies account for the effects of both POM and DOM remineralization with elevated stoichiometry, thus requiring additional mechanisms for their formation. We undertake a quantitative examination of other potential contributing mechanisms to explain the subsurface rNPN anomalies, euphotic-zone rPPN anomalies, and mixed-layer DIC drawdown, including transparent exopolymer particle (TEP) cycling, subsurface bacterial uptake of nitrate, and vertical migration by phytoplankton. We find that TEP cycling may explain a fraction of both the rNPN and rPPN anomalies; bacterial nitrate uptake accounts for only a small fraction of rNPN and none of the rPPN anomalies. In the absence of additional unknown mechanisms, the remaining category (phytoplankton vertical migration) contributes the dominant flux of N to explain both the rNPN (via nitrate consumption and upward transport) and rPPN (via oxygen production during internal nitrate consumption after migration towards the surface) anomalies at both Station ALOHA and the BATS station. We then compare the calculated requirement to reported rates of nitrate transport by this flora. Distribution maps are provided to highlight the broad distribution of this group and justify comparison of rates from existing datasets to the time series stations. We hypothesize that nitrate uptake and transport by vertically migrating giant phytoplankton in gyre systems can sustain development of rPPN and rNPN at the two time series stations. In addition, the observed production of TEPs by migrating diatom mats (and, by inference, other migrators) provides a linkage between at least two of the processes. These calculations provide a framework for evaluating the role of these processes in future studies.
2.1 Data
Time series biogeochemical data including concentrations of total dissolved nitrogen, nitrate+nitrite, and oxygen for the years 1988–2016 were downloaded from http://bats.bios.edu (last access: 28 November 2017) for the BATS station and http://hahana.soest.hawaii.edu/hot (last access: 28 November 2017) for Station ALOHA. Dissolved organic nitrogen (DON) was calculated as total dissolved nitrogen (GF/F 0.7 µm filtered) minus [nitrate + nitrite]. This definition of DON includes ammonium; however, its open-ocean concentration is typically <50 nM and is not regularly measured as part of the two time series. Global annual climatologies for dissolved O2 and from the World Ocean Atlas (WOA) 2013 (Garcia et al., 2014a, b) were downloaded from http://www.nodc.noaa.gov/OC5 (last access: 26 July 2017). The Global Ocean Data Analysis Project (GLODAP) v2 dataset (Olsen et al., 2016) including dissolved O2, , CFC-11, and CFC-12 was downloaded from http://www.nodc.noaa.gov/ocads/oceans/GLODAPv2 (last access: 15 December 2016). The WOA and GLODAP data products provide our analysis with an annual time-mean picture of thermocline preNO3 tracer distributions across the larger spatial scales of the North Atlantic, North Pacific, and other subtropical gyre regions of the global ocean. Water mass ventilation ages on subsurface neutral-density layers are computed from the GLODAP v2 CFC-11 and CFC-12 data using a method similar to that described in Doney and Bullister (1992) using the atmospheric time history of the CFC gases provided by Walker et al. (2000) and the gas solubility constants of Warner and Weiss (1985). All calculations of rNPN and rPPN anomaly formation rates at the time series sites are performed from analysis of the monthly resolved datasets for the stations ALOHA and BATS.
2.2 Tracer computations
The preformed NO3 tracer defined by Broecker (1974) separates the observationally determined nitrate concentration for a given water parcel into contributions from water mass mixing (preformed) and regenerated from respiration of organic matter. Traditional formulations of preNO3 assign a uniform stoichiometry, e.g., 9.0 (Broecker, 1974), of organic matter remineralization without discriminating between particulate and DOM pools. However, Abell et al. (2005) showed that DOM remineralization stoichiometry is significantly elevated with respect to Redfield proportions in the subtropical North Pacific, with stoichiometries of 23 to 30 within shallow mesopelagic density layers (σθ=24.4–26.1), compared to Redfield values of 6.9 to 10.6 (Takahashi et al., 1985; Martin et al., 1987; Anderson and Sarmiento, 1994; Paulmier et al., 2009). This required an additional term in the calculation of preNO3 in their analysis, accounting for the fraction of oxygen consumption attributable to DOM remineralization and its separate stoichiometry. Abell et al. (2005) inferred the subsurface stoichiometry of DOM remineralization from regressions of observed O2 vs. dissolved organic carbon (DOC) concentrations within upper mesopelagic isopycnal layers. The regression was converted to N units with the separately measured DOC : DON ratio. Here we adopt the Abell et al. (2005) analysis and directly estimate the stoichiometry of DON remineralization within upper mesopelagic density layers at the stations ALOHA and BATS to compute the residual preNO3 tracer.
The residual preNO3 tracer formulation including the effects of DOM remineralization is
NO3meas is the sum of dissolved nitrate + nitrite. Apparent oxygen utilization (AOU) is calculated as AOU = O2sat−O2meas: the difference between O2 saturation at a given temperature, salinity, and pressure with the observationally determined O2 concentration. The two DOM terms – fDOM, the fraction of oxygen consumption attributable to DOM remineralization, and rDOM, the stoichiometric ratio of O2 consumed per mole of DON remineralized – can be determined empirically from the time series O2 and DON data. Values of rDOM were determined empirically each year between 1989 and 2000 at Station ALOHA and 1993–2016 at the BATS station by Model II linear regression (Ricker, 1973; Trujillo-Ortiz and Hernandez-Walls, 2010) of AOU vs. DON within discrete neutral-density layers. The subsurface neutral-density layers γn=24.2–24.7 and γn=24.7–25.2 were chosen at Station ALOHA and γn=25.8–26.3 at the BATS station for subsequent calculation of DOM remineralization stoichiometry based on a first examination of the depths exhibiting NPN anomalies using the traditional (Redfieldian) preNO3 tracer, i.e., , with the value of R selected as 9.0 (Broecker, 1974). The fraction of oxygen consumption attributable to DOM remineralization, fDOM, is determined empirically for each neutral-density layer following the equation of Abell et al. (2000):
The stoichiometric ratio of O2 consumed per mole of particulate organic nitrogen (PON) remineralized, rPOM, cannot be uniquely determined from Eq. (2) or the time series data and is taken from the literature (6.9 to 10.6; Paulmier et al., 2009). We used the climatological average rDOM in Eq. (2) due to a reduced number of years exhibiting statistically significant regressions of AOU vs. DON. Years with a regression correlation coefficient >0.33 were included in the climatological average (∼55 % of years investigated). Thus, our approach assumes rDOM and fDOM are constant over time within each density horizon investigated at each station. Relative uncertainty in the literature values of rPOM is larger (∼55 %) than the computed uncertainty in rDOM (∼33 %). The last remaining term in Eq. (1), fPOM, the fraction of AOU attributable to POM remineralization, is calculated as 1−fDOM. We tested the sensitivity of our computed residual preNO3 from Eqs. (1) and (2) by allowing rPOM to vary from 6.9 to 10.6, the upper- and lower-bound values for rPOM reported in the literature (Paulmier et al., 2009).
The seasonal formation rate of rNPN anomalies at each time series site was estimated by a linear regression of the residual preNO3 tracer vs. time within the aforementioned subsurface neutral-density layers for the years 1989–2016 at Station ALOHA and 1993–2016 at the BATS station. The slope of this regression yields the volumetric rate of rNPN anomaly formation in units of µmol N m−3 d−1. The volumetric rates were depth- and time-integrated to provide annual rates of rNPN anomaly formation in units of mmol N m−2 yr−1. Depth integration was performed by estimating the thickness, H, each year of the subsurface neutral-density layers of interest at the stations BATS and ALOHA. Values of H varied between 20 and 100 m. Time integration was calculated from the number of days elapsed between the first observation of decreasing residual preNO3 values and the date when residual preNO3 ceased decreasing within the annual cycle (Figs. S1, S2, S4). The volumetric rates of rPPN formation within the euphotic zone and their depth integration at each time series site were performed within the 0–100 m layer at Station ALOHA and within the 0–80 m layer at the BATS station. Time integration for rPPN anomalies was performed analogously to rNPN anomalies, from the time elapsed between observations of increasing residual preNO3 within the euphotic zone over the annual cycle (Figs. S3, S5). For the calculation of the residual preNO3 tracer within the euphotic zone, we made the assumption that the values of fDOM and rDOM were equivalent to those empirically derived for the upper mesopelagic density layer present immediately below the euphotic zone at each site. Seasonal rNPN anomaly formation duration ranged from a minimum of 2 months to a maximum of 10.5 months with a median of 7.5 months. Seasonal rPPN anomaly formation duration ranged from a minimum of 4 months to a maximum of 10 months with a median of 6 months.
A residual preformed phosphate (prePO4) tracer was computed as
Dissolved organic phosphorus (DOP) concentration data density was not sufficient to allow for statistically significant regressions of AOU vs. DOP needed to empirically estimate fDOM and rDOM terms specific to DOP remineralization at each site. To compute prePO4 for each station, we used the values of fDOM, rDOM, and rPOM from Table 1 calculated from regressions of AOU vs. DON, converting from N units to P units using a DON : DOP ratio of 16 : 1 for semilabile DOM remineralization in the subtropical North Atlantic and North Pacific (Letscher and Moore, 2015).
3.1 DOM remineralization in the upper mesopelagic layer at the stations ALOHA and BATS
Empirically derived, annual values of rDOM at Station ALOHA varied between 10.4 and 24.2 for the γn=24.2–24.7 layer and between 12.7 and 23.5 for the γn=24.7–25.2 layer. Values of rDOM at the BATS station varied between 14.0 and 25.3 in the γn=25.8–26.3 layer. Climatological average rDOM computed for each density layer yielded ratios of 18.1 to 18.9 at Station ALOHA and 21.1 at the BATS station (Table 1; standard errors on rDOM are on the order of 33 %). These climatological values of rDOM were used in subsequent calculations of residual preNO3 and fDOM from Eqs. (1) and (2). The empirically derived values of rDOM are consistently larger than the literature estimates of rPOM, indicating that remineralization of DOM in the upper mesopelagic layer returns fewer moles of nitrate per mole of O2 respired at the two sites compared to Redfield stoichiometry.
Empirically derived values of fDOM varied between 0.38 and 0.59 for the γn=24.2–24.7 layer and between 0.36 and 0.6 for the γn=24.7–25.2 layer at Station ALOHA. Values of fDOM at the BATS station varied between 0.33 and 0.5 in the γn=25.8–26.3 layer. Climatological average fDOM values of 0.5 for both density layers at Station ALOHA and a value of 0.4 at the BATS station (Table 1) were used in subsequent calculation of residual preNO3 from Eq. (1).
3.2 Upper-ocean residual preNO3 climatology at the stations ALOHA and BATS
3.2.1 Station ALOHA
The climatology of the residual preNO3 tracer is presented for the upper 250 m at Station ALOHA in Fig. 1a. Residual preNO3 varies between −1 and 1 µM in the upper ∼200 m, with increasingly positive values below 200 m. The resulting rNPN anomaly (blue colors) is a persistent feature within the γn=24.2–25.2 neutral-density layer at a depth of ∼100 to 200 m. Seasonal rPPN anomalies (red colors) are observed immediately above the γn=24.2 neutral-density horizon within the euphotic zone, 0 to ∼100 m. Pulses of rPPN anomalies penetrating the bottom of the rNPN anomaly layer are also observed that coincide with shoaling of the γn=25.2 neutral-density horizon above 200 m.
The monthly averaged climatology of residual preNO3 at Station ALOHA for all data in the years 1989–2016 is presented in Fig. 1b. The subsurface rNPN anomaly is observed to grow in magnitude between the months of May/June and October/November. There also exists an increase in the magnitude of the rPPN anomaly within the euphotic zone (0–100 m), concomitant with the rNPN anomaly formation at ∼100–200 m depth in summer.
Volumetric rates of rNPN anomaly formation at Station ALOHA are estimated at 2.8±1.4 and 3.0±1.5 µmol N m−3 d−1 for the γn=24.2–24.7 layer using rPOM values of 6.9 and 10.6, respectively (Table 1). Slightly lower rates of rNPN anomaly formation of 1.6±0.8 and 2.5±1.4 µmol N m−3 d−1 are estimated for the deeper γn=24.7–25.2 layer at Station ALOHA (annual regressions are provided in Figs. S1 and S2). Depth- and time-integrated, the estimates of rNPN anomaly formation become 28.3±9.6 (rPOM=6.9) and 17.9±7.4 (rPOM=10.6) mmol N m−2 yr−1 for the γn=24.2–24.7 layer and 18.1±8.8 (rPOM=6.9) and 13.7±7.8 (rPOM=10.6) mmol N m−2 yr−1 for the deeper γn=24.7–25.2 layer. Total rNPN formation rate estimates for Station ALOHA are between 31.6±10.8 and 46.4±13.0 mmol N m−2 yr−1 (Table 1).
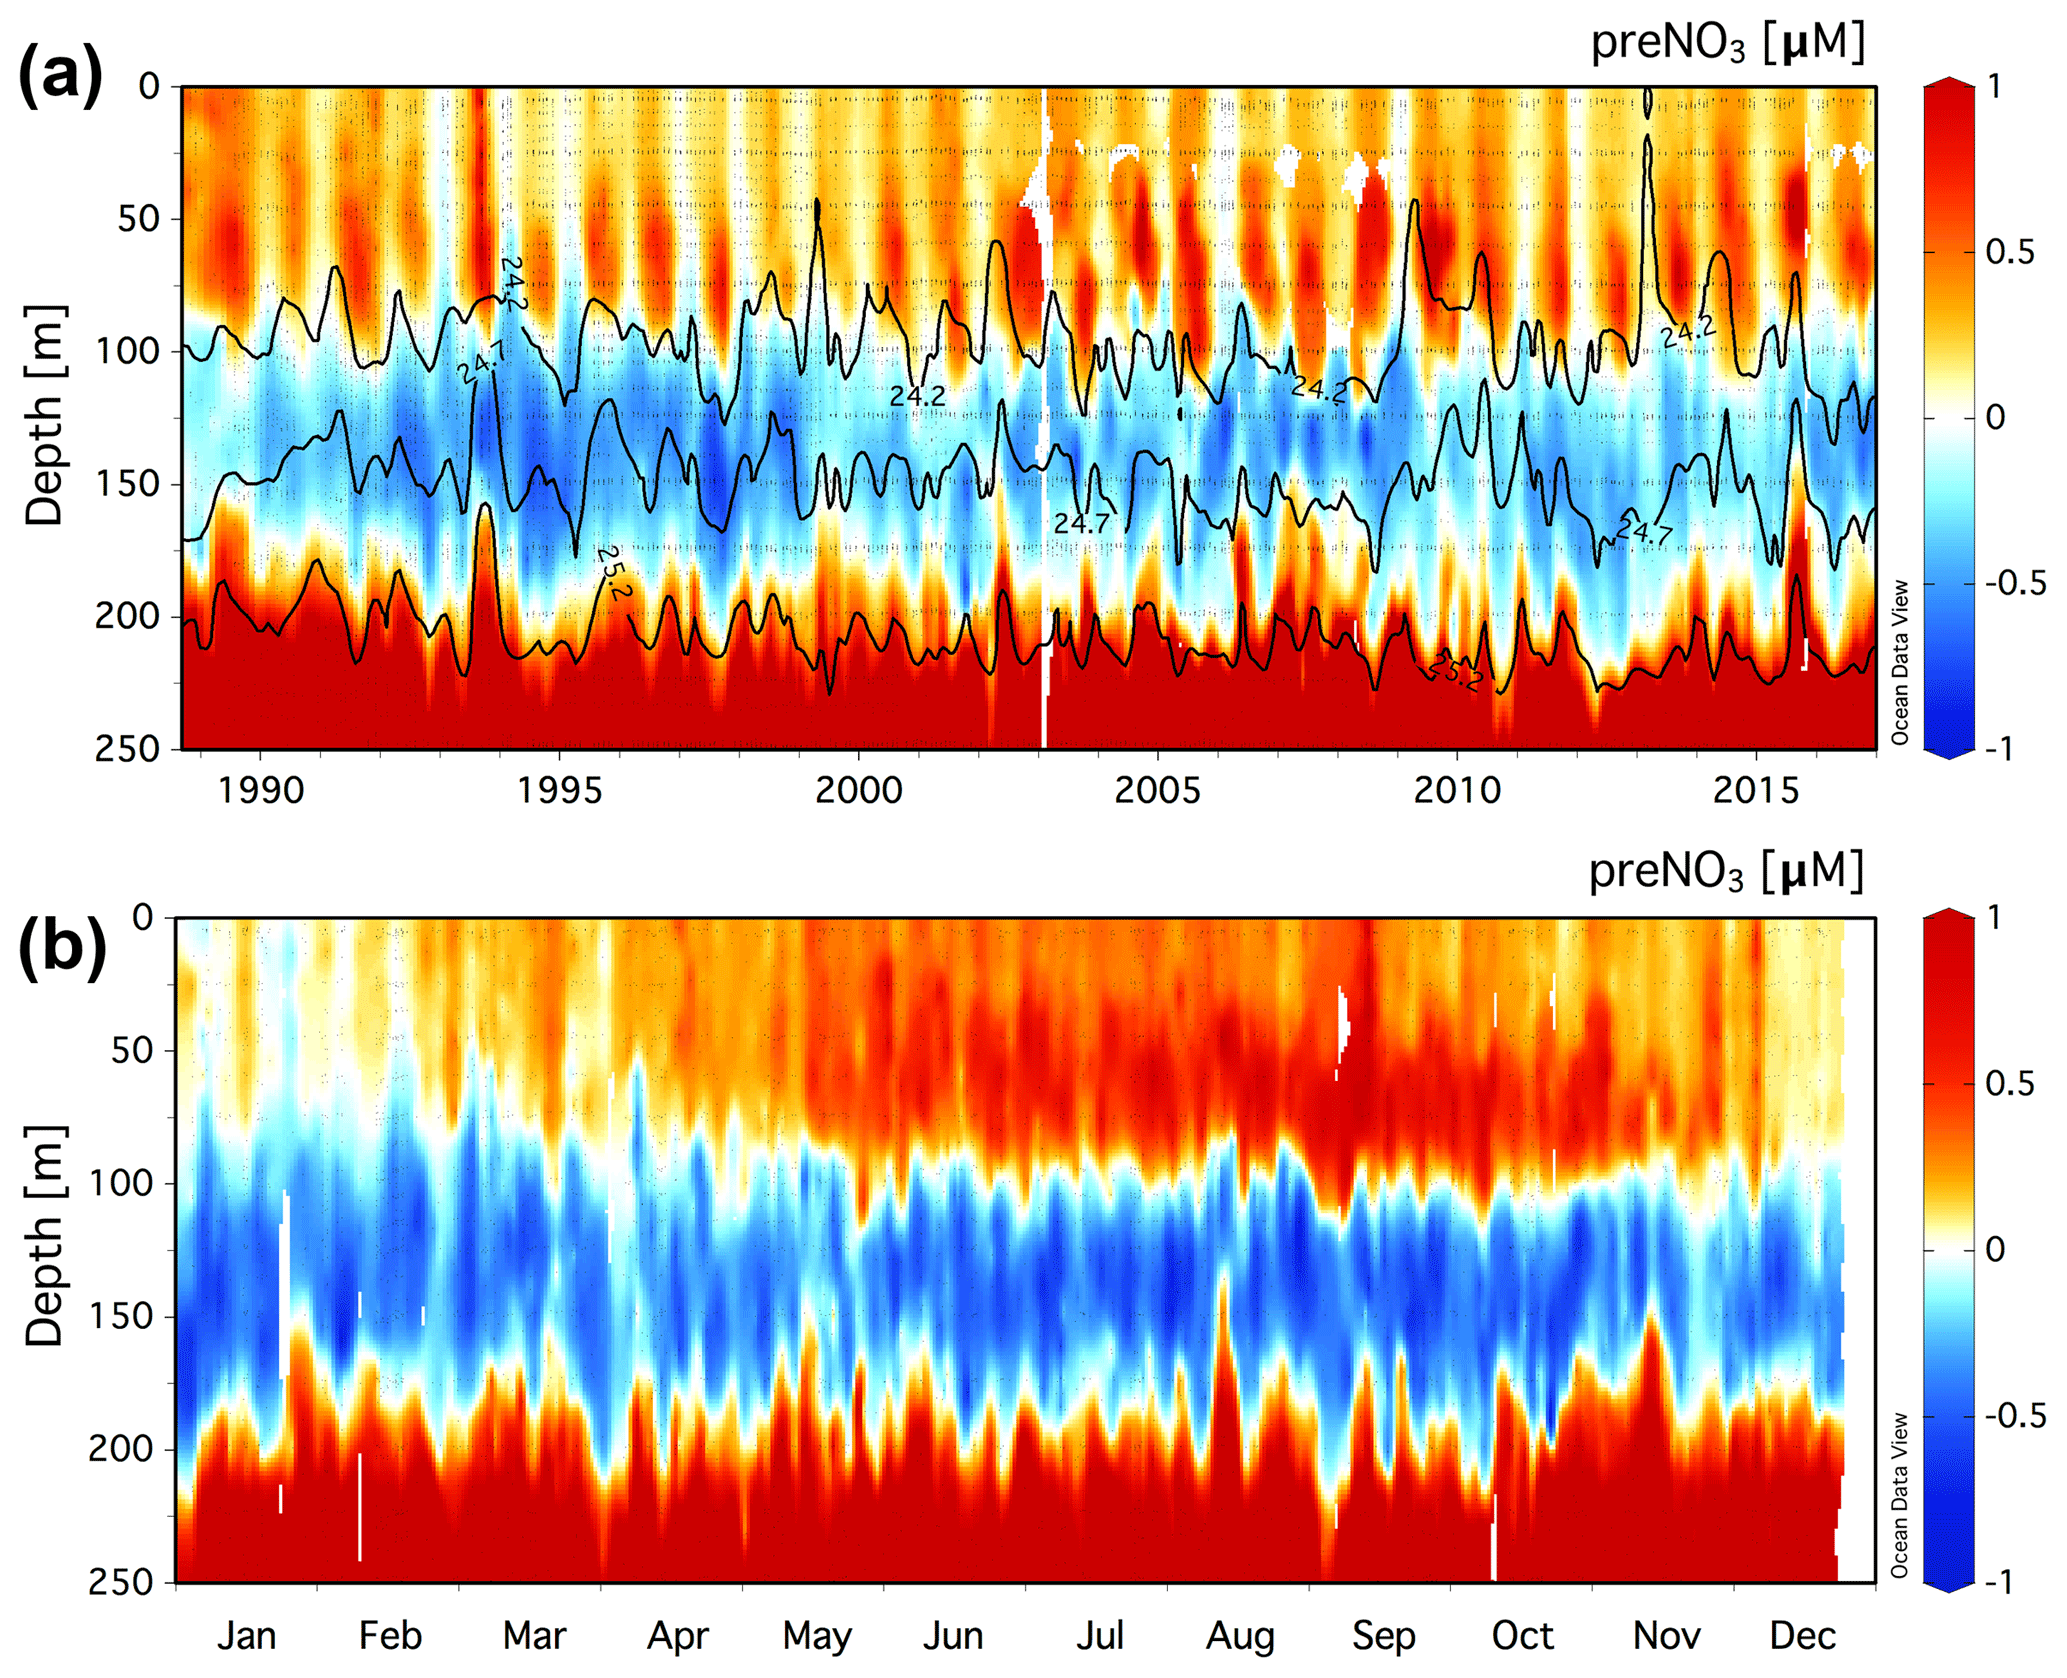
Figure 1(a) Climatology of the residual preNO3 tracer [µM] in the upper 250 m at Station ALOHA (22.75∘ N, 158∘ W) for a value of rPOM=10.6. Black contour lines show neutral density, γn=24.2, 24.7, and 25.2. (b) The monthly averaged residual preNO3 [µM] climatology for all data in the years 1989–2016.
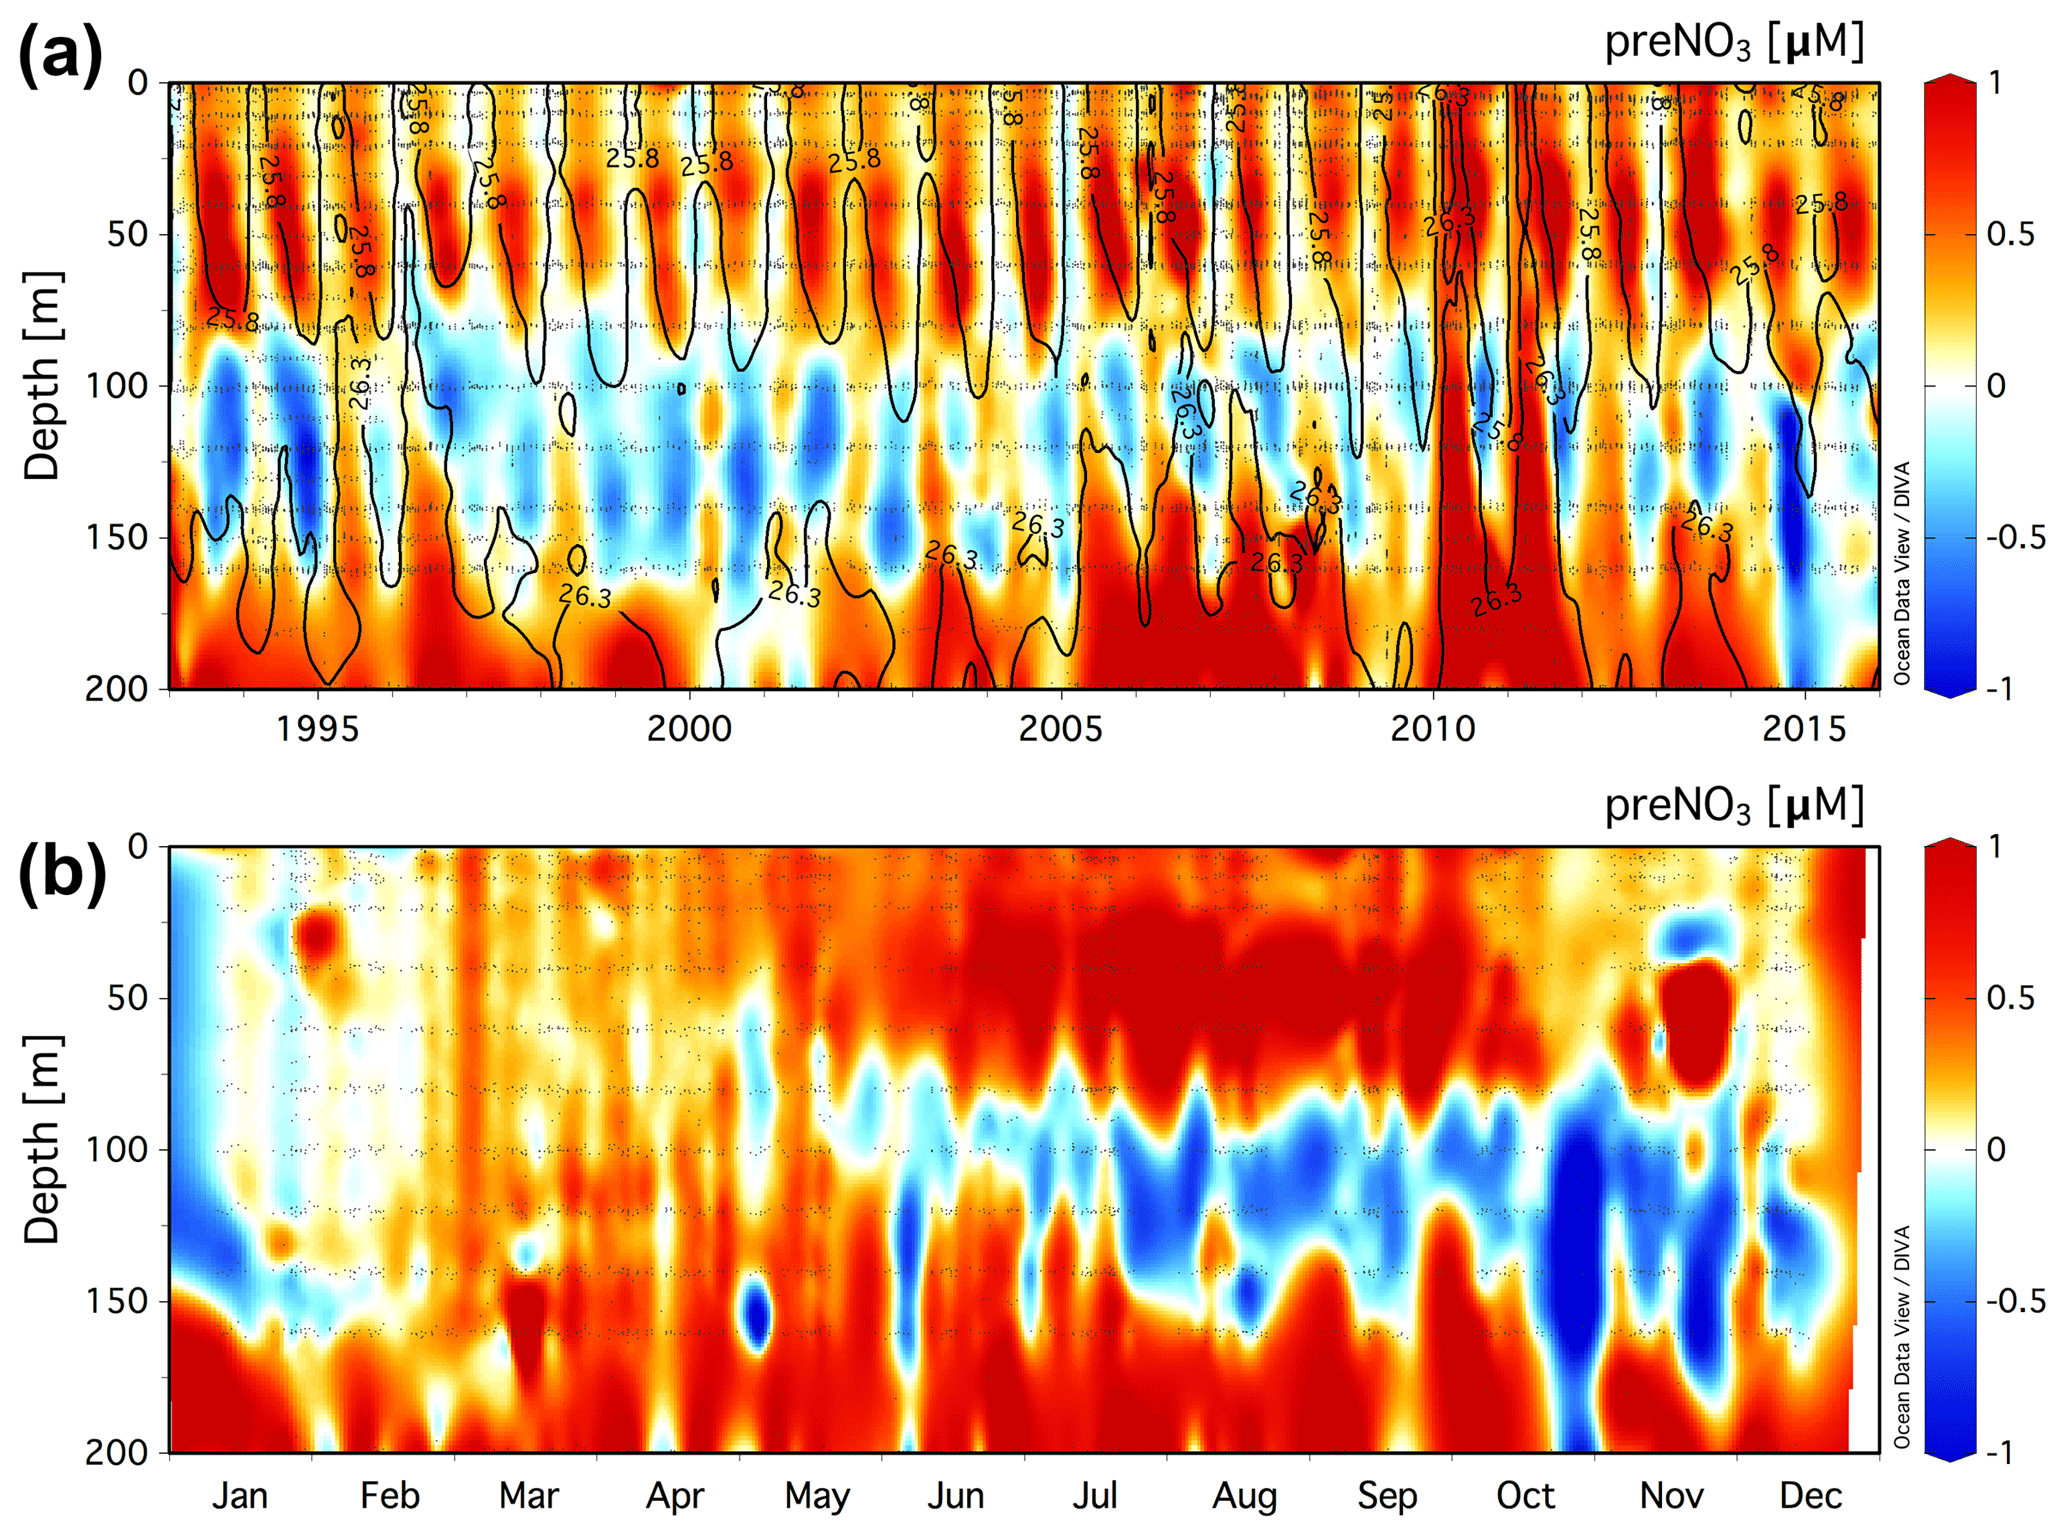
Figure 2(a) Climatology of the residual preNO3 tracer [µM] in the upper 200 m at the BATS station (31.67∘ N, 64.17∘ W) for a value of rPOM=10.6. Black contour lines show neutral density, γn=25.8 and 26.3. (b) The monthly averaged residual preNO3 [µM] climatology for all data in the years 1993–2016.
Table 1Residual negative preNO3 (rNPN) and residual positive preNO3 (rPPN) anomaly formation rates at the stations ALOHA and BATS.
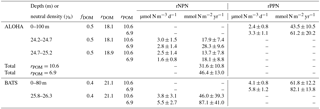
The volumetric rate of rPPN anomaly formation within the euphotic zone at Station ALOHA is estimated at 3.3±1.1 and 2.4±0.8 µmol N m−3 d−1 using rPOM values of 6.9 and 10.6, respectively (Table 1, Fig. S3). These rates are approximately equivalent within error of those estimated for the rNPN formation rate within the γn=24.2–24.7 layer immediately below in the water column. Depth- and time-integrated, the estimate of rPPN anomaly formation is 61.2±20.2 (rPOM=6.9) and 43.5±10.5 (rPOM=10.6) mmol N m−2 yr−1 (Table 1). The euphotic-zone-integrated rPPN anomaly is approximately 33 % higher than the estimated total integrated rNPN anomaly within the combined γn=24.2–25.2 layer.
3.2.2 BATS
The climatology of the residual preNO3 tracer in the upper 200 m at BATS is presented in Fig. 2a. Residual preNO3 varies between −1 and 1 µM in the upper 200 m, and seasonal subsurface rNPN anomalies at ∼80 to 160 m depth are observed in most but not all years from 1993 to 2016. Similar to Station ALOHA, seasonal pulses of rPPN anomalies are observed immediately above the γn=25.8 neutral-density horizon within the euphotic zone, 0 to ∼80 m. Pulses of rPPN anomalies penetrating from below the γn=26.3 neutral-density horizon are present in a few years but are much less frequent than observed in the Station ALOHA climatology. rPPN anomalies are observed immediately below the rNPN layer beginning at ∼160 m.
The monthly averaged climatology of residual preNO3 at BATS for all data in the years 1993–2016 is presented in Fig. 2b. The subsurface rNPN anomaly is observed to first appear beginning in April/May and grow in magnitude through the end of the calendar year. The rNPN feature starts shallow at a depth of ∼60 to 100 m, which deepens over the summer months to depths of ∼80 to 160 m by year's end. There also exists a layer of rPPN anomaly at 0 to ∼80 m depth that increases in magnitude, concomitant with the rNPN anomaly formation at ∼80–160 m depth in summer and autumn. Late-winter convective overturn of the upper water column in late January/February at the BATS station (Hansell and Carlson, 2001) erases both the subsurface rNPN and 0–80 m rPPN anomaly.
The volumetric rate of rNPN anomaly formation at the BATS station is estimated at 5.5±2.7 and 3.8±3.1 µmol N m−3 d−1 for the γn=25.8–26.3 layer using rPOM values of 6.9 and 10.6, respectively (Table 1, Fig. S4). Depth- and time-integrated, the estimate of the rNPN anomaly formation rate at the BATS station is between 46.0±39.3 and 87.1±41.0 mmol N m−2 yr−1 (Table 1). The volumetric rate of rPPN anomaly formation within the euphotic zone at the BATS station is estimated at 5.8±1.2 and 4.1±0.8 µmol N m−3 d−1 using rPOM values of 6.9 and 10.6, respectively (Table 1, Fig. S5). These rates are approximately equivalent within error of those estimated for the rNPN formation rate within the γn=25.8–26.3 layer immediately below in the water column. Depth- and time-integrated, the estimate of rPPN anomaly formation is 82.1±13.8 (rPOM=6.9) and 61.8±12.2 (rPOM=10.6) mmol N m−2 yr−1 (Table 1). The euphotic-zone-integrated rPPN anomaly is approximately balanced (rPOM=6.9) or 33 % higher (rPOM=10.6) than the estimated integrated rNPN anomaly within the γn=25.8–26.3 layer.
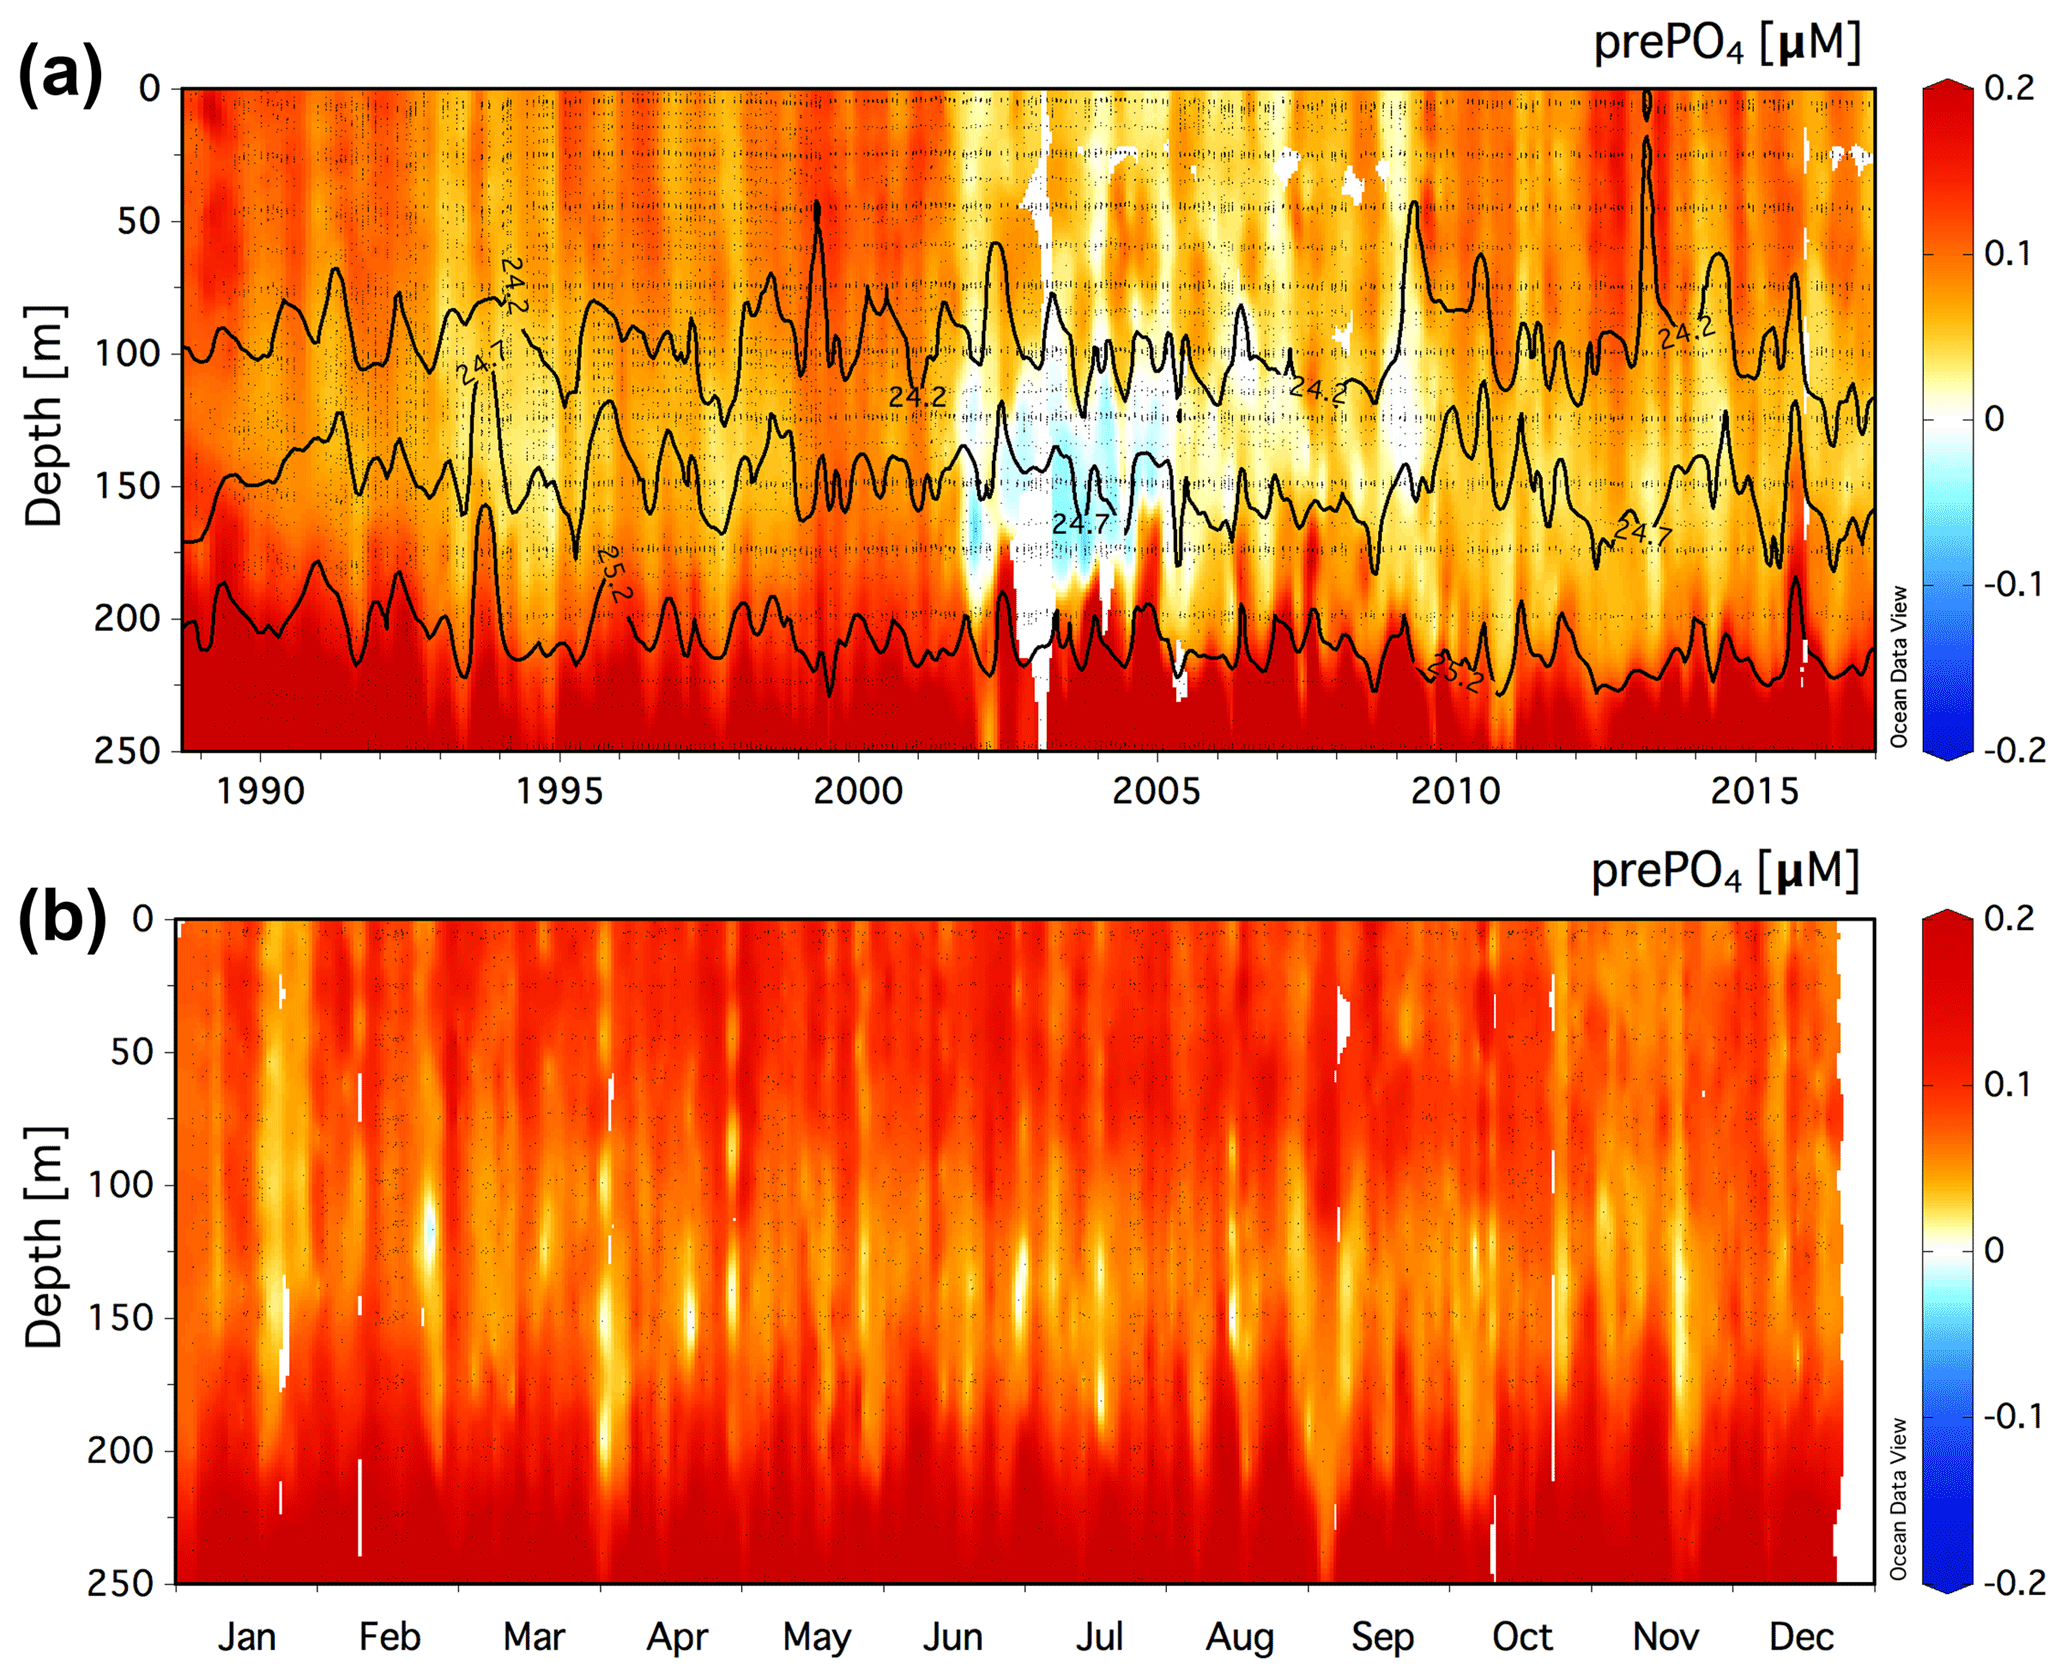
Figure 3(a) Climatology of the residual prePO4 tracer [µM] in the upper 250 m at Station ALOHA (22.75∘ N, 158∘ W) for a value of rPOM=10.6. Black contour lines show neutral density, γn=24.2, 24.7, and 25.2. (b) The monthly averaged residual prePO4 [µM] climatology for all data in the years 1989–2016.
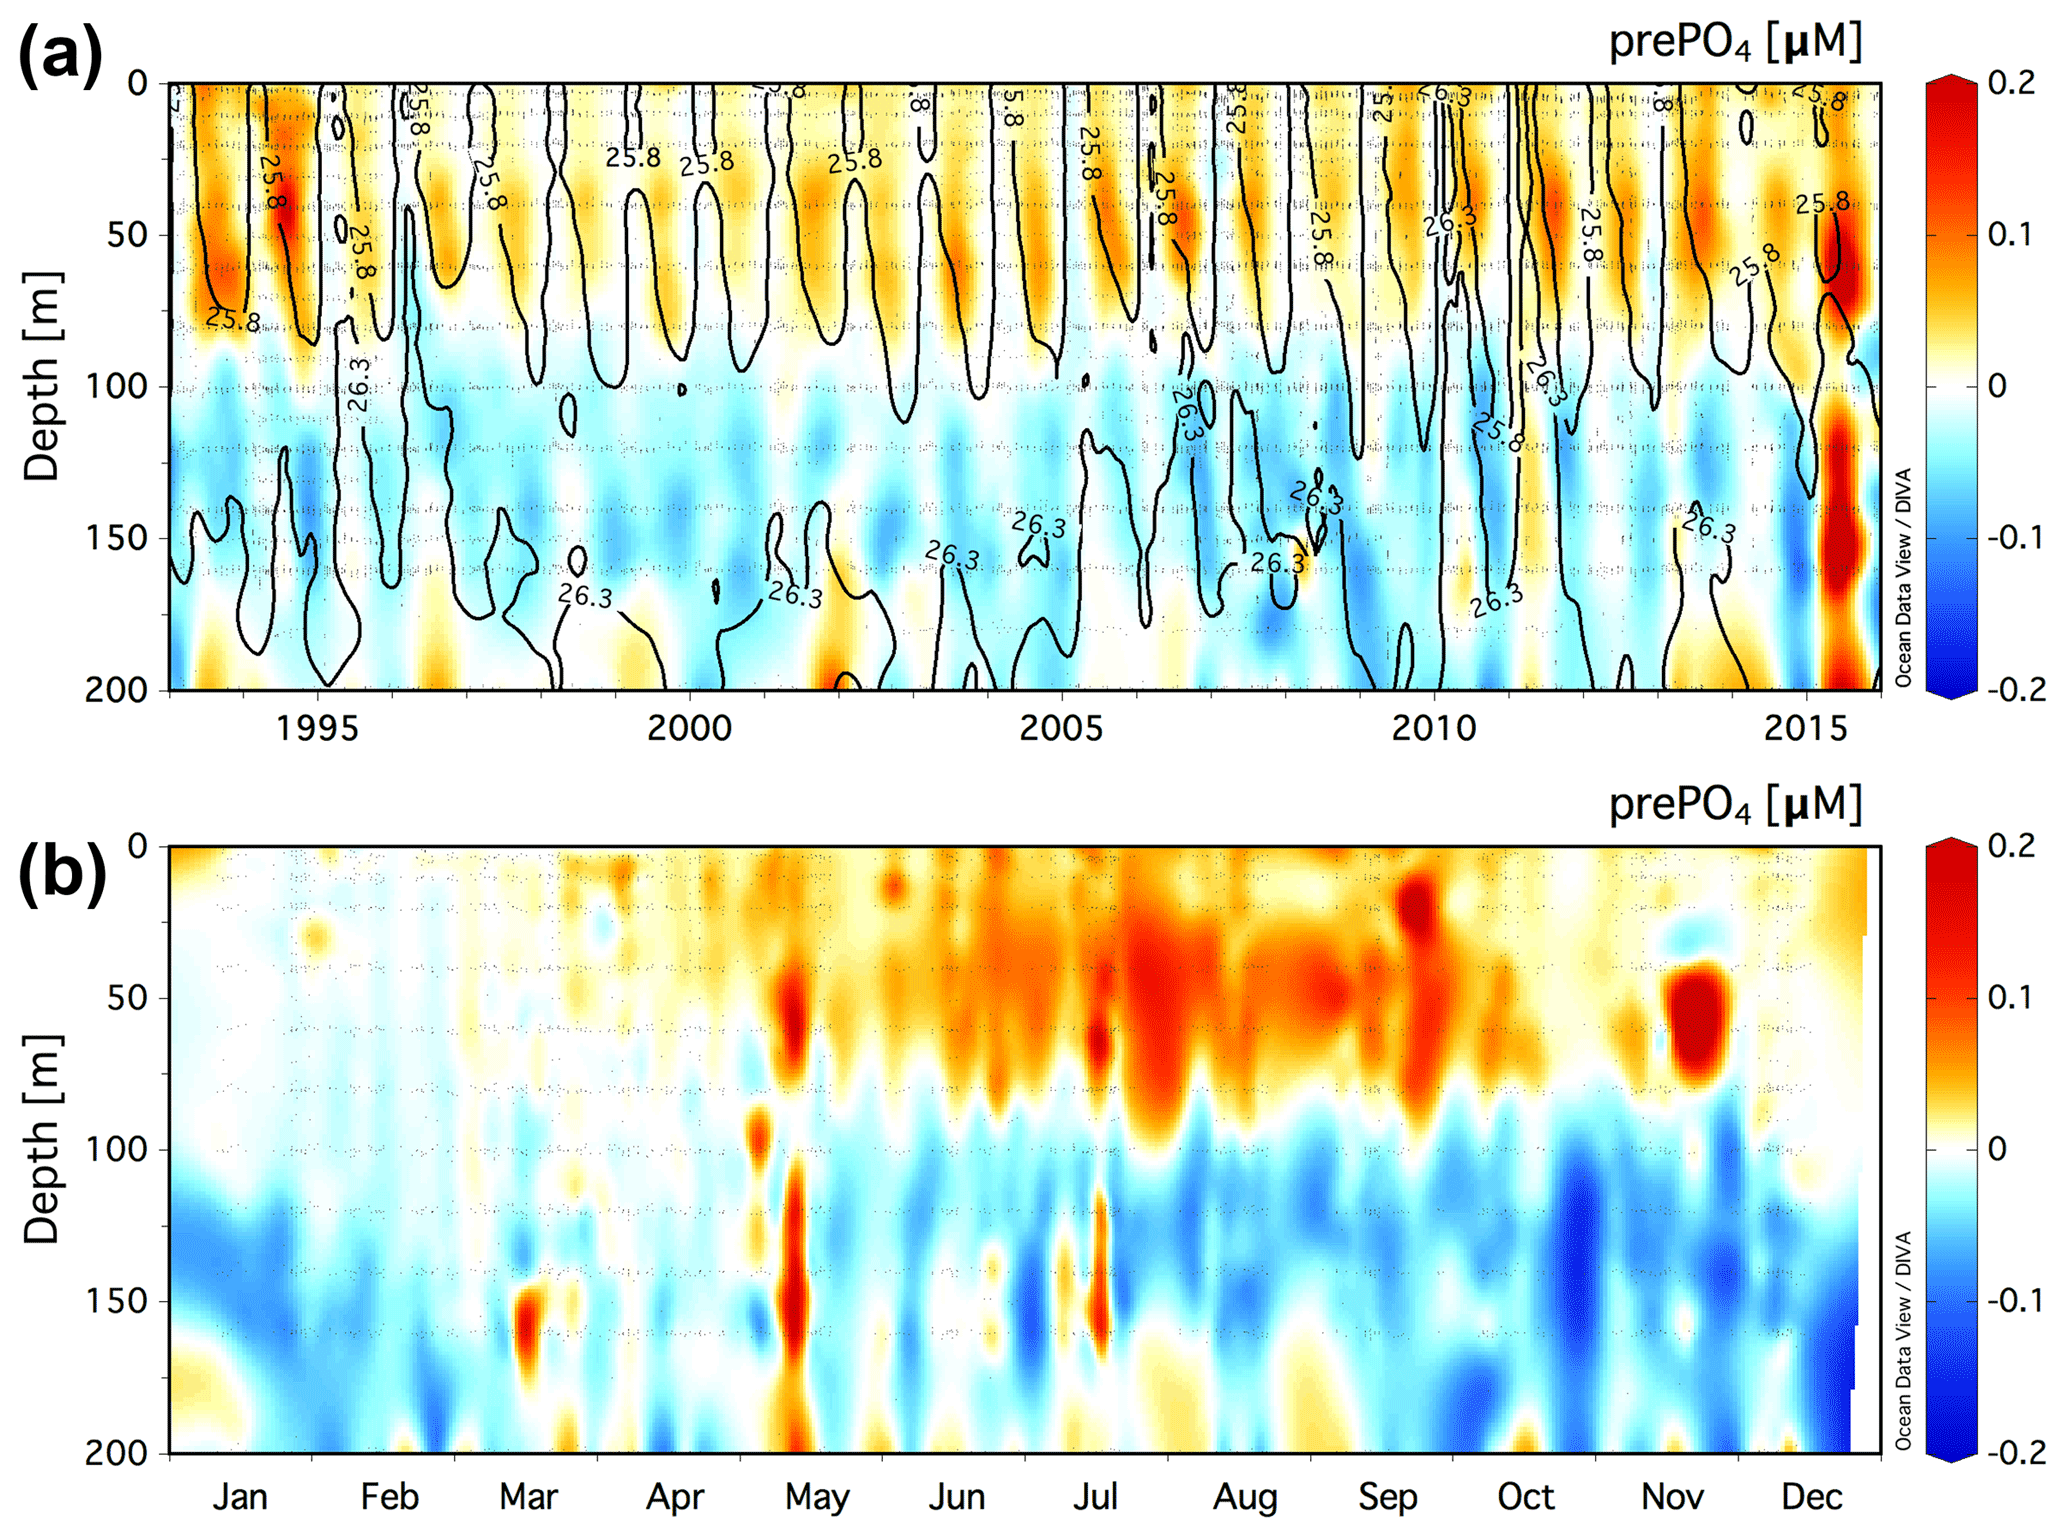
Figure 4(a) Climatology of the residual prePO4 tracer [µM] in the upper 200 m at the BATS station (31.67∘ N, 64.17∘ W) for a value of rPOM=10.6. Black contour lines show neutral density, γn=25.8 and 26.3. (b) The monthly averaged residual prePO4 [µM] climatology for all data in the years 1993–2016.
3.3 Upper-ocean residual prePO4 climatology at the stations ALOHA and BATS
3.3.1 Station ALOHA
The climatology of the residual prePO4 tracer is presented for the upper 250 m at Station ALOHA in Fig. 3a. Residual prePO4 varies between −0.04 and 0.2 µM with positive values observed throughout the upper 250 m of the time series with exception of a period exhibiting small (∼0 to −0.04 µM) residual negative prePO4 anomalies at ∼125–175 m in the years 2002–2004. The monthly averaged climatology of residual prePO4 at Station ALOHA for all data in the years 1989–2016 is presented in Fig. 3b. Positive residual prePO4 (0–0.2 µM) is observed throughout the upper 250 m within the monthly averaged climatology.
3.3.2 BATS
The climatology of the residual prePO4 tracer in the upper 200 m at BATS is presented in Fig. 4a. Residual prePO4 varies between −0.2 and 0.2 µM in the upper 200 m. Seasonal subsurface residual negative prePO4 anomalies at ∼80 to 160 m depth are observed in all years from 1993 to 2016 with the exception of 2015. Seasonal pulses of residual positive prePO4 anomalies (∼0–0.1 µM) are observed immediately above the γn=25.8 neutral-density horizon within the euphotic zone, 0 to ∼80 m.
The monthly averaged climatology of residual prePO4 at BATS for all data in the years 1993–2016 is presented in Fig. 4b. The subsurface residual prePO4 anomaly is present throughout the seasonal cycle although it is observed to grow in magnitude beginning in May continuing through the end of the calendar year into January/February, before springtime vertical overturning circulation resets the residual prePO4 concentration in the upper 200 m. The residual negative prePO4 feature starts shallow at a depth of ∼80 m in May/June, which deepens over the summer months to depths of ∼80 to 200 m by year's end. There also exists a layer of residual positive prePO4 anomaly at 0 to ∼80 m depth that develops during April–November, concomitant with the seasonally increasing residual negative prePO4 anomaly at ∼80–200 m depth in summer and autumn.
Our analysis found DOM remineralization within the upper mesopelagic layer to follow non-Redfield stoichiometry at Station ALOHA (∼18–19) and the BATS station (∼21). However, contrary to the findings of Abell et al. (2005) working in the subtropical North Pacific, this mechanism cannot quantitatively explain the negative preNO3 anomaly present in the subsurface. Instead, we find the euphotic zone to exhibit residual positive preNO3 anomalies, and the upper mesopelagic layer exhibits residual negative preNO3 anomalies at the stations ALOHA and BATS. Our directly diagnosed DOM remineralization stoichiometry from observations of AOU and DON is significantly lower than that inferred by Abell et al. (2005) (∼23–30) diagnosed from AOU vs. DOC remineralization stoichiometry and likely explains this discrepancy. Thus, the fraction of AOU attributable to DOM remineralization and its AOU vs. DON stoichiometry needs to be accounted for in any study that utilizes the preNO3 tracer. The traditional preNO3 tracer calculation should be abandoned and replaced with the residual preNO3 tracer formulation as defined in our study (Eq. 1).
We now undertake a quantitative examination of the potential contributing mechanisms to explain the subsurface rNPN anomalies and euphotic-zone rPPN anomalies.
4.1 Physical mechanisms
Both the ALOHA and BATS station climatologies of the residual preNO3 tracer exhibit annual cycles of rPPN anomaly formation in the euphotic zone and subsurface rNPN anomaly formation beginning at ∼100 m (ALOHA) or ∼80 m (BATS) that intensifies from early summer through to mid-autumn (Figs. 1 and 2). This time frame coincides with the period of thermal stratification of the water column at the BATS station, separating the surface mixed layer, ∼0–30 m, from the deep chlorophyll maximum (DCM) present at ∼100–120 m (Navarro and Ruiz, 2013). Station ALOHA exhibits year-round stratification with the DCM present at ∼125 m (Navarro and Ruiz, 2013). The largest rPPN anomalies are observed in the vertical zone between the surface mixed layer and the DCM at both sites, at a depth of ∼50–100 m at Station ALOHA and a depth of ∼40–80 m at the BATS station. This vertical zone of rPPN anomaly formation coincides with the observed subsurface O2 maximum (SOM) that has historically been a conundrum to biogeochemical explanation given the in situ 14C-diagnosed net primary production estimates (e.g., Jenkins and Goldman, 1985; Shulenberger and Reid, 1981; Platt et al., 1989). Our rPPN volumetric rates of formation converted to O2 units using the values in Table 1 are approximately 20 %–37 % (at Station ALOHA) of the estimated SOM formation rate in the subtropical central North Pacific and ∼34 %–41 % (at the BATS station) of the estimated SOM formation rate in the Sargasso Sea (Shulenberger and Reid, 1981).
Subsurface rNPN anomalies begin to appear at a depth of ∼100 m at Station ALOHA and ∼80 m at the BATS station, continuing down to depths of ∼200 and ∼160 m, respectively. We estimated the depth of the top of the nitracline by defining this as the depth where µM in the monthly averaged climatologies. At Station ALOHA, the top of the nitracline varies between 120 and 130 m depth with a mean of ∼126 m over the annual cycle. At the BATS station, the top of the nitracline varies between 90 and 120 m depth with an annual mean of ∼102 m. Thus, the formation of rNPN anomalies is concurrent with the depth in the water column where nitrate begins to accumulate from remineralization processes at both sites and continues to form deeper into the nitracline.
What is the role of lateral physical mixing in creating the observed rPPN and rNPN anomalies? To address this question, we turn to the World Ocean Atlas (WOA) annual O2 and climatologies (Garcia et al., 2014a, b) on the subsurface isopycnals present in the ∼100–250 m depth layer at each site. We computed the residual preNO3 tracer for the subtropical North Pacific using the values of fDOM and rDOM for Station ALOHA and for the subtropical North Atlantic using the values for the BATS station in Table 1. Examination of the residual preNO3 tracer on the γn=26.5 density surface (the surface approximately bisecting the 150–200 m layer near BATS exhibiting rPPN anomalies) reveals that the BATS station is immediately surrounded by waters with a residual preNO3 value of ∼1 µM (blue colors, Fig. S6). Waters with a residual preNO3 content of ∼2–3 µM are present to the southwest and to the northeast (red colors, Fig. S6). The lack of a residual preNO3 gradient on the γn=26.5 density surface in the immediate vicinity of the BATS station suggests the observed ∼1 µM residual preNO3 concentration present at ∼150–200 m depth in Fig. 2 represents a local signal with little mixing of waters with different residual preNO3 content. Lateral advective mixing of the higher-residual-preNO3 waters to the southwest and northeast of the BATS station would increase the residual preNO3 on γn=26.5 to values greater than 1 µM at the BATS station, which is not observed. Plots of residual preNO3 vs. the CFC-11 and CFC-12 age on γn=26.5 in the North Atlantic reveal essentially no increasing or decreasing residual preNO3 age gradient (Fig. S6). In summation, this evidence suggests the BATS station sits within the NW corner of a large region of the subtropical North Atlantic characterized by a residual preNO3 content of ∼1 µM on γn=26.5 that is generated within the basin.
On the γn=26.0 isopycnal which bisects the layer exhibiting the rNPN anomaly at the BATS station, the site sits surrounded by waters with a residual preNO3 content of ∼0 µM in the annual climatology, with more distant waters exhibiting rNPN anomalies south of ∼27∘ N and waters with rPPN anomalies north of ∼37∘ N (Fig. S7). Plots of residual preNO3 vs. CFC-11 and CFC-12 age on γn=26.0 again reveal essentially no residual preNO3 gradient with increasing age (Fig. S7). Given the lack of a residual preNO3 tracer gradient with water mass age and the observation of a repeating seasonal pattern of rNPN anomaly formation at the BATS station on γn=26.0 (Fig. 2), we conclude that lateral advective mixing cannot explain the observed seasonal rNPN anomalies, which are instead suggestive of biological mechanisms supporting rNPN anomaly formation at the BATS station.
Examination of the residual preNO3 tracer on the γn=25.4 density surface (the surface approximately bisecting the 200–250 m layer near ALOHA) in the North Pacific within the WOA climatology reveals that Station ALOHA sits near the southern boundary of waters with a residual preNO3 content of 0–1.5 µM that extends as far north as 40∘ N and as far east as 130∘ W (Fig. S8). Waters with higher residual preNO3 content of 2–4 µM are located to the south of Station ALOHA, beginning around the vicinity of the Big Island of Hawaii (Fig. S8). Examination of plots of residual preNO3 vs. CFC-11 and CFC-12 age on γn=25.4 in the North Pacific reveals that Station ALOHA lies between younger, low-residual-preNO3-content waters to the north and older, higher-residual-preNO3-content waters to the south (Fig. S8). Mixing of these waters along γn=25.4 may explain the observed ∼1 µM residual preNO3 concentration present at 200–250 m depth in Fig. 1. This feature is noticeably absent at BATS, (Fig. S6) consistent with a minor role for advective mixing there.
On the γn=24.7 isopycnal which bisects the density layer exhibiting the rNPN anomaly at Station ALOHA, the site is surrounded by waters with rNPN anomalies on the order of −1 to 0 µM (Fig. S9). Plots of residual preNO3 vs. CFC-11 and CFC-12 age on γn=24.7 reveal essentially no residual preNO3 age gradient (Fig. S9). Similar to the BATS station, given the lack of a residual preNO3 age gradient on γn=24.7 and the observation of seasonal formation of rNPN anomalies, we conclude that lateral advective mixing cannot explain the observed rNPN anomalies, which are suggestive of biological mechanisms.
4.2 Biological mechanisms
Lateral mixing may explain the observed rPPN anomaly below ∼200 m at Station ALOHA: however, the euphotic-zone rPPN anomalies and subsurface rNPN anomalies at each site are generated by a local biological mechanism. Biological formation of rNPN anomalies requires either O2 consumption without concomitant stoichiometric nitrate accumulation or nitrate drawdown without concomitant stoichiometric O2 production. Formation of rPPN anomalies requires either O2 production without concomitant stoichiometric nitrate drawdown or nitrate accumulation without concomitant stoichiometric O2 consumption. Having accounted for the non-Redfield DOM remineralization stoichiometry at each site (see Table 2 for the rate of NPN and PPN anomaly formation attributable to N-poor DOM remineralization), we hypothesize three other biological mechanisms to explain the observed seasonal formation rates and integrated quantities of concurrent rPPN accumulation in the euphotic zone and rNPN accumulation in the subsurface at the stations ALOHA and BATS: (1) vertically separated biological production, export, and remineralization of N-deficient TEPs; (2) heterotrophic bacterial uptake of nitrate to remineralize N-poor organic matter; and (3) vertical migration of autotrophic phytoplankton down to the nutricline to acquire nitrate with subsequent photosynthetic oxygen production within the euphotic zone.
Table 2Contribution of N-poor DOM remineralization to NPN and PPN anomaly formation rates as well as contributions to rNPN and rPPN anomaly formation rates by presumed processes at the time series sites. NPN and rNPN is for features on γn=24.2–25.2 at Station ALOHA and γn=25.8–26.3 at the BATS station. Ez PPN and rPPN is for features at 0–100 m depth at Station ALOHA and 0–80 m depth at the BATS station.
4.2.1 TEPs
Transparent exopolymer particles are the polysaccharide-rich exudate of phytoplankton that accumulate in the size range <1 to >100 µm in aquatic systems (Mari et al., 2017). TEPs are both sticky and positively buoyant in seawater (Azetsu-Scotte and Passow, 2004), leading to aggregation and flotation towards the surface, with large enrichments of TEPs present in the sea surface microlayer (Wurl et al., 2009). Being comprised of nearly pure saccharide material, TEPs are a carbon-rich and essentially N-deficient pool of non-sinking particulate organic carbon formed within the euphotic zone of marine systems by phytoplankton production (Alldredge et al., 1993). TEP production has been hypothesized to contribute to “carbon overconsumption” in low-nutrient oligotrophic marine ecosystems (Toggweiler, 1993) where organic matter is produced in non-Redfield, C-rich or N-poor proportions. Due to their positive buoyancy (Mari et al., 2017), TEPs have been viewed as a non-contributor to upper-ocean carbon export; however, some portion of the TEP pool is associated with sufficient ballasting particles (e.g., clays, biogenic minerals) to achieve negative buoyancy and may comprise a slowly sinking (a few meters per year) pool of organic carbon exported below the euphotic zone (Mari et al., 2017). TEP production and remineralization stoichiometry has the correct sense – O2 production without Redfieldian nitrate drawdown within the euphotic zone and O2 consumption without Redfieldian nitrate accumulation within the mesopelagic layer – to contribute to both the observed rPPN anomalies within the euphotic zone and rNPN anomalies in the upper mesopelagic layer at the stations ALOHA and BATS.
We use field data of TEP concentrations near the stations BATS and ALOHA and a few simplifying assumptions to test for the importance of this process as a contributor to the dual rNPN and rPPN anomalies. Our estimates of the potential for TEP cycling to contribute to the observed euphotic-zone rPPN and subsurface rNPN anomaly formation rates assume (1) that TEPs are pure carbohydrate (CH2O) without any N content, such that TEP production/remineralization C:O2 stoichiometry can be assumed 1 : 1 (e.g., ), and (2) that there exists a sufficiently large and dense TEP pool to sink rapidly enough to contribute to annual carbon export and O2 remineralization budgets. Both assumptions, if incorrect, will overestimate the TEP contribution. In conjunction with TEP cycling, Coomassie-stainable particles are transparent protein-containing particles (Long and Azam, 1996) that can reach similar concentrations within the oligotrophic euphotic zone as TEPs (Cisternas-Novoa et al., 2015). Thus, the assumption that transparent exopolymer particle cycling delivers only C to the subsurface to drive rNPN anomaly formation may not be entirely valid. In addition, Mari et al. (2017) note that elevated TEP concentrations likely enhance material retention in the euphotic zone. Thus, our calculations that follow tend to maximize the contribution of TEPs.
Cisternas-Novoa et al. (2015) measured TEP concentration depth profiles in the Sargasso Sea northeast of Bermuda on five separate occasions from February 2012 to June 2013. The profiles show a ∼10 µg XG eq. L−1 (xanthan gum equivalent) concentration excess between the upper 100 m and the 100–200 m layer (Fig. 15 in Cisternas-Novoa et al., 2015). We take this upper 100 m excess to represent the fraction of the euphotic-zone TEP pool that is exported annually to the upper mesopelagic 100–200 m depth layer by either physical sinking of a fraction of the TEP pool that becomes negatively buoyant or being delivered to the subsurface with wintertime vertical mixing. This assumption is supported by the observation that the euphotic-zone-to-mesopelagic TEP concentration gradient is nearly erased in the winter profile, presumably due to wintertime convective mixing, and reappears following the spring bloom, remaining relatively unchanged throughout the late-spring/summer month profiles. TEPs in xanthan gum equivalents can be converted to µg C L−1 units using a 0.63 conversion factor (Engel, 2004) and again into µM units, yielding a Sargasso Sea upper-ocean concentration excess of ∼0.5 µM TEP-C. Integrating over the surface to 80 m depth layer (the depth where rPPN anomalies switch to rNPN anomalies), we obtain a potential TEP production and export flux of 42 mmol TEP-C m−2 yr−1 from the euphotic zone into the upper mesopelagic layer. Assuming 1 : 1 C:O2 TEP production/remineralization stoichiometry, an O2 production flux in the absence of nitrate drawdown of 42 mmol O2 m−2 yr−1 can be ascribed to TEP production within the euphotic zone, and the same flux can be ascribed to O2 consumption without concomitant nitrate accumulation from TEP remineralization in the mesopelagic layer. We can convert this O2 flux to a residual preNO3 equivalent using Eq. (1) and the values in Table 1, yielding estimates of 3.2–4.5 mmol N m−2 yr−1 residual preNO3 anomaly formation rate equivalents, depending on the choice of rPOM. Thus, TEP formation within the euphotic zone of the Sargasso Sea has the potential to explain 5.2 %–5.4 % of the estimated rPPN anomaly formation rate and 5.1 %–7.0 % of the estimated rNPN anomaly formation rate within the γn=25.8–26.3 layer (Table 2).
The potential contribution of TEP cycling to rPPN and rNPN anomaly formation near the BATS station can be also be estimated using published sinking rates for negatively buoyant TEPs. Again, using the TEP profiles from the Sargasso Sea from Cisternas-Novoa et al. (2015), we estimate a concentration difference of ∼5 µg XG eq. L−1 between 100 and 200 m depth (the approximate depths exhibiting rNPN anomalies). Converting to molar carbon concentration yields a quantity of ∼0.26 µM TEP-C that is apparently remineralized within the rNPN anomaly layer. We apply the TEP sinking rate of 0.04 d−1 from Hamanaka et al. (2002) to estimate the rate of delivery of exported TEPs from the euphotic zone into the upper mesopelagic layer, yielding a TEP supply and remineralization flux of 10 µmol C m−3 d−1. Depth- and time-integrated to 15 m and 1 year, i.e., the depth slowly sinking TEPs will sink after 1 year, this flux becomes 56.9 mmol C m−2 yr−1 or O2 units assuming 1 : 1 C:O2 stoichiometry for TEPs. Conversion of this O2 flux into residual preNO3 equivalents yields an estimated 4.3–6.0 mmol N m−2 yr−1 of the observed rPPN and rNPN anomaly formation rate attributable to TEP cycling. Thus, computed using the sinking rate, TEP formation within the euphotic zone has the potential to explain 7.0 %–7.3 % of the estimated rPPN anomaly formation rate and 6.9 %–9.3 % of the estimated rNPN anomaly formation rate within the γn=25.8–26.3 layer.
Seasonal depth profiles of TEP concentration are unavailable for the subtropical North Pacific near Station ALOHA. Wurl et al. (2011) measured TEP concentration profiles south of the island of Hawaii during August/September 2009. We use the upper-ocean concentration excess present in these profiles with the TEP sinking rate of 0.04 d−1 to estimate the TEP cycling contribution to rPPN and rNPN anomaly formation rates near Station ALOHA. The 100–200 m concentration excess in TEP-C is ∼1 µM, yielding an export and supply flux of 40 µmol C m−3 d−1. With depth and time integration for 15 m and 1 year, this flux becomes 220 mmol C m−2 yr−1 (mmol O2 m−2 yr−1). Conversion of this O2 flux to residual preNO3 equivalents using Eq. (1) and values in Table 1 yields an estimated 16.2–21.8 mmol N m−2 yr−1 of the observed rPPN and rNPN anomaly formation rate potentially attributable to TEP cycling at Station ALOHA. Thus, TEP formation within the euphotic zone has the potential to explain 35.6 %–37.2 % of the estimated rPPN anomaly formation rate and 47.0 %–51.3 % of the total estimated rNPN anomaly formation rate within the combined γn=24.2–25.2 layer (Table 2).
4.2.2 Bacterial nitrate uptake
Multiple studies have shown the uptake of nitrate and/or phosphate by heterotrophic bacteria during the remineralization of organic matter or that inorganic nutrients can limit bacterial OM consumption (e.g., Zweifel et al., 1993; Kirchman, 1994; Cotner et al., 1997; Rivkin and Anderson, 1997; Caron et al., 2000; Letscher et al., 2015). Bacterial nitrate uptake to remineralize OM has the effect of creating an NPN anomaly (O2 consumption without concomitant nitrate accumulation) and thus can only contribute to the observed subsurface rNPN anomaly formation. It cannot contribute to either the formation of the euphotic-zone rPPN anomaly or surface mixed-layer drawdown of DIC. If TEP cycling is an important contributor to oligotrophic ocean C export and shallow subsurface O2 consumption, heterotrophic bacterial nitrate and/or phosphate uptake is a likely complementary biological process, since the nutrient-deficient content of TEPs could require exogenous uptake of N and P from the seawater media for bacterial production when growing on TEP organic matter. This would result in an imbalance between rPPN and rNPN, in contrast to the results presented earlier.
To assess the potential contribution of bacterial nitrate uptake to our observed rNPN anomaly formation rates at the stations ALOHA and BATS, we examined the literature for estimates of bacterial C production rates and bacterial biomass C:N ratios for the Sargasso Sea and subtropical North Pacific. Carlson et al. (1996) measured bacterial production rates at the BATS station using the 3H-thymidine and 3H-leucine uptake methods with average euphotic-zone rates of 23 pmol C L−1 d−1 by 3H-thymidine and 0.41 nmol C L−1 d−1 by 3H-leucine. Using a bacterial biomass C:N of 5:1 for this region (Gunderson et al. 2002) and integrating for 1 year and over the ∼80–160 m thick layer exhibiting rNPN anomaly yields an estimate of 0.17–3.0 mmol N m−2 yr−1 bacterial N demand. If we assume that bacteria satisfy all of their N demand via uptake of seawater nitrate in this shallow subsurface layer, bacterial nitrate uptake can explain at most 0.5 %–3.5 % of the estimated rNPN anomaly formation rate at the BATS station in the γn=25.8–26.3 layer. This proposed mechanism still requires a process that removes bacterial N from the γn=25.8–26.3 layer such that a rNPN anomaly is observed due to NO3 uptake in the absence of stoichiometric O2 accumulation. Diel vertically migrating grazers are a candidate mechanism whereby grazing on bacterial biomass and its eventual remineralization to NO3 is spatially separated from respiration and O2 consumption.
We can make a similar calculation for Station ALOHA using published 3H-leucine bacterial production rate measurements (Church et al., 2004). The mean bacterial C production rate at 100 m is ∼0.46 nmol C L−1 d−1. Using the same bacterial biomass C : N of 5 : 1 and integrating for 1 year over the ∼100–200 m thick layer exhibiting rNPN anomaly yields an estimated 3.4 mmol N m−2 yr−1 bacterial N demand. If we again assume that bacteria satisfy all of their N demand from nitrate uptake, this process can explain at most 0 %–7 % of the estimated rNPN anomaly formation rate at Station ALOHA in the combined γn=24.2–25.2 layer.
4.2.3 Vertically migrating phytoplankton
From our analyses of the available published data, remineralization of N-poor DOM, TEP cycling, or heterotrophic bacterial nitrate uptake cannot quantitatively explain both the seasonal rPPN anomaly formation within the euphotic zone and subsurface rNPN anomaly formation observed at the stations ALOHA and BATS, even with the generous assumptions made. We now examine the vertical migration of phytoplankton down to the nutricline as a potential biological mechanism to explain the dual rPPN and rNPN anomalies.
In the absence of other mechanisms, the potential contribution of vertically migrating phytoplankton to the rNPN and rPPN anomaly features at the two stations can be determined by subtracting the contributions of TEP cycling and bacterial nitrate uptake to rNPN and/or rPPN formation from the total observed rNPN and rPPN anomaly formation rates (presented in Table 2). By contrast, the phytoplankton vertical migration category must provide 16–21 mmol N m−2 yr−1 (or 45 %–50 %) of rNPN anomaly formation and 27–36 mmol N m−2 yr−1 (or 59 %–62 %) of rPPN anomaly formation at Station ALOHA (Table 2). At the BATS station, phytoplankton vertical migration must provide 43–78 mmol N m−2 yr−1 (or 90 %–93 %) of rNPN anomaly formation and 59–76 mmol N m−2 yr−1 (or 87 %–95 %) of rPPN anomaly formation. These are likely underestimates because the bacterial nitrate uptake and TEP contribution are maximum estimates.
As a rare, giant component of the flora, net collections, in situ observations by divers, and towed optical systems constitute the bulk of observations; hence vertical migrators are somewhat out of the mainstream of current phytoplankton observations. The unique attributes and evidence for vertical migration are briefly discussed here for background, as well as documentation of their presence in both oceans at or near the time series stations. Nitrate transport rates are then summarized for comparison to the required contribution from the residual preNO3 anomaly flux budgets.
Flagellate motility and cyanobacteria buoyancy control has been recognized for decades as a strategy to exploit spatially disjunct light and nutrient fields (Cullen, 1985; Eppley et al., 1968; Ganf and Oliver, 1982; Hasle, 1950; Steemann Nielsen, 1939) and was suggested for non-flagellated marine species of the genus Pyrocystis (Sukhanova and Rudyakov, 1973; Ballek and Swift, 1986; Rivkin et al., 1984). Rhizosolenia mats (macroscopic, multi-species (up to seven) associations of Rhizosolenia spp.; Villareal and Carpenter, 1989) have been the model for understanding this process (Villareal et al., 2014), with migration inferred for the diatoms Ethmodiscus spp. and large Rhizosolenia spp., as well as the phycomate prasinophyte Halosphaera spp. in addition to Pyrocystis. There is consistent evidence of high-δ15N composition of Rhizosolenia biomass similar to sub-nitracline N (Villareal et al., 1993, 2014), internal millimolar nitrate pools that can only be acquired by direct uptake at micromolar concentrations (Villareal and Lipschultz, 1995; Villareal et al., 1996; Woods and Villareal, 2008), buoyancy reversals linked to nutrient status (Richardson et al., 1996), nitrate reductase activity (Joseph et al., 1997) induced only when nitrate is the primary N source, ascent/descent rates of multiple meters per hour (Villareal et al., 2014; Moore and Villareal 1996), observation of Rhizosolenia mats from the surface to 305 m (Pilskaln et al., 2005), and compositional difference in floating and sinking mats that mirror physiological changes associated with nutrient depletion and carbohydrate ballasting (Villareal et al., 1996). A key attribute in all giant phytoplankton (107+ µm3) migrators is multiple-meters-per-hour ascent/descent rates that permit 50–100 m vertical excursions (Moore and Villareal, 1986). This large vacuole of these giant phytoplankton allows the necessary storage (millimolar concentrations in vacuoles that are 90+ % of total cell volume) for a multiple-day migration and division cycle. Unlike the more widely known zooplankton vertical migration, open-ocean phytoplankton migration is a multi-day cycle (Richardson et al., 1998; Villareal et al., 1996). It is asynchronous and not cued to diel rhythms as in coastal dinoflagellates or vertically migrating zooplankton.
Giant phytoplankton are found throughout the warmer oceans of the world and are specifically noted at both Station ALOHA and the BATS station (Figs. S11–S13). The required characteristics of buoyancy reversals, high-internal-nitrate pools, and rapid ascent/descent have been found in multiple taxa from the Atlantic and Pacific oceans (Villareal et al., 2014). The taxa Halosphaera (Villareal and Lipschultz, 1995), Ethmodiscus (Villareal and Lipschultz, 1995), Rhizosolenia (Villareal and Lipschultz, 1995), and Pyrocystis (Swift et al., 1973; Rivkin et al., 1984; Villareal and Lipschultz, 19965) occur in the Sargasso Sea and all exhibit positive buoyancy and have millimolar internal nitrate pools. In the Sargasso Sea, the non-motile dinoflagellate Pyrocystis has been the most extensively studied by Elijah J. Swift's lab in the 1980s. A “once in a generation” migration cycle (Sukhanova and Rudyakov, 1973) was proposed for Pyrocystis based on differences in vegetative and reproductive cell maxima (∼60 and 120 m, respectively). Vegetative stages were positively buoyant (up to 0.2 m h−1; Kahn and Swift, 1978), while reproductive stages were negatively buoyant at up to 18 m h−1 in the Mona Passage, southwest N. Atlantic (Swift et al., 1976). In the Sargasso Sea, carbon budgets (Rivkin et al., 1984) and buoyancy changes upon nutrient depletion and addition (Ballek et al., 1986) all supported a vertical migration life cycle. In single-cell analysis from field material collected off Bermuda, Pyrocystis internal nitrate concentrations ranged from 0 to 8 mM, with floating cells containing significantly higher concentrations (p=0.05) than sinking cells (Villareal and Lipschultz, 1995). Such elevated internal nitrate can only be acquired at µM nitrate concentrations found in the nutricline. Abundance maxima in the upper ∼200 m of the Sargasso Sea/southwest N. Atlantic range from 100 to 200 cells m−3, with typical values reported of 18–75 cells m−3 (Rivkin et al., 1984), 10–50 cells m−3 (Ballek and Swift, 1986) and 10–30 cells m−3 (Swift et al., 1981). While the other migrating taxa are found in the Sargasso Sea near Bermuda, there are no data on abundance in the N. Atlantic other than for Ethmodiscus. Ethmodiscus was found at every station sampled on three cruises in the southwest N. Atlantic (n=18; ∼17–25∘ N, 66–77∘ W), with abundance ranging from 0.03 to 4.7 cells m−3. Free-living chains of Rhizosolenia were routinely isolated by hand collection with scuba at Bermuda (Moore and Villareal, 1996a, b; Richardson et al., 1996) and were widely noted by Carpenter et al. (1977) in the Caribbean. Cleve (1900) reported R. castracanei (a migrating giant diatom found both free-living and in Rhizosolenia mats) to occur in the Sargasso Sea as well as the tropical Atlantic, Caribbean Sea, Florida current to the Grand Banks of Newfoundland, and the Azores.
In the Pacific, the range of Ethmodiscus, Pyrocystis, and Rhizosolenia mats includes the study site at Station ALOHA (Figs. S11–S13). Unlike the Atlantic, where mats are generally very rare (∼0.001 mats m−3; Carpenter et al., 1977), Rhizosolenia mats dominate in the Pacific. Abundance ranges up to several hundred mats per cubic meter, depending on the mat size and enumeration methods (Villareal et al., 1996, 1999, 2014). Quantitative net surveys of Ethmodiscus north of Hawaii yielded abundance ranges of <0.1 to >2 cells m−3 (Villareal et al., 2007). Both Halosphaera and Pyrocystis were present but not quantified. Further to the west, Soviet-era literature documents Pyrocystis at 10–50 cells m−3 in the upper 200 m (Sukhanova and Rudyakov, 1973; Sukahova, 1973). Free-living giant Rhizosolenia were observed by divers at all stations sampled in the N. Pacific (Tracy A. Villareal, unpublished observation) and overlapped 100 % with Rhizosolenia mats (Fig. 2 in Villareal et al., 2014); R. castracanei was reported across the Pacific Ocean (Fig. 8 in Semina and Levashova, 1977). It should be noted that net collections disrupt Rhizosolenia mats (Alldredge and Silver, 1982), and the large-diameter species such as R. castracanei in the mats will appear as free chains and cells in the literature.
For rNPN and rPPN development, the unique characteristics of vertical migration are that cells acquire and store nitrate at depth, transport it into the euphotic zone, and then reduce it internally to biomass concomitant with oxygenic photosynthesis. Nitrate transport calculations by vertical migration have a number of assumptions and caveats, including variability in abundance, particularly for Halosphaera spp. (Villareal et al., 2014). Inclusion of small-sized Rhizosolenia mats missed by divers (Villareal et al., 1999) in estimates yielded rates of 6–444 µmol N m−2 d−1 (mean SD 187 µmol N m−2 d−1) at four stations north of Station ALOHA. Assuming a 180-day production period, this converts to 1.1–80 mmol N m−2 y−1 (mean SD 34 mmol N m−2 yr−1). Using a generalized gyre abundance (Villareal et al., 2014), four other taxa yielded transport rates of 3.2 (Ethmodiscus spp.), 9.2 (free living Rhizosolenia spp.), 17.0 (Pyrocystis spp.) and 33.2 (Halosphaera spp.) µmol N m−2 d−1 for a total of 62.5 µmol N m−2 d−1 (11.2 mmol N m−2 yr−1). These taxa exhibit basin-specific abundance patterns (i.e., Rhizosolenia mats are rare in the N. Atlantic – Carpenter et al., 1977; Halosphaera viridis has an extensive subsurface presence in the deep Mediterranean in winter – Wiebe et al., 1974), but the generalized abundance and distribution data are consistent with required rNPN and rPPN rates at both the BATS station (43–78 and 59–76 µmol N m−2 d−1, respectively) and Station ALOHA (16–21 and 27–36 µmol N m−2 d−1, respectively). Rhizosolenia mats alone may be sufficient to support rNPN and rPPN rates at Station ALOHA. There are several implications of this. Lower abundance or turnover times of this flora will still have substantial effects on rNPN and rPPN. Patchiness in abundance (Villareal, 2007; Villareal et al., 2014) or concentration of buoyant particles by mesoscale fronts (Guidi, 2012) could lead to significant local perturbations on rNPN and rPPN.
Fraga (2001) developed an independent assessment of the impact of vertical migration on the NO tracer (functionally related to our residual preNO3 tracer) based on first principles of photosynthetic production and biosynthesis of biomass. For ecosystems containing both coastal dinoflagellates and oceanic diatoms, a subsurface minimum in NO and a related tracer, NCO (NO corrected for the stoichiometry of carbohydrate synthesis), formed. For migrating Rhizosolenia, the NO and NCO minimum was at ∼150 m with negative anomalies from ∼80 to ∼200 m (Fig. 6 in Fraga, 2001). The Fraga (2001) formulation also included an explicit term for release of soluble carbohydrate (functionally equivalent to TEPs). Migrating phytoplankton can clearly provide a mechanistic linkage via upward nutrient transport to the observed NO anomalies.
4.3 Contributions to carbon and phosphorus budgets
4.3.1 DIC
Vertically migrating phytoplankton can also help explain the observed summertime DIC drawdown (Gruber et al., 1998; Keeling et al., 2004) in the absence of measurable nitrate from the mixed layer at both the stations ALOHA and BATS. The concurrently operating migration cycles of different individuals would continually bring intracellular nitrate-rich migrators into the surface mixed layer, where their oxygenic photosynthesis would draw down DIC and release dissolved O2, contributing to rPPN anomaly formation within the mixed layer. High-intracellular-nitrate gradients within migrators (millimoles to nanomoles across cell membranes) can also lead to excretion of dissolved nitrate into the water column (Singler and Villareal, 2005). Thus, nitrate leakage from migrators could help explain the observation of a presumed subsurface nitrate source supporting pico-eukaryotic phytoplankton in the mixed layer, even during the stratified summer months at the BATS station (Fawcett et al., 2011). However, nitrogen derived from migrator-mediated nitrate excretion is required to sink out of the mixed layer in some form in order to contribute to summertime net DIC drawdown at these two sites. Regardless of how nitrate is acquired and internally reduced (by migrators or by release and uptake by non-migrating phytoplankton), it will contribute to the observed rPPN.
We can compare our estimated rates of rPPN formation within the euphotic zone with the summertime mixed-layer DIC drawdown at each time series site using assumptions on the appropriate stoichiometry of production. Although seasonal rPPN formation exhibits the largest increase in preNO3 concentrations at ∼50–100 m depth, seasonal accumulation of residual positive preNO3 is observed within the mixed layer (∼0–30 m) at both sites (Figs. 1, 2).
At Station ALOHA, net community production during the 6-month summer-to-fall period represents ∼40 % of the 2.3 mol C m−2 yr−1 ANCP (Keeling et al., 2004), yielding a summertime mixed-layer DIC drawdown of ∼920 mmol C m−2. Our estimated rate of euphotic-zone rPPN formation during this same seasonal period is 33–81 mmol N m−2 (Table 1). The summertime DIC drawdown can be converted to residual preNO3 nitrogen equivalents using the literature range in O2:C stoichiometries of production of 1.0–1.6 (Paulmier et al., 2009) and the DOM- and POM-weighted O2:N stoichiometries of production (using the values in Table 1), yielding values of 7.8–14.3 for the C:N of summertime new production at Station ALOHA. Summertime DIC drawdown converted to preNO3 equivalents is 64–118 mmol N m−2. Thus, our estimated rPPN formation within the euphotic zone can potentially explain 28 % to >100 % of the mixed-layer DIC drawdown at Station ALOHA.
The estimated rate of euphotic-zone rPPN formation during summer to fall at the BATS station is 50–96 mmol N m−2 (Table 1). Net community production during this seasonal period is ∼45 % of the 2.3 mol C m−2 yr−1 ANCP (Gruber et al., 1998), yielding a summertime mixed-layer DIC drawdown of ∼1035 mmol C m−2. Conversion of the summertime DIC drawdown to preNO3 nitrogen equivalents following a similar approach to our calculation at Station ALOHA uses a DOM- and POM-weighted C:N of 7.9–14.8 for summertime new production at the BATS station, yielding 70–131 mmol N m−2. Thus, our estimated rPPN formation within the euphotic zone can potentially explain 38 % to >100 % of the mixed-layer DIC drawdown at the BATS station.
4.3.2 prePO4
We also investigated for the presence of subsurface residual negative prePO4 anomalies at the stations ALOHA and BATS. Station ALOHA does not exhibit a subsurface residual negative prePO4 anomaly (Fig. 3), with the exception of a small anomaly present in the years 2002–2004. There do exist a subsurface residual negative prePO4 anomaly and euphotic-zone residual positive prePO4 anomaly at the BATS station (Fig. 4), present throughout the time series and monthly averaged climatology, which are coincident in both seasonal timing and depth/density layer location as the rNPN and rPPN anomalies (Fig. 2). Carbon-to-phosphorus ratios exhibit their global maxima in the subtropical North Atlantic for phytoplankton biomass (Martiny et al., 2013), dissolved organic matter (Letscher and Moore, 2015), and exported organic matter (Teng et al., 2014). The hypothesized phosphorus limitation of this basin (Ammerman et al., 2003; Moore et al., 2004) may explain the contrasting observations of the presence of a residual negative prePO4 anomaly at the BATS station in the North Atlantic but not at Station ALOHA in the North Pacific. Because of the many observations of elevated C:P across organic matter pools in the North Atlantic, we tested for the theoretical value of R, the stoichiometric ratio of O2 consumed to phosphate released during the remineralization of organic matter, needed to eliminate the subsurface residual negative prePO4 anomaly at the BATS station. This theoretical value of R was found to be (Fig. S10), which is higher than the inferred R for the North Atlantic from an inversion of subsurface O2 and phosphate data (DeVries and Deutsch, 2014).
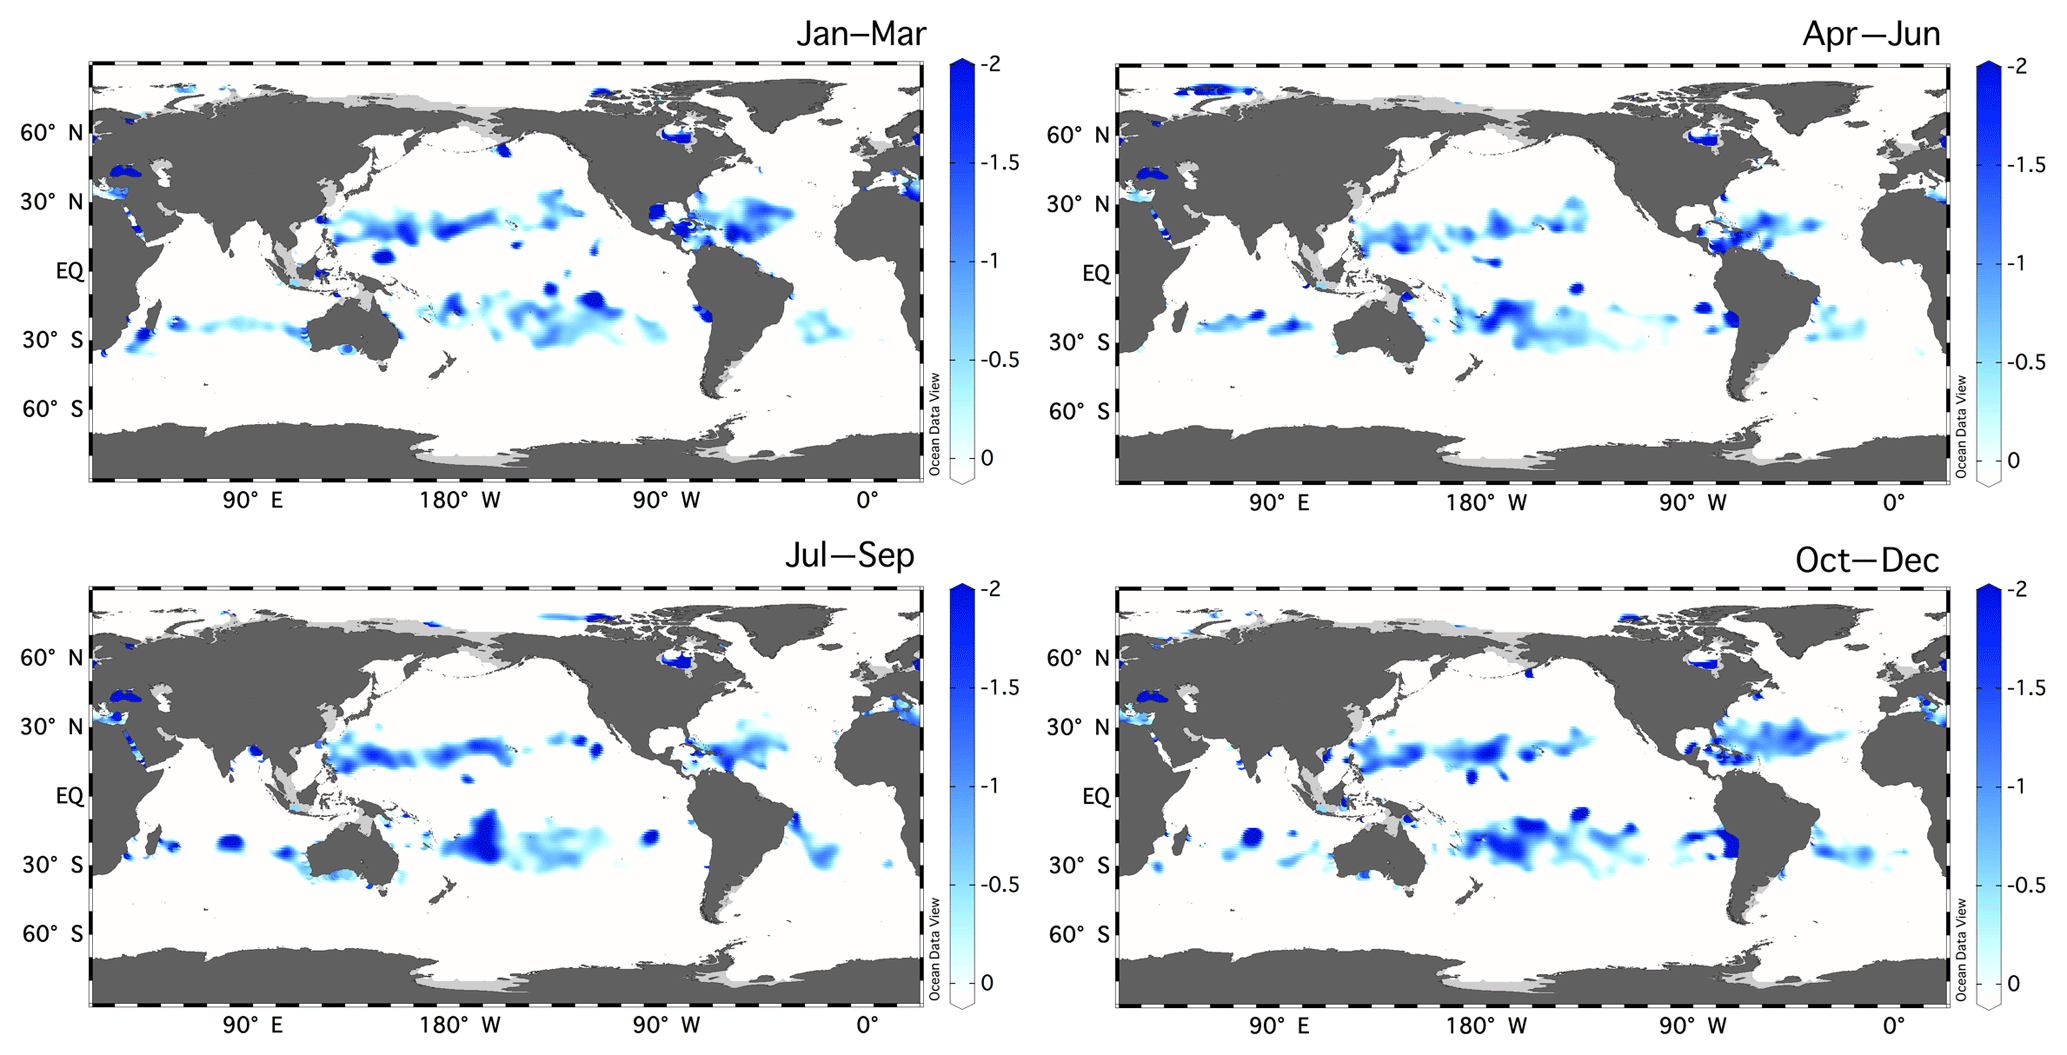
Figure 5Seasonal climatology of the residual preNO3 tracer [µM] at 150 m depth from the World Ocean Atlas (2013) 1∘ climatologies of O2 anomaly and nitrate. Residual preNO3 is calculated using values of fDOM=0.5, rDOM=20.0, and rPOM=8.75.
We hypothesize that P-limited or P-stressed vertically migrating phytoplankton also take up phosphate at the nutricline in combination with nitrate to contribute to both the observed rNPN and rPPN and the subsurface residual negative prePO4 anomaly present at the BATS station. Limited sampling in the waters between Hawaii and California indicated N:P ratios were not significantly different between sinking and ascending Rhizosolenia mats (–30) while C:P ratios were significantly different (p=0.05; C:P sinkers ; C:P ascending ). This is consistent with simultaneous uptake of N and P at depth but carbon consumption at depth relative to the surface. Further data on phosphate composition of vertically migrating phytoplankton are needed to confirm our hypothesis.
Subsurface residual preNO3 anomalies cover a large portion of the subtropical ocean (Fig. 5). Our analyses have confirmed and emphasized that the Abell et al. (2005) use of non-Redfield DOM stoichiometry in the calculation of preNO3 is required, and an explicit derivation of rDOM is needed. The residual preNO3 calculation revealed a subsurface rNPN anomaly that is not accounted for by organic material remineralization. Our consideration of three possible contributing biological mechanisms suggests that the dominant role (in decreasing order of importance) is played by vertically migrating giant phytoplankton, vertically separated TEP formation and remineralization, and bacterial utilization of nitrate (Table 2). Basin-specific differences in the budgets are evident, with TEPs appearing to be more important at Station ALOHA than at BATS. The analyses also revealed a near-surface rPPN anomaly that is approximately balanced and concurrent with the rNPN anomaly. This feature is coherent with the subsurface oxygen maximum (SOM), and we interpret this as evidence that the “missing” nitrate from the rNPN anomaly is mechanistically linked to the SOM. The seasonal euphotic-zone rPPN anomaly can also explain a significant fraction of the unexplained summertime drawdown of DIC from the mixed layer at both sites. Whether this phenomenon is predominately carried out by TEP production and export, vertically migrating phytoplankton, or a combination of both awaits more detailed and direct field observations. More observations of upper-ocean (surface to ∼200 m) abundance estimates of the vertically migrating phytoplankton taxa, their intracellular nitrate and phosphate contents, and their migration timescales are needed to confirm the hypothesis by multiple authors (e.g., Cullen, 1985; Richardson et al., 1998; Fraga, 2001; Villareal et al., 2014) of this flora's important role in nutrient transport and rNPN and rPPN anomaly formation at the time series stations (this study). Given the circumglobal warm-water range of this oligotrophic flora (Figs. S11–S13), it is reasonable to expect upward nutrient transport throughout the subtropical gyres. Nitrogen fixation may locally play a role in modifying rPPN, although the budgets of Johnson et al. (2010) suggested additional nitrate-based production was required. TEPs may contribute as well, depending on the stoichiometry of production/remineralization and shifts in buoyancy characteristics. More information on the mass quantities of the positively and negatively buoyant TEPs within the euphotic zone and its C:N content is needed to better constrain the role of this mechanism in rPPN and rNPN anomaly formation in the subtropics. In addition, Rhizosolenia mats are embedded in a TEP matrix (Pilskaln et al., 2005), so it is likely that all three biological mechanisms we investigated are non-mutually exclusive with vertically migrating phytoplankton contributing to TEP production/export, nitrate transport across the nitracline into the euphotic zone, and bacterial nitrate uptake to remineralize N-deficient TEPs. While phytoplankton TEP production appears to be favored in the upper water column, positively buoyant TEP production/formation in the nutricline could also serve to provide a means for transporting entrained particulates upward into the euphotic zone. Both migration and TEPs are difficult to measure, and the challenge will be to develop methods and time series to record these biologically driven processes at the requisite temporal and spatial scales.
The data have been deposited with PANGEA and can be accessed at https://doi.pangaea.de/10.1594/PANGAEA.895472 (last access: 1 November 2018) (Letscher and Villareal, 2018).
The supplement related to this article is available online at: https://doi.org/10.5194/bg-15-6461-2018-supplement.
RTL and TAV jointly conceived the study, performed the formal analysis, created visualizations, and wrote and edited the article. RTL created the methodology with input from TAV. RTL curated the datasets of residual preformed nitrate concentrations.
The authors declare that they have no conflict of interest.
Robert T. Letscher thanks the efforts of the scientists, crew, and staff that
have supported the Hawaiian Ocean Time Series and Bermuda Atlantic Time-series Study for nearly 30 years, including the continuing financial support of
the National Science Foundation Biological and Chemical Oceanography
programs. Tracy A. Villareal acknowledges support from NSF OCE 1537546 and
wishes to thank all the students, graduate and undergraduate, that provided
the diving support essential to this work as well as the officers and crew of
the research vessels involved in this work.
Edited by: Manmohan Sarin
Reviewed by: four anonymous referees
Abell, J., Emerson, S., and Renaud, P.: Distributions of TOP, TON and TOC in the North Pacific subtropical gyre: Implications for nutrient supply in the surface ocean and remineralization in the upper thermocline, J. Marine Research, 58, 203–222, 2000.
Abell, J., Emerson, S., and Keil, R. G.: Using preformed nitrate to infer decadal changes in DOM remineralization in the subtropical North Pacific, Global Biogeochem. Cy., 19, GB1008, https://doi.org/10.1029/2004GB002285, 2005.
Ascani, F., Richards, K. J., Firing, E., Grant, S., Johnson, K. S., Jia, Y., Lukas, R., and Karl, D. M.: Physical and biological controls of nitrate concentrations in the upper subtropical North Pacific Ocean, Deep-Sea Res. Pt. II, 93, 119–134, 2013.
Alldredge, A. L. and Silver, M. W.: Abundance and production rates of floating diatom mats (Rhizosolenia castracanei and Rhizosolenia imbricata var. shrubsolei) in the eastern Pacific Ocean, Mar. Biol., 66, 83–88, 1982.
Alldredge, A. L., Passow, U., and Logan, B. E.: The abundance and significance of a class of large, transparent organic particles in the ocean, Deep-Sea Res. Pt. I, 40, 1131–1140, 1993.
Ammerman, J. W., Hood, R. R., Case, D. A., and Cotner, J. B.: Phosphorus deficiency in the Atlantic: An emerging paradigm in oceanography, Eos T. Am. Geophys. Un., 84, 165–170, 2003.
Anderson, L. A.: On the hydrogen and oxygen content of marine phytoplankton, Deep-Sea Res. Pt. 1, 42, 1675–1680, 1995.
Anderson, L. A. and Sarmiento, J. L.: Redfield ratios of remineralization determined by nutrient data analysis, Global Biogeochem. Cy., 8, 65–80, 1994.
Azetsu-Scott, K. and Passow, U.: Ascending marine particles: Significance of transparent exopolymer particles (TEP) in the upper ocean, Limnol. Oceanogr., 49, 741–748, 2004.
Ballek, R. W. and Swift, E.: Nutrient-and light-mediated buoyancy control of the oceanic non-motile dinoflagellate Pyrocystis noctiluca Murray ex Haeckel (1890), J. Exp. Mar. Biol. Ecol., 101, 175–192, 1986.
Bauerfeind, E.: Primary production and phytoplankton biomass in the equatorial region of the Atlantic at 22∘ west, Oceanological Acta, Proceedings of the International Symposium on Equatorial Vertical Motion, 131–136, 1987.
Belyayeva, T. V.: Range and numbers of diatoms in the genus Ethmodiscus Castr. in the Pacific plankton and sediments, Oceanology, Academy of Science, USSR, Eos T. Am. Geophys. Un., 8, 79–85, 1968.
Belyayeva, T. V.: Abundance of Ethmodiscus in Pacific plankton, Oceanology, Academy of Science, USSR, Eos T. Am. Geophys. Un., 10, 672–675, 1970.
Booth, B. C.: Vernal phytoplankton community in the eastern subarctic Pacific: Predominant species, Proceedings of the Sixth International Diatom Symposium, edited by: Ross, R., Otto Koeltz, Koenigstein, Germany, 339–358, 1980.
Broecker, W. S.: “NO” A conservative water-mass tracer, Earth Planet. Sc. Lett., 23, 100–107, 1974.
Carlson, C. A., Ducklow, H. W., and Sleeter, T. D.: Stocks and dynamics of bacterioplankton in the northwestern Sargasso Sea, Deep-Sea Res. Pt. II, 43, 491–515, 1996.
Caron, D. A., Lim, E. L., Sanders, R. W., Dennett, M. R., and Berninger, U. G.: Responses of bacterioplankton and phytoplankton to organic carbon and inorganic nutrient addition in two oceanic ecosystems, Aquat. Microb. Ecol., 22, 175–184, 2000.
Carpenter, E. J., Harbison, R. G., Madin, L. P., Swanberg, N. R., Biggs, D. C., Hulburt, E. M., McAlister, V. L., and McCarthy, J. J.: Rhizosolenia Mats, Limnol. Oceanogr., 22, 739–741, 1977.
Church, M. J., Ducklow, H. W., and Karl, D. M.: Light dependence of [3H] leucine incorporation in the oligotrophic North Pacific Ocean, Appl. Environ. Microbiol., 70, 4079–4087, 2004.
Cisternas-Novoa, C., Lee, C., and Engel, A.: Transparent exopolymer particles (TEP) and Coomassie stainable particles (CSP): Differences between their origin and vertical distributions in the ocean, Mar. Chem., 175, 56–71, 2015.
Cleve, P.: Seasonal distribution of Atlantic plankton organisms, D. R. Bonniers, Göteborg, 368 pp., 1900.
Cotner, J. B., Ammerman, J. W., Peele, E. R., and Bentzen, E.: Phosphorus-limited bacterioplankton growth in the Sargasso Sea, Aquat. Microb. Ecol., 13, 141–149, 1997.
Cowen, J. P. and Holloway, C. F.: Structural and chemical analysis of marine aggregates: in-situ macrophotography and laser confocal and electron microscopy, Mar. Biol., 126, 163–174, 1996.
Cullen, J. J.: Diel vertical migration by dinoflagellates: roles of carbohydrate metabolism and behavioral flexibility, in: Migration: mechanisms and adaptive significance, edited by: Rankin, M. A., Marine Science Institute, Port Aransas, 135–152, 1985.
Darwin, C.: The Voyage of the Beagle, Natural History Library edition (1962), edited by: Engle, L., Doubleday, New York, 524 pp., 1860.
DeVries, T. and Deutsch, C.: Large-scale variations in the stoichiometry of marine organic matter respiration, Nat. Geosci., 7, 890–894, 2014.
Doney, S. C. and Bullister, J. L.: A chlorofluorocarbon section in the eastern North Atlantic, Deep-Sea Res. Pt. I, 39, 1857–1883, 1992.
Emerson, S.: Annual net community production and the biological carbon flux in the ocean, Global Biogeochem. Cy., 28, 14–28, 2014.
Emerson, S., Quay, P., Karl, D., Winn, C., Tupas, L., and Landry, M.: Experimental determination of the organic carbon flux from open-ocean surface waters, Nature, 389, 951–954, 1997.
Engel, A.: Distribution of transparent exopolymer particles (TEP) in the northeast Atlantic Ocean and their potential significance for aggregation processes, Deep-Sea Res. Pt. I, 51, 83–92, 2004.
Eppley, R. W., Holm-Hansen, O., and Strickland, J. D. H.: Some observations on the vertical migration of dinoflagellates, J. Phycol., 4, 333–340, 1968.
Fawcett, S. E., Lomas, M. W., Casey, J. R., Ward, B. B., and Sigman, D. M.: Assimilation of upwelled nitrate by small eukaryotes in the Sargasso Sea, Nat. Geosci., 4, 717–722, 2011.
Fraga, F.: Phytoplanktonic biomass synthesis: application to deviations from Redfield stoichiometry, Sci. Mar., 65, 153–169, 2001.
Fraga, F., Pérez, F. F., Figueiras, F. G., and Rios, A. F.: Stoichiometric variations of N, P, C and O2 during a Gymnodinium catenatum red tide and their interpretation, Mar. Ecol. Prog. Ser., 87, 123–134, 1992.
Fraga, F., Rios, A. F., Pérez, F. F., Estrada, M., and Marrase, C.: Effect of upwelling pulses on excess carbohydrate synthesis as deduced from nutrient, carbon dioxide, and oxygen profiles, Mar. Ecol. Prog. Ser., 189, 65–75, 1999.
Ganf, G. G. and Oliver, R. L.: Vertical separation of light and available nutrients as a factor causing replacement of green algae by blue-green algae in the plankton of a stratified lake, J. Ecol., 829–844, 1982.
Garcia, H. E., Locarnini, R. A., Boyer, T. P., Antonov, J. I., Baranova, O. K., Zweng, M. M., Reagan, J. R., and Johnson, D. R.: World Ocean Atlas 2013, in: Dissolved Oxygen, Apparent Oxygen Utilization, and Oxygen Saturation, vol. 3, edited by: Levitus, S. and Mishonov, A.. NOAA Atlas NESDIS 75, 27 pp., 2014a.
Garcia, H. E., Locarnini, R. A., Boyer, T. P., Antonov, J. I., Baranova, O. K., Zweng, M. M., Reagan, J. R., and Johnson, D. R.: World Ocean Atlas 2013, in: Dissolved Inorganic Nutrients (phosphate, nitrate, silicate), vol. 4, edited by: Levitus, S. and Mishonov, A., NOAA Atlas NESDIS 76, 25 pp., 2014b.
Goncalves da Silva, M. G.: Diatom (Bacillariophyceae) distribution in the continental shelf of Pernambuco (Brazil), Trab. Oceanogr. Univ. Fed. Pernambuco., 17, 7–46, 1982 (in Spanish).
Gruber, N., Keeling, C. D., and Stocker, T. F.: Carbon-13 constraints on the seasonal inorganic carbon budget at the BATS site in the northwestern Sargasso Sea, Deep-Sea Res. Pt. I, 45, 673–717, 1998.
Gruber, N., Keeling, C. D., and Bates, N. R.: Interannual variability in the North Atlantic Ocean carbon sink, Science, 298, 2374–2378, 2002.
Guidi, L., Calil, P. H. R., Duhamel, S., Bjoerkman, K. M., Doney, S. C., Jackson, G. A., Li, B., Church, M. J., Tozzi, S., Kolber, Z. S., Richards, K. J., Fong, A. A., Letelier, R. M., Gorsky, G., Stemmann, L., and Karl, D. M.: Does eddy-eddy interaction control surface phytoplankton distribution and carbon export in the North Pacific Subtropical Gyre?, J. Geophys. Res.-Biogeosci., 117, G02024, https://doi.org/10.1029/2012jg001984, 2012.
Gundersen, K., Heldal, M., Norland, S., Purdie, D. A., and Knap, A. H.: Elemental C, N, and P cell content of individual bacteria collected at the Bermuda Atlantic Time-series Study (BATS) site, Limnol. Oceanogr., 47, 1525–1530, 2002.
Hamanaka, J., Tanoue, E., Hama, T., and Handa, N.: Production and export of particulate fatty acids, carbohydrates and combined amino acids in the euphotic zone, Mar. Chem., 77, 55–69, 2002.
Hansell, D. A. and Carlson, C. A.: Biogeochemistry of total organic carbon and nitrogen in the Sargasso Sea: control by convective overturn, Deep-Sea Res. Pt. II, 48, 1649–1667, 2001.
Hasle, G. R.: Phototactic vertical migration in marine dinoflagellates, Oikos, 2, 162–175, 1950.
Jenkins, W. J. and Doney, S. C.: The subtropical nutrient spiral, Global Biogeochem. Cy., 17, 1110, https://doi.org/10.1029/2003GB002085, 2003.
Jenkins, W. J. and Goldman, J. C.: Seasonal oxygen cycling and primary production in the Sargasso Sea, J. Mar. Res., 43, 465–491, 1985.
Johnson, K. S., Riser, S. C., and Karl, D. M.: Nitrate supply from deep to near-surface waters of the North Pacific subtropical gyre, Nature, 465, 1062–1065, 2010.
Joseph, L., Villareal, T. A., and Lipschultz, F.: A high sensitivity nitrate reductase assay and its application to vertically migrating Rhizosolenia mats, Aquat. Microb. Ecol., 12, 95–104, 1997.
Kahn, H. and Swift, E.: Positive buoyancy through ionic control in the nonmotile marine dinoflagellate Pyrocystis noctiluca Murray ex Schuett, Limnol. Oceanogr., 23, 649–658, 1978.
Keeling, C. D., Brix, H., and Gruber, N.: Seasonal and long-term dynamics of the upper ocean carbon cycle at Station ALOHA near Hawaii, Global Biogeochem. Cy., 18, GB4006, https://doi.org/10.1029/2004GB002227, 2004.
Kirchman, D. L.: The uptake of inorganic nutrients by heterotrophic bacteria, Microb. Ecol., 28, 255–271, 1994.
Letscher, R. T. and Moore, J. K.: Preferential remineralization of dissolved organic phosphorus and non-Redfield DOM dynamics in the global ocean: Impacts on marine productivity, nitrogen fixation, and carbon export, Global Biogeochem. Cy., 29, 325–340, 2015.
Letscher, R. T. and Villareal, T. A: Residual preformed nitrate and phosphate at Station ALOHA and BATS, PANGAEA, https://doi.pangaea.de/10.1594/PANGAEA.895472, 2018.
Letscher, R. T., Knapp, A. N., James, A. K., Carlson, C. A., Santoro, A. E., and Hansell, D. A.: Microbial community composition and nitrogen availability influence DOC remineralization in the South Pacific Gyre, Mar. Chem., 177, 325–334, 2015.
Letscher, R. T., Primeau, F., and Moore, J. K.: Nutrient budgets in the subtropical ocean gyres dominated by lateral transport, Nat. Geosci., 9, 815–819, 2016.
Long, R. A. and Azam, F.: Abundant protein-containing particles in the sea, Aquat. Microb. Ecol., 10, 213–221, 1996.
Mari, X., Passow, U., Migon, C., Burd, A. B., and Legendre, L.: Transparent exopolymer particles: Effects on carbon cycling in the ocean, Progr. Oceanogr., 151, 13–37, 2017.
Martin, J. H., Knauer, G. A., Karl, D. M., and Broenkow, W. W.: VERTEX: carbon cycling in the northeast Pacific, Deep-Sea Res. Pt. A, 34, 267–285, 1987.
Martinez, L. A.: Nitrogen fixation by floating diatom mats: a source of new nitrogen to oligotrophic ocean waters, Biology, University of California, Santa Cruz, 23 pp., 1982.
Martiny, A. C., Pham, C. T., Primeau, F. W., Vrugt, J. A., Moore, J. K., Levin, S. A., and Lomas, M. W.: Strong latitudinal patterns in the elemental ratios of marine plankton and organic matter, Nat. Geosci., 6, 279–283, 2013.
Michaels, A. F., Bates, N. R., Buesseler, K. O., Carlson, C. A., and Knap, A. H.: Carbon-cycle imbalances in the Sargasso Sea, Nature, 372, 537–540, 1994.
Mikkelsen, N.: On the origin of Ethmodiscus ooze, Mar. Micropaleontol., 2, 35–46, 10.1016/0377-8398(77)90004-4, 1977.
Moore, J. K. and Villareal, T. A.: Size-ascent rate relationships in positively buoyant marine diatoms, Limnol. Oceanogr., 41, 1514–1520, 1996.
Moore, J. K., Doney, S. C., and Lindsay, K.: Upper ocean ecosystem dynamics and iron cycling in a global three-dimensional model, Global Biogeochem. Cy., 18, GB4028, https://doi.org/10.1029/2004GB002220 , 2004.
Navarro, G. and Ruiz, J.: Hysteresis conditions the vertical position of deep chlorophyll maximum in the temperate ocean, Global Biogeochem. Cy., 27, 1013–1022, 2013.
Olsen, A., Key, R. M., van Heuven, S., Lauvset, S. K., Velo, A., Lin, X., Schirnick, C., Kozyr, A., Tanhua, T., Hoppema, M., Jutterström, S., Steinfeldt, R., Jeansson, E., Ishii, M., Pérez, F. F., and Suzuki, T.: The Global Ocean Data Analysis Project version 2 (GLODAPv2) – an internally consistent data product for the world ocean, Earth Syst. Sci. Data, 8, 297–323, https://doi.org/10.5194/essd-8-297-2016, 2016.
Paulmier, A., Kriest, I., and Oschlies, A.: Stoichiometries of remineralisation and denitrification in global biogeochemical ocean models, Biogeosciences, 6, 923–935, https://doi.org/10.5194/bg-6-923-2009, 2009.
Pilskaln, C. H., Villareal, T. A., Dennett, M., Darkangelo-Wood, C., and Meadows, G.: High concentrations of marine snow and diatom algal mats in the North Pacific Subtropical Gyre: Implications for carbon and nitrogen cycles in the oligotrophic ocean, Deep-Sea Res. Pt. I, 52, 2315–2332, 2005.
Platt, T., Harrison, W. G., Lewis, M. R., Li, W. K., Sathyendranath, S., Smith, R. E., and Vezina, A. F.: Biological production of the oceans: the case for a consensus, Marine Ecology Progress Series, 77–88, 1989.
Ricard, M.: Observations sur les diatomées marines du genre Ethmodiscus Castr., Rev. Algol. N.S.O, 10, 56–73, 1970.
Richardson, T. L., Ciotti, A. M., Cullen, J. J., and Villareal, T. A.: Physiological and optical properties of Rhizosolenia formosa (Bacillariophyceae) in the context of open-ocean vertical migration, J. Phycol., 32, 741–757, 1996.
Richardson, T. L., Cullen, J. J., Kelley, D. E., and Lewis, M. R.: Potential contributions of vertically migrating Rhizosolenia to nutrient cycling and new production in the open ocean, J. Plankton Re., 20, 219–241, 1998.
Ricker, W. E.: Linear regressions in fishery research, J. Fish Res. Board Can., 30, 409–434, 1973.
Rivkin, R. B. and Anderson, M. R.: Inorganic nutrient limitation of oceanic bacterioplankton, Limnol. Oceanogr., 42, 730–740, 1997.
Rivkin, R. B., Swift, E., Biggley, W. H., and Voytek, M. A.: Growth and carbon uptake by natural populations of oceanic dinoflagellates Pyrocystis noctiluca and Pyrocystis fusiformis, Deep-Sea Res. Pt. A, 31, 353–367, 1984.
Semina, H. J. and Levashova, S. S.: The biogeography of tropical phytoplankton species in the Pacific Ocean, Int. Rev. Gesamten Hydrobiol., 78, 243–262, 1993.
Semina, H. J., Belyayeva, T. V., Zernova, V. V., MovChan, O. A., Sanina, L. V., Sukhanova, I. N., and Tarkhova, I. A.: Distribution of indicator species of planktonic algae in the World Ocean, Oceanology, 17, 573–579, 1977.
Shipe, R. F., Brzezinski, M. A., Pilskaln, C., and Villareal, T. A.: Rhizosolenia mats: An overlooked source of silica production in the open sea, Limnol. Oceanogr., 44, 1282–1292, 1999.
Shulenberger, E. and Reid, J. L.: The Pacific shallow oxygen maximum, deep chlorophyll maximum, and primary productivity, reconsidered, Deep-Sea Res. Pt. A, 28, 901–919, 1981.
Singler, H. R. and Villareal, T. A.: Nitrogen inputs into the euphotic zone by vertically migrating Rhizosolenia mats, J. Plankton Re., 27, 545–556, 2005.
Steemann Nielsen, E.: Über die vertikale Verbreitung der Phytoplanktonten im Meere, Internationale Revue der gesamten Hydrobiologie und Hydrographie, 38, 421–440, https://doi.org/10.1002/iroh.19390380124, 1939.
Sukhanova, I. N.: Vertical distribution of some peridinians in the equatorial Pacific Ocean, in: Life activities of pelagic communities in the ocean, edited by: Vinogradov, M. E., Israeli Program Scientific Translation, Jerusalem, 210–217, 1973.
Sukhanova, I. N. and Rudyakov, Y. A.: Population composition and vertical distribution of Pyrocystis pseudonoctiluca (W. Thomson) in the western equatorial Pacific, in: Life activities of pelagic communities in the ocean, edited by: Vinogradov, M. E., Israeli Program Scientific Translation, Jerusalem, 218–228, 1973.
Swift, E.: The marine diatom Ethmodiscus rex: its morphology and occurrence in the plankton of the Sargasso Sea, J. Phycol., 2, 456–460, 1973.
Swift, E., Biggley, W. H., and Seliger, H. H.: Species of oceanic dinoflagellates in genera Dissodinium and Pyrocystis: Interclonal and interspecific comparisons of coloar and photon yield of bioluminscence, J. Phycol., 9, 420–426, https://doi.org/10.1111/j.0022-3646.1973.00420.x, 1973.
Swift, E., Stuart, M., and Meunier, V.: The in situ growth rates of some deep-living oceanic dinoflagellates: Pyrocystis fusiformis and Pyrocystis noctiluca, Limnol. Oceanogr., 21, 418–426, 1976.
Swift, E., Meunier, V. A., Biggley, W. H., Hoarau, J., and Barras, H.: Factors affecting bioluminescence capacity in oceanic dinoflagellates, in: Bioluminescence: current perspectives, edited by: Nealson, K. H., Burgess Publishing Co., Minneapolis, 95–106, 1981.
Takahashi, T., Broecker, W. S., and Langer, S.: Redfield ratio based on chemical data from isopycnal surfaces, J. Geophys. Res.-Oceans, 90, 6907–6924, 1985.
Teng, Y. C., Primeau, F. W., Moore, J. K., Lomas, M. W., and Martiny, A. C.: Global-scale variations of the ratios of carbon to phosphorus in exported marine organic matter, Nat. Geosci., 7, 895–898, 2014.
Toggweiler, J. R.: Carbon overconsumption, Nature, 363, 210–211, 1993.
Toggweiler, J. R.: Vanishing in Bermuda, Nature, 372, 505–506, 1994.
Trujillo-Ortiz, A. and Hernandez-Walls, R.: gmregress: Geometric Mean Regression (Reduced Major Axis Regression), A MATLAB file, available at: http://www.mathworks.com/matlabcentral/fileexchange/27918-gmregress (last access: 12 December 2017), 2010.
Venrick, E. L.: The distribution and ecology of oceanic diatoms in the North Pacific, PhD, University of California, San Diego, 684 pp., 1969.
Villareal, T. A.: Abundance of the giant diatom Ethmodiscus in the southwest Atlantic Ocean and central Pacific gyre, Diatom Research, 8, 171–177, 1993.
Villareal, T. A.: Single-cell pulse amplitude modulation fluorescence measurements of the giant diatom Ethmodiscus (Bacillariophyceae), J. Phycol., 40, 1052–1061, https://doi.org/10.1111/j.1529-8817.2004.03208.x, 2004.
Villareal, T. A. and Carpenter, E. J.: Nitrogen-fixation, suspension characteristics and chemical composition of Rhizosolenia mats in the central North Pacific Gyre, Biol. Oceanogr., 6, 327–345, 1989.
Villareal, T. A. and Carpenter, E. J.: Chemical composition and photosynthetic characteristics of Ethmodiscus rex (Bacillariophyceae): Evidence for vertical migration, J. Phycol., 30, 1–8, 1994.
Villareal, T. A. and Lipschultz, F.: Internal nitrate concentrations in single cells of large phytoplankton from the Sargasso Sea, J. Phycol., 31, 689–696, 1995.
Villareal, T. A., Altabet, M. A., and Culver-Rymsza, K.: Nitrogen transport by vertically migrating diatom mats in the North Pacific Ocean, Nature, 363, 709–712, 1993.
Villareal, T. A., Woods, S., Moore, J. K., and Culver-Rymsza, K.: Vertical migration of Rhizosolenia mats and their significance to NO fluxes in the central North Pacific gyre, J. Plankton Re., 18, 1103–1121, 1996.
Villareal, T. A., Joseph, L., Brzezinski, M. A., Shipe, R. F., Lipschultz, F., and Altabet, M. A.: Biological and chemical characteristics of the giant diatom Ethmodiscus (Bacillariophyceae) in the central North Pacific gyre, J. Phycol., 35, 896–902, 1999a.
Villareal, T. A., Pilskaln, C., Brzezinski, M., Lipschultz, F., Dennett, M., and Gardner, G. B.: Upward transport of oceanic nitrate by migrating diatom mats, Nature, 397, 423–425, 1999b.
Villareal, T. A., McKay, R. M. L., Al-Rshaidat, M. M. D., Boyanapalli, R., and Sherrell, R. M.: Compositional and fluorescence characteristics of the giant diatom Ethmodiscus along a 3000 km transect (28∘ N) in the central North Pacific gyre, Deep-Sea Res. Pt. I, 54 1273–1288, 2007.
Villareal, T. A., Pilskaln, C. H., Montoya, J. P., and Dennett, M.: Upward nitrate transport by phytoplankton in oceanic waters: balancing nutrient budgets in oligotrophic seas, PeerJ, 2, e302, https://doi.org/10.7717/peerj.302, 2014.
Walker, S. J., Weiss, R. F., and Salameh, P. K.: Reconstructed histories of the annual mean atmospheric mole fractions for the halocarbons CFC-11, CFC-12, CFC-113, and carbon tetrachloride, J. Geophys. Res.-Oceans, 105, 14285–14296, 2000.
Wallich, G. C.: On microscopic objects collected in India, T. Microscop. Soc. London, 6, 81–87, 1858.
Warner, M. J. and Weiss, R. F.: Solubilities of chlorofluorocarbons 11 and 12 in water and seawater, Deep-Sea Res. Pt. A, 32, 1485–1497, 1985.
Wiebe, P. H., Remsen, C. C., and Vaccaro, R. F.: Halosphaera viridis in the Mediterranean Sea: size range, vertical distribution, and potential energy source for deep-sea benthos, in: Deep Sea Research and Oceanographic Abstracts, Elsevier, 21, 657–667, 1974.
Williams, P. J. L. B., Quay, P. D., Westberry, T. K., and Behrenfeld, M. J.: The oligotrophic ocean is autotrophic, Annu. Rev. Mar. Sci., 5, 535–549, 2013.
Woods, S. and Villareal, T. A.: Intracellular ion concentrations and cell sap density in positively buoyant oceanic phytoplankton, Nova Hedwigia Beihefte, 133, 131–145, 2008.
Wurl, O., Miller, L., Röttgers, R., and Vagle, S.: The distribution and fate of surface-active substances in the sea-surface microlayer and water column, Mar. Chem., 115, 1–9, 2009.
Wurl, O., Miller, L., and Vagle, S.: Production and fate of transparent exopolymer particles in the ocean, J. Geophys. Res.-Oceans, 116, C00H13, https://doi.org/10.1029/2011JC007342, 2011.
Zweifel, U. L., Norrman, B., and Hagstrom, A.: Consumption of dissolved organic carbon by marine bacteria and demand for inorganic nutrients, Mar. Ecol. Prog. Ser., 101, 23–32, 1993.