the Creative Commons Attribution 4.0 License.
the Creative Commons Attribution 4.0 License.
 | 01 Nov 2018
High variability of particulate organic carbon export along the North Atlantic GEOTRACES section GA01 as deduced from 234Th fluxes
Nolwenn Lemaitre
Frédéric Planchon
Hélène Planquette
Frank Dehairs
Debany Fonseca-Batista
Arnout Roukaerts
Florian Deman
Clarisse Mariez
Géraldine Sarthou
In this study we report particulate organic carbon (POC) export fluxes for different biogeochemical basins in the North Atlantic as part of the GEOTRACES GA01 expedition (GEOVIDE, May–June 2014). Surface POC export fluxes were deduced by combining export fluxes of total Thorium-234 (234Th) with the ratio of POC to 234Th of sinking particles at the depth of export. Particles were collected in two size classes (>53 and 1–53 µm) using in situ pumps and the large size fraction was considered representative of sinking material. Surface POC export fluxes revealed latitudinal variations between provinces, ranging from 1.4 mmol m−2 d−1 in the Irminger basin, where the bloom was close to its maximum, to 12 mmol m−2 d−1 near the Iberian Margin, where the bloom had already declined. In addition to the state of progress of the bloom, variations of the POC export fluxes were also related to the phytoplankton size and community structure. In line with previous studies, the presence of coccolithophorids and diatoms appeared to enhance the POC export flux, while the dominance of picophytoplankton cells, such as cyanobacteria, resulted in lower fluxes. The ratio of POC export to primary production (PP) strongly varied regionally and was generally low (≤14 %), except at two stations located near the Iberian Margin (35 %) and within the Labrador basin (38 %), which were characterized by unusual low in situ PP. We thus conclude that during the GEOVIDE cruise, the North Atlantic was not as efficient in exporting carbon from the surface, as reported earlier by others. Finally, we also estimated the POC export at 100 m below the surface export depth to investigate the POC transfer efficiencies. This parameter was also highly variable amongst regions, with the highest transfer efficiency at sites where coccolithophorids dominated.
- Article
(6422 KB) -
Supplement
(629 KB) - BibTeX
- EndNote


Through the sinking of particulate biogenic material, the biological carbon pump (BCP) plays a major role in the sequestration of carbon-rich particles in the ocean's interior. The North Atlantic harbors one of the most productive spring phytoplankton blooms of the world's ocean (Esaias et al., 1986; Longhurst, 2010), generating an important pulse of biogenic sinking particles (Buesseler et al., 1992; Honjo and Manganini, 1993; Le Moigne et al., 2013a) that accounts for up to 18 % of the global BCP (Sanders et al., 2014). Yet a substantial range of carbon export efficiencies (1 %–47 %) has been reported by earlier studies at different locations in the North Atlantic (Buesseler et al., 1992; Buesseler and Boyd, 2009; Ceballos-Romero et al., 2016; Herndl and Reinthaler, 2013; Lampitt et al., 2008; Moran et al., 2003; Mouw et al., 2016; Thomalla et al., 2008), directly questioning how carbon export efficiency varies at a transatlantic scale and its controlling factors.
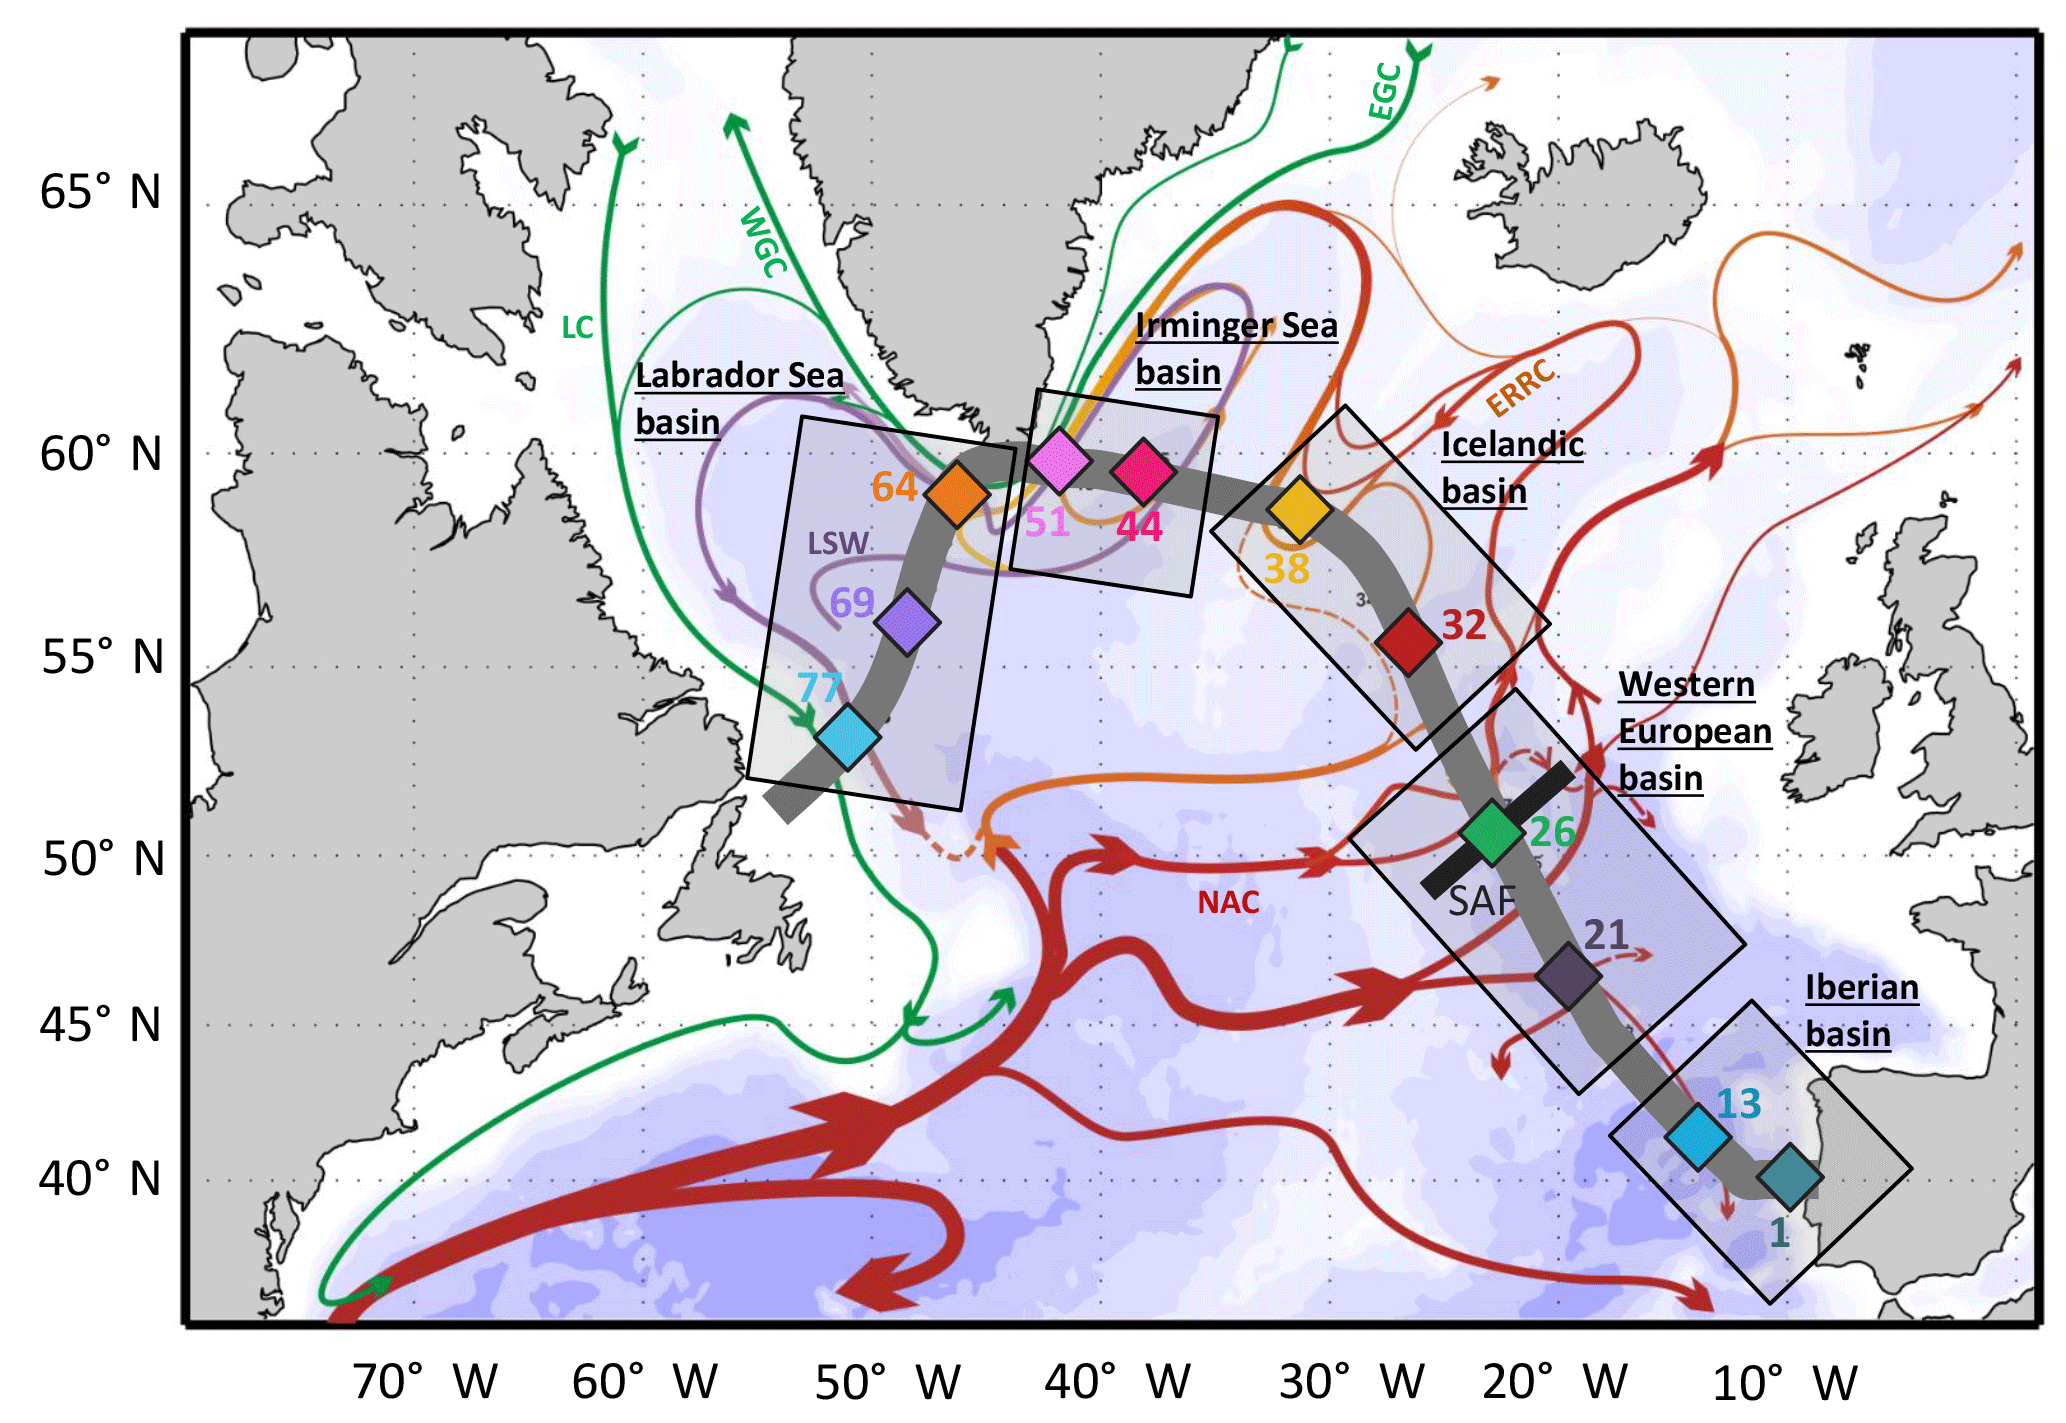
Figure 1Simplified schematic of the surface circulation in the North Atlantic (adapted from Daniault et al., 2016) superimposed with the GEOVIDE cruise track (thick grey line) and stations (colored diamonds). The main surface currents are indicated: East Greenland Current (EGC), West Greenland Current (WGC), Labrador Current (LC), Eastern Reykjanes Ridge Current (ERRC) and North Atlantic Current (NAC). The subarctic front (SAF) and the Labrador Seawater (LSW) are also represented when in surface (i.e., within the Labrador basin). The color codes for sampled stations are also used in the following figures.
The international GEOTRACES program aims to measure trace elements and isotopes along full-depth ocean sections through each of the major ocean basins in order to provide maximum scientific rewards on a global scale (GEOTRACES, 2006). The GEOVIDE GA01 section in the high-latitude North Atlantic (15 May–30 June 2014; R/V Pourquoi Pas?) was a French contribution to this global survey. The studied area crossed five basins, differentiated by their distinct biogeochemical and hydrodynamic characteristics: the Iberian basin, the western European basin, the Icelandic basin, the Irminger basin and the Labrador basin (Fig. 1).
The low nutrient availabilities (surface nitrate and silicate concentrations <1 µmol L−1; nutrient analyses according to Aminot and Kérouel, 2007) in the Iberian basin limit the biomass development, giving picophytoplankton, such as cyanobacteria, the opportunity to grow (∼35 % of the total Chl a at Station 13; Tonnard et al., 2018; pigment analyses according to Ras et al., 2008), a situation which is typical of the North Atlantic subtropical gyre (Moore et al., 2008; Zehr and Ward, 2002). The Iberian basin can also be influenced by a local upwelling close to the Iberian Margin (Costa Goela et al., 2016; Zúñiga et al., 2016; http://marine.copernicus.eu/, last access: 25 September 2018), which potentially fuels the area with nutrients, but upwelling was not active during GEOVIDE (Shelley et al., 2016).
In the subpolar region, in the Irminger and Labrador basins, phytoplankton growth is strongly limited by light seasonally (Riley, 1957), and the key parameter for alleviating these limitations is the progressive shoaling of the mixed layer. There, microphytoplankton, such as diatoms, dominate the phytoplankton bloom (≥50 % of the total Chl a; Tonnard et al., 2018). Both basins are influenced by strong hydrodynamic features, such as the Irminger gyre, the East Greenland Current (EGC), the West Greenland Current (WGC), the Labrador Current (LC; Zunino et al., 2017) and the subduction of the Labrador Sea Water (LSW), which was particularly intense (1700 m-deep convection) during winter 2013–2014 (Kieke and Yashayaev, 2015).
Between the subtropical and subpolar regions, the western European and Icelandic basins represent a transition zone where nutrients and/or light can limit primary production (Henson et al., 2009). During GEOVIDE, the silicic acid stock was low (≤1 µmol L−1), leading to the growth of nanophytoplankton, such as haptophytes including coccolithophorids (between 45 % and 80 % of the total Chl a; Tonnard et al., 2018). This region is influenced by the East Reykjanes Ridge Current (ERRC) and by the North Atlantic Current (NAC), with the southernmost sub-branch evolving in a cyclonic eddy and the subarctic front (SAF). SAF separates cold and fresh waters from the subpolar region and the warm and salty waters from the subtropical region (Zunino et al., 2017).
The North Atlantic is thus a heterogeneous basin in terms of nutrient status, phytoplankton communities and hydrodynamic features.
This is of a crucial importance, as ecosystem structure is thought to play an important role in the BCP. Guidi et al. (2009) suggested that phytoplankton composition explained 68 % of the variance in particulate organic carbon (POC) flux at 400 m. High export efficiencies are reported in productive regions where diatoms dominate, but the exported material is relatively labile and prone to remineralization, leading to low transfer efficiency and low deep export flux (Guidi et al., 2009). Conversely, in oligotrophic regions, where diatoms are largely absent, primary production is low and mostly regenerated. Consequently, export efficiencies are low, but the eventual exported material is likely less prone to degradation (remineralization), resulting in high transfer efficiencies (Henson et al., 2012; Lam et al., 2011; Lima et al., 2014; Marsay et al., 2015). Phytoplankton size structure has also been shown to be an important factor in controlling the POC export fluxes. Guidi et al. (2015) highlighted that the exported POC was more refractory and the remineralization depth was deeper when the fraction of microphytoplankton decreased or the fraction of picophytoplankton increased.
Due to the complex impact of these biogeochemical factors on the POC export and according to the distinct features of each biogeochemical basin, the efficiency of the North Atlantic to transfer POC to the deep ocean deserves further study.
In this context, we investigated POC export fluxes derived from the Thorium-234 (234Th) approach along a transect in the high-latitude North Atlantic, from the Iberian Margin to the subarctic Irminger and Labrador seas. 234Th, a highly particle reactive element with a short half-life (24.1 days), is widely used to explore particle export over short-term events such as phytoplankton blooms (Bhat et al., 1969; Buesseler et al., 1992; Coale and Bruland, 1985; Cochran and Masqué, 2003). A deficit of 234Th with respect to its radioactive parent 238U (conservative in seawater) is usually observed in the upper water column where particles sink. In the subsurface waters, any excess of 234Th relative to 238U is taken to reflect particle break-up and remineralization by heterotrophic bacteria and/or zooplankton (Buesseler et al., 2008; Maiti et al., 2010; Savoye et al., 2004). A 234Th flux can be converted into a POC flux by using the POC:234Th ratio of sinking particles at the depth of export (Buesseler et al., 2006).
In this study, we discuss carbon export fluxes determined at the base of the deficit zone according to the biogeochemical properties found in each basin, with special emphasis on the stage and intensity of the bloom as well as on the phytoplankton community structure. Using estimates of primary production from shipboard incubations and satellite-derived Chl a, we explore surface export efficiencies at different timescales in the studied area. In addition and using deep carbon export, we investigate POC transfer efficiency in upper mesopelagic areas.
2.1 Total 234Th and 238U
Total 234Th activities were determined from 4 L unfiltered seawater samples collected with 12 L Niskin bottles. Usually, 17 or 18 depths were sampled between the surface and 1000–1500 m, except at Stations 26 and 77, where only 9 and 15 depths were sampled, respectively (Table S1 in the Supplement). Deep samples (between 1000 and 3500 m) were taken for the calibration of the low-level beta counting (Rutgers van der Loeff et al., 2006) based on the knowledge that 234Th and 238U are generally in secular equilibrium at such depths (in this study, the deep ocean average 234Th∕238U ratio = 1.00±0.02; n=15). Seawater samples were processed following the method developed by Pike et al. (2005). Samples were acidified at pH 2 and spiked with a 230Th yield monitor in order to estimate the 234Th recovery during the sample processing. After 12 h of equilibration, pH was increased to 8.5, and KMnO4 and MnCl2 (analytical grade, Merck) were added to form a manganese oxide precipitate. After a further 12 h of equilibration, samples were filtered on quartz-microfiber discs (QMA, Sartorius, 1 µm nominal porosity, 25 mm diameter). On board, filters were dried overnight, mounted on nylon holders, and covered with Mylar and aluminum foil. The activity of 234Th on each sample was counted using low-level beta counters (RISØ, Denmark). Beta activity counting was continued until a relative standard deviation (RSD) ≤2 % was reached. At the home laboratory, residual beta activity was measured for each sample after a delay of six 234Th half-lives (∼6 months), and these residual counts were subtracted from the gross counts obtained on board. All samples were then processed for Th recovery using 229Th as a second-yield tracer. To do so, filters were dismounted from the nylon holders and transferred to clean 30 mL teflon vials (Savillex). All samples were spiked with 229Th, dissolved in a mix of 8 M HNO3 ∕ 1 M H2O2 (Suprapur grade, Merck), heated overnight and filtered through Acrodisc® syringe filters (Pall, Nylon membrane, nominal porosity of 0.2 µm and diameter of 25 mm). Part of the filtrate was pre-concentrated by evaporation, and the residue was diluted in 1.4 M HNO3 (Suprapur grade, Merck). 230Th and 229Th concentrations were measured by sector field inductively coupled plasma mass spectrometry (SF-ICP-MS, Element 2, Thermo Scientific) in low-resolution mode. Each sample was analyzed three times, and the precision of the 230Th:229Th ratios averaged at 1.2 % (RSD), which is within the range indicated by Pike et al. (2005). The total 234Th recovery, involving all the steps described above, was 91±14 % (n=200). Uncertainty of total 234Th activity, estimated from error propagation, was between 0.04 and 0.10 dpm L−1.
The 238U activity was deduced from salinity using the Eq. (1), given by Owens et al. (2011) as
where 238U is the 238U activity in dpm L−1 and S is salinity.
2.2 Particulate 234Th and POC sampling and analysis
Suspended particles were collected using in situ large-volume filtration (100–1600 L) systems (Challenger Oceanics and McLane pumps; ISPs hereafter for “in situ pumps”) through paired 142 mm diameter filters, a 53 µm mesh nylon screen (SEFAR-PETEX®; polyester) and a 1 µm pore size quartz-microfiber filter (QMA, Sartorius). The small size fraction (1–53 µm) is referred to hereafter as SSF, and the large size fraction (>53 µm) is referred to as LSF. Prior to the cruise, filters were cleaned as follows. PETEX screens were soaked in 0.6 M HCl (Normapur, Merck), rinsed with Milli-Q water, dried at ambient temperature in a laminar flow hood and stored in clean plastic bags; QMA filters were pre-combusted at 450 ∘C for 4 h and stored in aluminum foils until use. ISPs were deployed between 15 and 800 m on a stainless-steel cable, and the pumping time was approximately 2–3 h (Table S2).
After collection, filters were processed on board. The 142 mm PETEX screen was cut into quarters using a clean scalpel, and two quarters were processed in this study. Particles were rinsed off of the PETEX screen using 0.45 µm filtered seawater under a laminar flow hood. For one quarter of the PETEX screen, the rinsed-off particles were re-filtered on a silver filter (SterliTech, porosity = 0.45 µm, diameter = 25 mm), and for another quarter, they were rinsed on a GF/F filter (Whatman®, porosity = 0.7 µm, diameter = 25 mm). The QMA filters were sub-sampled with a Perspex punch with a 25 mm diameter. Silver, GF/F and QMA filters were dried overnight and prepared for beta counting (see Sect. 2.1). After counting the residual beta activity (∼6 months later), samples were prepared for POC, particulate nitrogen (PN) analyses along with their δ13C and δ15N isotopic compositions (here we present only POC data). Filters were dismounted from filter holders and fumed with HCl vapor overnight inside a glass desiccator to remove the carbonate phase. Samples were dried, packed in precombusted (450 ∘C overnight) silver cups, and analyzed with an elemental analyzer coupled with an isotope ratio mass spectrometer (EA-IRMS, Delta V Plus, Thermo Scientific). Acetanilide standards were used for the calibration. The detection limits and C blanks were respectively 0.63 and 0.80 µmol for Ag filters (n=11) and were 0.49 and 1.52 µmol for QMA filters (n=13).
The POC concentrations and 234Th activities compared well in silver and GF/F filter types, pointing to the rather homogenous distribution of the particles on the Petex screen ( with r2=0.88, p-value < 0.01 and n=58; and POCGFF = 0.86 POCsilver+0.08 with r2=0.90, p-value < 0.01 and n=58; Fig. S1 in the Supplement), although concentrations from GF/F filters were systematically lower than those from silver filters, most likely because of the different pore size filter (0.7 µm for the GF/F filter vs. 0.45 µm for the silver filter).

Figure 2Profiles of the total 234Th (closed circles), total 238U (black dotted vertical line) and particulate 234Th activities for the small size fraction (SSF; 1–53 µm; open diamonds) and large size fraction (LSF; >53 µm; closed triangles). All activities are expressed in dpm L−1. The horizontal black line is the Eq depth (depth where 234Th returns to equilibrium with 238U), and the horizontal green line is the depth of the PPZ (primary production zone). Error bars are plotted but may be smaller than the size of the symbols. Note that the Eq depth at Station 26 is set at 100 m because of the lower sampling vertical resolution.
2.3 Export fluxes of 234Th
Thorium-234 activity in surface waters can be described using a simple mass balance equation (Savoye et al., 2006), which accounts for production from 238U decay, 234Th decay, sinking flux and transport as follows:
where ATh is the activity of total 234Th in dpm L−1, AU is the salinity-derived activity of 238U in dpm L−1, λ is the 234Th decay constant (0.0288 d−1), P is the net removal of 234Th on sinking particles in dpm L−1 d−1, and V is the sum of the advective and diffusive fluxes in dpm L−1 d−1.
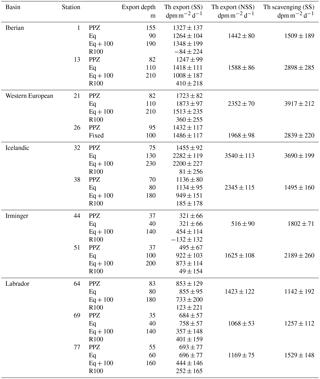
Table 1Summary of the 234Th export and scavenging fluxes using steady-state (SS) and non-steady-state (NSS) models. The 234Th export fluxes using the SS model are calculated at the depths corresponding to the bottom of the primary production zone (PPZ), the equilibrium (Eq) depth and 100 m below Eq (Eq+100); the last of which is being used to estimate a remineralization flux of 234Th (R100). Negative R100 values indicate an increase in the export flux between Eq and Eq+100. Note that the depth was fixed to 100 m at Station 26 because of the lower sampling vertical resolution. Consequently, the export flux at Eq+100 and the R100 were not determined at Station 26.
Assuming a steady state (constant total 234Th activity with time) and neglecting the physical term V (Buesseler et al., 1992), the net export flux of particulate 234Th can be determined using the following equation:
where P is the integrated flux of 234Th from the surface to the depth z in dpm m−2 d−1. Equation (3) has been solved for z taken as the depth at the base of the 234Th deficit zone (the Eq depth), i.e., the depth where 234Th is back to secular equilibrium with 238U, as well as for z representing the base of the primary production zone (the PPZ depth), i.e., the depth where in situ fluorescence was only 10 % of its maximum value (Owens et al., 2014, Table 1). The Eq depth matched relatively well with the PPZ depth, and on average, the difference between both was only 16 m, with the largest difference (∼60 m) at Stations 1, 32 and 51 (Fig. 2). Considering that there can be export (or remineralization) below or above the PPZ depth, only the export fluxes at the Eq depth will be discussed, as they represent the fully integrated depletion of 234Th in the upper waters and thus the maximal export. The validity of the assumptions used for solving Eq. (3) is discussed in Sect. 4.1.
In Sect. 4.1.2, we attempt to calculate the 234Th fluxes at the Eq depth by using a non-steady-state (NSS) model (Savoye et al., 2006, Table 1), which can be described as follows:
where Δt is the time interval between two visits of a single station, and ATh1 and ATh2 are the 234Th activities at the first and second visits, respectively. Without time series data, the calculation should not be performed sensu stricto (Buesseler et al., 1992; Savoye et al., 2006). Thus, we chose to set the initial conditions for each station, as done by Rutgers van der Loeff et al. (2011) in the South Atlantic. Satellite-derived PP data were used to estimate the starting date of the bloom (i.e., when there is a PP increase of 30 % above the winter value), and 234Th was assumed to be in equilibrium with 238U at this time point. The time interval (Δt) for the calculations stretched from the bloom start until the sampling date. All physical terms were considered negligible.
To estimate the intensity of shallow remineralization, export flux was also calculated for the Eq + 100 m depth horizon. In case of any 234Th excess relative to 238U (i.e., 234Th∕238U ratio > 1) below the Eq depth due to remineralization, export fluxes integrated until Eq + 100 m will be less than when integrated until Eq. Following Black et al. (2017), the reduction of the 234Th flux, R100 (Table 1), is expressed as
where R100 is the flux reduction in dpm m−2 d−1 and P is the 234Th export flux estimated at Eq or Eq+100.
2.4 Scavenging fluxes of 234Th
To estimate the transfer rate of 234Th from the dissolved to the particulate form, i.e., the scavenging flux of 234Th (Coale and Bruland, 1985), we deduced the dissolved 234Th activities by subtracting the particulate (SSF+LSF) from the total 234Th activities, keeping in mind, though, that the sampling method for the total and particulate phases differed. Because the sampling resolution was different, total 234Th data were averaged at the sampling depth of particulate 234Th.
The mass balance equation for dissolved 234Th can be written as follows:
where AThd is the activity of dissolved 234Th in dpm L−1, AU and λ are defined in Eq. (2), J is the net removal flux from the dissolved to the particulate form (scavenging flux) in dpm L−1 d−1, and V is the sum of the advective and diffusive fluxes in dpm L−1 d−1.
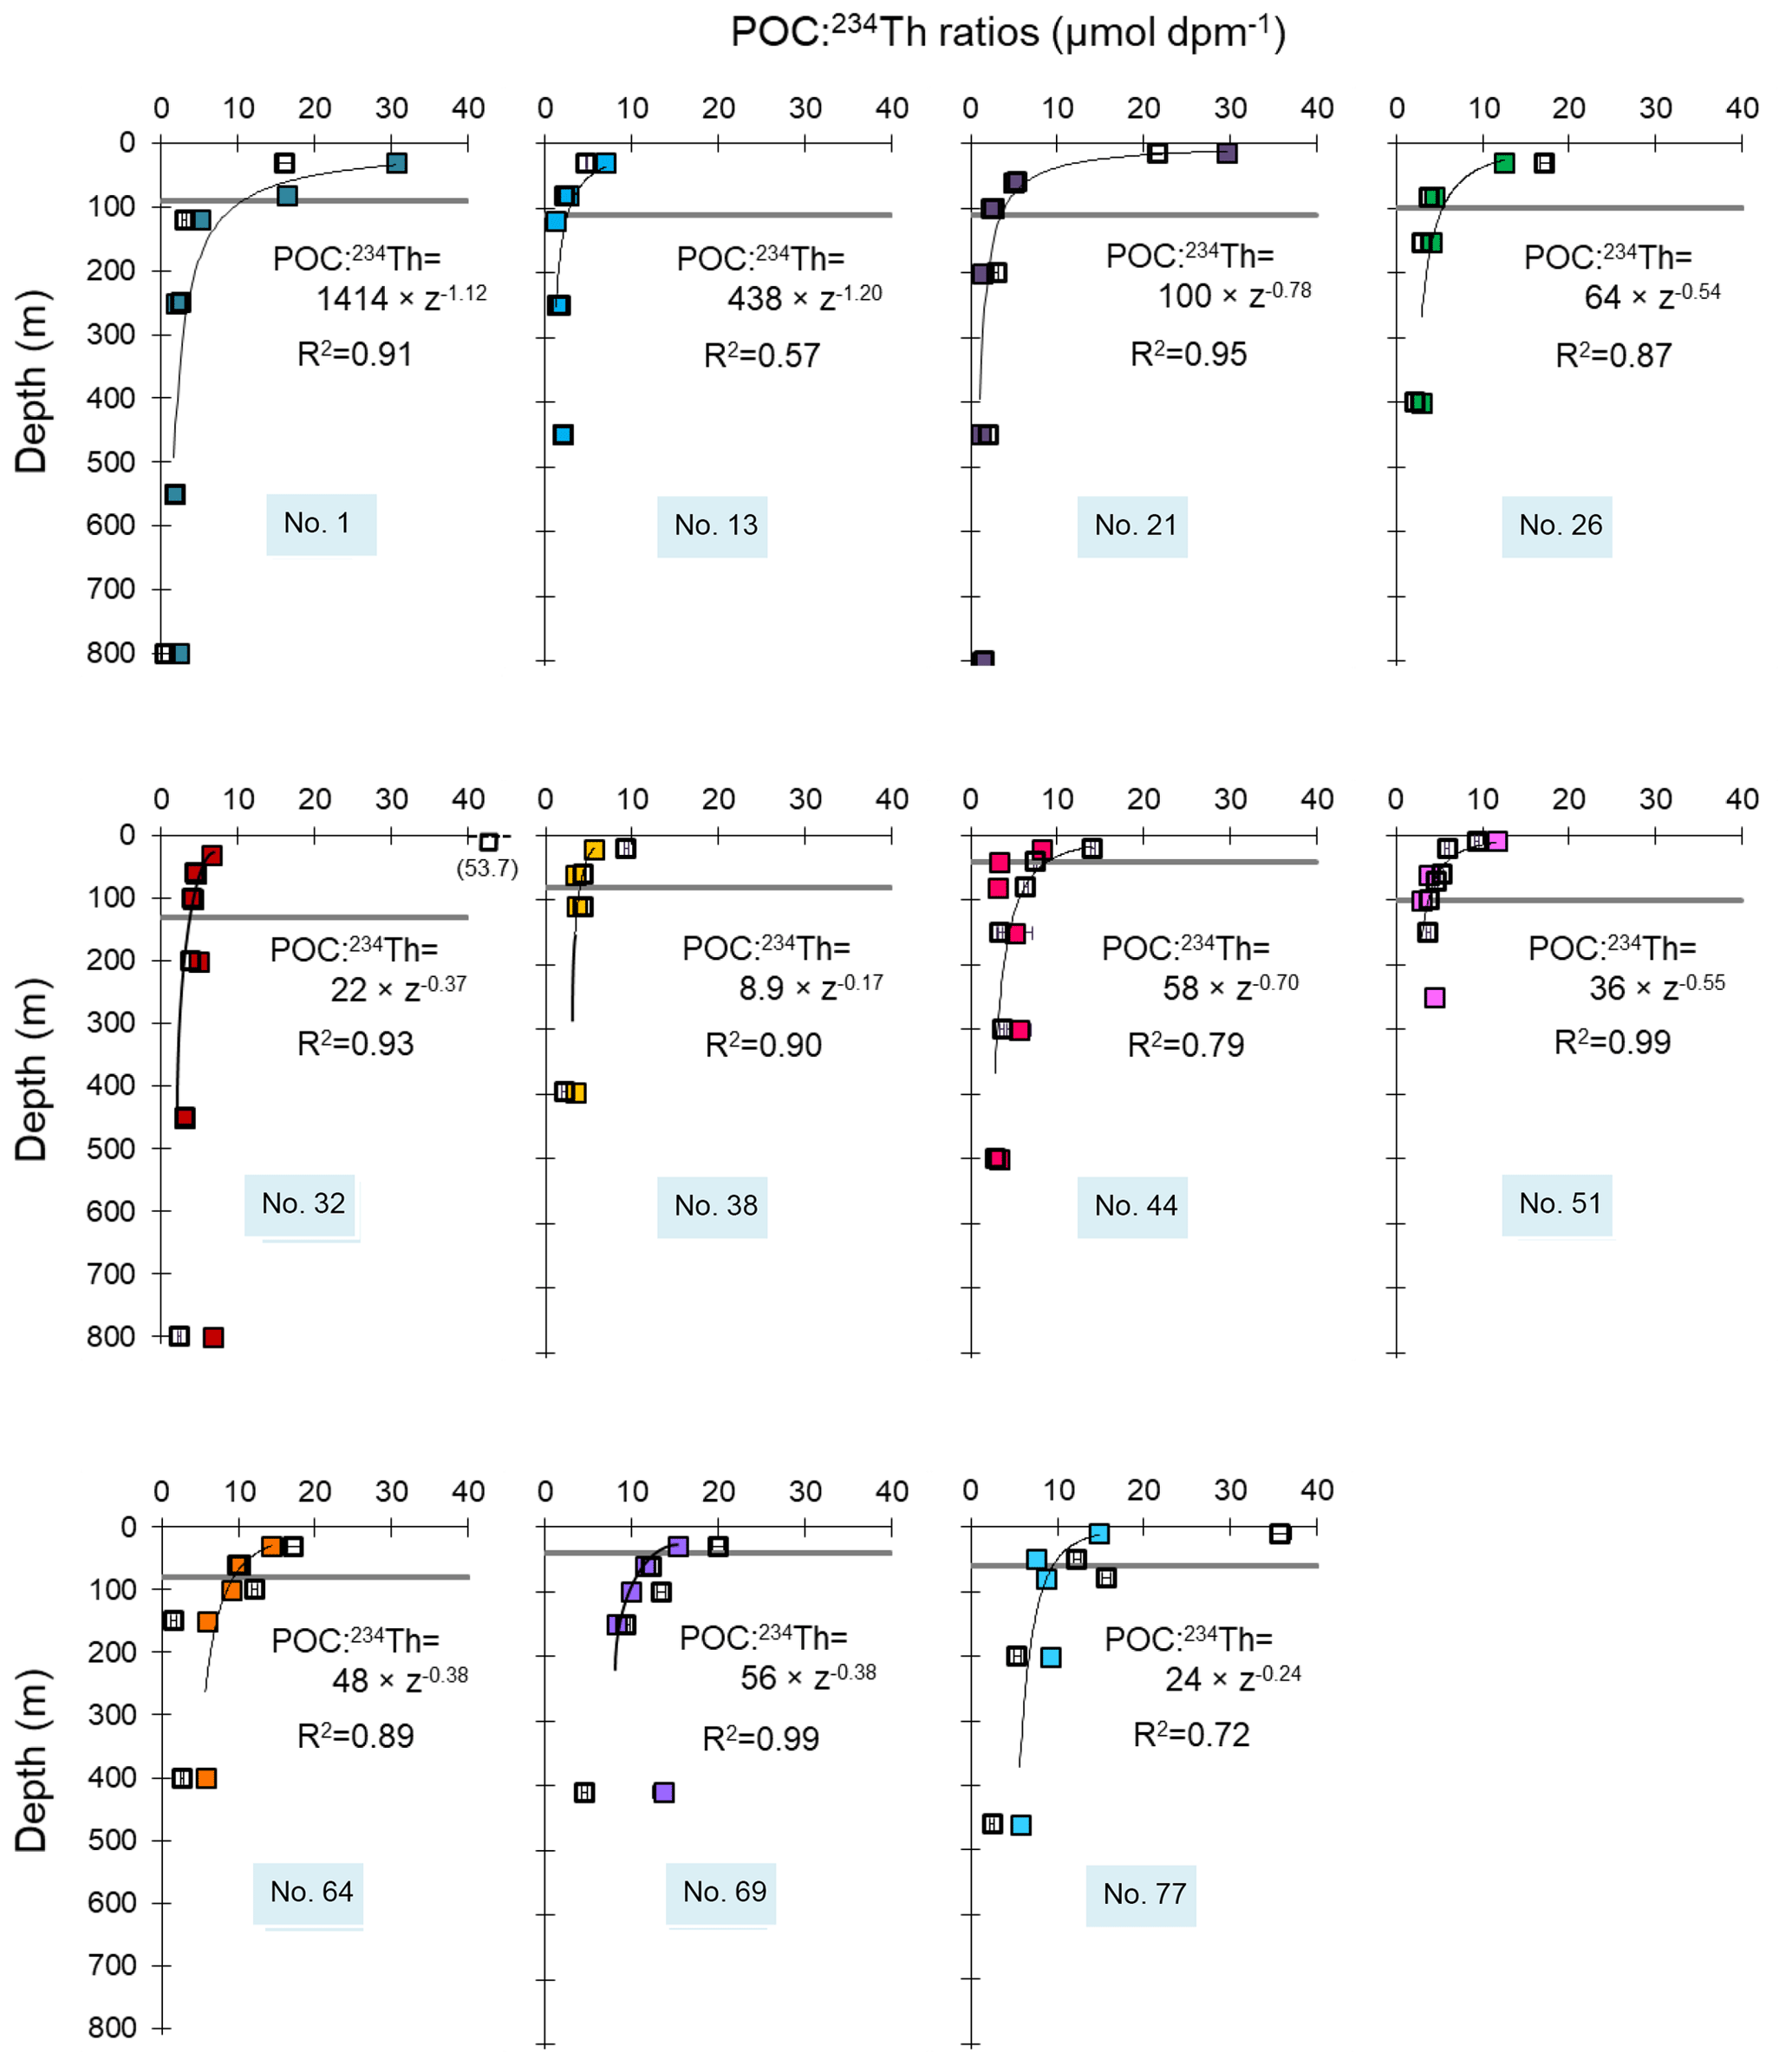
Figure 3Profiles of the POC:234Th ratios (µmol dpm−1) in the SSF (open symbols) and LSF (closed symbols). The Eq depth, where 234Th is back to equilibrium with 238U, is indicated with the grey horizontal line. The thin black line represents the power-law fit () of the LSF. The median percentage errors on POC:234Th ratios represent 5 % and 6 % of the value for the SSF and the LSF, respectively. Error bars are plotted but may be smaller than the size of the symbols.
Using the steady-state assumption again (dissolved 234Th activities remain constant over time) and ignoring the physical terms (V), Eq. (6) becomes
where J in dpm m−2 d−1 is the net flux of scavenging integrated to the depth z. In our case, the calculation was performed at the Eq depth (Table 1) for comparison with the 234Th export flux (P in Eq. 3).
The comparison between the export flux (P) and scavenging flux (J) in terms of the P∕J ratio (export ratio) offers a valuable metric for estimating the export efficiency of 234Th. A low P∕J ratio (<0.5) indicates that the removal of dissolved 234Th is controlled by sorption onto suspended particles rather than export. Conversely, a high P∕J ratio (>0.5) indicates that 234Th is preferentially exported rather than adsorbed and is thus efficiently removed from the upper waters.
2.5 POC:234Th ratios and POC export fluxes
We estimated POC export fluxes by multiplying the 234Th export flux with the POC:234Th ratio, both determined at the Eq depth. A power-law fit was used to determine the POC:234Th ratios at Eq (Fig. 3). Errors of the POC:234Th ratios extrapolated at the Eq depth are deduced from the power-law fit, using a root sum squared method. This error is much larger than analytical errors of both POC concentrations and particulate 234Th activities. POC fluxes were determined by using the POC:234Th ratios of the LSF (>53 µm) as well as the SSF (1–53 µm) samples, and both estimations were compared (Table 2).
The POC fluxes were between 1.1 and 1.5 times higher when using the SSF POC:234Th ratio, except at Stations 1, 26 and 64. However, when considering the uncertainties, POC fluxes based on SSF and LSF POC:234Th ratios were not significantly different, and as we did not have the possibility to compare the POC:234Th ratios with those from sediment traps, we cannot affirm that the small particles participated to the export. As large and rapidly sinking particles usually drive most of the export (Lampitt et al., 2001; Villa-Alfageme et al., 2016), most of the studies dedicated to POC export fluxes in the North Atlantic used the POC:234Th ratios from the LSF (see Le Moigne et al., 2013b; Puigcorbé et al., 2017). Therefore, only the POC fluxes determined with the POC:234Th ratios from the LSF will be discussed (Table 3).
Table 2Comparison of the steady-state POC export fluxes at Eq, as determined using the POC:234Th ratios in the large (LSF; >53 µm) and small size fraction (SSF; 1–53 µm).
2.6 In situ primary production
In order to determine the in situ daily PP, stable isotope incubations were conducted using seawater collected at different euphotic zone depths selected using photosynthetically active radiation (PAR) profiles, described in more detail in Fonseca-Batista et al. (2018). At each station, seawater was sampled from three to six depths (from 54 % to 0.2 % of surface PAR) and incubated on deck with a substrate enriched with . After 24 h, incubated samples were filtered through microglass fiber filters (MGF, 0.7 µm porosity, Sartorius). At the home laboratory, POC concentrations and isotopic composition were analyzed by EA-IRMS, and uptake rates were deduced following the Hama et al. (1983) method. Daily PP was then estimated by integrating the uptake rates from the surface down to 0.2 % of surface PAR, which was located between 48 and 116 m, depending on the station. The 0.2 % of surface PAR depth roughly corresponded to the Eq depth (with a median difference between both depths of 20±13 m), although a 42 m difference was observed at Station 1. Note that at Station 51, PP was determined 24 h after the sampling of the total 234Th, particulate 234Th and POC.
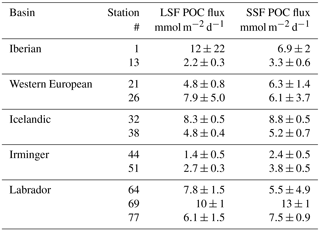
Table 3Ratios of POC (particulate organic carbon) to 234Th (in µmol dpm−1) in the LSF, POC export fluxes (in mmol m−2 d−1), in situ primary production (PP; Fonseca-Batista et al., 2018, and this study) and satellite-derived PP from the vertically generalized production model (VGPM-PP) integrated over 8 days, 32 days and over the whole season (in mmol m−2 d−1), and the POC fluxes at Eq+100 m (in mmol m−2 d−1). Because of the lower vertical sampling resolution at Station 26, no POC export flux was determined at Eq+100. The sampling to determine the in situ PP at Station 51 occurred 24 h after the sampling of the particulate 234Th and POC.
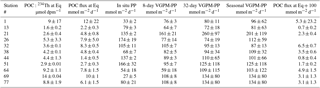
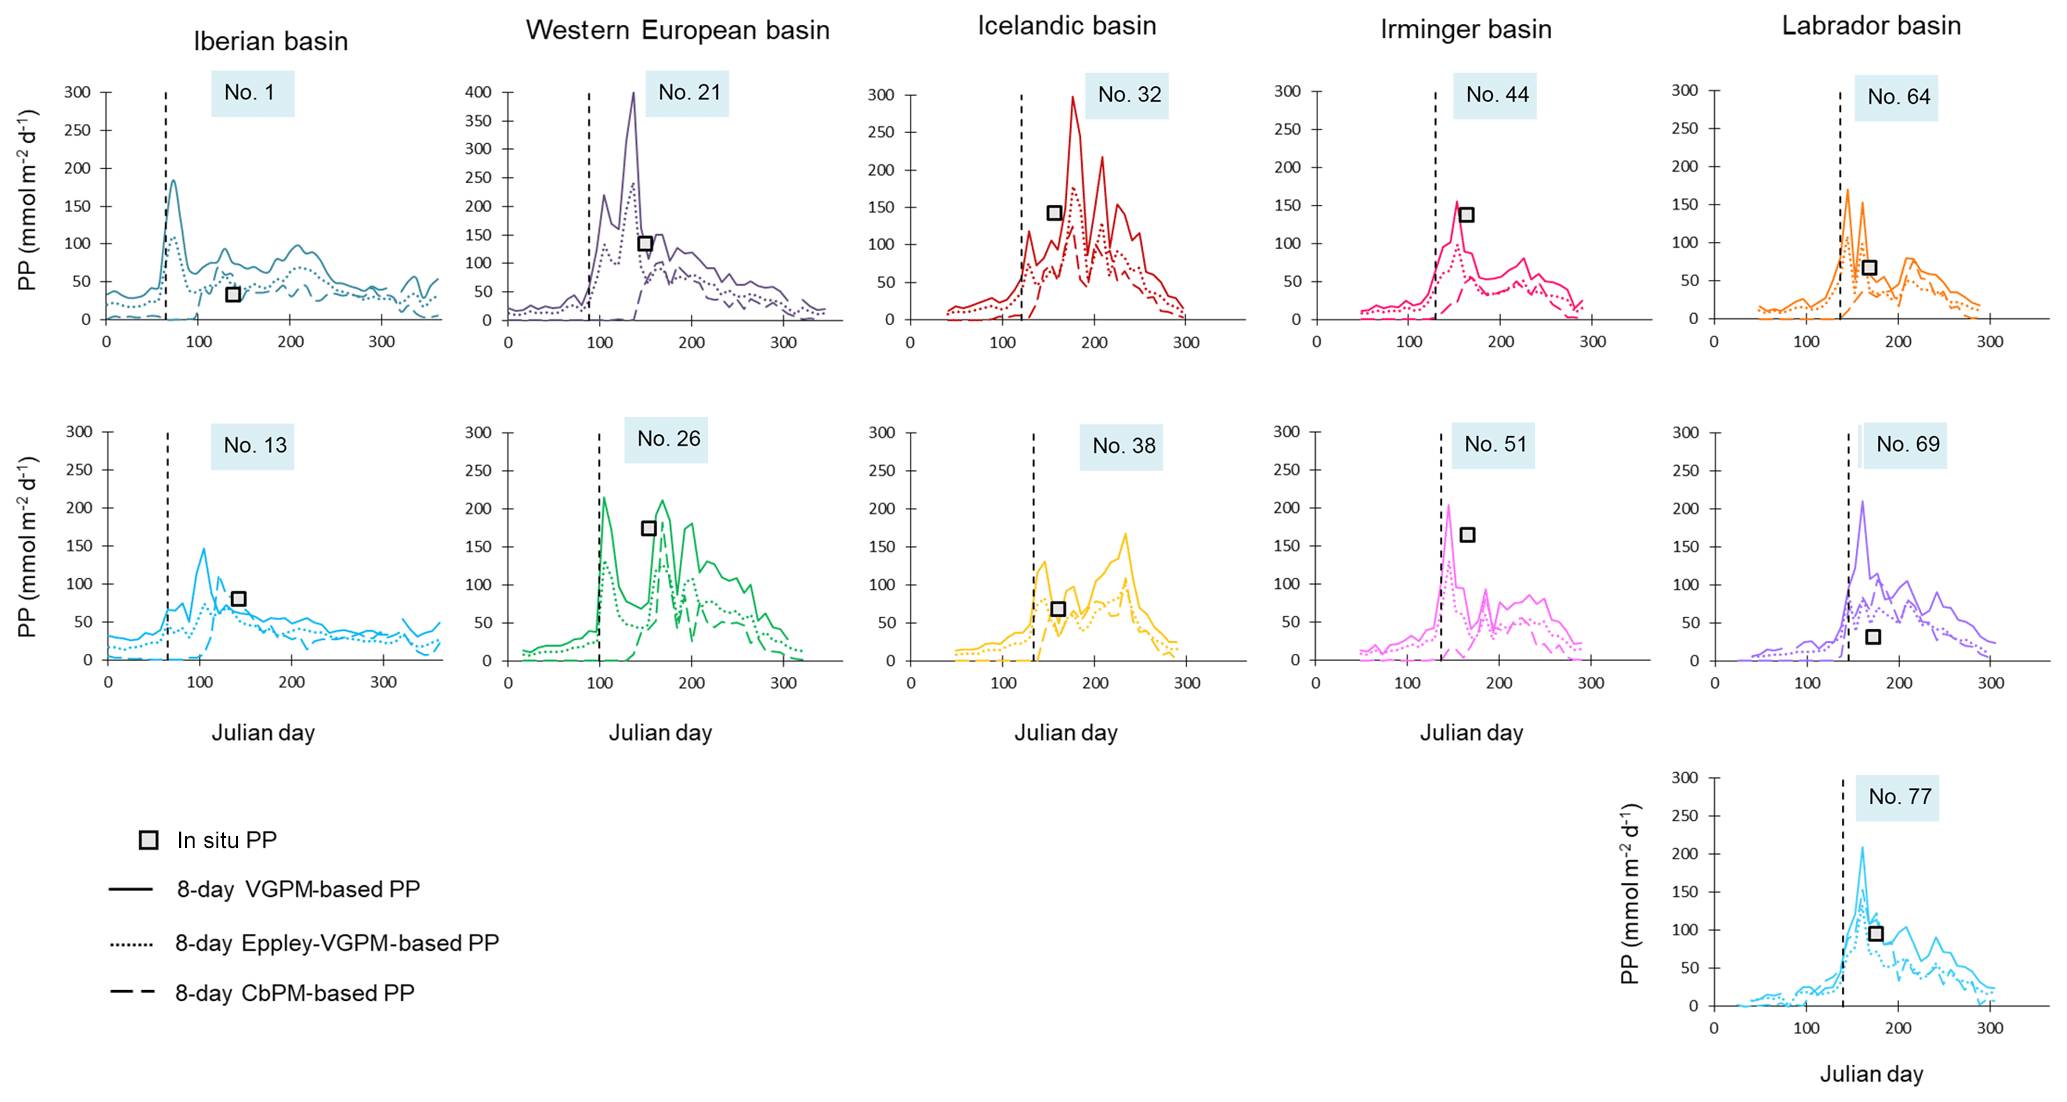
Figure 4In situ (squares) and satellite VGPM-derived (continuous lines), VGPM-Eppley-derived (dotted lines) and CbPM-derived (dashed lines) primary production (PP; in mmol m−2 d−1) data at the time of our sampling and throughout the year 2014. The start of the bloom, defined by a PP increase of 30 % above the winter value, is indicated with the black vertical dashed line.
2.7 Satellite primary production
PP was also obtained from satellite data products with a 9 km spatial resolution and 8-day temporal resolution, available from the Ocean Productivity website at Oregon State University (http://www.science.oregonstate.edu/ocean.productivity/, last access: 14 April 2018) and obtained from MODIS and SeaWiFS satellites. Three different models can be used to obtain satellite-derived PP: the standard vertically generalized production model (VGPM; Behrenfeld and Falkowski, 1997), the Eppley-VGPM (Eppley, 1972) and the carbon-based production model (CbPM; Behrenfeld et al., 2005; Westberry et al., 2008). Among the model outputs, the VGPM-derived PP (VGPM-PP) is closest to the in situ PP measurements during our study (Fig. 4). Therefore, VGPM-PP is used in later discussion.
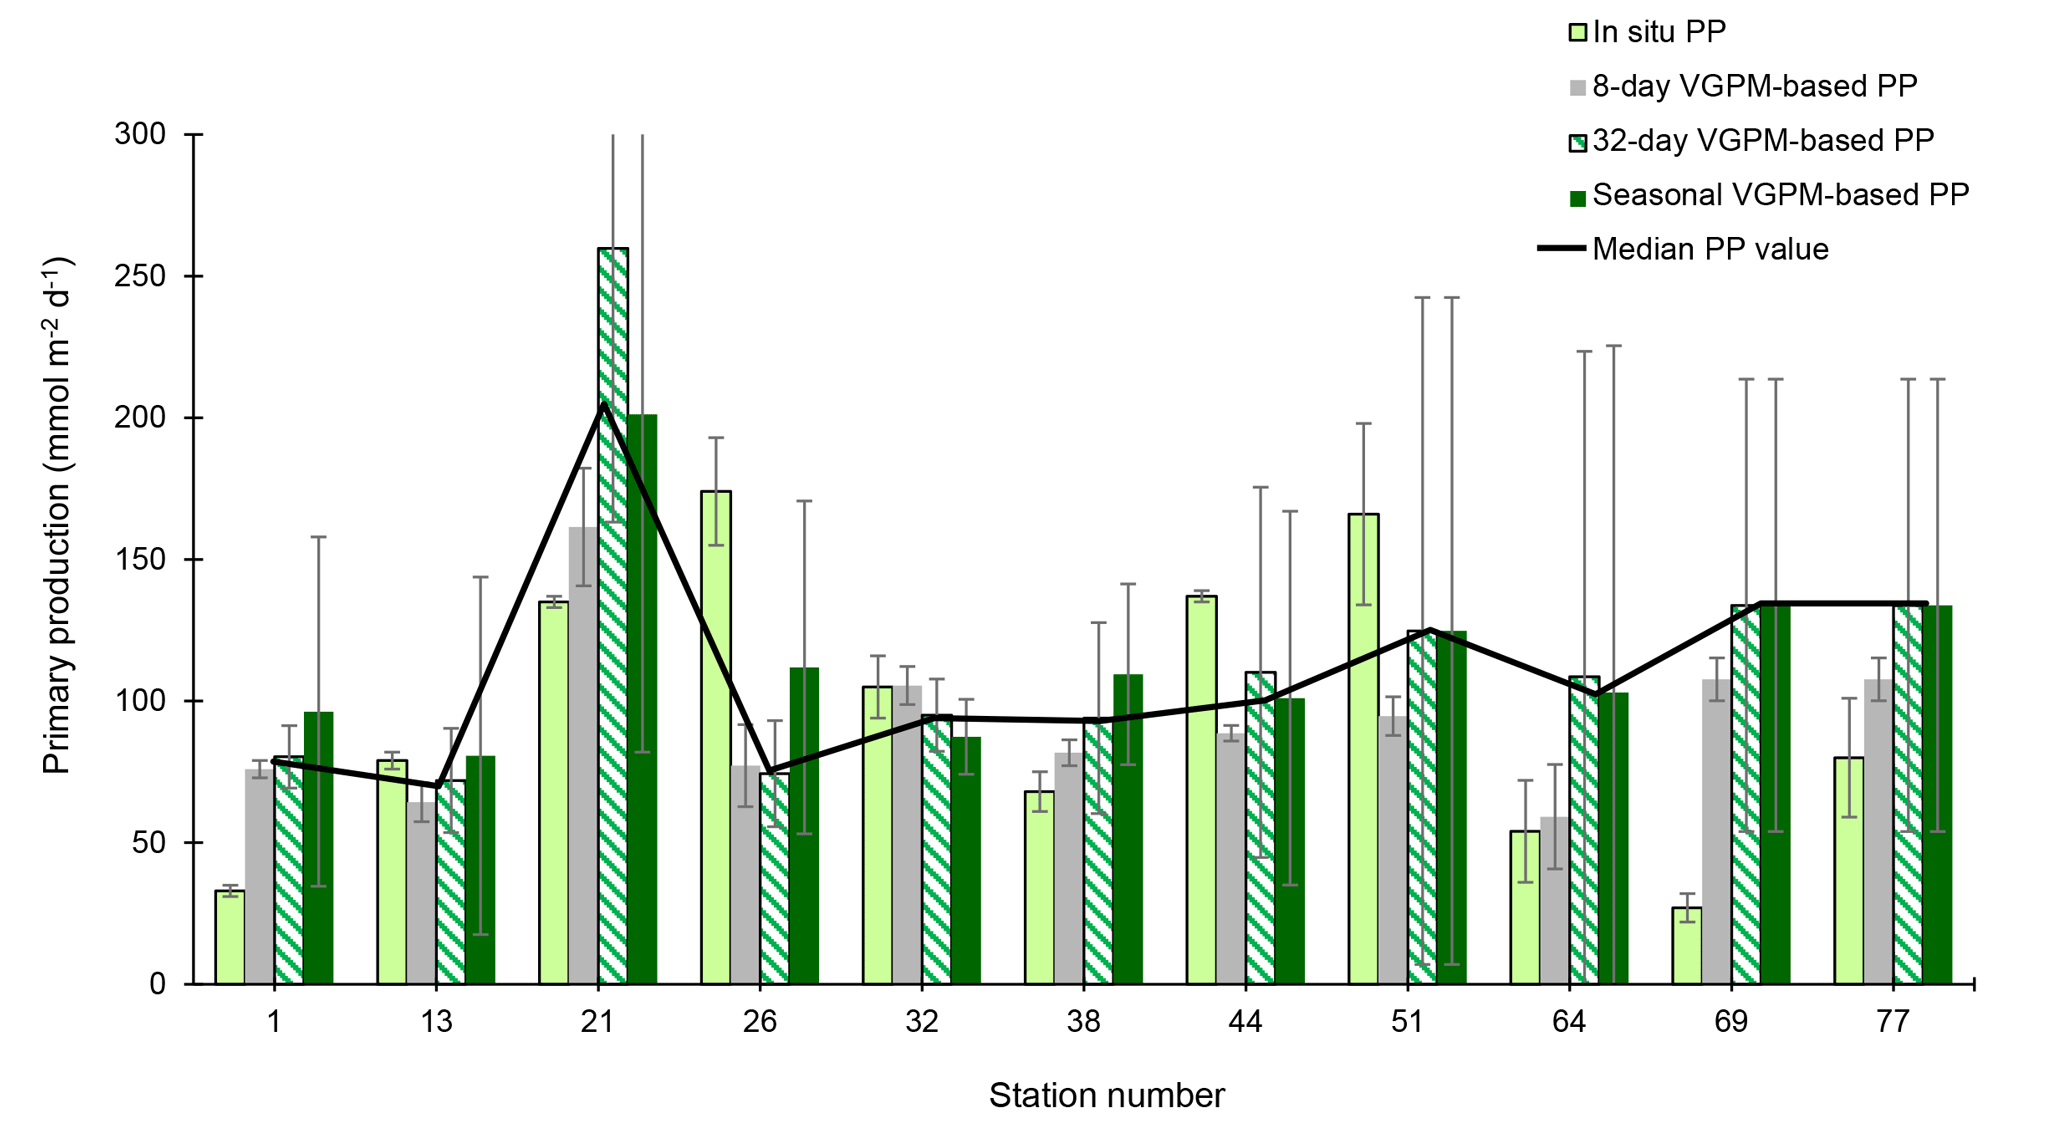
Figure 5Comparison of in situ and satellite VGPM (for 8-days, 32-days and seasonal averages) primary productivities (mmol m−2 d−1) along the GEOVIDE transect. The median of the four values is also indicated (black line).
VGPM-PP data were averaged over 5×5 pixel boxes corresponding to a surface area of 2025 km2 (45 km × 45 km) centered on the different sampling stations, and the VGPM-PP was averaged for the week (8 days), the month (32 days) and the whole productive period prior to the sampling date. The whole productive period is the period between the bloom start (defined by a PP increase of 30 % above the winter value) and the sampling date (Fig. 5). Differences between the different VGPM-PP estimates were smaller than a factor of 1.5.
3.1 The Iberian basin (Stations 1 and 13)
Stations 1 and 13 were sampled 10 to 12 weeks after the start of the bloom (Fig. 4). At these stations, PP increased very early in the year (early to mid-March) and collapsed rapidly (end of March to mid-April). Within the Iberian basin, low in situ PP was determined (Table 3), with one of the lowest values measured at Station 1 (33 mmol m−2 d−1) and a moderate PP at Station 13 (79 mmol m−2 d−1; Fonseca-Batista et al., 2018).
In line with low in situ PP, low POC concentrations and particulate 234Th activities were determined in the Iberian basin (Table S2). POC:234Th ratios were low in both size fractions at Station 13, while Station 1 had high ratios, reaching 31 µmol dpm−1 in surface for the LSF (Fig. 3). Similarly, Station 13 had the lowest LSF POC:234Th ratio extrapolated at Eq, whereas Station 1 had one of the highest ratios (Table 3).
The 234Th∕238U ratios were in the median of the range observed along the transect and reached minima of 0.68 and 0.70 in the upper 40 m at Stations 1 and 13, respectively (Fig. 2). Interestingly, these two stations also vary in their total particulate 234Th (sum of the SFF and LSF) over total 234Th ratios, with only 9 % of the 234Th in the particulate phase at Station 1 and a ratio of 28 % at Station 13 (the median of those observed elsewhere along the transect). At both stations, the 234Th export fluxes at the Eq depth were slightly higher than the median value observed along the transect (1135 dpm m−2 d−1, n=11), reaching 1264 and 1418 dpm m−2 d−1 at Stations 1 and 13, respectively (Table 1). Compared to Station 1, the 234Th scavenging flux was ∼2 times higher at Station 13 (1509 and 2898 dpm m−2 d−1, respectively; Table 1). Consequently, the export ratio (P∕J) was higher at Station 1, reaching 0.84, compared to Station 13 (P∕J ratio = 0.49; Fig. 6). This indicates a balanced situation between P and J fluxes at Station 13 and a more efficient export of 234Th by sinking particles at Station 1.
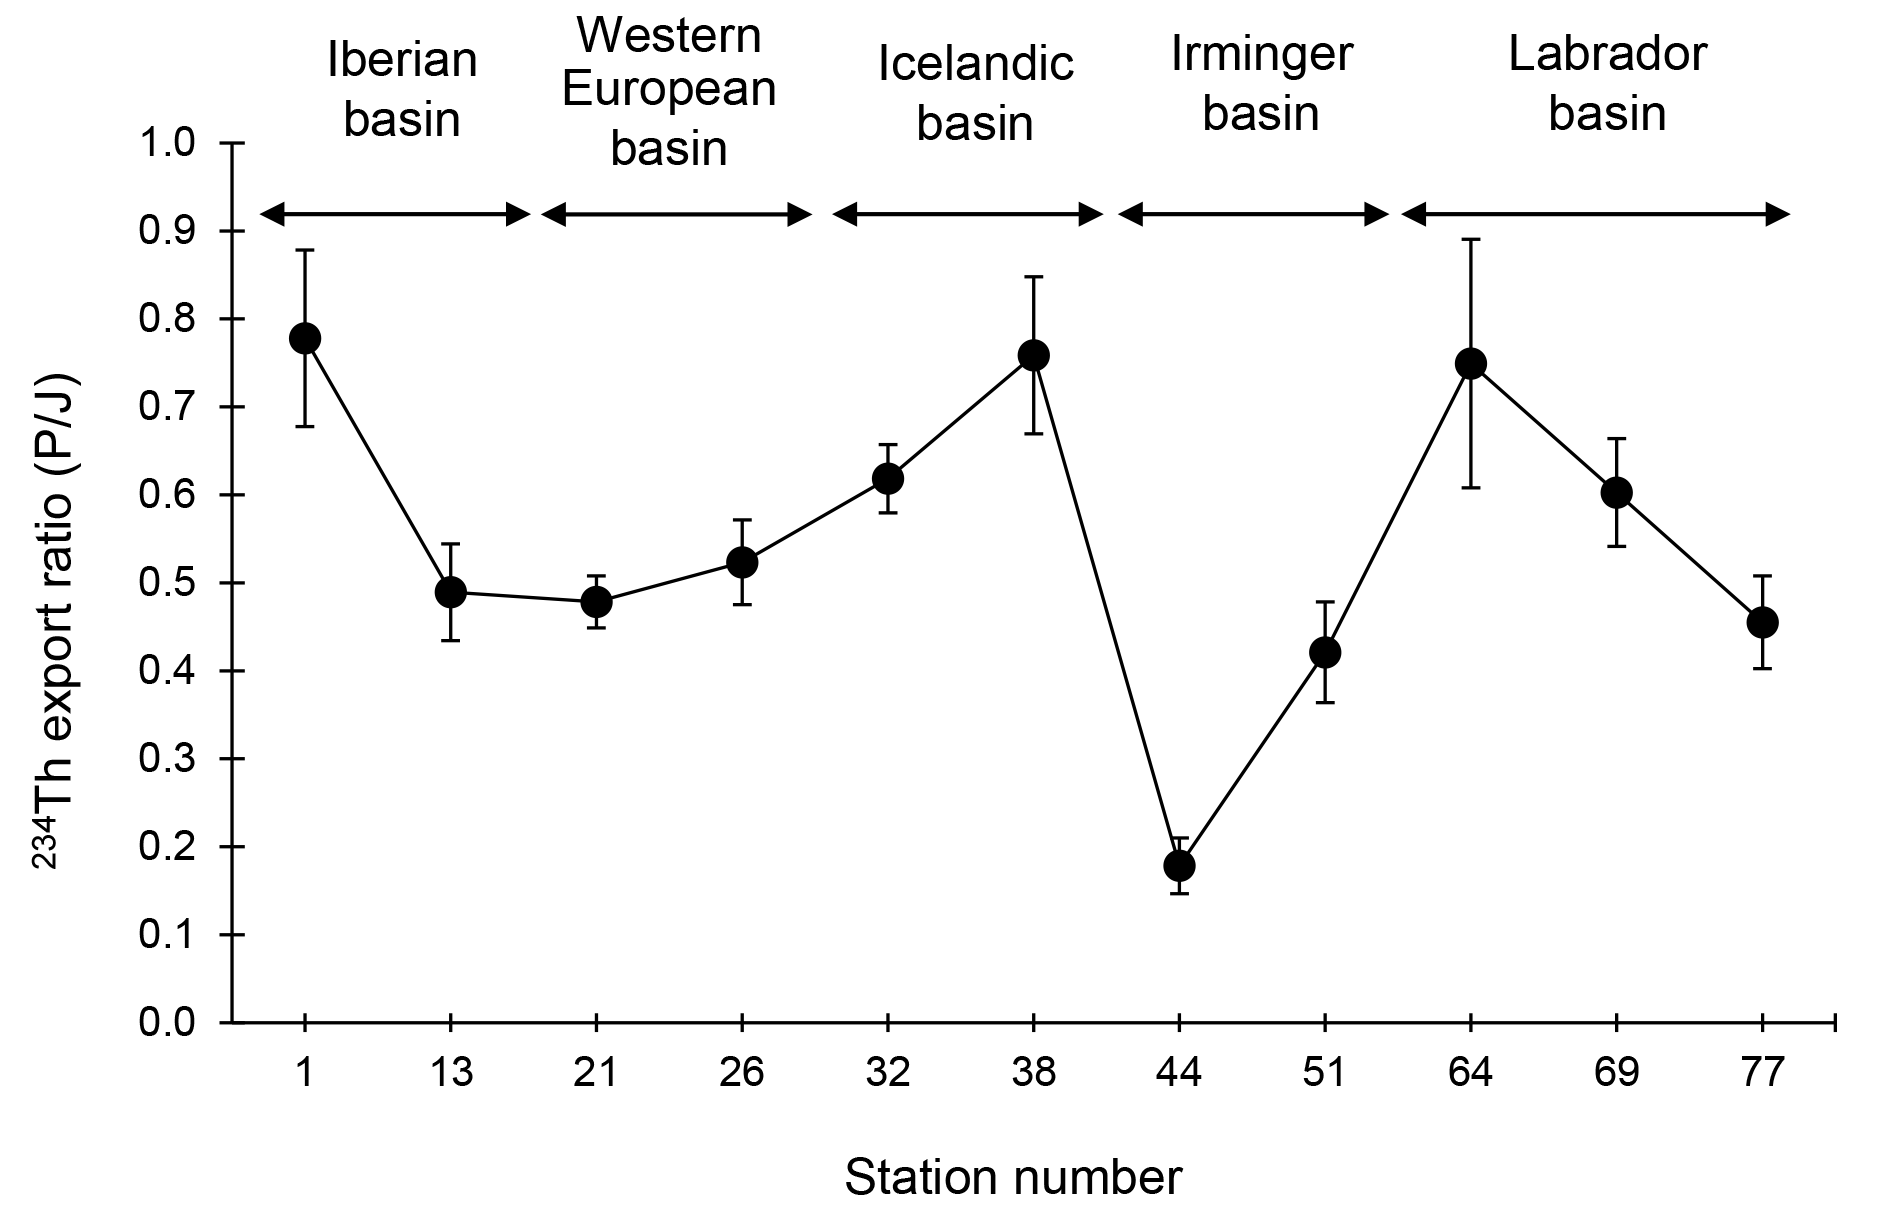
Figure 6Variability of the 234Th export ratio (i.e., the ratio of the 234Th export flux over the 234Th scavenged flux; P∕J ratio) along the GEOVIDE section.
Below Eq, significant excesses of 234Th relative to 238U (i.e., 234Th∕238U ratio >1.1) were observed at both stations, indicating particle degradation (Fig. 2). However, significant shallow remineralization was only observed at Station 13, where the R100 value was above uncertainty, reaching 410±218 dpm m−2 d−1 (Table 1). This represents a flux reduction of 30 % relative to the surface export flux.
Similarly, POC export fluxes varied between both stations with the highest (albeit with a strong associated error; 12 mmol m−2 d−1 at Station 1) and one of the lowest (2.2 mmol m−2 d−1 at Station 13) fluxes along the transect observed within this basin.
3.2 The western European basin (Stations 21 and 26)
During 2014, the western European basin was the most productive, with the highest PP peak observed at Station 21 (403 mmol m−2 d−1), 13 days before the sampling. At Station 26, the sampling took place during a secondary PP increase (Figs. 4 and 5). Altogether, sampling coincided with the bloom development in this basin, with in situ PP reaching 135 and 174 mmol m−2 d−1 at Stations 21 and 26, respectively (Table 3).
Along with high PP, relatively high surface POC concentrations and particulate 234Th activities were measured, averaging 3.7 µmol L−1 and 0.2 dpm L−1 for the LSF and 5.4 µmol L−1 and 0.5 dpm L−1 for the SSF (Table S2). For both size fractions, POC:234Th ratios were high in the upper water column, reaching a maximum of 30 µmol dpm−1 for the LSF in surface waters at Station 21 (Fig. 3). At the Eq depth, the POC:234Th ratios for the LSF were in the median of those determined along the transect (4.4 µmol dpm−1, n=11), nevertheless with a lower ratio at Station 21 (2.6 µmol dpm−1; Table 3).
The lowest 234Th∕238U ratios were observed in the surface waters of the western European basin, reaching minima of 0.57 and 0.77 at Stations 21 and 26, respectively (Fig. 2). Moreover, these low ratios were observed deeper in the water column compared to the other basins. The integration of the 234Th deficit from the surface to the Eq depth thus led to high 234Th export fluxes at both stations. The 234Th export flux at Station 21 was one of the highest observed along the transect, reaching 1873 dpm m−2 d−1 (Table 1). The 234Th scavenging fluxes were also among the highest observed along the transect, reaching 3917 and 2839 dpm m−2 d−1 at Stations 21 and 26, respectively (Table 1). The resulting export ratio (P∕J) was close to 0.5 for both stations, indicating a balanced situation between export and scavenging fluxes.
An excess of 234Th relative to the 238U below Eq was observed at both stations, with 234Th∕238U ratios reaching 1.14 at 300 m for Station 21 (Fig. 2; Table S1). Consequently, the R100 value at this station was significantly positive (360±255 dpm m−2 d−1; Table 1), representing a 20 % 234Th flux reduction.
Relatively high POC export fluxes at Eq were observed in the western European basin, reaching 4.8 and 7.9 mmol m−2 d−1 at Stations 21 and 26, respectively. For the same area, other studies reported similar POC export fluxes during May (Thomalla et al., 2008) and July–August (Lampitt et al., 2008; Le Moigne et al., 2013a). However, Buesseler et al. (1992) report much higher POC fluxes (up to 41 mmol m−2 d−1) for April–May during the North Atlantic Bloom Experiment, highlighting an important temporal variability of POC export flux in this basin (Fig. 7).
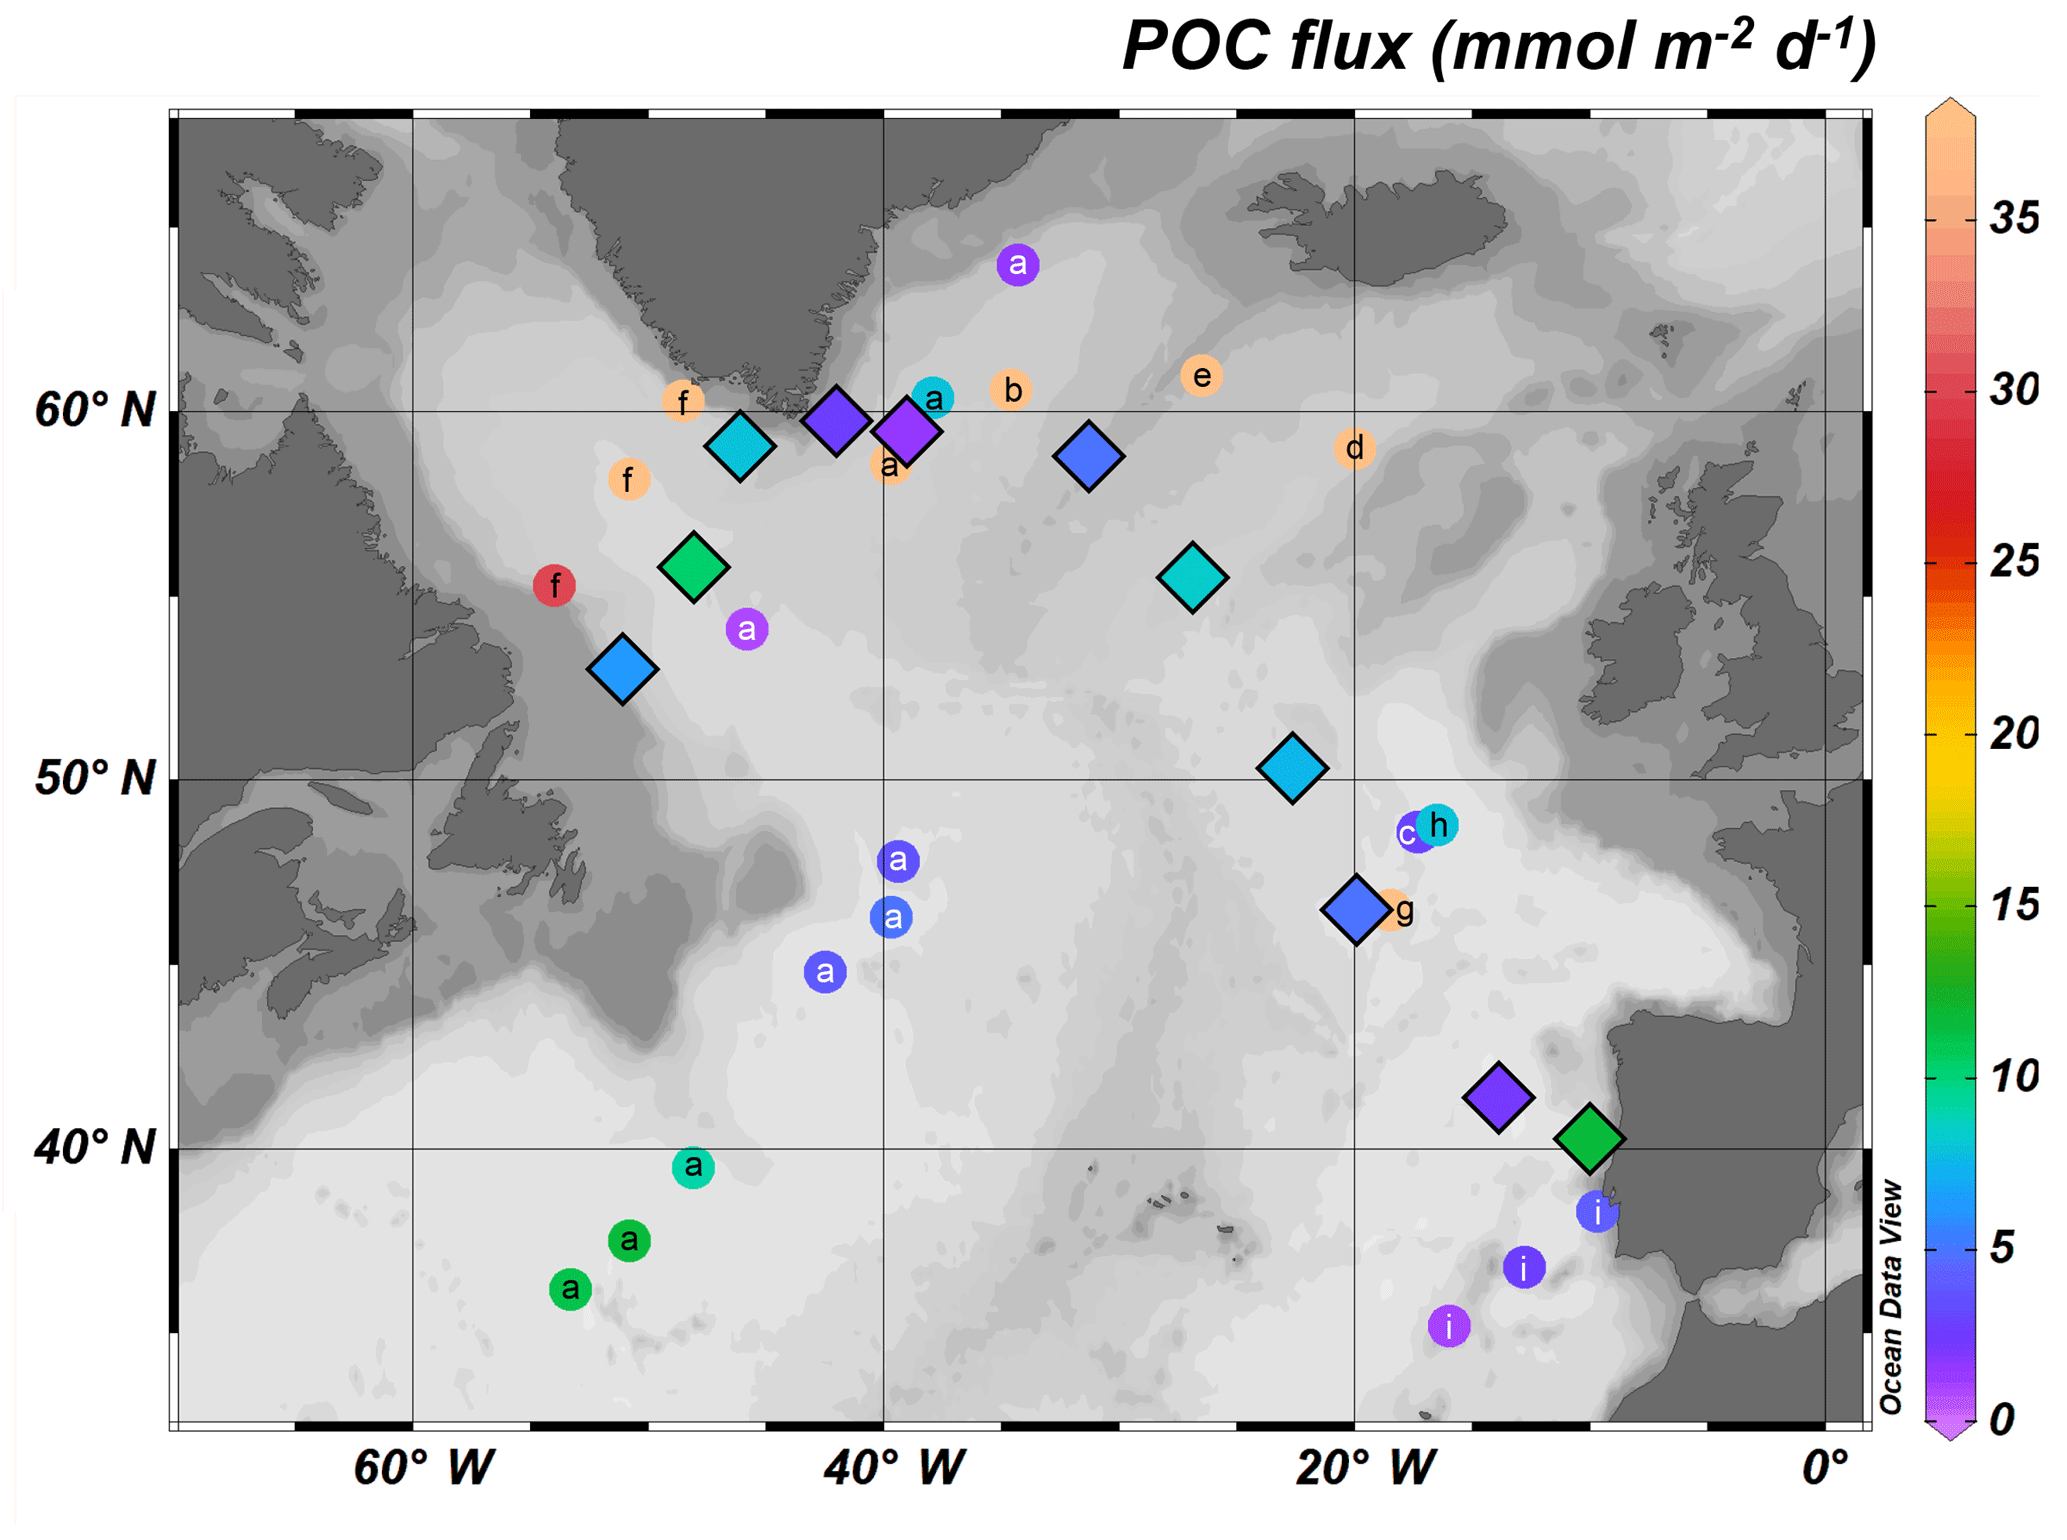
Figure 7Comparison of the POC export fluxes from this study (diamonds with black borders) with other 234Th-derived estimates of POC exports in the North Atlantic (a – Puigcorbé et al., 2017; b – Ceballos-Romero et al., 2016; c – Thomalla et al., 2008; d – Sanders et al., 2010; e – Martin et al., 2011; f – Moran et al., 2003; g – Buesseler et al., 1992; h – Le Moigne et al., 2013a; i – Owens et al., 2014).
3.3 The Icelandic basin (Stations 32 and 38)
In general, the different fluxes in the Icelandic basin presented similar characteristics to those in the western European basin.
The bloom period started in May, 1 month before the sampling, and the bloom maximum occurred after the cruise (Fig. 4). Nevertheless, the basin was highly productive at Station 32, with in situ PP reaching 105 mmol m−2 d−1, and was relatively productive at Station 38 (68 mmol m−2 d−1; Table 3 and Figs. 4 and 5).
POC concentrations and particulate 234Th activities were relatively high, but unlike the western European basin, the highest concentrations and activities were found in the SSF, reaching 5.8 µmol L−1 and 0.4 dpm L−1, respectively, at Station 32 (Table S2). For surface waters of both stations, POC:234Th ratios in the SSF exceeded those in the LSF (Fig. 3), but ratios were similar between the two size fractions at Eq depth (difference less than a factor of 1.1). The ratios extrapolated to Eq for the LSF were 3.6 and 4.2 µmol dpm−1 at Stations 32 and 38, respectively, and were in the median of the range along the transect (Table 3).
As for the western European basin, 234Th∕238U ratios were low, with Station 38 having the lowest value for the whole transect (0.50 in the surface; Fig. 2). Low ratios were also observed deeper in the water column, and the combination yielded the highest 234Th export fluxes at Eq, reaching 2282±119 dpm m−2 d−1 at Station 32 (Table 1). While the 234Th scavenging flux was high at Station 32, reaching 3690 dpm m−2 d−1, it was much lower at Station 38 (1495 dpm m−2 d−1; Table 1). The export ratios (P∕J) slightly exceeded the median value along the transect, reaching 0.62 and 0.76 at Stations 32 and 38, respectively. Despite similarities with the western European basin, the Icelandic basin appeared more efficient to export 234Th by sinking particles.
Below the Eq depth, there was no significant excess of 234Th relative to 238U, resulting in R100 values being close to or below uncertainty and indicating the absence of significant shallow remineralization.
One of the highest POC export fluxes along the transect was determined at Station 32, reaching 8.3 mmol m−2 d−1, while the POC flux at Station 38 was lower (4.8 mmol m−2 d−1). Such POC export fluxes are lower than most values reported in earlier studies, ranging from 6 to up to 52 mmol m−2 d−1, although Martin et al. (2011) reported a very low value of 0.8 mmol m−2 d−1 (Ceballos-Romero et al., 2016; Giering et al., 2016; Martin et al., 2011; Sanders et al., 2010; Fig. 7).
3.4 The Irminger basin (Stations 44 and 51)
The ship crossed the Irminger basin 1 month after the beginning of the bloom, and sampling occurred just 1 week (Station 44) to 3 weeks (Station 51) after the peak of the bloom (Fig. 4). At sampling time, the in situ PP was amongst the highest observed along the whole section, reaching 137 and 166 mmol m−2 d−1 at Stations 44 and 51, respectively. Such high values, in line with the satellite data, suggest that the bloom was still ongoing when visiting these two stations (Table 3 and Figs. 4 and 5).
POC concentrations and particulate 234Th activities were overall highest at these two stations, reaching 17 µmol L−1 and 1.2 dpm L−1 for the SSF and 4.0 µmol L−1 and 0.5 dpm L−1 for the LSF at Station 44, respectively (Table S2). POC:234Th ratios were moderate for both size fractions, reaching 14 µmol dpm−1 for the SSF at Station 44 and 12 µmol dpm−1 at Station 51 in the surface waters (Fig. 3). At the Eq depth, the extrapolated POC:234Th ratios were similar between both size fractions at Station 51 but were 1.7 times higher in the SSF at Station 44. The POC:234Th ratio at Eq in the LSF at Station 44 fit the median of the ranges determined along the transect, while the ratio at Station 51 was relatively lower (2.9 µmol dpm−1; Table 3).
The 234Th∕238U ratios in the surface waters were higher than at other stations, reaching minima of 0.79 and 0.78 at Stations 44 and 51, respectively. These low 234Th deficits were also restricted to the upper layer, especially at Station 44, where the Eq depth was 40 m (Fig. 2). The particulate 234Th (sum of the SFF and LSF) contribution to total 234Th ratios varied widely, from 27 % at Station 51 (in the median of those observed elsewhere along the transect) to 94 % at Station 44. The extremely high fraction of particulate 234Th at Station 44 reflects an important particle concentration in surface waters. On the other hand, this high particulate fraction in the upper layer did not induce a high export flux, since Station 44 had the lowest 234Th export flux (321±66 dpm m−2 d−1; Table 1) of all stations. As a result, scavenging fluxes were much higher in this basin, reaching 1802 and 2189 dpm m−2 d−1 at Stations 44 and 51, respectively. This leads to very low P∕J ratios in the Irminger basin (as low as 0.2 at Station 44), suggesting that the export of 234Th is particularly inefficient in this basin, in agreement with the low export flux and the high particulate fraction in the upper layer.
Below the Eq depth, there was no significant excess of 234Th relative to 238U, indicating no evidence for significant shallow remineralization, with R100 values being either negative or below uncertainty.
The Irminger basin was characterized by low POC export fluxes (1.4 and 2.7 mmol m−2 d−1 at Stations 44 and 51, respectively). In the literature, a relatively large range of POC export fluxes has been reported for this basin. Puigcorbé et al. (2017) observed POC export fluxes ranging from 1.5 to 43 mmol m−2 d−1. Ceballos-Romero et al. (2016) also determined much higher POC fluxes compared to those observed in the present study, with differences reaching factors of 27 and 19 for the month before and after our sampling, respectively (Fig. 7).
3.5 The Labrador basin (Stations 64, 69 and 77)
Stations of the Labrador basin were sampled approximately 1 month after the beginning of the bloom. Station 64 was sampled just after a second peak of the bloom, while Stations 69 and 77 were sampled 1 week after this peak (Fig. 4). At sampling time, the in situ PP was low in the Labrador basin, ranging from 27 to 80 mmol m−2 d−1 at Stations 69 and 77, respectively (Table 3). In agreement with the satellite data shown in Fig. 4, this indicates that the decline of the bloom was ongoing in the Labrador basin.
POC concentrations and particulate 234Th activities were moderate to low, except at Station 77, where values were higher in the surface, reaching 11 µmol L−1 and 0.45 dpm L−1 for the SSF, and 3.0 µmol L−1 and 0.20 dpm L−1 for the LSF. Moderate POC:234Th ratios were observed in both size fractions, except in the upper layer at Station 77, where SSF POC:234Th ratios were high (Fig. 3). At the Eq depth, POC:234Th ratios were similar in the two size fractions and reached 9.2, 14 and 8.8 µmol dpm−1 at Stations 64, 69 and 77, respectively. Interestingly, these ratios are higher than the median ratio determined along the transect.
The surface 234Th∕238U ratios were in the median of those observed along the transect (0.74±0.06, n=8), with minima of 0.78, 0.66 and 0.73 at Stations 64, 69 and 77, respectively. These 234Th deficits were nevertheless observed in a relatively shallow layer (Eq depths between 40 and 80 m in this basin; Fig. 2). Stations 64 and 69 were also characterized by a low particulate 234Th activity (combined LSF and SSF) accounting for 10 % and 15 % of the total 234Th activity in agreement with the relatively low POC concentrations observed at these stations. The 234Th export flux at Station 64 was slightly greater than those of Stations 69 and 77, but in general, the 234Th export fluxes of the Labrador basin were moderate, averaging 758 dpm m−2 d−1 (Table 1). 234Th scavenging fluxes were also generally low in the Labrador basin, but again, there was a slightly lower scavenging flux at Station 64 (Table 1). A higher export ratio was thus estimated at Station 64 (P∕J ratio = 0.75), suggesting a more efficient export close to the Greenland Margin compared to Stations 69 and 77 (Fig. 6).
Below Eq, there was a significant excess of 234Th relative to 238U at Stations 69 and 77, reaching 1.08 and 1.11, respectively. Evidence for shallow remineralization was also clear from the R100 values exceeding uncertainties (Station 69, R100 = 401±159 dpm m−2 d−1 and Station 77, R100 = 252±165 dpm m−2 d−1; Table 1). The flux reductions due to remineralization below Eq were 50 % and 40 % of the fluxes at Eq, respectively.
High POC exports were observed within the Labrador basin, in particular at Station 69, where the POC export flux reached 10 mmol m−2 d−1. As for the Irminger basin, Puigcorbé et al. (2017) determined a low POC export (0.7 mmol m−2 d−1) in May, 1 month before our sampling period, while Moran et al. (2003) observed higher fluxes reaching 47 mmol m−2 d−1 in July, 1 month after our sampling period (Fig. 7).
In the following section, we first discuss the potential impact of the physics and the non-steady-state conditions on the 234Th export flux estimations. Then, temporal and regional variations of the carbon export fluxes are discussed with respect to the intensity and stage of the bloom, the phytoplankton size structure and the phytoplankton community. Finally, we examine carbon export and transfer efficiencies along the transect.
4.1 Validity of the export estimations
4.1.1 234Th export fluxes under the potential influence of physical conditions
The GEOVIDE section sampled a diversity of dynamic regimes (Zunino et al., 2017), including continental margins affected by strong zonal surface currents (LC, WGC and EGC; Mercier et al., 2015; Reverdin et al., 2003), local and seasonal upwelling (close to the Iberian Margin), and the deep convection zone in the Labrador Sea. In such conditions, Eq. (3), which assumes negligible lateral and vertical advective and diffusive fluxes, may not always be appropriate (Savoye et al., 2006). Whenever possible, we explore, quantitatively or qualitatively, the potential errors arising from neglecting physical transport in our calculation.
Lateral processes associated with high-velocity currents and intense mesoscale activity are known to affect the 234Th distribution (Benitez-Nelson et al., 2000; Resplandy et al., 2012; Roca-Marti et al., 2016b; Savoye et al., 2006). In our case, this may concern several stations located at or close to margins such as Stations 51 and 64, which were respectively subject to the powerful East and West Greenland Currents at the Greenland Margin, Station 77 under the influence of the LC on the Newfoundland Margin and Station 1 under influence of the Portugal Current at the Iberian Margin (Fig. 1). However, the impact of lateral advection cannot be quantified from our dataset, as the possible horizontal gradients of 234Th cannot be resolved at sufficient resolution. As an alternative, we compare stations close to each other, such as Stations 44 and 51, both located in the Irminger Basin, where surface currents are strong. The Irminger basin in spring is a really patchy and dynamic area (Ceballos-Romero et al., 2016; Le Moigne et al., 2012; Puigcorbé et al., 2017), but the relatively high variability of the 234Th fluxes found at these two stations (321 and 922 dpm m−2 d−1, respectively) may also indicate a potential influence of lateral advection. The higher export flux at Station 51 could reflect an input of 234Th-depleted waters originating from the Arctic and/or the Greenland shelf. However, Arctic (Cai et al., 2010; Roca-Marti et al., 2016a) and Greenland shelf waters (Station 53, see Table S1) reveal very limited depletions of 234Th relative to 238U. Thus, it is reasonable to consider that the 234Th deficit at Station 51 was essentially driven by vertical rather than horizontal processes.
Hydrodynamic processes could also impact open ocean sites, such as stations within the western European and Icelandic basins (Stations 26 and 32) that are subjected to mesoscale activity. An inverse modeling study carried out for the Porcupine Abyssal Plain located in the same region suggests that the vertical transport of 234Th associated with small-scale structures could represent up to 20 % of the estimated vertical export flux (Resplandy et al., 2012). This error is larger than our analytical uncertainty and should be kept in mind when considering the export flux data in this area.
In upwelling systems, the contribution of vertical advection on the 234Th distribution has been shown to be important (Buesseler, 1998; Buesseler et al., 1995). Near the Portuguese coast, the intensity of the upwelling is seasonally dependent (Costa Goela et al., 2016; Zúñiga et al., 2016) and was rather inactive at the time of the GEOVIDE cruise (http://marine.copernicus.eu/, last access: 25 September 2018). Therefore, the input of 234Th-rich deep waters to the surface is likely to be limited, as already observed in the northern Iberian Margin in early summer (Hall et al., 2000). Downwelling systems, such as the intense convection that occurred in the Labrador basin during the winter prior to our sampling (Kieke and Yashayaev, 2015), are also likely to impact the 234Th distribution. However, a strong vertical advection would homogenize the 234Th activities in the water column, which is not the case during our study (Fig. 2). Moreover, this convection ended more than 2 months before our sampling, a time lag that largely exceeds the 234Th half-life, thereby erasing any potential impact on the 234Th signal. Therefore, the influence of vertical advection on 234Th export fluxes was neglected.
Finally, the contribution of the vertical diffusion was estimated using the vertical gradients of total 234Th activity in upper waters and a Kz value ranging between 10−4 and 10−5 m2 s−1, as observed in the upper 1000 m between Portugal and Greenland along the OVIDE transect (Ferron et al., 2014). The highest vertical diffusive flux was determined at Station 69 and reached 181 dpm m−2 d−1, which is in the range of the 234Th flux uncertainties. Therefore, the impact of the vertical diffusion has not been considered further.
In conclusion, hydrodynamic processes are likely to have a limited impact on the measured 234Th export fluxes at most.
4.1.2 Accounting for non-steady-state conditions
As the cruise sampling scheme did not allow for the collection of samples through a time series, it was necessary to assume steady-state conditions (i.e., no variation of 234Th activity with time). However, as documented in previous studies in the western European and Icelandic basins (Buesseler et al., 1992; Martin et al., 2011), this assumption can be questioned, as large variations of 234Th activity were observed at a timescale of 1–3 weeks along with the onset of the seasonal biological productivity. As a consequence, the SS model was shown to poorly describe the magnitude of the 234Th export flux, leading to differences with the NSS model of up to a factor of 3 (Buesseler et al., 1992; Martin et al., 2011).
During the weeks preceding GEOVIDE, large changes in satellite-derived PP were observed (Fig. 4). In order to evaluate the potential error introduced by the SS approach, we attempted to apply a NSS model (see Sect. 2.3; Eq. 4).
The western European and Icelandic basins had the highest NSS 234Th fluxes (3540 dpm m−2 d−1 at Station 32), while the Irminger basin had the lowest (516 dpm m−2 d−1 at Station 44; Table 1). The NSS 234Th fluxes were either larger or similar to those obtained using the SS model. This results from the fact that the NSS approach used here assumes that the observed 234Th activity changes only reflect a linear decrease from an initial 234Th activity in secular equilibrium with 238U over the time elapsed since the onset of the bloom (Δt; see Sect. 2.3). For stations sampled shortly after the start of the bloom, such as in the Irminger, Icelandic and Labrador basins (Δt ranges from 23 to 43 days), the fluxes predicted by the NSS model are 1.4 to 2.1 times higher than the SS fluxes. In the western European and Iberian basins, this difference is reduced (NSS fluxes are 1.1 to 1.3 times higher) due to a larger Δt, ranging from 48 to 78 days.
In conclusion, the SS export fluxes may have underestimated 234Th export fluxes at some stations by a maximum factor of 2, such as in the Icelandic basin. Yet, we need to keep in mind that this NSS approach has limitations by assuming the equilibrium between 234Th and 238U at the bloom start and by considering only an increasing deficit of 234Th activity over a given time period (Δt).
4.2 Influence of the intensity and stage of the bloom on POC exports
The GEOVIDE cruise was carried out in late spring (May–June), a period during which the productivity and the carbon export can be important (Sanders et al., 2014). The 234Th proxy integrates the activity deficits over a timescale of several weeks preceding the sampling, and it thus appears essential to compare the sampling time in light of the bloom development.
Apart from Stations 1 and 13, which were sampled after the bloom, the different basins were sampled during the spring bloom, but at different stages. One of the lowest POC export fluxes was determined at Station 13 in the Iberian basin, where the intensity of the bloom remained rather low during the whole productive period prior to the sampling date (seasonal VGPM-PP is 81 mmol m−2 d−1; Fig. 5) due to oligotrophic conditions (depleted nutrients; Fonseca-Batista et al., 2018). In contrast, the highest POC export flux was determined at Station 1, which is also in the Iberian basin. Station 1 was sampled after the bloom period, and satellite-data showed that this station was relatively productive in the early spring (185 mmol m−2 d−1 in March; Fig. 4). This greater POC export observed when the bloom had already declined may be caused by an ecosystem change, as already described in the Southern Ocean with the emergence of silicified diatoms because of nutrient stress (e.g., Baines et al., 2010; Claquin et al., 2002).
High POC export fluxes were also observed for the western European and Icelandic basins sampled during the bloom. PP appeared maximal just before the sampling in the western European basin (Figs. 4 and 5) and could have promoted these high POC exports. Within the Icelandic basin, both stations were sampled during the productive period, although the peak of the bloom was not yet reached (Fig. 4), suggesting that the export maximum might have occurred later in the season. Both basins have been previously characterized by the presence of fast-sinking particles during the bloom (data from cruises in Spring 2012 and Summer 2009; Villa-Alfageme et al., 2016), promoting the high POC export fluxes.
The Irminger basin was sampled close to the bloom maximum, but unlike the western European and Icelandic basins, the POC export flux was low there, probably reflecting the accumulation of biomass preceding export. Indeed, this area had the highest in situ PP, a high proportion of particulate 234Th in surface waters (reaching 94 % of the total 234Th activity at Station 44) and a very low P∕J ratio, indicating that 234Th was retained in the upper waters rather than being exported (Fig. 6; Table 1).
The Labrador basin was sampled just shortly after the peak of PP and was characterized by low in situ PP and low nutrient concentrations, indicating the beginning of the decline of the bloom. The combination of the important PP a few weeks before our sampling (Figs. 4 and 5) and the decline of the bloom likely triggered the high POC export fluxes, as observed elsewhere (Martin et al., 2011; Roca-Marti et al., 2016b; Stange et al., 2016).
Overall, the magnitude of the POC export appears to depend on the degree of progress of the bloom. Indeed, the negative relationship found between the POC export fluxes and the in situ PP relative to the maximal VGPM-PP along the season, representing the bloom stage, highlights that the highest export occurs in post-bloom periods (Fig. 8), as also evidenced from deep sediment trap studies (Lampitt et al., 2010), and is driven by large and rapidly sinking aggregates (Lampitt et al., 2001; Turner and Millward, 2002).

Figure 8Percentage of the in situ primary productivity (PP) relative to the maximal VGPM-PP in the season (%max, or percent maximum, seasonal primary productivity in the function of the POC export fluxes at the Eq depth. The %max seasonal primary productivity illustrates the stage of the bloom (i.e., a %max seasonal primary productivity equalling 100 % corresponds to a sampling time at the bloom peak). This relationship is significant when not taking into account the stations sampled between two PP peaks (Stations 26, 32 and 38; see Fig. 4): R2=0.77 and p-value < 0.01. The in situ PP measured at sampling time is indicated with the colors in order to indicate the bloom intensity. The dominating phytoplankton community is also shown, with circles indicating microphytoplankton dominance (with a majority of diatoms), triangles indicating nanophytoplankton dominance (with a majority of haptophytes) and diamonds indicating picophytoplankton dominance (with a majority of cyanobacteria). Note that Station 1 is represented by a star because of the mixed proportion of micro-, nano- and picophytoplankton.
4.3 Influence of the phytoplankton size and community structure on POC exports
In the North Atlantic, the phytoplankton composition varies significantly, depending on the stage of the bloom and on the evolution of environmental parameters such as micro- and macro-nutrient concentrations or stratification depth (Moore et al., 2005). Spatial variations in phytoplankton size structure are known to exert a control on the magnitude of the POC export flux (Boyd and Newton, 1999), and high POC exports are usually related to a greater size of the sinking phytoplankton cells (Alldredge and Silver, 1988; Guidi et al., 2009).
Within the Iberian basin, the highest abundance of picophytoplankton was observed at Station 13 (Tonnard et al., 2018). These conditions are typical of the subtropical and oligotrophic waters (Dortch and Packard, 1989). Villa-Alfageme et al. (2016) highlighted that small cells are usually slow-sinking particles that can be easily remineralized in the upper layers. A small sinking velocity (<100 m d−1) allows time for bacteria and zooplankton to degrade such particles, thus reducing the export flux. For the same area, Owens et al. (2014) also report a low flux later in October, confirming a lower carbon export in general in this oligotrophic area. However, Station 1 was characterized by a greater POC export that could be related to the mixed proportion of micro-, nano- and picophytoplankton and thus to the greater proportion of larger cells such as diatoms or haptophytes, increasing the particle sinking velocity. The greater POC export there may also be related to the proximity to the margin, where particle dynamics are intense and lithogenic particles are numerous (Gourain et al., 2018).
At higher latitudes, particle sinking velocity has been reported to be high (>100 m d−1; Villa-Alfageme et al., 2016), as cells generally are of a larger size. Microphytoplankton, with the dominance of diatoms, represented an important fraction of the phytoplankton community in the western European, Irminger and Labrador basins, and the dense frustules of diatoms have been reported to act as ballast for the sinking organic matter (Klaas and Archer, 2002). Fast-sinking particles could have promoted the relatively high POC export fluxes in those basins. However, in the Icelandic basin, the dominance of nanophytoplankton coincided with relatively high POC export. Both stations in the Icelandic basin were dominated by haptophytes, including coccolithophorids (Tonnard et al., 2018). Despite their smaller size, the dense calcium carbonate shells of the latter could promote the export of POC (Francois et al., 2002; Lam et al., 2011).
Our results suggest that high POC export fluxes can be mediated through either micro- or nanophytoplankton species, suggesting that the sinking velocity is influenced by other parameters than the size, likely their composition and density (Fig. 8).
4.4 Export and transfer efficiencies of POC
In order to characterize the strength of the biological carbon pump, we used two parameters: the export efficiency (ThE), which is the ratio of the POC export flux at Eq over the PP (Buesseler, 1998), and the transfer efficiency (T100), which is the ratio of the POC export flux at 100 m below Eq over the POC export flux at Eq (Fig. 9). Note that the POC export flux at Eq+100 (Table 3) was calculated by multiplying the 234Th flux at Eq+100 by the ratio of POC to 234Th of large particles for the same depth. The POC:234Th ratio at Eq+100 was deduced from a power-law fit (Fig. 3).
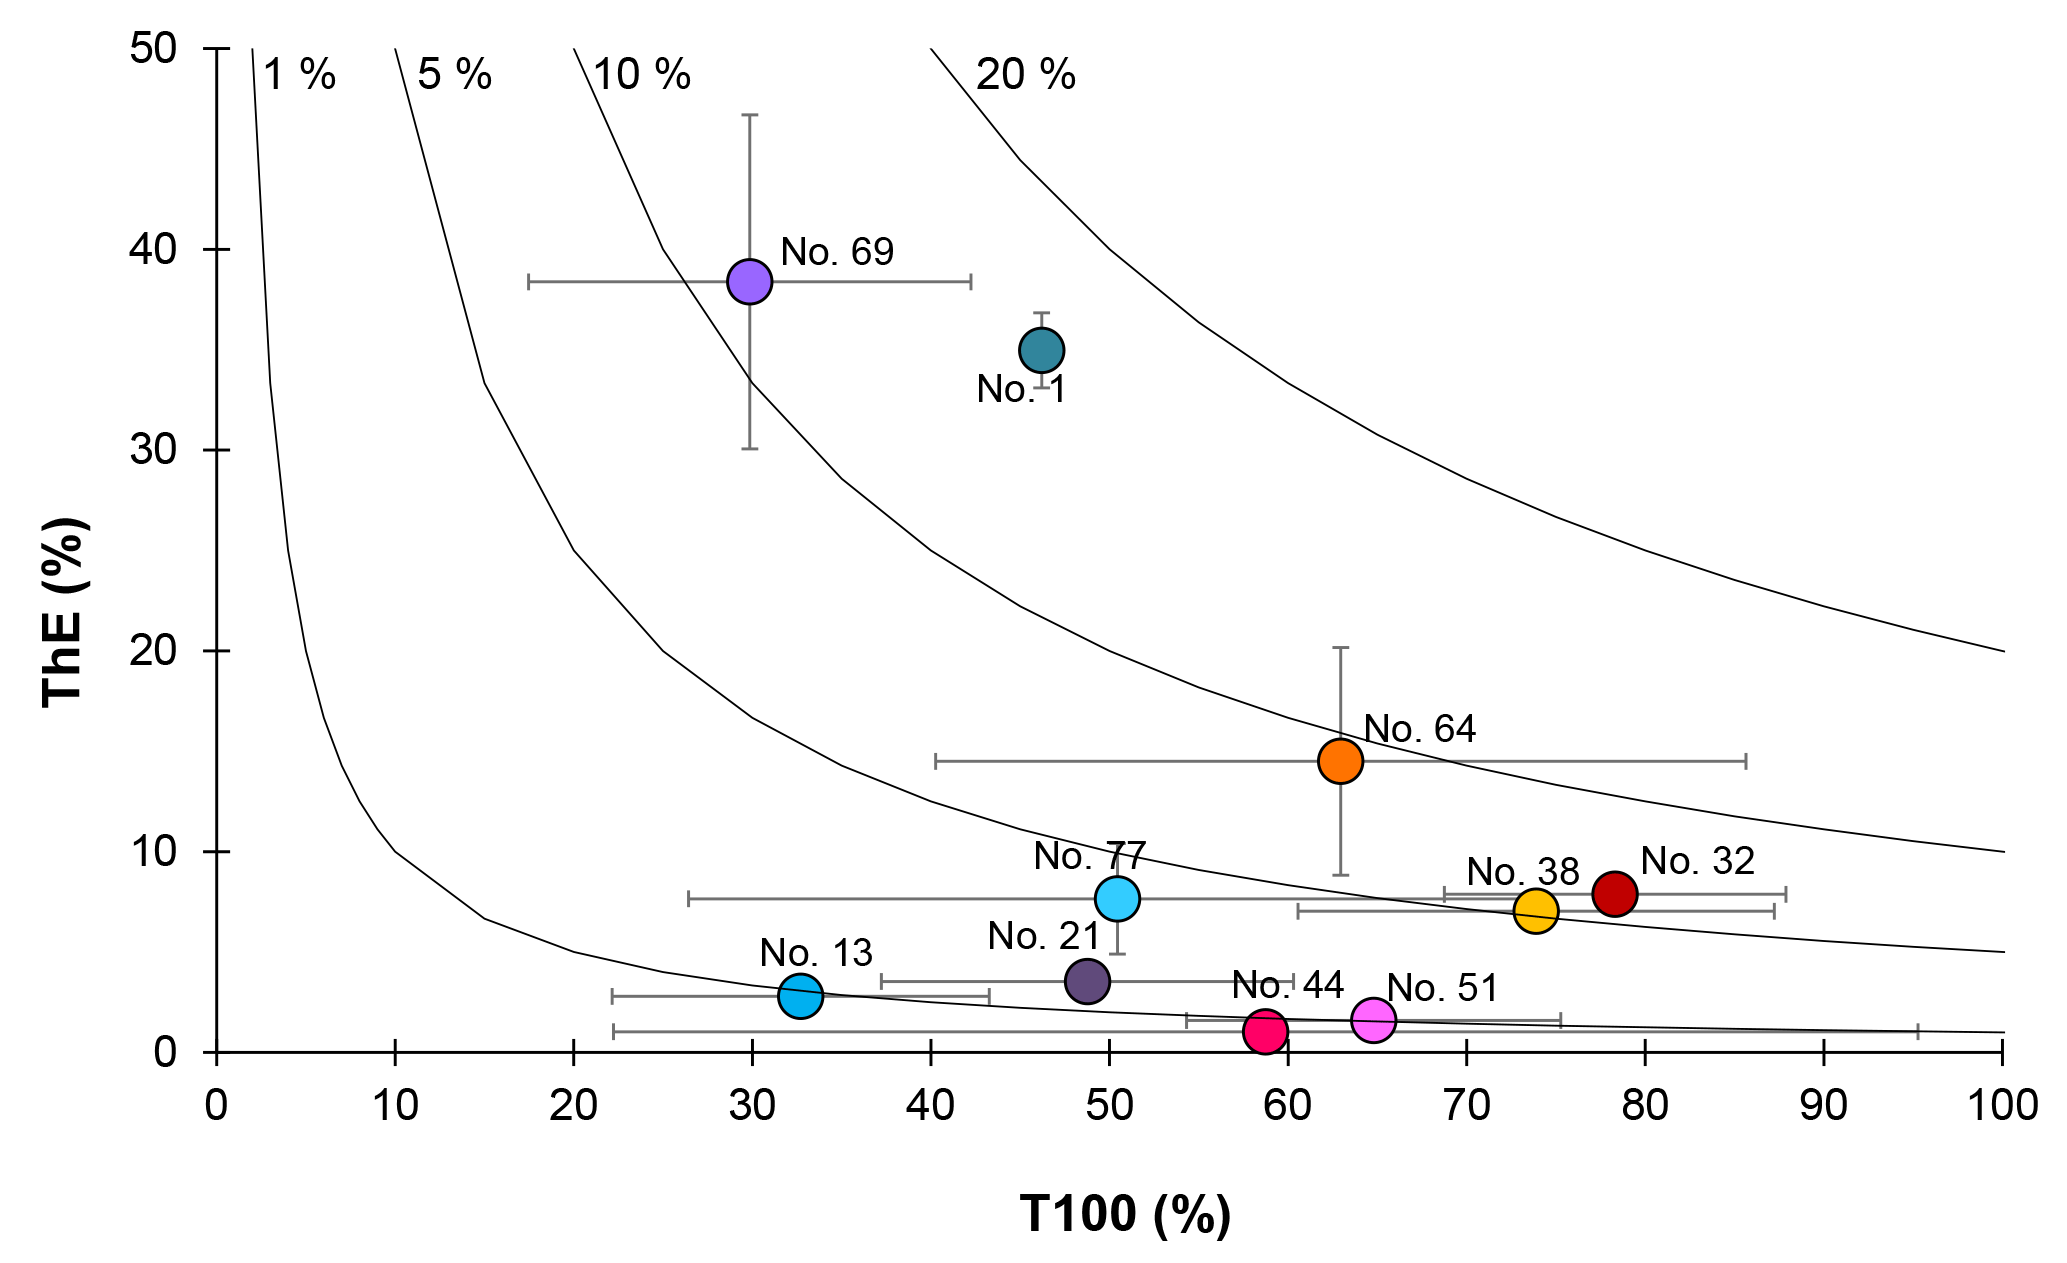
Figure 9Export efficiency (ThE = Export at Eq∕in situ PP) versus transfer efficiency (T100 = Export flux at flux at Eq). The black lines represent the modelled 1 %, 5 %, 10 % and 20 % of PP exported to depths m.
Based on in situ PP values (Table 3), ThE ranged from 1 % (Station 44) to 38 % (Station 69), with a median value of 7 % along the transect. The highest export efficiencies were determined at Stations 1 and 69, with values reaching 35 % and 38 %, respectively. Other stations were characterized by ThE≤14 %, with highest values (7 %–14 %) at Stations 32, 38, 64 and 77. Export efficiencies around 10 % are common in the open ocean (Buesseler, 1998). A lower export efficiency can be related to important microbial and zooplankton grazing activities or to biomass accumulation in surface waters (Planchon et al., 2013, 2015). A high ThE can result from many factors, such as the presence of large and/or dense and fast-sinking particles, low surface remineralization, active zooplankton migration, or nutrient stress (Ceballos-Romero et al., 2016; Le Moigne et al., 2016; Planchon et al., 2013). Interestingly, stations with the highest ThE were also characterized by the lowest PP (Stations 1 and 69), while stations with the lowest ThE were characterized by the highest PP (Stations 44 and 51). This inverse relationship between PP and ThE was significant for all stations of the GEOVIDE cruise (regression slope of −0.20; r2=0.58; p<0.01; n=11; Fig. S2) and has been explained in the Southern Ocean by the temporal decoupling between PP and export due to biomass accumulation in surface waters (Henson et al., 2015; Planchon et al., 2013) as well as by other processes such as zooplankton grazing and bacterial activity (Maiti et al., 2013; Le Moigne et al., 2016; Roca-Marti et al., 2016a). Such particle recycling has also been observed in the North Atlantic (Collins et al., 2015; Giering et al., 2014; Marsay et al., 2015), limiting POC export to the deep ocean. A recent study in the Icelandic and Irminger basins highlights the impact of the bloom dynamics on the particle export efficiency, resulting in strong seasonal variability of the ThE (Ceballos-Romero et al., 2016). Our estimates are generally in the lower range of export efficiencies reported by others for the North Atlantic, with values ranging from 1 % to 42 % in the western European basin (Buesseler et al., 1992; Lampitt et al., 2008; Thomalla et al., 2008), from 5 % to 8 % in the Icelandic basin (Ceballos-Romero et al., 2016), from 4 % to 16 % in the Irminger basin (Ceballos-Romero et al., 2016) and from 4 % to >100 % in the Labrador basin (Moran et al., 2003). This wide range confirms that export efficiencies are highly variable in the North Atlantic in late spring. The overall low export efficiency of the North Atlantic is characteristic of highly productive areas in the world's ocean.
However, it should be kept in mind that the ThE calculation is based on two parameters that are integrating processes over different timescales: 24 h for in situ PP and several weeks for export. The strong variability of PP during this longer period would highly impact the ThE ratio. Therefore, ThE ratios were also estimated using the VGPM-derived 8-day, 32-day and seasonal PP (Table 3). As seen in Sect. 2.7, there are no significant differences between the VGPM-PP estimates regardless of the integrations times, and there are thus no significant differences between the corresponding ThE values. Stations 1 and 69 are exceptions, with ThE values decreasing from 35 % to 12 % and from 38 % to 8 %, respectively, due to the unusually low in situ PP during our study that led to overestimated ThE.
Carbon transfer efficiencies (T100) ranged from 30 % (Station 69) to 78 % (Station 32). Generally, the fluxes at these greater depths were characterized by greater error bars (see Fig. 9) due to the increasing uncertainty of the 234Th fluxes with increasing depth. The highest T100 were observed within the Icelandic basin, with values reaching 78 % and 74 % at Stations 32 and 38, respectively. On the contrary, the lowest T100 values were observed at Stations 1, 13, 21 and 69 (between 30 % and 49 %), highlighting greater carbon remineralization between Eq and Eq+100 m at these latter stations as well as confirming the important regional variability of the transfer efficiency, as also reported by others (Lam et al., 2011; Lutz et al., 2002). The low T100 (and high R100) values observed in the eastern part of the transect (Stations 1, 13, and to a lesser extent, Station 21) likely reflect important bacterial activity in these warmer waters (>13 ∘C in the upper 100 m; Iversen and Ploug, 2013; Marsay et al., 2015; Rivkin and Legendre, 2001), efficiently degrading the probably slow-sinking particles. Such recycling is characteristic for regeneration-based microbial food webs in oligotrophic regimes (Karl, 1999; Thomalla et al., 2006). In the Icelandic basin, the high T100 may be related to the large abundance of coccolithophorids (Tonnard et al., 2018), known to enhance the POC transfer due to their ballasting effect (Francois et al., 2002; Lam et al., 2011). Indeed, Bach et al. (2016) found that a bloom of coccolithophorids can increase the transfer efficiency through the mesopelagic layer by 14 %–24 %. Finally, the Labrador and Irminger basins exhibit relatively similar T100 (between 50 % and 69%), except at Station 69, where the lowest T100 was observed. This is also in agreement with the highest R100 and carbon remineralization flux determined with the Baxs proxy (Lemaitre et al., 2018). The central Labrador basin, in proximity to Station 69, was characterized by the strong subduction of the LSW during the winter preceding the GEOVIDE cruise. This downwelling could have promoted an important organic matter export leading to important prokaryotic heterotrophic activity in mesopelagic waters. This enhanced remineralization was still observed during GEOVIDE as traced by a large mesopelagic Baxs content (Lemaitre et al., 2018).
Overall, POC export varied by a factor of ∼9 along the transect, highlighting an important spatial variation. POC flux results obtained from other studies in the North Atlantic range from similar to up to 27 times larger values, with rapid changes over a 1-month duration, confirming the large temporal variability of the POC export fluxes.
The magnitude of the POC export seems to be associated with the state of the bloom. The accumulation of biomass in surface waters during the bloom may induce a limitation of the POC export flux, while during the post-bloom period, increasing numbers of rapidly sinking particles increase POC export.
The magnitude of the fluxes also seems related to the phytoplankton size and community structure. One of the lowest POC export fluxes was found at the stations where picophytoplankton dominated the community. In contrast, the areas composed by micro- and nanophytoplankton were characterized by high POC export fluxes. These areas were dominated by diatoms or coccolithophorids, known to strongly ballast the POC export fluxes. This suggests that the size as well as the composition and density of the particles likely play an important role on the particulate sinking velocities and thus on the magnitude of the POC export fluxes.
For most stations, the fraction of primary production that is exported from the surface zone (export efficiency) was ≤14 %, which is in agreement with the global ocean export efficiency (∼10 %; Buesseler, 1998). Export efficiency was also inversely related to primary production, indicating that, during our study, the North Atlantic behaved like most of the highly productive areas of the world's ocean, with a low export efficiency. Finally, the fraction of POC that is not remineralized in the mesopelagic zone (transfer efficiency) fits within the range of measured transfer efficiencies reported elsewhere (e.g., Black et al., 2017; Buesseler and Boyd, 2009). The highest transfer efficiencies were determined at the stations where coccolithophorids dominated.
Underlying data are reported in the Supplement.
The supplement related to this article is available online at: https://doi.org/10.5194/bg-15-6417-2018-supplement.
FP, HP, FD and GS conceived of the project and wrote the proposals that funded this work. NL, FP and YT collected the total Thorium-234 and particulate organic carbon and particulate Thorium-234 samples at sea. NL performed the total Thorium-234 and particulate analyses, except those on GFF filters, which were done by CM. FD, DFB, AR and FD collected the samples, performed the analyses and the calculations to obtain the primary production data. NL drafted the manuscript, which was edited by all the authors.
The authors declare that they have no conflict of interest.
This article is part of the special issue “GEOVIDE, an international GEOTRACES study along the OVIDE section in the North Atlantic and in the Labrador Sea (GA01)”. It is not associated with a conference.
We would like to thank the captain and the crew of the R/V Pourquoi Pas?, the chief scientists Pascale Lherminier and Géraldine Sarthou as well as Fabien Perault and Emmanuel De Saint Léger (CNRS DT-INSU), Pierre Branellec, Michel Hamon, Catherine Kermabon, Philippe Le Bot, Stéphane Leizour and Olivier Ménage (Laboratoire d'Océanographie Physique et Spatiale) for their technical expertise during ISP and CTD deployments and Catherine Schmechtig for the GEOVIDE database management. We also acknowledge Emilie Grossteffan, Manon Le Goff, Morgane Galinari and Paul Tréguer for the analysis of nutrients. Special thanks to Maxi Castrillejo (UAB, Spain), Catherine Jeandel (LEGOS, France), Virginie Sanial (WHOI, USA), Raphaëlle Sauzède (LOV, France) and Lorna Foliot (LSCE, France) for their help at sea and for the ISP coordination. We would also like to thank Phoebe Lam for providing two modified McLane ISP. Laurence Monin (MRAC, Belgium), David Verstraeten, Claire Mourgues and Martine Leermarkers (VUB, Belgium) greatly helped during sample processing and element analysis by ICP-MS and EA-IRMS. Audrey Plante (ULB, Belgium) and Emilie Le Roy (LEGOS, France) assisted with the counting of the residual Thorium-234 activities. Satellite primary production data and visualizations used in this study were produced with the Ocean Productivity website at Oregon State University.
This work was funded by the Flanders Research Foundation (project G071512N),
the Vrije Universiteit Brussel (Strategic Research Program, project SRP-2),
the French ANR Blanc GEOVIDE (ANR-13-BS06-0014), ANR RPDOC BITMAP
(ANR-12-PDOC-0025-01), IFREMER, CNRS-INSU (programme LEFE), INSU OPTIMISP and
Labex-Mer (ANR-10-LABX-19).
Edited by: Gilles
Reverdin
Reviewed by: two anonymous referees
Alldredge, A. L. and Silver, M. W.: Characteristics, dynamics and significance of marine snow, Prog. Oceanogr., 20, 41–82, 1988.
Aminot, A. and Kérouel, R.: Dosage automatique des nutriments dans les eaux marines: méthodes en flux continu, Editions Ifremer-Quae, France, 2007.
Bach, L. T., Boxhammer, T., Larsen, A., Hildebrandt, N., Schulz, K. G., and Riebesell, U.: Influence of plankton community structure on the sinking velocity of marine aggregates, Global Biogeochem. Cy., 30, 1145–1165, https://doi.org/10.1002/2016GB005372, 2016.
Baines, S. B., Twining, B. S., Brzezinski, M. A., Nelson, D. M., and Fisher, N. S.: Causes and biogeochemical implications of regional differences in silicification of marine diatoms, Global Biogeochem. Cy., 24, 1–15, https://doi.org/10.1029/2010GB003856, 2010.
Behrenfeld, M. and Falkowski, P. G.: A consumer's guide to phytoplankton primary productivity models, Limnol. Oceanogr., 42, 1479–1491, https://doi.org/10.4319/lo.1997.42.7.1479, 1997.
Behrenfeld, M. J., Boss, E., Siegel, D. A., and Shea, D. M.: Carbon-based ocean productivity and phytoplankton physiology from space, Global Biogeochem. Cy., 19, 1–14, https://doi.org/10.1029/2004GB002299, 2005.
Benitez-Nelson, C. R., Buesseler, K. O., and Crossin, G.: Upper ocean carbon export, horizontal transport, and vertical eddy diffusivity in the southwestern Gulf of Maine, Cont. Shelf Res., 20, 707–736, https://doi.org/10.1016/S0278-4343(99)00093-X, 2000.
Bhat, S. G., Krishnaswanmy, S., Lal, D., and Moore, W. S.: 234Th∕238U Ratios in the Ocean, Earth Planet. Sc. Lett., 5, 433–491, 1969.
Black, E. E., Buesseler, K. O., Pike, S. M., and Lam, P. J.: 234Th as a tracer of particulate export and remineralization in the southeastern tropical Pacific, Mar. Chem., 201, 35–50, https://doi.org/10.1016/j.marchem.2017.06.009, 2017.
Boyd, P. W. and Newton, P. P.: Does planktonic community structure determine downward particulate organic carbon flux in different oceanic provinces?, Deep-Sea Res. Pt. I, 46, 63–91, 1999.
Buesseler, K. O.: The decoupling of production and particulate export in the surface ocean, Global Biogeochem. Cy., 12, 297–310, https://doi.org/10.1029/97GB03366, 1998.
Buesseler, K. O. and Boyd, P. W.: Shedding light on processes that control particle export and flux attenuation in the twilight zone of the open ocean, Limnol. Oceanogr., 54, 1210–1232, https://doi.org/10.4319/lo.2009.54.4.1210, 2009.
Buesseler, K. O., Bacon, M. P., Kirk Cochran, J., and Livingston, H. D.: Carbon and nitrogen export during the JGOFS North Atlantic Bloom experiment estimated from 234Th:238U disequilibria, Deep-Sea Res. Pt. A, 39, 1115–1137, https://doi.org/10.1016/0198-0149(92)90060-7, 1992.
Buesseler, K. O., Andrews, J. A., Hartman, M. C., Belastock, R., and Chai, F.: Regional estimates of the export flux of particulate organic carbon derived from thorium-234 during the JGOFS EqPac program, Deep-Sea Res. Pt. II, 42, 777–804, https://doi.org/10.1016/0967-0645(95)00043-P, 1995.
Buesseler, K. O., Benitez-Nelson, C. R., Moran, S. B., Burd, a., Charette, M., Cochran, J. K., Coppola, L., Fisher, N. S., Fowler, S. W., Gardner, W. D., Guo, L. D., Gustafsson, Ö., Lamborg, C., Masque, P., Miquel, J. C., Passow, U., Santschi, P. H., Savoye, N., Stewart, G., and Trull, T.: An assessment of particulate organic carbon to thorium-234 ratios in the ocean and their impact on the application of 234Th as a POC flux proxy, Mar. Chem., 100, 213–233, https://doi.org/10.1016/j.marchem.2005.10.013, 2006.
Buesseler, K. O., Trull, T. W., Steinberg, D. K., Silver, M. W., Siegel, D. a., Saitoh, S. I., Lamborg, C. H., Lam, P. J., Karl, D. M., Jiao, N. Z., Honda, M. C., Elskens, M., Dehairs, F., Brown, S. L., Boyd, P. W., Bishop, J. K. B., and Bidigare, R. R.: VERTIGO (VERtical Transport In the Global Ocean): A study of particle sources and flux attenuation in the North Pacific, Deep-Sea Res. Pt. II, 55, 1522–1539, https://doi.org/10.1016/j.dsr2.2008.04.024, 2008.
Cai, P., Rutgers Van Der Loeff, M., Stimac, I., Nthig, E. M., Lepore, K., and Moran, S. B.: Low export flux of particulate organic carbon in the central Arctic Ocean as revealed by 234Th:238U disequilibrium, J. Geophys. Res.-Ocean., 115, 1–21, https://doi.org/10.1029/2009JC005595, 2010.
Ceballos-Romero, E., Le Moigne, F. A. C., Henson, S., Marsay, C. M., Sanders, R. J., García-Tenorio, R., and Villa-Alfageme, M.: Influence of bloom dynamics on particle export efficiency in the North Atlantic: a comparative study of radioanalytical techniques and sediment traps, Mar. Chem., 186, 198–210, https://doi.org/10.1016/j.marchem.2016.10.001, 2016.
Claquin, P., Martin-Jézéquel, V., Kromkamp, J. C., Veldhuis, M. J. W., and Kraay, G. W.: Uncoupling of silicon compared with carbon and nitrogen metabolisms and the role of the cell cycle in continuous cultures of Thalassiosira pseudonana (Bacillariophyceae) under light, nitrogen, and phosphorus control, J. Phycol., 38, 922–930, https://doi.org/10.1046/j.1529-8817.2002.t01-1-01220.x, 2002.
Coale, K. H. and Bruland, K. W.: Thorium-234 : uranium-238 disequilibria within the California Current, Limnol. Oceanogr., 30, 22–33, https://doi.org/10.4319/lo.1985.30.1.0022, 1985.
Cochran, J. K. and Masqué, P.: Short-lived U/Th series radionuclides in the ocean: Tracers for scavenging rates, export fluxes and particle dynamics, Rev. Mineral. Geochem., 52, 461–492, https://doi.org/10.2113/0520461, 2003.
Collins, J. R., Edwards, B. R., Thamatrakoln, K., Ossolinski, J. E., Ditullio, G. R., Bidle, K. D., Doney, S. C., and Van Mooy, B. A. S.: The multiple fates of sinking particles in the North Atlantic Ocean, Global Biogeochem. Cy., 29, 1471–1494, https://doi.org/10.1002/2014GB005037, 2015.
Costa Goela, P., Cordeiro, C., Danchenko, S., Icely, J., Cristina, S., and Newton, A.: Time series analysis of data for sea surface temperature and upwelling components from the southwest coast of Portugal, J. Marine Syst., 163, 12–22, https://doi.org/10.1016/j.jmarsys.2016.06.002, 2016.
Daniault, N., Mercier, H., Lherminier, P., Sarafanov, A., Falina, A., Zunino, P., Pérez, F. F., Rios, A. F., Ferron, B., Huck, T., Thierry, V., and Gladyshev, S.: The northern North Atlantic Ocean mean circulation in the early 21st century, Prog. Oceanogr., 146, 142–158, https://doi.org/10.1016/j.pocean.2016.06.007, 2016.
Dortch, Q. and Packard, T. T.: Differences in biomass structure between oligotrophic and eutrophic marine ecosystems, Deep-Sea Res. Pt. A, 36, 223–240, 1989.
Eppley, R. W.: Temperature and phytoplankton growth in the sea, Fish. Bull., 70, 1063–1085, 1972.
Esaias, W. E., Feldman, G. C., MnClain, C. R., and Elrod, J. A.: Monthly satellite-derived phytoplankton pigment distribution for the North Atlantic basin, Ocenaography Rep., 67, 835–837, 1986.
Ferron, B., Kokoszka, F., Mercier, H., and Lherminier, P.: Dissipation rate estimates from microstructure and finescale internal wave observations along the A25 Greenland-Portugal OVIDE line, J. Atmos. Ocean. Tech., 31, 2530–2543, https://doi.org/10.1175/JTECH-D-14-00036.1, 2014.
Fonseca-Batista, D., Li, X., Riou, V., Michotey, V., Deman, F., Fripiat, F., Guasco, S., Brion, N., Lemaitre, N., Tonnard, M., Gallinari, M., Planquette, H., Planchon, F., Sarthou, G., Elskens, M., Chou, L., and Dehairs, F.: Evidence of high N2 fixation rates in productive waters of the temperate Northeast Atlantic, Biogeosciences Discuss., https://doi.org/10.5194/bg-2018-220, in review, 2018.
Francois, R., Honjo, S., Krishfield, R., and Manganini, S.: Factors controlling the flux of organic carbon to the bathypelagic zone of the ocean, Global Biogeochem. Cy., 16, 1–20, https://doi.org/10.1029/2001GB001722, 2002.
GEOTRACES: GEOTRACES (an international study of the marine biogeochemical cycle of trace elements and isotopes) – Science Plan, Baltimore, Maryland, USA, available at: http://www.geotraces.org/libraries/documents/Science_plan.pdf (last access: 26 October 2018), 2006.
Giering, S. L. C., Sanders, R., Lampitt, R. S., Anderson, T. R., Tamburini, C., Boutrif, M., Zubkov, M. V, Marsay, C. M., Henson, S. A., Saw, K., Cook, K., and Mayor, D. J.: Reconciliation of the carbon budget in the ocean's twilight zone, Nature, 507, 480–483, https://doi.org/10.1038/nature13123, 2014.
Giering, S. L. C., Sanders, R., Martin, A. P., Lindemann, C., Möller, K. O., Daniels, C. J., Mayor, D. J., and St. John, M. A.: High export via small particles before the onset of the Nort Atlantic spring bloom, J. Geophys. Res., 121, 1–17, https://doi.org/10.1002/2016JC012048, 2016.
Gourain, A., Planquette, H., Cheize, M., Lemaitre, N., Menzel Barraqueta, J.-L., Shelley, R., Lherminier, P., and Sarthou, G.: Inputs and processes affecting the distribution of particulate iron in the North Atlantic along the GEOVIDE (GEOTRACES GA01) section, Biogeosciences Discuss., https://doi.org/10.5194/bg-2018-234, in review, 2018.
Guidi, L., Stemmann, L., Jackson, G. A., Ibanez, F., Claustre, H., Legendre, L., Picheral, M., and Gorsky, G.: Effects of phytoplankton community on production , size and export of large aggregates?: A world-ocean analysis, Limnol. Oceanogr., 54, 1951–1963, 2009.
Guidi, L., Legendre, L., Reygondeau, G., Uitz, J., Stemmann, L., and Henson, S. A.: A new look at ocean carbon remineralization for estimating deepwater sequestration, Global Planet. Change, 29, 1044–1059, https://doi.org/10.1002/2014GB005063, 2015.
Hall, I. R., Schmidt, S., McCave, I. N., and Reyss, J. L.: Particulate matter distribution and 234Th∕238U disequilibrium along the Northern Iberian Margin?: implications for particulate organic carbon export, Deep-Sea Res. Pt. I, 47, 557–582, 2000.
Hama, T., Miyazaki, T., Ogawa, Y., Iwakuma, T., Takahashi, M., Otsuki, A., and Ichimura, S.: Mesurement of photosynthtic production of a marine phytoplankton population using a stable 13C isotope, Mar. Biol., 73, 31–36, 1983.
Henson, S. A., Dunne, J. P., and Sarmiento, J. L.: Decadal variability in North Atlantic phytoplankton blooms, J. Geophys. Res., 114, C04013–C04013, https://doi.org/10.1029/2008JC005139, 2009.
Henson, S. A., Sanders, R., and Madsen, E.: Global patterns in efficiency of particulate organic carbon export and transfer to the deep ocean, Global Biogeochem. Cy., 26, 1–14, https://doi.org/10.1029/2011GB004099, 2012.
Henson, S. A., Yool, A., and Sanders, R.: Variability in efficiency of particulate organic carbon export: a model study, Global Biogeochem. Cy., 29, 33–45, https://doi.org/10.1002/2014GB004965, 2015.
Herndl, G. J. and Reinthaler, T.: Microbial control of the dark end of the biological pump, Nat. Geosci., 6, 718–724, https://doi.org/10.1038/ngeo1921, 2013.
Honjo, S. and Manganini, S. J.: Annual biogenic particle fluxes to the interior of the North Atlantic Ocean; studied at 34∘ N 21∘ W and 48∘ N 21∘ W, Deep-Sea Res. Pt. I, 40, 587–607, 1993.
Iversen, M. H. and Ploug, H.: Temperature effects on carbon-specific respiration rate and sinking velocity of diatom aggregates – potential implications for deep ocean export processes, Biogeosciences, 10, 4073–4085, https://doi.org/10.5194/bg-10-4073-2013, 2013.
Karl, D. M.: A Sea of change: Biogeochemical variability in the North Pacific Subtropical Gyre, Ecosystems, 2, 181–214, 1999.
Kieke, D. and Yashayaev, I.: Studies of Labrador Sea Water formation and variability in the subpolar North Atlantic in the light of international partnership and collaboration, Prog. Oceanogr., 132, 220–232, https://doi.org/10.1016/j.pocean.2014.12.010, 2015.
Klaas, C. and Archer, D. E.: Association of sinking organic matter with various types of mineral ballast in the deep sea: Implications for the rain ratio, Global Biogeochem. Cy., 16, 1–14, https://doi.org/10.1029/2001GB001765, 2002.
Lam, P. J., Doney, S. C., and Bishop, J. K. B.: The dynamic ocean biological pump: Insights from a global compilation of particulate organic carbon, CaCO3, and opal concentration profiles from the mesopelagic, Global Biogeochem. Cy., 25, 1–14, https://doi.org/10.1029/2010GB003868, 2011.
Lampitt, R. S., Bett, B. J., Kiriakoulakis, K., Popova, E. E., Ragueneau, O., Vangriesheim, A., and Wolff, G. A.: Material supply to the abyssal seafloor in the Northeast Atlantic, Prog. Oceanogr., 50, 27–63, 2001.
Lampitt, R. S., Boorman, B., Brown, L., Lucas, M., Salter, I., Sanders, R., Saw, K., Seeyave, S., Thomalla, S. J., and Turnewitsch, R.: Particle export from the euphotic zone: Estimates using a novel drifting sediment trap, 234Th and new production, Deep-Sea Res. Pt. I, 55, 1484–1502, https://doi.org/10.1016/j.dsr.2008.07.002, 2008.
Lampitt, R. S., Salter, I., de Cuevas, B. A., Hartman, S., Larkin, K. E., and Pebody, C. A.: Long-term variability of downward particle flux in the deep northeast Atlantic: Causes and trends, Deep-Sea Res. Pt. II, 57, 1346–1361, https://doi.org/10.1016/j.dsr2.2010.01.011, 2010.
Lemaitre, N., Planquette, H., Planchon, F., Sarthou, G., Jacquet, S., García-Ibáñez, M. I., Gourain, A., Cheize, M., Monin, L., André, L., Laha, P., Terryn, H., and Dehairs, F.: Particulate barium tracing of significant mesopelagic carbon remineralisation in the North Atlantic, Biogeosciences, 15, 2289–2307, https://doi.org/10.5194/bg-15-2289-2018, 2018.
Lima, I. D., Lam, P. J., and Doney, S. C.: Dynamics of particulate organic carbon flux in a global ocean model, Biogeosciences, 11, 1177–1198, https://doi.org/10.5194/bg-11-1177-2014, 2014.
Longhurst, A. R.: Ecological geography of the sea, Academic Press, San Diego, 2010.
Lutz, M., Dunbar, R., and Caldeira, K.: Regional variability in the vertical flux of particulate organic carbon in the ocean interior, Global Biogeochem. Cy., 16, 1–15, https://doi.org/10.1029/2000GB001383, 2002.
Maiti, K., Benitez-Nelson, C. R., and Buesseler, K. O.: Insights into particle formation and remineralization using the short-lived radionuclide, Thoruim-234, Geophys. Res. Lett., 37, 2–7, https://doi.org/10.1029/2010GL044063, 2010.
Maiti, K., Charette, M. A., Buesseler, K. O., and Kahru, M.: An inverse relationship between production and export efficiency in the Southern Ocean, Geophys. Res. Lett., 40, 1557–1561, https://doi.org/10.1002/grl.50219, 2013.
Marsay, C. M., Sanders, R. J., Henson, S. A., Pabortsava, K., Achterberg, E. P., and Lampitt, R. S.: Attenuation of sinking particulate organic carbon flux through the mesopelagic ocean, P. Natl. Acad. Sci. USA, 112, 1089–1094, https://doi.org/10.1073/pnas.1415311112, 2015.
Martin, P., Lampitt, R. S., Jane Perry, M., Sanders, R., Lee, C., and D'Asaro, E.: Export and mesopelagic particle flux during a North Atlantic spring diatom bloom, Deep-Sea Res. Pt. I, 58, 338–349, https://doi.org/10.1016/j.dsr.2011.01.006, 2011.
Mercier, H., Lherminier, P., Sarafanov, A., Gaillard, F., Daniault, N., Desbruyères, D., Falina, A., Ferron, B., Gourcuff, C., Huck, T., and Thierry, V.: Variability of the meridional overturning circulation at the Greenland-Portugal OVIDE section from 1993 to 2010, Prog. Oceanogr., 132, 250–261, https://doi.org/10.1016/j.pocean.2013.11.001, 2015.
Le Moigne, F. A. C., Sanders, R. J., Villa-Alfageme, M., Martin, A. P., Pabortsava, K., Planquette, H., Morris, P. J., and Thomalla, S. J.: On the proportion of ballast versus non-ballast associated carbon export in the surface ocean, Geophys. Res. Lett., 39, L15610, https://doi.org/10.1029/2012GL052980, 2012.
Le Moigne, F. A. C., Villa-Alfageme, M., Sanders, R. J., Marsay, C., Henson, S., and García-Tenorio, R.: Export of organic carbon and biominerals derived from 234Th and 210Po at the Porcupine Abyssal Plain, Deep-Sea Res. Pt. I, 72, 88–101, https://doi.org/10.1016/j.dsr.2012.10.010, 2013a.
Le Moigne, F. A. C., Henson, S. A., Sanders, R. J., and Madsen, E.: Global database of surface ocean particulate organic carbon export fluxes diagnosed from the 234Th technique, Earth Syst. Sci. Data, 5, 295–304, https://doi.org/10.5194/essd-5-295-2013, 2013b.
Le Moigne, F. A. C., Henson, S. A., Cavan, E. L., Georges, C., Pabortsava, K., Achterberg, E. P., Ceballos-romero, E., and Zubkov, M.: What causes the inverse relationship between primary production and export efficiency in the Southern Ocean?, Geophys. Res. Lett., 43, 1–10, https://doi.org/10.1002/2016GL068480, 2016.
Moore, C. M., Lucas, M. I., Sanders, R., and Davidson, R.: Basin-scale variability of phytoplankton bio-optical characteristics in relation to bloom state and community structure in the Northeast Atlantic, Deep-Sea Res. Pt. I, 52, 401–419, https://doi.org/10.1016/j.dsr.2004.09.003, 2005.
Moore, C. M., Mills, M. M., Langlois, R., Milne, A., Achterberg, E. P., La Roche, J., and Geider, R. J.: Relative influence of nitrogen and phosphorus availability on phytoplankton physiology and productivity in the oligotrophic sub-tropical North Atlantic Ocean, Limnol. Oceanogr., 53, 291–305, 2008.
Moran, S. B., Weinstein, S. E., Edmonds, H. N., Smith, J. N., Kelly, R. P., Pilson, M. E. Q., and Harrison, W. G.: Does 234Th∕238U disequilibrium provide an accurate record of the export flux of particulate organic carbon from the upper ocean?, Limnol. Oceanogr., 48, 1018–1029, https://doi.org/10.4319/lo.2003.48.3.1018, 2003.
Mouw, C. B., Barnett, A., Mckinley, G. A., Gloege, L., and Pilcher, D.: Phytoplankton size impact on export flux in the global Ocean, Global Biogeochem. Cy., 30, 1542–1562, https://doi.org/10.1002/2015GB005355, 2016.
Owens, S. A., Buesseler, K. O., and Sims, K. W. W.: Re-evaluating the 238U-salinity relationship in seawater: Implications for the 238U-234Th disequilibrium method, Mar. Chem., 127, 31–39, https://doi.org/10.1016/j.marchem.2011.07.005, 2011.
Owens, S. A., Pike, S., and Buesseler, K. O.: Thorium-234 as a tracer of particle dynamics and upper ocean export in the Atlantic Ocean, Deep-Sea Res. Pt. II, 116, 42–59, https://doi.org/10.1016/j.dsr2.2014.11.010, 2014.
Pike, S., Buesseler, K. O., Andrews, J., and Savoye, N.: Quantification of 234Th recovery in small volume seawater samples by Inductively Coupled Plasma Mass Spectrometry, J. Radioanal. Nucl. Chem., 263, 355–360, 2005.
Planchon, F., Cavagna, A.-J., Cardinal, D., André, L., and Dehairs, F.: Late summer particulate organic carbon export and twilight zone remineralisation in the Atlantic sector of the Southern Ocean, Biogeosciences, 10, 803–820, https://doi.org/10.5194/bg-10-803-2013, 2013.
Planchon, F., Ballas, D., Cavagna, A.-J., Bowie, A. R., Davies, D., Trull, T., Laurenceau-Cornec, E. C., Van Der Merwe, P., and Dehairs, F.: Carbon export in the naturally iron-fertilized Kerguelen area of the Southern Ocean based on the 234Th approach, Biogeosciences, 12, 3831–3848, https://doi.org/10.5194/bg-12-3831-2015, 2015.
Puigcorbé, V., Roca-Martí, M., Masqué, P., Benitez-Nelson, C., Rutgers van der Loeff, M., Bracher, A., and Moreau, S.: Latitudinal distributions of particulate carbon export across the North Western Atlantic Ocean, Deep-Sea Res. Pt. I, 129, 116–130, https://doi.org/10.1016/j.dsr.2017.08.016, 2017.
Ras, J., Claustre, H., and Uitz, J.: Spatial variability of phytoplankton pigment distributions in the Subtropical South Pacific Ocean: comparison between in situ and predicted data, Biogeosciences, 5, 353–369, https://doi.org/10.5194/bg-5-353-2008, 2008.
Resplandy, L., Martin, A. P., Le Moigne, F., Martin, P., Aquilina, A., Mémery, L., Lévy, M., and Sanders, R.: How does dynamical spatial variability impact 234Th-derived estimates of organic export?, Deep-Sea Res. Pt. I, 68, 24–45, https://doi.org/10.1016/j.dsr.2012.05.015, 2012.
Reverdin, G., Niiler, P. P., and Valdimarsson, H.: North Atlantic Ocean surface currents, J. Geophys. Res., 108, 1–21, https://doi.org/10.1029/2001JC001020, 2003.
Riley, G.: Phytoplankton of the North Central Sargasso Sea, 1950–52, Limnol. Oceanogr., 2, 252–270, https://doi.org/10.1002/lno.1957.2.3.0252, 1957.
Rivkin, R. B. and Legendre, L.: Biogenic carbon cycling in the upper ocean: Effects of microbial respiration, Science, 291, 2398–2400, 2001.
Roca-Marti, M., Puigcorbé, V., van der Loeff, M. R., Katlein, C., Fernandez-Mendez, M., Peeken, I., and Masqué, P.: Carbon export fluxes and export efficiency in the central Arctic during the record sea-ice minimum in 2012: a joint 234Th∕238U and 210Po∕210Pb study, J. Geophys. Res., 121, 1–20, https://doi.org/10.1002/2016JC011816, 2016a.
Roca-Marti, M., Puigcorbé, V., Iversen, M. H., van der Loeff, M. R., Klaas, C., Cheah, W., Bracher, A., and Masqué, P.: High particulate organic carbon export during the decline of a vast diatom bloom in the Atlantic sector of the Southern Ocean, Deep-Sea Res. Pt. II, 138, 102–115, https://doi.org/10.1016/j.dsr2.2015.12.007, 2016b.
Rutgers van der Loeff, M., Cai, P. H., Stimac, I., Bracher, A., Middag, R., Klunder, M. B., and van Heuven, S. M. A. C.: 234Th in surface waters: Distribution of particle export flux across the Antarctic Circumpolar Current and in the Weddell Sea during the GEOTRACES expedition ZERO and DRAKE, Deep-Sea Res. Pt. II, 58, 2749–2766, https://doi.org/10.1016/j.dsr2.2011.02.004, 2011.
Rutgers van der Loeff, M. M., Sarin, M. M., Baskaran, M., Benitez-Nelson, C., Buesseler, K. O., Charette, M., Dai, M., Gustafsson, Ö., Masque, P., Morris, P. J., Orlandini, K., Rodriguez y Baena, A., Savoye, N., Schmidt, S., Turnewitsch, R., Vöge, I., and Waples, J. T.: A review of present techniques and methodological advances in analyzing 234Th in aquatic systems, Mar. Chem., 100, 190–212, https://doi.org/10.1016/j.marchem.2005.10.012, 2006.
Sanders, R., Morris, P. J., Poulton, A. J., Stinchcombe, M. C., Charalampopoulou, A., Lucas, M. I., and Thomalla, S. J.: Does a ballast effect occur in the surface ocean?, Geophys. Res. Lett., 37, 1–5, https://doi.org/10.1029/2010GL042574, 2010.
Sanders, R., Henson, S. A., Koski, M., La, C. L. De, Painter, S. C., Poulton, A. J., Riley, J., Salihoglu, B., Visser, A., Yool, A., Bellerby, R., and Martin, A. P.: The Biological Carbon Pump in the North Atlantic, Prog. Oceanogr., 129, 200–218, https://doi.org/10.1016/j.pocean.2014.05.005, 2014.
Savoye, N., Buesseler, K. O., Cardinal, D., and Dehairs, F.: 234Th deficit and excess in the Southern Ocean during spring 2001: Particle export and remineralization, Geophys. Res. Lett., 31, L12301, https://doi.org/10.1029/2004GL019744, 2004.
Savoye, N., Benitez-Nelson, C., Burd, A. B., Cochran, J. K., Charette, M., Buesseler, K. O., Jackson, G. A., Roy-Barman, M., Schmidt, S., and Elskens, M.: 234Th sorption and export models in the water column: A review, Mar. Chem., 100, 234–249, https://doi.org/10.1016/j.marchem.2005.10.014, 2006.
Shelley, R. U., Roca-Martí, M., Castrillejo, M., Masqué, P., Landing, W. M., Planquette, H., and Sarthou, G.: Quantification of trace element atmospheric deposition fluxes to the Atlantic Ocean (>40∘ N; GEOVIDE, GEOTRACES GA01) during spring 2014, Deep-Sea Res. Pt. I, 119, 34–49, https://doi.org/10.1016/j.dsr.2016.11.010, 2016.
Stange, P., Bach, L. T., Le Moigne, F. A. C., Taucher, J., Boxhammer, T., and Riebesell, U.: Quantifying the time lag between organic matter production and export in the surface ocean: Implications for estimates of export efficiency, Geophys. Res. Lett., 43, 1–9, https://doi.org/10.1002/2016GL070875, 2016.
Thomalla, S., Turnewitsch, R., Lucas, M., and Poulton, A.: Particulate organic carbon export from the North and South Atlantic gyres: The 234Th∕238U disequilibrium approach, Deep-Sea Res. Pt. II, 53, 1629–1648, https://doi.org/10.1016/j.dsr2.2006.05.018, 2006.
Thomalla, S. J., Poulton, A. J., Sanders, R., Turnewitsch, R., Holligan, P. M., and Lucas, M. I.: Variable export fluxes and efficiencies for calcite, opal, and organic carbon in the Atlantic Ocean: A ballast effect in action?, Global Biogeochem. Cy., 22, 1–10, https://doi.org/10.1029/2007GB002982, 2008.
Tonnard, M., Donval, A., Lampert, L., Claustre, H., Ras, J., Dimier, C., Sarthou, G., Planquette, H., van der Merwe, P., Boutorh, J., Cheize, M., Menzel, J.-L., Pereira Contraira, L., Shelley, R., Bowie, A. R., Tréguer, P., Gallinari, M., Duprez de Gesincourt, F., Germain, Y., and Lherminier, P.: Phytoplankton assemblages along the GEOVIDE section (GEOTRACES section GA01) using CHEMTAX, in preparation, 2018.
Turner, A. and Millward, G. E.: Suspended Particles: Their Role in Estuarine Biogeochemical Cycles, Estuar. Coast. Shelf S., 55, 857–883, https://doi.org/10.1006/ecss.2002.1033, 2002.
Villa-Alfageme, M., Soto, F. C., Ceballos, E., Giering, S. L. C., Le Moigne, F. A. C., Henson, S., Mas, J. L., and Sanders, R. J.: Geographical, seasonal and depth variation in sinking particle speeds in the North Atlantic, Geophys. Res. Lett., 43, 8609–8616, https://doi.org/10.1002/2016GL069233, 2016.
Westberry, T., Behrenfeld, M. J., Siegel, D. A., and Boss, E.: Carbon-based primary productivity modeling with vertically resolved photoacclimation, Global Biogeochem. Cy., 22, 1–18, https://doi.org/10.1029/2007GB003078, 2008.
Zehr, J. P. and Ward, B. B.: Nitrogen Cycling in the Ocean?: New Perspectives on Processes and Paradigms MINIREVIEW Nitrogen Cycling in the Ocean?: New Perspectives on Processes and Paradigms, Appl. Environ. Microb., 68, 1015–1024, https://doi.org/10.1128/AEM.68.3.1015-1024.2002, 2002.
Zúñiga, D., Villacieros-Robineau, N., Salgueiro, E., Alonso-Pérez, F., Rosón, G., Abrantes, F., and Castro, C. G.: Particle fluxes in the NW Iberian coastal upwelling system: Hydrodynamical and biological control, Cont. Shelf Res., 123, 89–98, https://doi.org/10.1016/j.csr.2016.04.008, 2016.
Zunino, P., Lherminier, P., Mercier, H., Daniault, N., García-Ibáñez, M. I., and Pérez, F. F.: The GEOVIDE cruise in May–June 2014 reveals an intense Meridional Overturning Circulation over a cold and fresh subpolar North Atlantic, Biogeosciences, 14, 5323–5342, https://doi.org/10.5194/bg-14-5323-2017, 2017.