the Creative Commons Attribution 4.0 License.
the Creative Commons Attribution 4.0 License.
 | 04 Oct 2018
Quantification of lignin oxidation products as vegetation biomarkers in speleothems and cave drip water
Inken Heidke
Denis Scholz
Here we present a sensitive method to analyze lignin oxidation products (LOPs) in speleothems and cave drip water to provide a new tool for paleo-vegetation reconstruction. Speleothems are valuable climate archives. However, compared to other terrestrial climate archives, such as lake sediments, speleothems contain very little organic matter. Therefore, very few studies on organic biomarkers in speleothems are available. Our new sensitive method allows us to use LOPs as vegetation biomarkers in speleothems.
Our method consists of acid digestion of the speleothem sample followed by solid-phase extraction (SPE) of the organic matter. The extracted polymeric lignin is degraded in a microwave-assisted alkaline CuO oxidation step to yield monomeric LOPs. The LOPs are extracted via SPE and finally analyzed via ultrahigh-performance liquid chromatography (UHPLC) coupled to electrospray ionization (ESI) and high-resolution Orbitrap mass spectrometry (HRMS). The method was applied to stalagmite samples with a sample size of 3–5 g and cave drip water samples with a sample size of 100–200 mL from the Herbstlabyrinth-Advent Cave in Germany. In addition, fresh plant samples, soil water, and powdered lignin samples were analyzed for comparison. The concentration of the sum of eight LOPs (Σ8) was in the range of 20–84 ng g−1 for the stalagmite samples and 230–440 ng L−1 for the cave drip water samples. The limits of quantification for the individual LOPs ranged from 0.3–8.2 ng per sample or 1.5–41.0 ng mL−1 of the final sample solution.
Our method represents a new and powerful analytical tool for paleo-vegetation studies and has great potential to identify the pathways of lignin incorporation into speleothems.
- Article
(1066 KB) -
Supplement
(408 KB) - BibTeX
- EndNote


Speleothems are calcareous mineral deposits that form within caves in karstified carbonate rock. The most common types of speleothems are stalagmites, which are formed by water dripping on the ground of the cave, stalactites, which are their counterparts on the cave ceiling, and flowstones, which are formed by water films flowing on the cave walls and floor. Speleothems preserve information about climatic and hydrological conditions and the vegetation development above the cave and therefore serve as paleoclimate archives (Fairchild and Baker, 2012; McDermott, 2004). Compared to other paleoclimate archives, such as ice cores and marine or lacustrine sediments, speleothems have certain advantages. They can grow continuously for 103–105 years, their growth layers are mechanically undisturbed, and they do not show a loss of time resolution with increasing age (Fairchild et al., 2006; Gałuszka et al., 2017). They can be accurately dated up to 500 000 years back in time using the 230Th–U method (Richards and Dorale, 2003; Scholz and Hoffmann, 2008). Moreover, they occur on all continents except Antarctica and are thus not limited to certain climatic regions.
Most studies of speleothems focus on the analysis of stable isotope ratios (δ13C, δ18O McDermott, 2004) and inorganic trace elements (Fairchild and Treble, 2009). The organic content of speleothems has so far mostly been analyzed as total organic carbon content or fluorescent organic matter (Quiers et al., 2015). However, in recent years, the interest in molecular organic proxies in climate archives has increased (Blyth and Watson, 2009; Blyth et al., 2008, 2010, 2016; Giorio et al., 2018). In speleothems, in particular lipid biomarkers, such as fatty acids reflecting changes in vegetational and microbial activities (Blyth et al., 2006; Bosle et al., 2014; Xie, 2003) and membrane lipids (glycerol dialkyl glycerol tetraethers, GDGTs) serving as paleotemperature proxies (Baker et al., 2016; Blyth and Schouten, 2013), have been studied.
Lignin occurs almost exclusively in terrestrial vascular plants and is one of the main constituents of wood and woody plants (Jex et al., 2014). It is a biopolymer that mainly consists of three monomers: sinapyl alcohol, coniferyl alcohol, and p-coumaryl alcohol. The proportion of these three monomers varies with the type of plant, such as gymnosperm or angiosperm and woody or nonwoody material. Thus, by analyzing the composition of lignin, it is possible to determine the source and type of plant material.
Lignin has been widely used as a paleo-vegetation proxy in lake sediment (Tareq et al., 2011) and peat cores (Tareq et al., 2004). In marine sediments (Zhang et al., 2013) and natural waters (Hernes and Benner, 2002; Standley and Kaplan, 1998), lignin analysis has been used to determine the source of dissolved organic matter. Blyth and Watson (2009) have successfully detected lignin pyrolysis products in speleothems by applying a tetramethylammonium hydroxide (TMAH) thermochemolysis method, but there have been no quantitative studies of lignin in speleothems yet.
Lignin has to be degraded before the molecular composition of its phenolic components can be analyzed. The most common method for the degradation of lignin is alkaline oxidation with cupric oxide (CuO), developed by Hedges and Parker in 1976. This method releases a number of phenolic acids, aldehydes, and ketones, which can be divided into four groups: the vanillyl group (V) consisting of vanillic acid, vanillin, and acetovanillone; the syringyl group (S) consisting of syringic acid, syringaldehyde, and acetosyringone; the cinnamyl group (C) consisting of trans-ferulic acid and p-coumaric acid; and the p-hydroxyl group (P) consisting of p-hydroxybenzoic acid, p-hydroxybenzaldehyde, and p-hydroxyacetophenone. Hedges and Mann (1979) analyzed fresh plant tissues and showed that the phenols of the syringyl group are only obtained from angiosperm, but not from gymnosperm plant tissues. Likewise, the phenols of the cinnamyl group are only obtained from nonwoody and not from woody plant tissues, whereas the phenols of the vanillyl group are found in all kinds of vascular plant tissues (angiosperm and gymnosperm, woody and nonwoody). These results led to the introduction of the lignin oxidation product (LOP) parameters C ∕ V and S ∕ V, for which C, for example, is defined as the sum of all lignin oxidation products of the C group (Hedges and Mann, 1979). The phenols of the p-hydroxyl group can originate from gymnosperm and nonwoody angiosperm plant tissues, but are also oxidation products of protein-rich organisms such as bacteria and plankton. Therefore, the P group is not used in the parameters to determine the source of lignin (Jex et al., 2014). The parameter Σ8 gives the sum of the eight analytes of the C, S, and V group and is used to estimate the total amount of LOPs in a sample.
Oxidation with CuO has been optimized many times in the past. For example, Goñi and Montgomery (2000) developed a microwave digestion method. Other groups improved the sample cleanup by replacing the formerly used liquid–liquid extraction (LLE) with solid-phase extraction (SPE) (Kaiser and Benner, 2012; Kögel and Bochter, 1985). As the CuO oxidation method is broadly used, there are many data sets to compare with. This is certainly an advantage compared to the abovementioned TMAH thermochemolysis method, which is less often used and produces more complex methylated reaction product mixtures (Wysocki et al., 2008). For the detection of the LOPs, gas chromatography coupled to mass spectrometry (GC–MS) is often used, which requires a derivatization step. Liquid chromatography is also used, either in combination with UV detection or coupled to mass spectrometry.
The purpose of this study was to develop and validate a sensitive and selective method for the quantification of LOPs in both speleothem and cave drip water samples using liquid chromatography electrospray ionization mass spectrometry (LC-ESI-MS). This method offers new possibilities for paleo-vegetation reconstruction since it combines the advantages of lignin analysis as a highly specific vegetation biomarker with the abovementioned benefits of speleothems as unique terrestrial climate archives. Lignin as a vegetation biomarker is much more specific for higher plants than, for example, n-alkanes or fatty acids (Jex et al., 2014) and can thus help to interpret other vegetation markers and stable isotope records. Up to now, lignin analysis for paleo-vegetation reconstruction has only been applied to lake sediments and peat cores, which contain much larger amounts of organic matter than speleothems. Our method allows us to analyze the lignin composition of trace amounts of organic matter preserved in speleothems. The stalagmite samples are first acid digested, and the acidic solution is then extracted by SPE. The eluent is then subjected to CuO oxidation in a microwave-assisted digestion method. The oxidized sample solutions are again extracted and enriched by SPE, and the LOPs are then separated and detected by ultrahigh-performance liquid chromatography coupled to electrospray ionization high-resolution mass spectrometry (UHPLC–ESI–HRMS).
2.1 Chemicals and materials
Analytical standards of acetosyringone (97 %), acetovanillone (≥ 98 %), para-coumaric acid (≥ 98 %), ethylvanillin (99 %), ferulic acid (99 %), para-hydroxyacetophenone (≥ 98 %), para-hydroxybenzaldehyde (≥ 97.5 %), syringaldehyde (98 %), syringic acid (>95 %), and cinnamic acid (97 %), as well as copper(II) oxide (> 99 %) and ammonium iron(II) sulfate (99 %) were purchased from Sigma-Aldrich. Analytical standards of para-hydroxybenzoic acid (99 %) and vanillin (99 %) were obtained from Acros Organics, and an analytical standard of vanillic acid (98 %) was obtained from Alfa Aesar. Sodium hydroxide (pellets, ≥ 99 %) was purchased from Carl Roth, and hydrochloric acid (HCl, suprapure, 30 %) from Merck KGaA. Lignin from mainly coniferous wood was obtained from BASF SE. Mixed lignin from wheat straw and various kinds of wood was purchased from Bonding Chemical. Solid-phase extraction columns (Oasis HLB, 3 mL tubes, 60 mg packing material) were purchased from Waters. The ultrapure solvents (Optima LC/MS grade) acetonitrile (ACN), water (H2O), and methanol (MeOH) were obtained from Fisher Scientific. Dichloromethane (DCM) (≥ 99.9 % (GC)) was obtained from Honeywell Riedel-de Haën. Ultrapure water with 18.2 MΩ resistance was produced using a Milli-Q water system from Merck Millipore (Darmstadt, Germany).
2.2 Methods
The overall sample preparation procedure is shown as a process chart in Fig. 1. The different steps of the sample preparation will be described in detail in the following paragraphs.
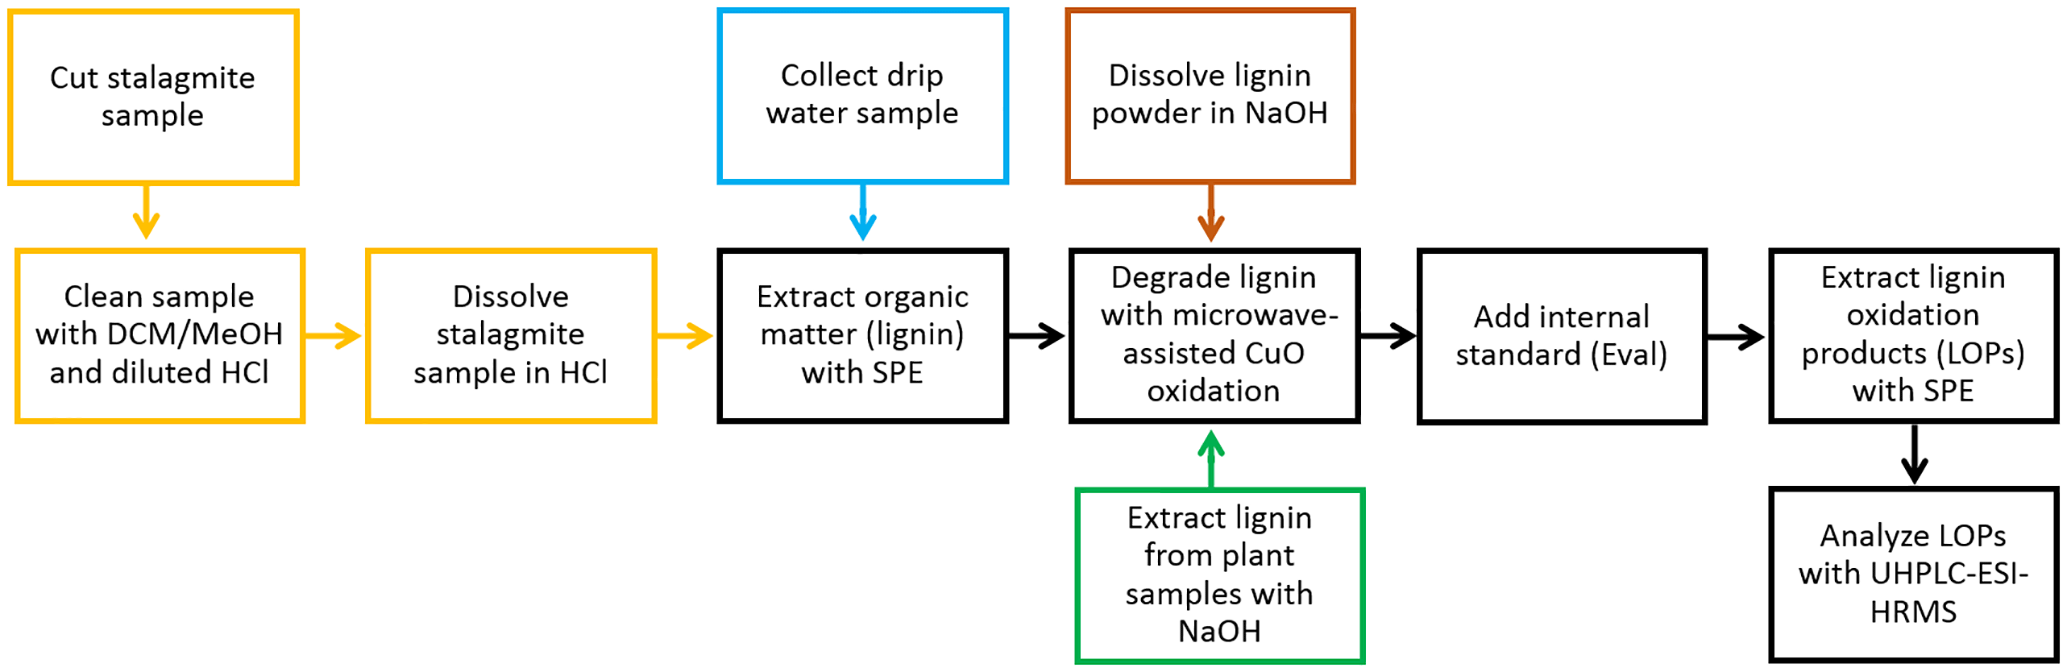
Figure 1Process chart of the overall sample preparation procedure. A detailed description of the individual steps is given in Sect. 2.2.
2.2.1 Preparation of standards
Stock solutions of all analytical standards were prepared at a concentration of 1 mg mL−1 in ACN. A mixed stock solution of all analytical standards was prepared by dilution of the individual stock solutions to a concentration of 10 µg mL−1 in ACN. The stock solutions were stored at −18 ∘C. For the external calibration standards, the mixed stock solution was freshly diluted to the appropriate concentrations ranging from 20 to 2000 ng mL−1 in H2O ∕ ACN 9:1 (v∕v). To optimize the SPE procedure for the LOPs, 100 µL of a 1 µg mL−1 mixed standard solution in H2O ∕ ACN 9:1 (v∕v) was added to 20 mL of a 2 mol L−1 sodium chloride solution that was acidified to pH 2 with HCl (30 %) to simulate the sample solution after the microwave digestion step.
2.2.2 Sampling and preparation of stalagmite samples
Stalagmite NG01 from the Herbstlabyrinth-Advent Cave, central Germany, was 50 cm long and had a diameter of approximately 15 cm. It was cut along the growth axis using a diamond-blade saw. From one of the two halves, a 1 cm thick slab was cut, which was then dated using the 230Th–U method (Mischel et al., 2016). This showed that the oldest part of the stalagmite grew at ca. 11 000 years BP, whereas the youngest part stems from recent time. Thus, the stalagmite covers the Holocene. The inner part of the stalagmite slab, close to the growth axis, was already used for stable isotope and trace element (Mischel et al., 2016, 2017) as well as fatty acid analysis (Bosle et al., 2014). Thus, the samples for this study had to be taken from the outer part of one-half of the stalagmite slab. Pieces of calcite approximately 0.5–1.2 cm in width, 2.5–3.7 cm in length, and with a weight of 3.0–5.4 g were cut from the slab using a diamond-wire saw following the growth lines of the stalagmite. Care was taken to always leave 2 cm of space to the outer surface of the stalagmite to avoid contamination and dating problems.
To clean the stalagmite samples, each sample was covered with DCM ∕ MeOH 9:1 (v∕v) and cleaned for 10 min at 35 ∘C in an ultrasonic bath. The solvent was discarded, and the cleaning was repeated a second time. Afterwards, the samples were rinsed with ultrapure water, then each sample was covered with ultrapure water, and 250 µL of HCl (30 %) was added to etch away the outermost layer of calcite, which might be contaminated. After 5 min, the samples were rinsed with ultrapure water, dried, and weighed. The samples were then placed in clean glass vials and 2.1 mL of HCl (30 %) per gram of stalagmite was added to dissolve the calcite overnight at room temperature. Before extracting the solutions using SPE, they were diluted 1:1 with ultrapure water to prevent clogging of the cartridges.
2.2.3 Sampling and preparation of drip water samples
The drip water samples were collected in the framework of a monthly cave monitoring program (Mischel et al., 2015, 2016). All samples presented here were sampled in October 2014 at different drip sites (two fast drip sites, D1 and D5, with a drip rate of 0.3–0.5 drops s−1, one slow drip site, D2, with a drip rate of approx. 60 mL month−1, and one sample from a cave pool, PW). In addition, soil water (SW) was sampled in a meadow above the cave, and rainwater (RW) was sampled at a weather station above the cave. More information on the sampling techniques can be found in Mischel et al. (2015, 2016). The samples were collected in pre-cleaned glass vessels. To prevent the growth of microorganisms, 5 % (w∕w) of acetonitrile were added shortly after sampling. The samples were then stored at 4 ∘C in the dark for several months. Before extracting the samples using SPE, they were acidified to pH 1–2 with HCl.
2.2.4 Preparation of lignin and fresh plant tissue samples
The lignin powder was dissolved in NaOH (2 mol L−1) at a concentration of 1 mg mL−1. 100 µL of this solution was added into the microwave reaction vessel. The plant samples (leaves and branches of Amur maple and needles and branches of European yew, all collected in Mainz, Germany) were cut in small pieces and dried in an oven at 50 ∘C for 2 days. 10 mg mL−1 was soaked in NaOH (2 mol L−1) for several days. 1 mL of this solution was filtered over 1 µm filters and added into the microwave reaction vessels.
2.2.5 Solid-phase extraction of organic matter in dissolved stalagmite solution and drip water samples
The SPE cartridges were preconditioned with 3 mL of MeOH followed by 3 mL of ultrapure water, which was acidified to pH 1–2 with HCl. The diluted stalagmite solution or the acidified drip water sample was loaded onto the cartridges using sample reservoirs. The drip rate was always below 1 drop s−1. The cartridges were washed twice with 3 mL of acidified ultrapure water and dried for 20 min by sucking ambient air through the cartridges using a vacuum manifold. The lignin was eluted with six portions of 250 µL of MeOH. The solvent was evaporated to almost dryness under a gentle stream of nitrogen at 30 ∘C. The residue was redissolved in 1.5 mL of NaOH (2 mol L−1), the solution was sonicated for 10 min at 45 ∘C, and added into the microwave reaction vessel. The sample vial was sonicated again with 1.5 mL of NaOH (2 mol L−1) and this solution was added into the microwave reaction vessel, too.
2.2.6 Microwave-assisted CuO oxidation
The microwave-assisted CuO oxidation procedure was performed according to the method described by Goñi and Montgomery (2000) with slight modifications. An Ethos Plus Microwave Labstation (MLS GmbH, Germany) was used with an HPR-1000/10S high-pressure segment rotor, which can hold up to 10 reaction vessels, and an ATC-CE temperature sensor to measure the temperature inside one reaction vessel. 100 mL Teflon vessels were used as reaction vessels. Each vessel was loaded with 250 mg of CuO, 50 mg of (NH4)2Fe(SO4)2⋅6 H2O, and 8 mL of NaOH (2 mol L−1) in total, including the sample solution. The NaOH solution was purged with nitrogen for 30 min before use to remove dissolved oxygen, which could lead to overoxidation of the lignin oxidation products. For the same reason, the vessels were purged with an argon flow of 1 mL min−1 for 1 min and then quickly capped to ensure an inert gas atmosphere in the vessels. The vessels were shaken well and then placed in the high-pressure segment rotor of the microwave oven. The temperature was increased to 155 ∘C in 5 min and then held at 155 ∘C for 90 min. Afterwards, the vessels were allowed to cool down to room temperature overnight. Directly after opening the vessels, 50 µL of a 1 µg mL−1 standard solution of ethyl vanillin in H2O ∕ ACN (9:1, v∕v) was added as an internal standard into each vessel except the blank sample. The reaction solutions were transferred to 15 mL centrifuge tubes and the reaction vessels were rinsed twice with 3 mL of NaOH (2 mol L−1). The combined solutions were centrifuged for 10 min at 3000 rpm and the supernatant was decanted into glass vessels. The residue was suspended in 5 mL of NaOH (2 mol L−1) using a vortex mixer, centrifuged again for 10 min at 3000 rpm, and the supernatant was combined with the sample solution.
2.2.7 Solid-phase extraction of LOPs in the oxidized sample solution
The oxidized sample solution was acidified to pH 1–2 with HCl. The conditioning, loading, washing, and drying steps of the SPE cartridges were the same as described in Sect. 2.2.5. The LOPs were eluted with four portions of 250 µL of ACN with 2 % of ammonia added to reach a basic pH of 8–9. The eluate was evaporated to dryness in a gentle stream of nitrogen at 30 ∘C and the residue was redissolved in 200 µL H2O ∕ ACN (9:1).
2.2.8 UHPLC–ESI–HRMS analysis
The analysis of the lignin oxidation products was carried out on a Dionex UltiMate 3000 ultrahigh-performance liquid chromatography system (UHPLC) that was coupled to a heated electrospray ionization source (ESI) and a Q Exactive Orbitrap high-resolution mass spectrometer (HRMS) (all by Thermo Fisher Scientific). To separate the LOPs, a Hypersil GOLD pentafluorophenyl (PFP) column, 50 mm × 2.1 mm with 1.9 µm particle size (also by Thermo Fisher Scientific), was used. The injection volume was 15 µL. A H2O ∕ ACN gradient program was applied. The gradient started with 10 % eluent B (consisting of 98 % ACN and 2 % H2O) and 90 % eluent A (consisting of 98 % H2O, 2 % ACN, and 400 µL L−1 formic acid), which was held for 0.5 min. Eluent B was increased to 12 % within 2 min, held for 1 min, further increased to 50 % within 1.25 min, held for 0.75 min, and increased to 99 %. This composition was held for 2 min, then eluent B was decreased to the initial value of 10 %.
The ESI source was operated in negative mode so that deprotonated molecular ions [M-H]− were formed. The spray voltage was −4.0 kV, the ESI probe was heated to 150 ∘C to improve the evaporation of the aqueous solvent, the capillary temperature was 350 ∘C, the sheath gas pressure was 60 psi, and the auxiliary gas pressure was 20 psi.
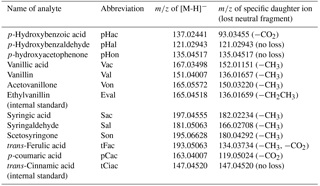
The mass spectrometer was operated in full scan mode with a resolution of 35 000 and a scan range of m∕z 80–500. At the respective retention time windows, the full scan mode was alternated with a targeted MS2 mode with a resolution of 17 500 to identify the LOPs by their specific daughter ions; see Table 1. For the MS2 mode (i.e., parallel reaction monitoring mode in the software Xcalibur, provided by Thermo Fisher Scientific), higher-energy collisional dissociation (HCD) was used with 35 % normalized collision energy (NCE) for all analytes. The actual collision energy was calculated by the software on the basis of the mass and charge of the selected precursor ions and was in the range of 10–14 eV.
Table 1Names and abbreviations of the analytes with the respective m/z values of their deprotonated molecular ions [M-H]− and their specific daughter ions.
3.1 Method development
3.1.1 Separation of LOPs with LC gradient elution and identification of LOPs with MS/MS experiments
A sufficient separation of the 11 LOPs and two internal standards was achieved within 4.5 min on a PFP column with H2O ∕ ACN gradient elution, as can be seen in Fig. 2, which shows the normalized chromatogram of 14 LOP standards. The analytes were identified via the exact mass of their molecular ion, their retention time compared to standards, and their fragmentation pattern in the MS2 spectrum. As the chromatograms of the real samples were very complex, all three methods were indeed required to identify and quantify the analytes. Whenever possible, the quantification was done by integrating the chromatographic peak of the molecular ion. However, when the target analyte peak could not be baseline separated from another signal, the chromatographic peak of a specific daughter ion was used to quantify the analyte.
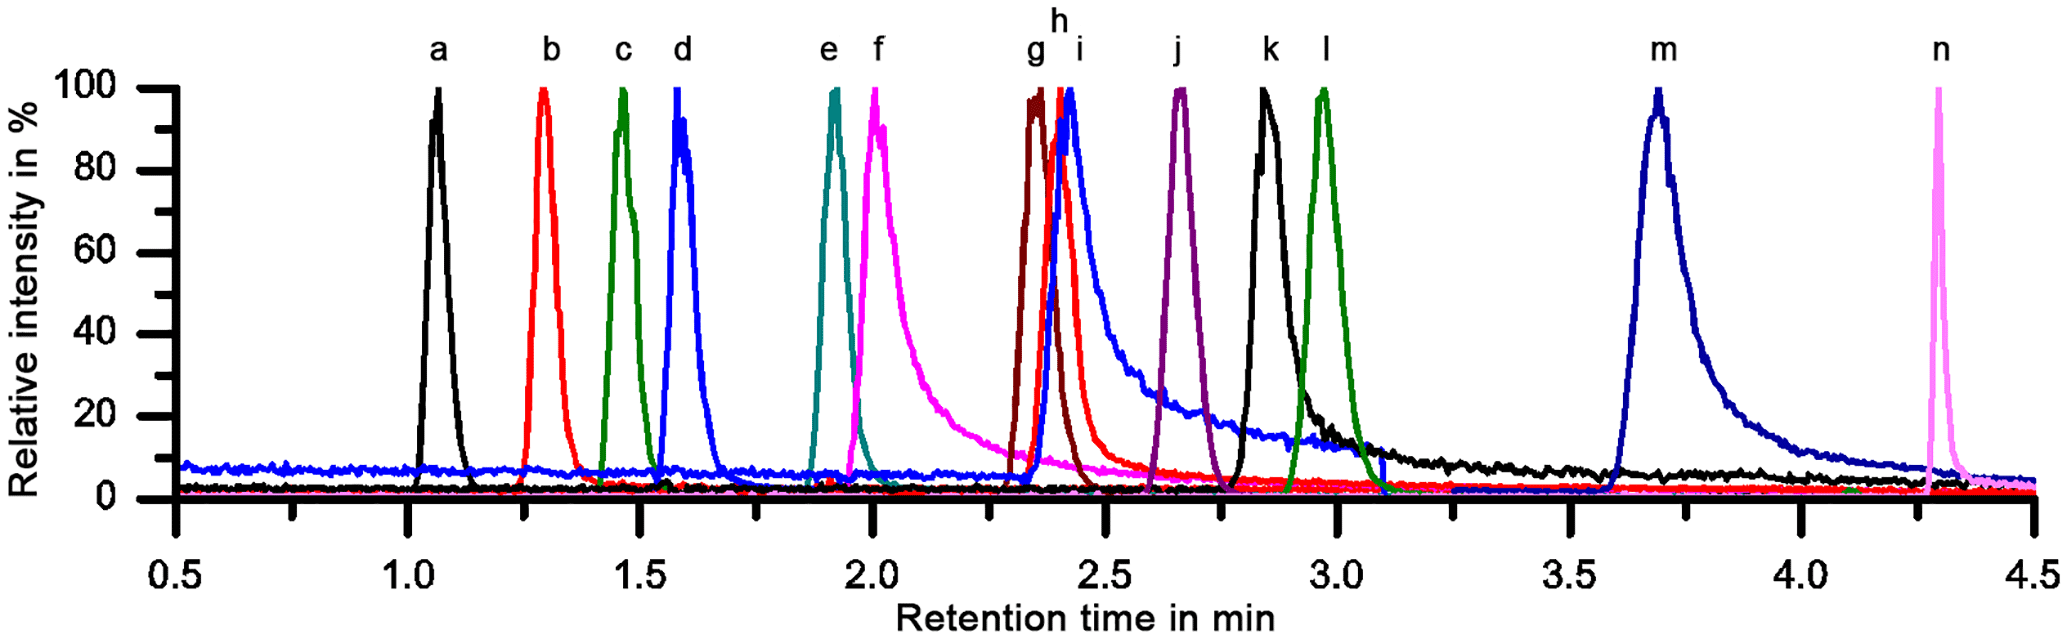
Figure 2Normalized chromatogram of 14 LOP standards on a PFP column. Explanation of the peak numbers (for abbreviations see Table 1): a: pHac, b: Vac, c: Sac, d: pHal, e: pHon, f: Val, g: pCac, h: Sal, i: Von, j: cFac, k: Son, l: tFac, m: Eval, n: tCiac.
3.1.2 Optimization of the solid-phase extraction procedure for LOPs
Two different types of SPE cartridges were tested. The polymer-based Oasis HLB cartridges (hydrophilic lipophilic balanced polymer; Waters) showed better reproducibility and equal recovery values compared to the silica-based Supelco C18 cartridges (Sigma-Aldrich). The recovery rates could be improved by adding ammonia to the elution solvent, ACN, or MeOH, as can be seen in Fig. 2. The basic pH value of the eluent leads to deprotonation of the phenolic hydroxyl group. In this ionic state, the analytes are better soluble in the polar mobile phase and their adsorption to the stationary phase is weakened. Since we observed an oxidation of aldehydes and an isomerization of p-coumaric acid and ferulic acid when MeOH was used as elution solvent – an observation that has been made before (Lima et al., 2007) – ACN with ammonia was used as elution solvent. The recovery rates ranged from 69 % to 101 % and are shown in Fig. 3 and Table 2.
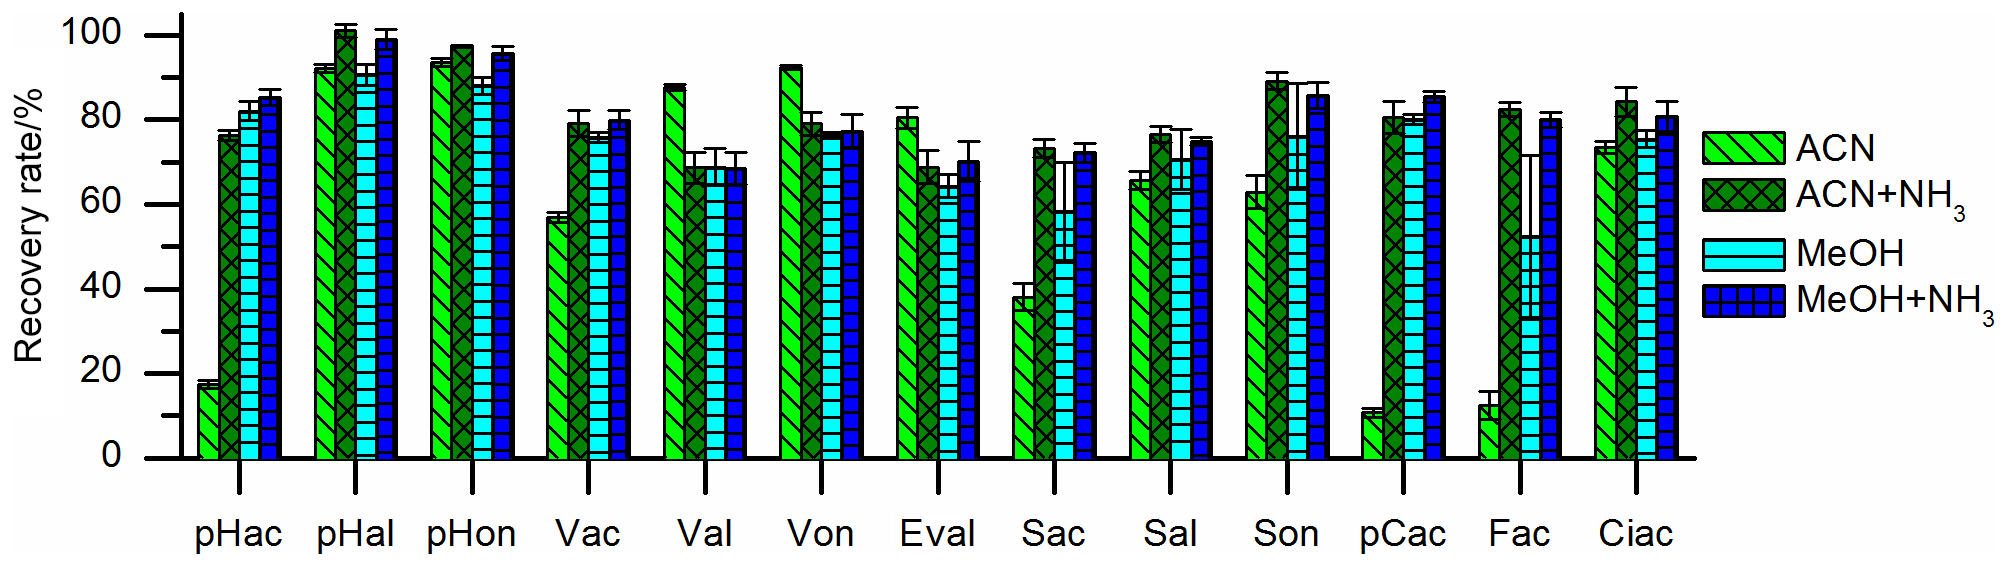
Figure 3Recovery rates of the 13 LOPs on oasis HLB SPE cartridges eluted with acetonitrile (ACN), acetonitrile with ammonia (ACN+NH3), methanol (MeOH), and methanol with ammonia (MeOH+NH3). The recovery rates improved significantly if ammonia was added to the elution solvent.
Ethyl acetate was tested as an elution solvent, too, as used by Kögel and Bochter; however, the recovery rates were lower than with methanol or acetonitrile. In addition, it was observed that with ethyl acetate, aldehydes were lost in the evaporation step (Fig. S1 in the Supplement). The SPE method was tested with spikes of LOP standards of different concentrations, reaching 25 to 1000 ng in 20 mL of surrogate sample solution (i.e., 1.25–50 ng mL−1 in the surrogate sample solution or 125–5000 ng mL−1 in the final sample solution injected into the LC–MS system). The recovery rate was constant at all concentration levels and the linearity was very good (R2>0.9990) for all analytes (Figs. S2 and S3).
3.1.3 Comparison of different durations and temperatures of the CuO oxidation method
In former studies, the duration of the CuO oxidation method varied between 90 and 180 min and temperatures of 150 or 170 ∘C have been applied. Therefore, we compared temperatures of 155 and 175 ∘C (the temperature of the microwave program was chosen 5 ∘C higher than the desired temperature in the Teflon vessels) and durations of 90 and 180 min using 100 µg of mixed lignin as a standard sample and three subsamples for each constellation. The results are shown in Fig. 4. At a temperature of 175 ∘C and a duration of 180 min, the concentrations of almost all LOPs were dramatically diminished, probably due to overoxidation. For Val, Von, Sal, pCac, and Fac, the highest concentrations were reached with 155 ∘C and 90 min, and every increase in temperature or duration of the oxidation step resulted in a loss of analyte. In consequence, the C ∕ V ratio decreased from 0.037 for 155 ∘C at 90 min to 0.018 for increased temperature, to 0.014 for increased duration, and to 0.009 if both were increased. Similarly, the Vac ∕ Val ratio increased from 0.44 for 155 ∘C at 90 min to 0.83 for increased temperature and to 0.54 for increased duration. For the Sac ∕ Sal ratio, the increase was from 0.16 for 155 ∘C, 90 min to 0.37 and 0.28, respectively. These results show that especially the C-group LOPs, pCac and Fac, as well as the aldehydes Val and Sal and the ketone Von, are prone to overoxidation. Therefore, care should be taken to adjust the temperature and duration of the CuO oxidation step to avoid overoxidation of the LOPs; otherwise the lignin oxidation parameters, C ∕ V, S ∕ V, and acid ∕ aldehyde ratios, will be distorted. The prevention of overoxidation by the addition of glucose was also tested; however, this did not improve the analysis (see Figs. S4 and S5).
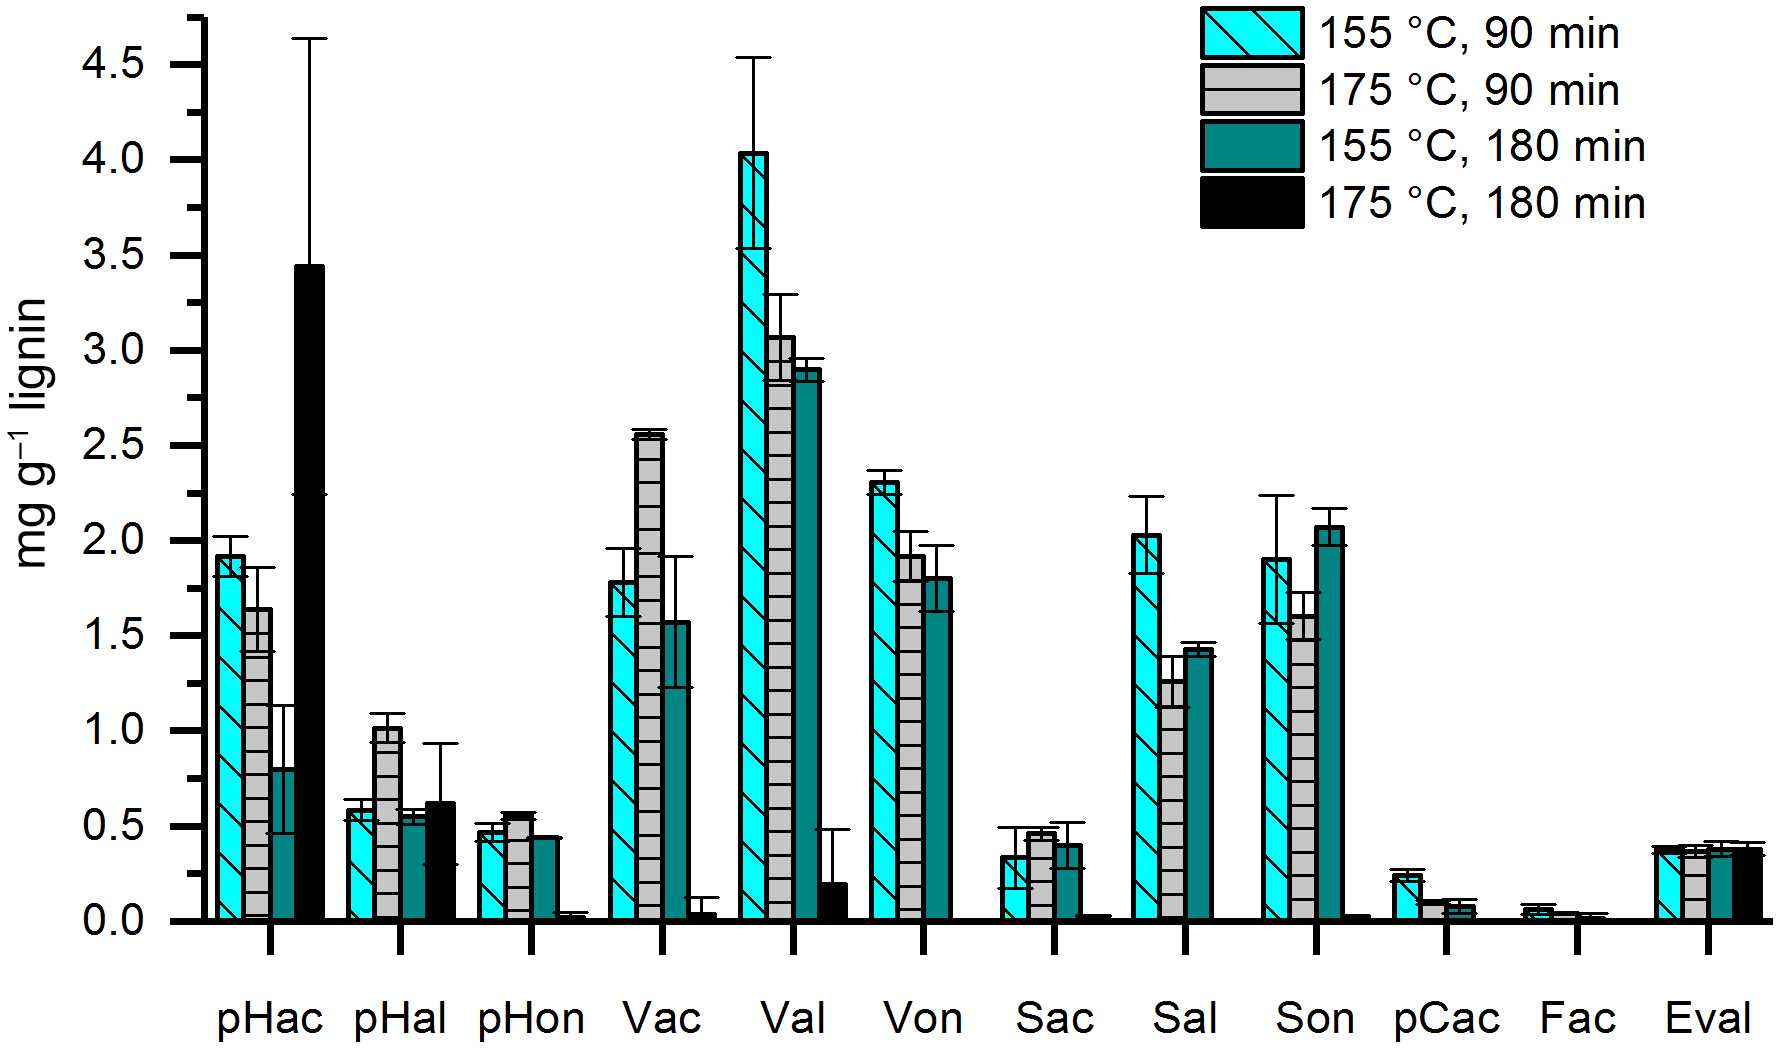
Figure 4Results of a CuO oxidation step at 155 ∘C and 90 min (light blue bars with diagonal stripes), 175 ∘C and 90 min (grey bars with horizontal stripes), 155 ∘C and 180 min (dark cyan bars), and 175 ∘C and 180 min (black bars). Eval was added after the CuO oxidation step as an internal standard
3.1.4 Comparison of two sample preparation methods – acid digestion of the stalagmite samples and direct CuO oxidation of stalagmite powder
Obviously, each individual step in the analytical sample preparation method includes the risk of positive or negative artifacts, especially if large amounts of chemicals are added. Therefore, experiments were performed to test whether the HCl dissolving step can be skipped by grinding the stalagmite sample and directly adding the powder into the microwave reaction vessels. 24 g of cleaned stalagmite sample was coarsely crushed and mixed. 12 g of this sample mixture was dissolved in HCl and extracted via SPE as described above. The solution was then divided into three subsamples. The other 12 g was finely ground in a mortar, divided into three subsamples, and added directly into the microwave reaction vessels. Figure 5 shows that the LOP concentrations found in the acid-digested samples were higher for most analytes than in the ground samples. An explanation for this finding might be that at least a part of the lignin particles is bound in the calcite crystals and is only fully released in the acid digestion method. Blyth et al. (2006) already stated similar findings for lipid biomarkers. Consequently, the acid digestion step is essential for the analysis of the target analytes in speleothems.
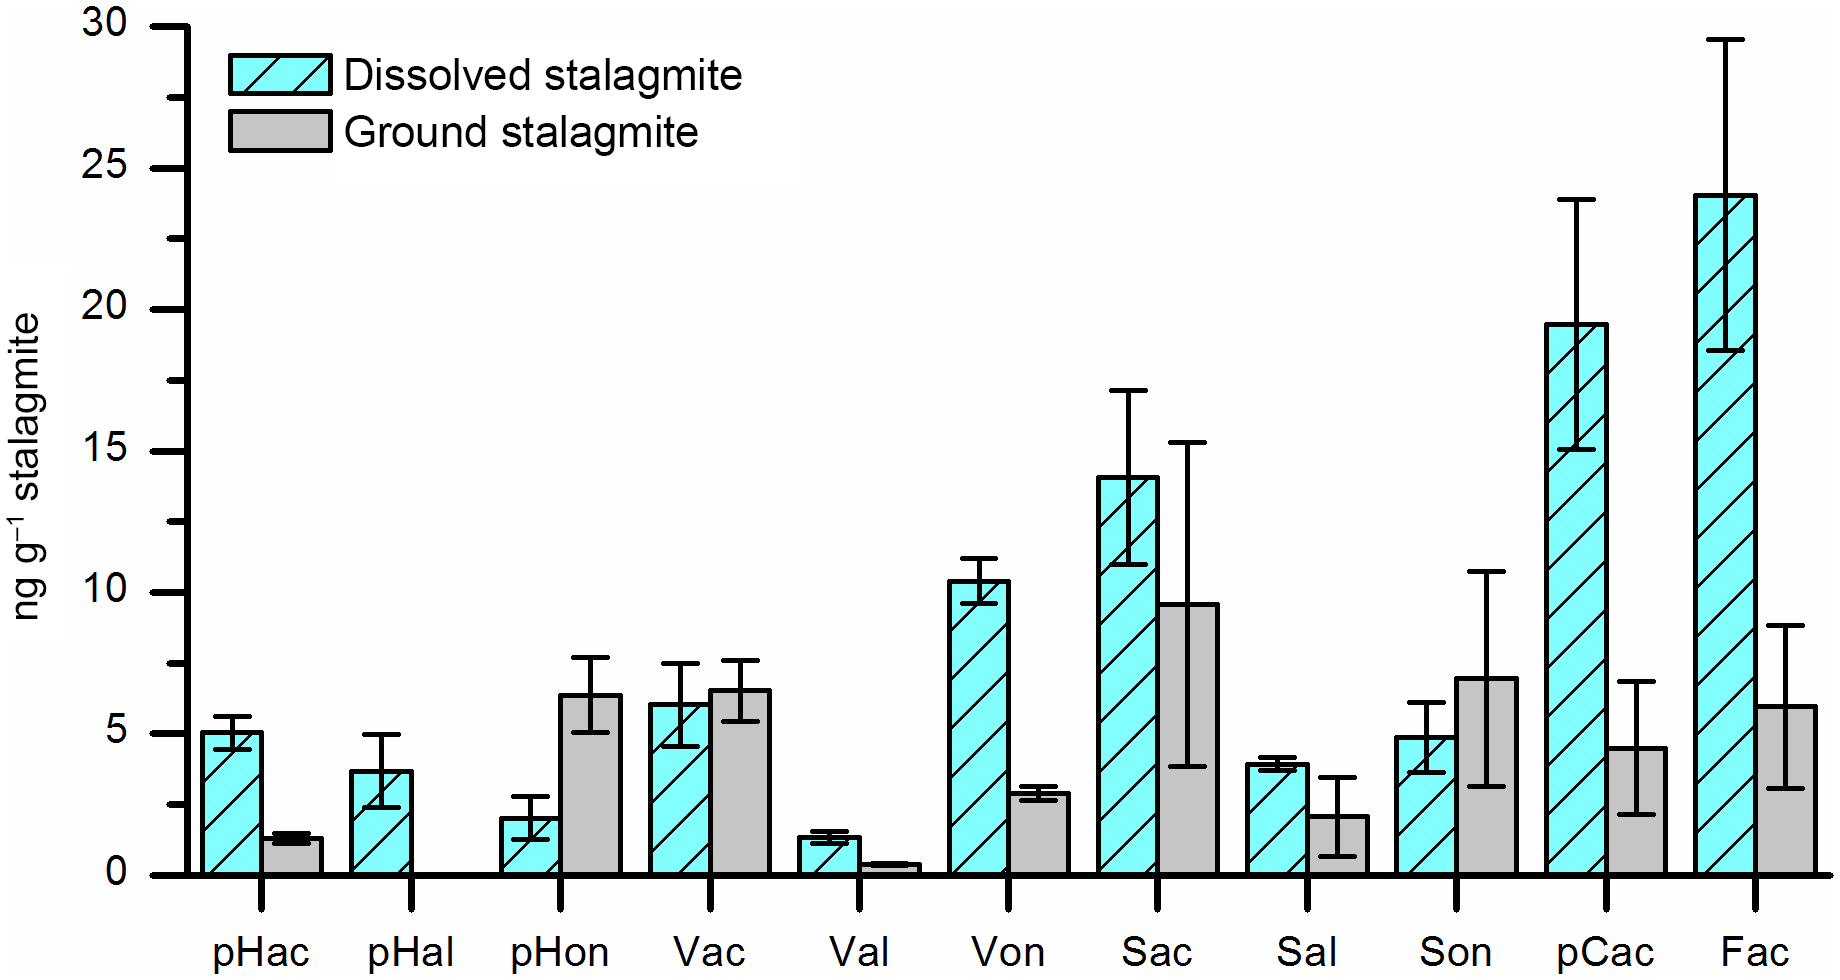
Figure 5Results of dissolved stalagmite samples (light blue bars with diagonal stripes) compared to ground stalagmite samples (grey bars). Dissolving of the samples led to higher amounts of LOPs.
3.2 Method validation and quality assurance
3.2.1 Selectivity
The selectivity of the method was ensured by using three parameters for peak identification: the retention time, the exact m∕z ratio of the analyte, and the MS2 spectra, as described in Sect. 3.1.1. The variation in the retention time was ±0.01 min. To ensure that the measured peak area was caused only by the analyte, the corresponding peak area of the reagent blank measurement was subtracted.
3.2.2 Calibration and linearity
External calibration with a standard mixture containing all analytes was performed. The calibration function was obtained using the linear regression method. The parameters of the individual calibration functions are shown in Table S1 in the Supplement. The concentrations of the standards ranged from 20–500 ng mL−1 for stalagmite and drip water samples and up to 2000 ng mL−1 for plant and lignin samples. The calibration was linear in this range.
3.2.3 Limits of detection and quantification and reagent blanks
The instrumental limits of detection (LOD) and quantification (LOQ) were calculated by using Eqs. (1) and (2), with σ0 representing the standard deviation of the peak area of the solvent blank or, if no signal was detectable for the solvent blank, of the lowest calibration standard and the slope of the calibration function, m. The results are shown in Table S1.
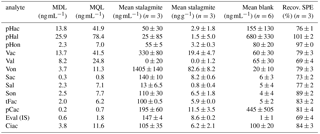
To eliminate the influence of possible contamination sources on the results, a reagent blank, which had undergone all sample preparations steps, was analyzed with every batch of samples. The concentrations of LOPs measured in this reagent blank were subtracted from the concentrations measured in the samples. The mean values of six reagent blanks measured on different days are shown in Table 2 (the concentrations refer to the final sample solution injected into the LC–MS system). The values ranged from 1.0 to 680 ng mL−1, depending on the analyte (see also Sect. 3.2.4). The blank value varied from batch to batch, which is reflected in the standard deviations of the blank values given in Table 2. Therefore, the method detection limit (MDL) and the method quantification limit (MQL) were calculated using only the standard deviation of the peak area of the reagent blank, as shown in Eqs. (3) and (4), with σB representing the standard deviation of the peak area of the reagent blank and m as the slope of the calibration function. The MDL was below 13.7 ng mL−1 for all relevant analytes and the MQL was below 41.5ng mL−1 for all relevant analytes.
Table 2Method detection limit after the subtraction of the reagent blank (MDL) in ng mL−1, method quantification limit after the subtraction of the reagent blank (MQL) in ng mL−1, mean value of three subsamples of 3.4 g stalagmite after blank subtraction in ng mL−1 and in ng g−1 of the initial stalagmite sample, mean blank value of six reagent blanks measured on different days in ng mL−1, and recovery values of the SPE procedure to extract LOPs (Recov. SPE) in %. All concentrations in ng mL−1 refer to the final sample solution injected into the LC–MS system. The errors stated in this table are standard deviations of n samples. For the methods of calculation used please refer to the text. The abbreviations for the analytes are shown in Table 1.
3.2.4 Origin of blank values
The blank values shown in Table 2 reflect the natural occurrence of the different analytes. The highest blank values have been found for the p-hydroxy group, p-coumaric acid, cinnamic acid, vanillin, and vanillic acid. The p-hydroxy group is known to originate not only from lignin, but also from protein-rich material such as bacteria (Jex et al., 2014). For p-hydroxy acetophenone, which has a lower blank value than p-hydroxy benzoic acid and p-hydroxy benzaldehyde, it is in discussion whether it originates from lignin or from other sources (Dittmar and Lara, 2001). p-Coumaric acid occurs in sporopollenin (Fraser et al., 2012; Montgomery et al., 2016), which is a major component of pollen and fungal spores and also occurs in some forms of algae (Delwiche et al., 1989). Therefore, para-coumaric acid might be introduced into the sample via the laboratory air or via insufficiently purified water. Vanillin and its oxidized form vanillic acid are frequently used as perfumes and flavorings in food, cosmetics and household cleaning products. Therefore, these compounds might also be introduced into the sample via the laboratory air or via detergents used to clean the lab ware. Cinnamic acid is used as a perfume and flavoring, too, and it also occurs naturally in bacteria, fungi, and algae, as it is part of the shikimate pathway (Dewick, 2009). In this study, cinnamic acid was found in the blank and in all samples. Therefore, cinnamic acid is not suitable as an internal standard in the analysis of LOPs in natural samples, although it has been used as an internal standard in many studies before (Goñi and Montgomery, 2000; Kaiser and Benner, 2012). Ethyl vanillin is much more suitable as an internal standard because, as an artificial compound, it has very low blank values and does not occur in natural samples.
Table 3Concentrations of the V-, S-, and C-group LOPs, the sum of all eight LOPs (Σ8), and the ratios C ∕ V and S ∕ V in fresh plant and lignin samples.
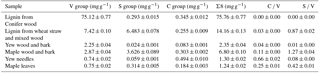
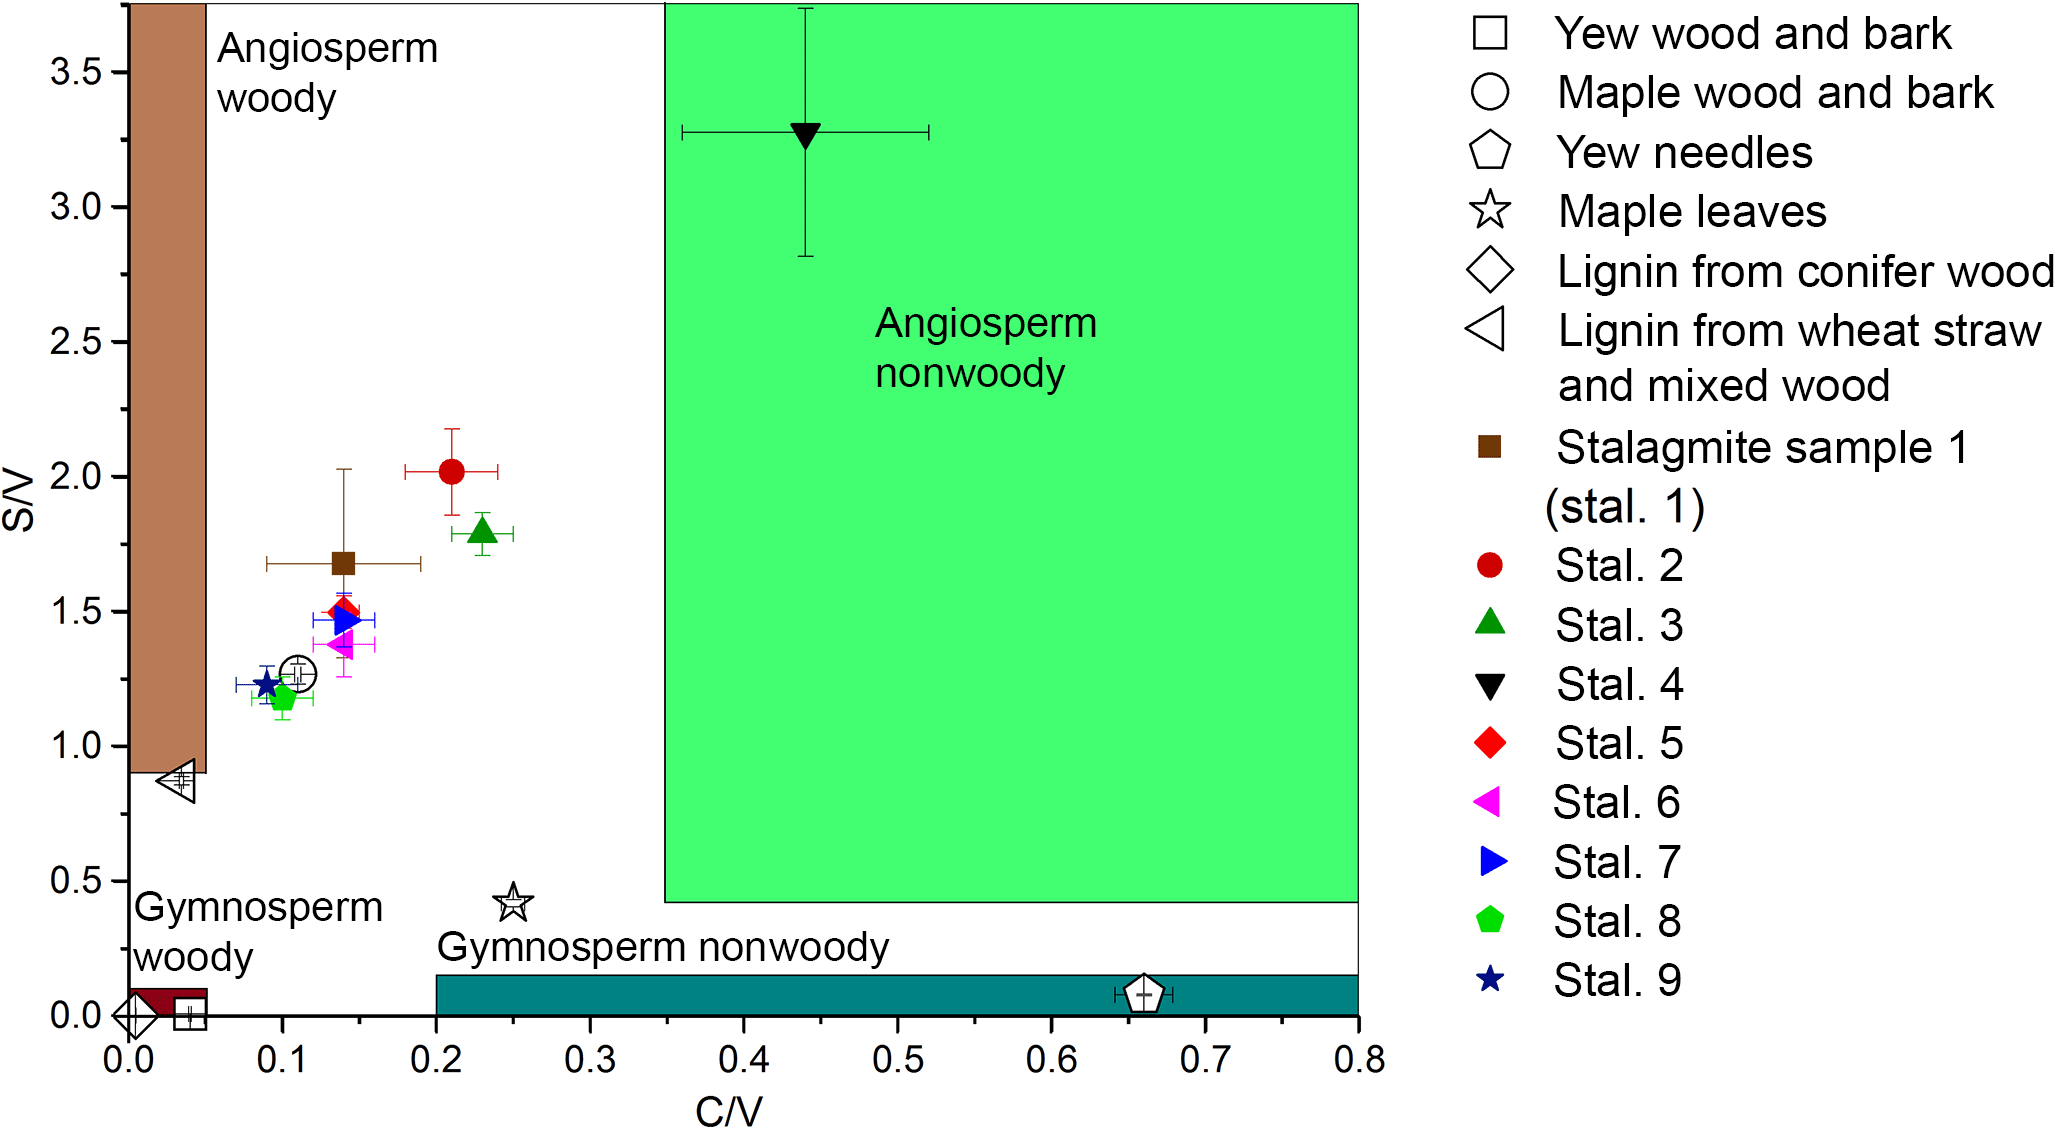
Figure 6Lignin oxidation parameters S ∕ V vs. C ∕ V of different real samples and regions for different sample types defined by Hedges and Mann in 1979.
3.2.5 Repeatability
To determine the repeatability of the sample preparation and analysis method, 10.2 g of stalagmite was dissolved, and the solution was divided into three subsamples containing 3.4 g of stalagmite. The mean values and standard deviations for all analytes are shown in Table 2. The relative standard deviations ranged from 0.7 % to 32 % for analytes with more than 2.6 ng (50 % for Sal with 2.6±1.3 ng). For the p-hydroxy group, the relative standard deviations were higher, but these analytes were not used for the determination of LOP parameters. The LOP parameters calculated from these three subsamples were a C ∕ V ratio of 0.17±0.04 and an S ∕ V ratio of 0.15±0.02. The variability was mainly caused by the CuO oxidation step, which is known to cause relatively high variability even in samples with higher lignin content (for example, Hedges and Mann, 1979, with standard deviations ranging between 3 % and more than 80 %). The SPE method used for the extraction of LOPs had standard deviations between 1 and 6 % (Table 2) and therefore did not contribute much to the overall variability of the method.
3.2.6 Estimation of uncertainty
According to Konieczka and Namieśnik (2010), the main factors contributing to the uncertainty budget are the uncertainty of the measurement of the weight or volume of the sample, ur(sample), the repeatability of the sample preparation procedure, ur(rep.), the recovery determination of the internal standard, ur(recov.), the calibration step, ur(cal.), and the uncertainty associated with analyte concentrations close to the limit of detection, ur(LOD). The combined relative uncertainty Ur is expressed in Eq. (5).
In our method, ur(sample) is relatively small with 1 mg or 1 mL, which is usually <1 %. The uncertainty associated with the repeatability of the sample preparation, calculated as the standard deviation of three individually prepared subsamples as explained in Sect. 3.2.5, has the largest influence and can equal 1–30 %. The uncertainty of the recovery determination of the internal standard, calculated as the standard deviation of the internal standard, contributes with 1 %–6 %. ur(cal.), calculated as the standard deviation of the concentration determination of three injections of the same sample into the LC–MS system, can equal 1 %–15 %, but is usually around 3 %–5 %. ur(LOD), calculated according to Eq. (6), depends strongly on the concentration c of the analyte.
In the data for stalagmite samples presented in Table 2, ur(LOD) equals 0.1 %–5 % for most analytes, 17 % for Sal, and 27 %–100 % for the p-hydroxy group.
The errors for all results presented in this work were calculated using the law of the propagation of uncertainty. All equations used for calculating concentrations, lignin oxidation parameters, and errors are shown in Sect. S4 in the Supplement.
Table 4Concentrations of the V-, S-, and C-group LOPs and the sum of all eight LOPs (Σ8) in ng g−1 of the initial stalagmite samples and the ratios C ∕ V and S ∕ V. All samples are from stalagmite NG01 from the Herbstlabyrinth-Advent Cave.
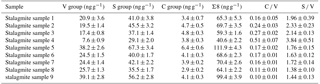
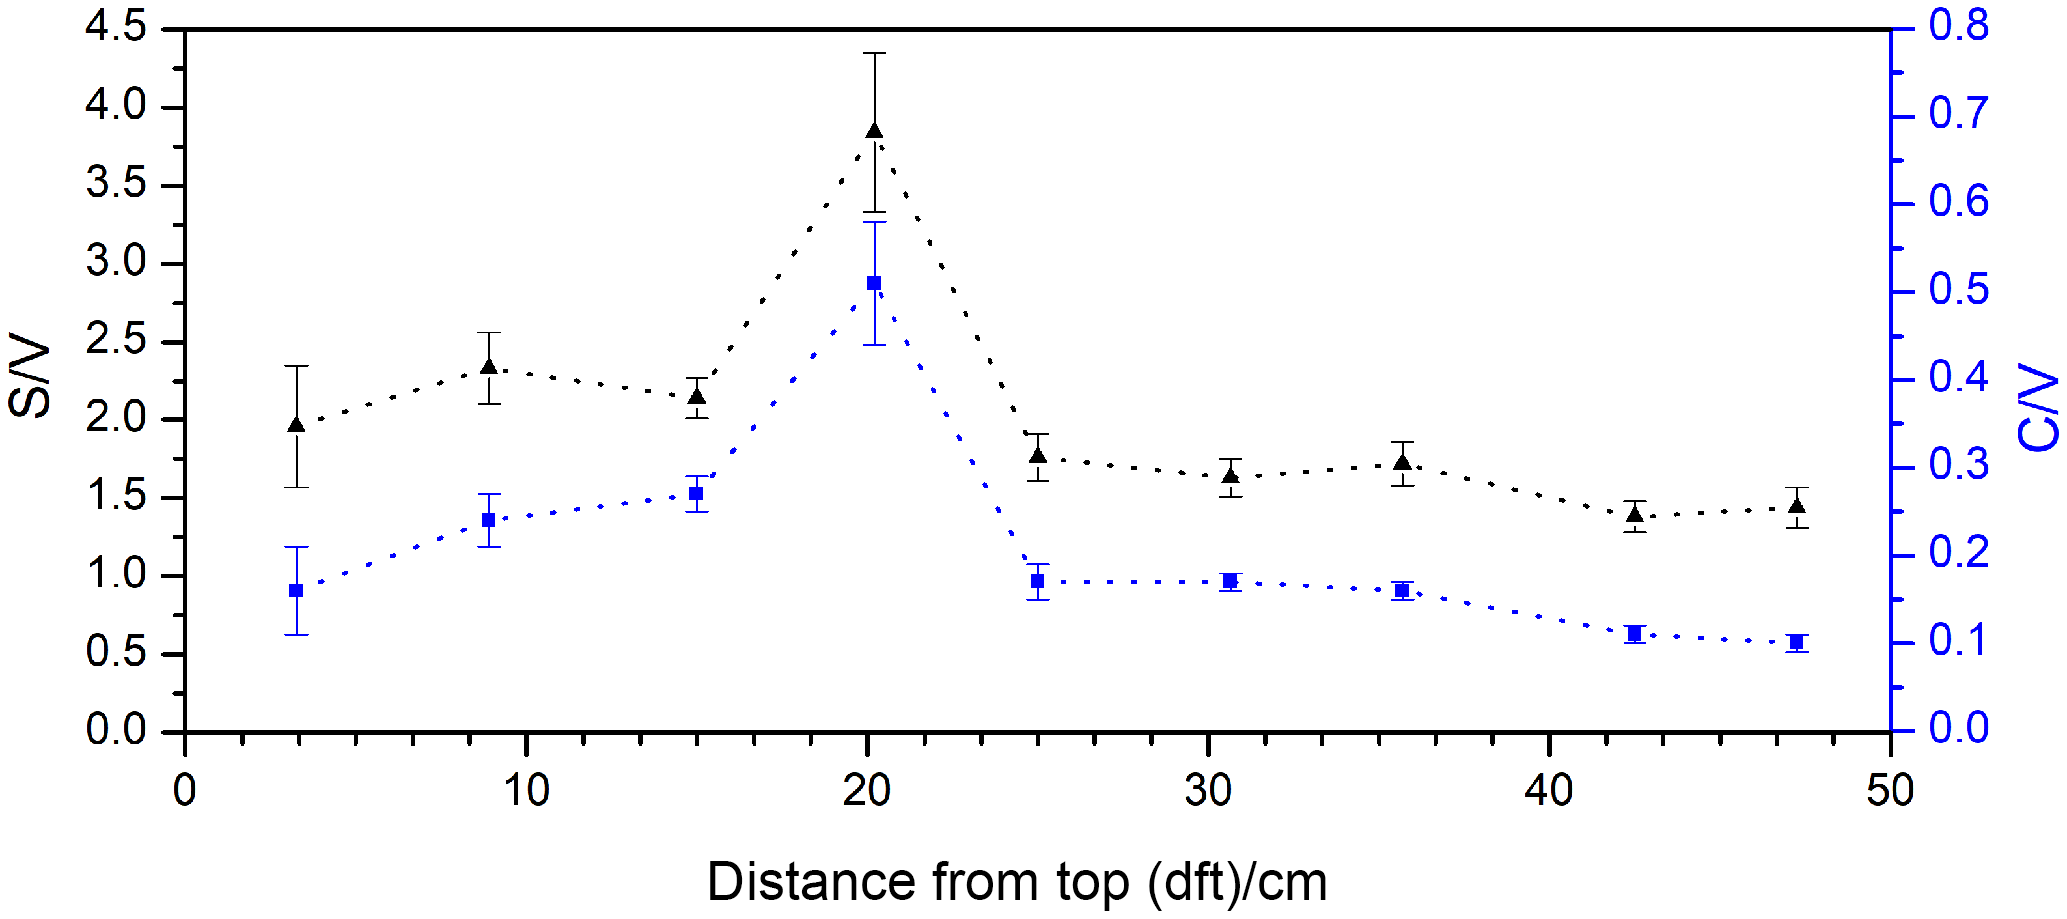
Figure 7S ∕ V (black triangles, left axis) and C ∕ V (blue squares, right axis) ratios of stalagmite NG01 plotted against the distance from the top of the stalagmite.
3.3 Application to real samples
3.3.1 Analysis of plant and lignin samples
The method was applied to different natural samples from known sources to verify that the C ∕ V and S ∕ V ratios are in accordance with published values. The results are shown in Table 3, and their S ∕ V and C ∕ V ratios are visualized in Fig. 5. As expected, the highest concentrations of LOPs are found in the lignin from conifer wood with a Σ8 value of 75.76 mg g−1 and in the lignin from wheat straw and mixed wood with a Σ8 value of 14.16 mg g−1. This means that the CuO oxidation method has a conversion factor of 1.4–7.6 % (w∕w) if applied to pure lignin and that the conversion factor also depends on the type of lignin. The plant tissue samples gave LOP concentrations (Σ8) of 2.3–6.8 mg g−1 for the wood and bark samples and 1.24–1.30 mg g−1 for the leaf and needle samples. These concentrations can be explained by the respective lignin content of the different samples. Figure 5 shows the C ∕ V versus S ∕ V diagram for all samples. The regions for different plant types have been defined by Hedges and Mann in 1979 and are based on the analysis of different plant species. Gymnosperm woody samples contain mainly V-group LOPs. Therefore, they plot close to the origin of the diagram. Angiosperm woody samples contain V- and S-group LOPs, but almost no C-group LOPs. Consequently, they plot close to the S ∕ V axis. Gymnosperm nonwoody samples contain V- and C-group LOPs, but almost no S-group LOPs. Accordingly, they plot close to the C ∕ V axis. Angiosperm nonwoody samples contain all three groups of LOPs and thus show a wide range of C ∕ V and S ∕ V ratios. The analyzed plant samples in our study all plot in or close to the expected regions according to their plant type. Only the maple wood and bark sample and the maple leaf sample plot slightly outside of the regions for angiosperm woody and angiosperm nonwoody material, respectively. For the maple wood and bark sample, this could be due to a higher contribution of C-group LOPs in the bark compared to pure woody samples. However, it is important to keep in mind that these regions are just broadly defined and are based on a limited number of analyses and a limited number of different plant species.
Table 5Concentrations of the V-, S-, and C-group LOPs, the sum of all eight LOPs (Σ8), and the ratios C ∕ V and S ∕ V in different water samples collected at the Herbstlabyrinth-Advent Cave in October 2014.
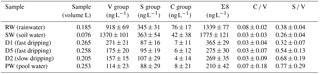
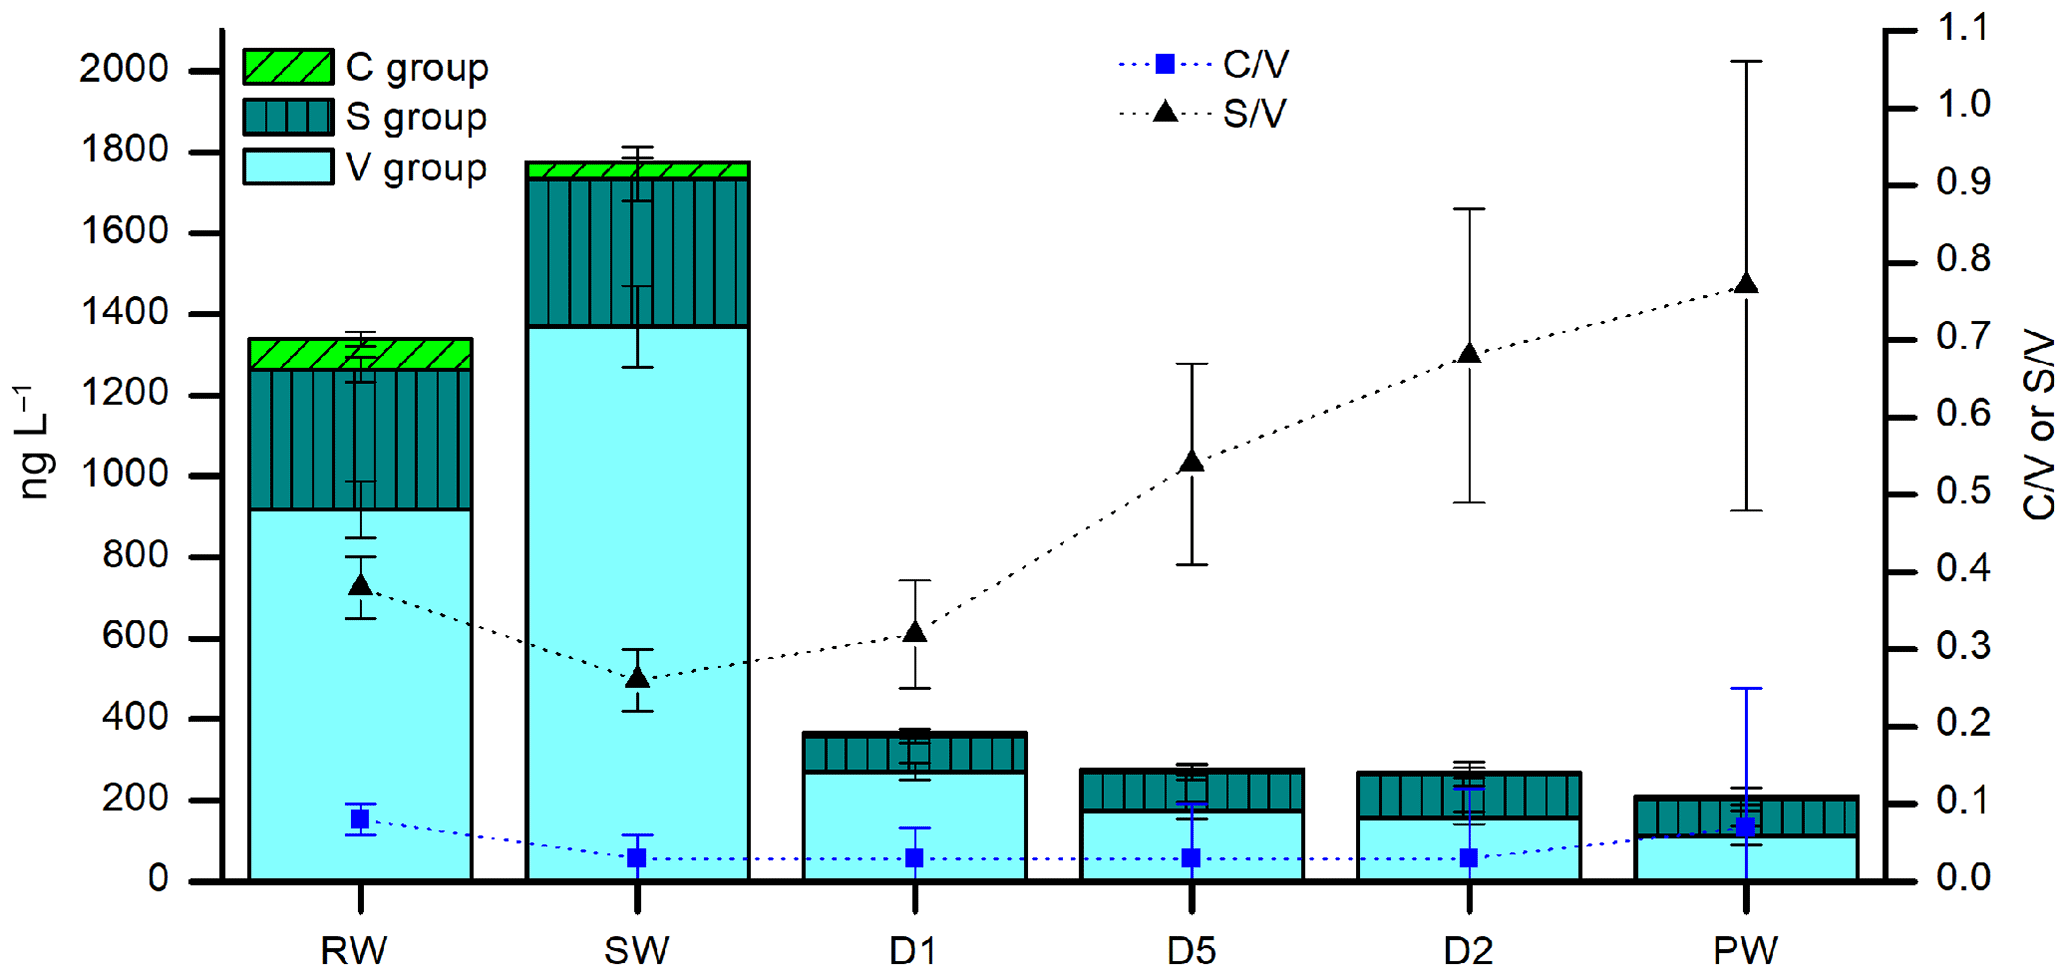
Figure 8LOP concentrations (stacked columns with left axis) and LOP ratios (symbols with right axis) of rainwater (RW), soil water (SW), cave drip water from fast drip sites (D1 and D5) and a slow drip site (D2), and cave pool water (PW). The stacked columns contain the V-group LOPs (light cyan bars), S-group LOPs (dark cyan bars with vertical stripes), and C-group LOPs (green bars with diagonal stripes). Black triangles show the S ∕ V ratio and blue squares show the C ∕ V ratio.
3.3.2 Analysis of stalagmite samples
With a Σ8 value of ca. 40–110 ng (g stalagmite)−1 (Table 4), the LOP concentration of the stalagmite samples is 5 orders of magnitude lower than for the vegetation samples and 3 to 4 orders of magnitude lower than the typical concentration of sediment samples (e.g., Σ8 is 0.15–0.75 mg (g sediment)−1 in Tareq et al., 2011). Because of these low concentrations, 3–5 g stalagmite was required for an analysis to be above the limit of quantification. The C ∕ V ratios of the stalagmite samples were all above 0.5, and the S ∕ V ratios were all above 1.0, which suggests a significant contribution of angiosperm woody and angiosperm nonwoody vegetation. However, gymnosperm woody and gymnosperm nonwoody material might also have contributed to the lignin pool. This suggests a mixed deciduous forest above the cave and would be in accordance with the results of Litt et al., who analyzed pollen from Holocene lake sediments from the West Eifel volcanic field (Litt et al., 2009), which is relatively close to the Herbstlabyrinth.
The nine stalagmite samples were taken at different distances from the top of the stalagmite. This analysis shall serve as a proof of principle for a higher-resolution analysis of the whole stalagmite. In Fig. 6, the C ∕ V and S ∕ V ratios are plotted against distance from top (dft). Both ratios show a pronounced peak at 20 cm dft. Furthermore, both ratios show higher values in the top 15 cm and lower values with a decreasing trend between 30 and 50 cm dft. A higher S ∕ V ratio indicates a higher contribution of angiosperm vegetation to the lignin source, and a higher C ∕ V ratio suggests a higher contribution of nonwoody vegetation. Therefore, the peak at 20 cm dft could be interpreted as increased input of nonwoody angiosperm vegetation, such as grasses, and less input of wood. The decreasing trend in the lower part of the stalagmite indicates a trend towards more woody gymnosperm vegetation, such as pine forest. Of course, these presumptions have to be proven by a complete analysis of the stalagmite and a comparison with the other proxy data (Mischel et al., 2016). In addition, a comparison with Holocene pollen records from the area may confirm these preliminary results. Overall, these first results show significant variability in the C ∕ V and S ∕ V ratios and therefore the lignin sources. This promising result encourages us to use the analysis of LOPs in stalagmites for paleo-vegetation reconstruction.
3.3.3 Analysis of cave drip water samples
Very little is known about how lignin is transported from the soil into the cave and how it is incorporated into a stalagmite. To gain further understanding about these processes, it is useful to also analyze lignin in cave drip water. The lignin concentration in cave drip water is even lower than in stalagmite samples because the crystallization of calcite also serves as an enrichment step for the organic components contained in the water. Therefore, a sample volume of 100–200 mL of water was used. Here we show the results of the analysis of six different water samples from the Herbstlabyrinth-Advent Cave, all sampled in October 2014 (Table 5). As expected, the soil water (SW) has the largest lignin content with 1.8 µg L−1. The rainwater (RW) also has a relatively large lignin content of 1.3 µg L−1, which is surprising since this water has not been in contact with soil or vegetation. The lignin content of the cave drip water samples is much lower, ranging from 0.21 µg L−1 for the pool water to 0.36 µg L−1 for the fast drip site D1. The concentrations of all LOPs decrease from the soil water to the cave drip water, but to a different extent. Whereas V-group LOPs and C-group LOPs decrease by 80 %–92 % and 82 %–90 %, respectively, the concentration of S-group LOPs decreases only by 70 %–76 % (Fig. 8). This is also reflected in higher S ∕ V ratios in the cave drip water than in the soil water, with an increasing trend from the soil water over the two fast drip sites D1 and D5 and the slow drip site D2 to the cave pool water. This could be due to different residence times in the cave and the overlaying karst of the water from the different drip sites. These hypotheses should be proven by a further systematic analysis of cave drip water. This would also enable the study of seasonal variations in the lignin input. The monthly cave monitoring program of Mischel et al. (2015, 2016) combined with our new method for the analysis of LOPs even in low-concentration cave drip water could be a valuable tool to further investigate these topics.
When developing a new analytical method, it is advantageous to consider how environmentally friendly (or green) the different approaches are. The principles of green analytical chemistry include, among others, generating as little waste as possible, eliminating or replacing toxic reagents, miniaturizing analytical instruments, and avoiding derivatization (Armenta et al., 2008; Gałuszka et al., 2013). In our method, we tried to favor greener approaches over less green approaches whenever possible without sacrificing other qualities like sensitivity. We used solid-phase extraction, which consumes considerably less solvent than liquid–liquid extraction, and UHPLC, which is less solvent and time consuming than HPLC. In addition, liquid chromatography does not require a derivatization step, as opposed to gas chromatography. However, the least green step in our method is the CuO oxidation step, as it generates toxic waste and consumes energy. We still chose the CuO oxidation method for our proof of principle analysis because it is the most widely used lignin degradation method for the analysis of LOPs and therefore allows us to compare our results with existing LOP records. In the future, however, a greener approach to the degradation of lignin to LOPs should be chosen, which could, for example, be based on electrolysis, preferably in a miniaturized flow cell (Leppla, 2016).
We developed a sensitive method for the quantification of LOPs in speleothems and cave drip water and tested it successfully on samples from the Herbstlabyrinth-Advent Cave. This is, to our knowledge, the first quantitative analysis of LOPs in speleothems and cave drip water. Our method provides a new and highly specific vegetation proxy for the reconstruction of paleo-vegetation and paleoclimate from speleothem archives. The method was adjusted to the low concentrations of organic matter in speleothems and cave drip water and showed sufficient sensitivity to detect even trace concentrations of lignin. The use of the established CuO oxidation method allows us to compare the results to LOP records in other archives. However, as the CuO oxidation step is the main source of variability in our method, an alternative degradation method for lignin with higher reproducibility should be developed. This method could, for example, be based on electrolysis. In addition, LOPs in speleothem samples from other caves in different vegetation and climate zones should be analyzed and compared with stable isotope and trace element records in order to gain more insight into the relation of vegetation, climate, and the LOP signal in speleothems. The analysis of cave drip water, sampled monthly within the framework of a cave monitoring program, could elucidate seasonal variations of lignin input and possible fractionation processes during its pathway from the soil to the cave.
We have provided all relevant data in the paper and the Supplement to this study.
The supplement related to this article is available online at: https://doi.org/10.5194/bg-15-5831-2018-supplement.
IH, DS, and TH designed the research; IH performed the research; IH, DS, and TH analyzed the data and all authors contributed to writing the paper.
The authors declare that they have no conflict of interest.
We thank Simon Mischel for providing stalagmite and cave drip water
samples from the Herbstlabyrinth-Advent Cave. This project has received
funding from the European Union's Horizon 2020 research and innovation
program under Marie Skłodowska-Curie grant agreement no. 691037.
Denis Scholz acknowledges funding from the German Research Foundation (SCHO 1274/3-1
and SCHO 1274/9-1).
Edited by: Marcel van der Meer
Reviewed by: two anonymous referees
Armenta, S., Garrigues, S., and de La Guardia, M.: Green Analytical Chemistry, TRAC-Trend. Anal. Chem., 27, 497–511, 2008. a
Baker, A., Jex, C. N., Rutlidge, H., Woltering, M., Blyth, A. J., Andersen, M. S., Cuthbert, M. O., Marjo, C. E., Markowska, M., Rau, G. C., and Khan, S. J.: An irrigation experiment to compare soil, water and speleothem tetraether membrane lipid distributions, Org. Geochem., 94, 12–20, 2016. a
Blyth, A. J. and Schouten, S.: Calibrating the glycerol dialkyl glycerol tetraether temperature signal in speleothems, Geochim. Cosmochim. Ac., 109, 312–328, 2013. a
Blyth, A. J. and Watson, J. S.: Thermochemolysis of organic matter preserved in stalagmites: A preliminary study, Org. Geochem., 40, 1029–1031, 2009. a, b
Blyth, A. J., Farrimond, P., and Jones, M.: An optimised method for the extraction and analysis of lipid biomarkers from stalagmites, Org. Geochem., 37, 882–890, 2006. a, b
Blyth, A. J., Baker, A., Collins, M. J., Penkman, K. E., Gilmour, M. A., Moss, J. S., Genty, D., and Drysdale, R. N.: Molecular organic matter in speleothems and its potential as an environmental proxy, Quaternary Sci. Rev., 27, 905–921, 2008. a
Blyth, A. J., Watson, J. S., Woodhead, J., and Hellstrom, J.: Organic compounds preserved in a 2.9million year old stalagmite from the Nullarbor Plain, Australia, Chem. Geol., 279, 101–105, 2010. a
Blyth, A. J., Hartland, A., and Baker, A.: Organic proxies in speleothems – New developments, advantages and limitations, Quaternary Sci. Rev., 149, 1–17, 2016. a
Bosle, J. M., Mischel, S. A., Schulze, A.-L., Scholz, D., and Hoffmann, T.: Quantification of low molecular weight fatty acids in cave drip water and speleothems using HPLC-ESI-IT/MS – development and validation of a selective method, Anal. Bioanal. Chem., 406, 3167–3177, 2014. a, b
Delwiche, C. F., Graham, L. E., and Thomson, N.: Lignin-like compounds and sporopollenin coleochaete, an algal model for land plant ancestry, Science, 245, 399–401, 1989. a
Dewick, P. M.: The Shikimate Pathway: Aromatic Amino Acids and Phenylpropanoids, chap. 4, 137–186, Wiley-Blackwell, 2009. a
Dittmar, T. and Lara, R. J.: Molecular evidence for lignin degradation in sulfate-reducing mangrove sediments (Amazônia, Brazil), Geochim. Cosmochim. Ac., 65, 1417–1428, 2001. a
Fairchild, I. J. and Baker, A.: Speleothem Science, John Wiley & Sons, Ltd, Chichester, UK, 2012. a
Fairchild, I. J. and Treble, P. C.: Trace elements in speleothems as recorders of environmental change, Quaternary Sci. Rev., 28, 449–468, 2009. a
Fairchild, I. J., Smith, C. L., Baker, A., Fuller, L., Spötl, C., Mattey, D., and McDermott, F.: Modification and preservation of environmental signals in speleothems, Earth-Sci. Rev., 75, 105–153, https://doi.org/10.1016/j.earscirev.2005.08.003, 2006. a
Fraser, W. T., Scott, A. C., Forbes, A. E. S., Glasspool, I. J., Plotnick, R. E., Kenig, F., and Lomax, B. H.: Evolutionary stasis of sporopollenin biochemistry revealed by unaltered Pennsylvanian spores, New Phytol., 196, 397–401, 2012. a
Gałuszka, A., Migaszewski, Z., and Namieśnik, J.: The 12 principles of green analytical chemistry and the SIGNIFICANCE mnemonic of green analytical practices, TRAC-Trend. Anal. Chem., 50, 78–84, 2013. a
Gałuszka, A., Migaszewski, Z. M., and Namieśnik, J.: The role of analytical chemistry in the study of the Anthropocene, TRAC-Trend. Anal. Chem., 97, 146–152, 2017. a
Giorio, C., Kehrwald, N., Barbante, C., Kalberer, M., King, A. C., Thomas, E. R., Wolff, E. W., and Zennaro, P.: Prospects for reconstructing paleoenvironmental conditions from organic compounds in polar snow and ice, Quaternary Sci. Rev., 183, 1–22, 2018. a
Goñi, M. A. and Montgomery, S.: Alkaline CuO Oxidation with a Microwave Digestion System: Lignin Analyses of Geochemical Samples, Anal. Chem., 72, 3116–3121, 2000. a, b, c
Hedges, J. I. and Mann, D. C.: The characterization of plant tissues by their lignin oxidation products, Geochim. Cosmochim. Ac., 43, 1803–1807, 1979. a, b, c, d, e, f, g
Hedges, J. I. and Parker, P. L.: Land-derived organic matter in surface sediments from the Gulf of Mexico, Geochim. Cosmochim. Ac., 40, 1019–1029, 1976. a, b
Hernes, P. J. and Benner, R.: Transport and diagenesis of dissolved and particulate terrigenous organic matter in the North Pacific Ocean, Deep-Sea Res. Pt. I, 49, 2119–2132, 2002. a
Jex, C. N., Pate, G. H., Blyth, A. J., Spencer, R. G., Hernes, P. J., Khan, S. J., and Baker, A.: Lignin biogeochemistry: from modern processes to Quaternary archives, Quaternary Sci. Rev., 87, 46–59, 2014. a, b, c, d
Kaiser, K. and Benner, R.: Characterization of Lignin by Gas Chromatography and Mass Spectrometry Using a Simplified CuO Oxidation Method, Anal. Chem., 84, 459–464, 2012. a, b
Kögel, I. and Bochter, R.: Characterization of lignin in forest humus layers by high-performance liquid chromatography of cupric oxide oxidation products, Soil Biol. Biochem., 17, 637–640, 1985. a
Konieczka, P. and Namieśnik, J.: Estimation of uncertainty in analytical procedures based on chromatographic techniques, J. Chromatogr. A, 1217, 265–288, https://doi.org/10.1016/S0146-6380(97)00134-4, 2010. a
Leppla, D.: Quantification of paleoclimatic proxies using UHPLC-HESI-MS after degradation of lignin – development of an electrochemical method, Masterarbeit, Johannes Gutenberg-Universität, Mainz, 2016. a
Lima, D. L., Duarte, A. C., and Esteves, V. I.: Solid-phase extraction and capillary electrophoresis determination of phenols from soil after alkaline CuO oxidation, Chemosphere, 69, 561–568, 2007. a
Litt, T., Schölzel, C., Kühl, N., and Brauer, A.: Vegetation and climate history in the Westeifel Volcanic Field (Germany) during the past 11 000 years based on annually laminated lacustrine maar sediments, Boreas, 38, 679–690, 2009. a
McDermott, F.: Palaeo-climate reconstruction from stable isotope variations in speleothems: a review, Quaternary Sci. Rev., 23, 901–918, 2004. a, b
Mischel, S. A., Scholz, D., and Spötl, C.: δ18O values of cave drip water: a promising proxy for the reconstruction of the North Atlantic Oscillation?, Clim. Dynam., 45, 3035–3050, 2015. a, b, c
Mischel, S. A., Scholz, D., Spötl, C., Jochum, K. P., Schröder-Ritzrau, A., and Fiedler, S.: Holocene climate variability in Central Germany and a potential link to the polar North Atlantic: A replicated record from three coeval speleothems, Holocene, https://doi.org/10.1177/0959683616670246, 2016. a, b, c, d, e, f
Mischel, S. A., Mertz-Kraus, R., Jochum, K. P., and Scholz, D.: TERMITE: An R script for fast reduction of laser ablation inductively coupled plasma mass spectrometry data and its application to trace element measurements, Rapid Commun. Mass Spectrom., 31, 1079–1087, 2017. a
Montgomery, W., Potiszil, C., Watson, J. S., and Sephton, M. A.: Sporopollenin, a Natural Copolymer, is Robust under High Hydrostatic Pressure, Macromol. Chem. Phys., 217, 2494–2500, 2016. a
Quiers, M., Perrette, Y., Chalmin, E., Fanget, B., and Poulenard, J.: Geochemical mapping of organic carbon in stalagmites using liquid-phase and solid-phase fluorescence, Chem. Geol., 411, 240–247, 2015. a
Richards, D. A. and Dorale, J. A.: Uranium-series Chronology and Environmental Applications of Speleothems, Rev. Mineral. Geochem., 52, 407–460, 2003. a
Scholz, D. and Hoffmann, D.: 230Th/U-dating of fossil corals and speleothems, Quaternary Sci. J, 57, 52–76, 2008. a
Standley, L. J. and Kaplan, L. A.: Isolation and analysis of lignin-derived phenols in aquatic humic substances: improvements on the procedures, Org. Geochem., 28, 689–697, 1998. a
Tareq, S. M., Tanaka, N., and Ohta, K.: Biomarker signature in tropical wetland: lignin phenol vegetation index (LPVI) and its implications for reconstructing the paleoenvironment, Sci. Total Environ., 324, 91–103, 2004. a
Tareq, S. M., Kitagawa, H., and Ohta, K.: Lignin biomarker and isotopic records of paleovegetation and climate changes from Lake Erhai, southwest China, since 18.5 ka BP, Holocene Lake Records: Patterns, Impacts, Causes And Societal Response Selected Papers from the 3rd LIMPACS Conference, Chandigarh, India, 229, 47–56, 2011. a, b
Wysocki, L. A., Filley, T. R., and Bianchi, T. S.: Comparison of two methods for the analysis of lignin in marine sediments: CuO oxidation versus tetramethylammonium hydroxide (TMAH) thermochemolysis, Org. Geochem., 39, 1454–1461, 2008. a
Xie, S.: Lipid distribution in a subtropical southern China stalagmite as a record of soil ecosystem response to paleoclimate change, Quaternary Res., https://doi.org/10.1016/j.qres.2003.07.010, 2003. a
Zhang, T., Li, X., Sun, S., Lan, H., Du, P., and Wang, M.: Determination of lignin in marine sediment using alkaline cupric oxide oxidation-solid phase extraction-on-column derivatization-gas chromatography, J. Ocean U. China, 12, 63–69, 2013. a