the Creative Commons Attribution 4.0 License.
the Creative Commons Attribution 4.0 License.
 | 21 Sep 2018
The silicon stable isotope distribution along the GEOVIDE section (GEOTRACES GA-01) of the North Atlantic Ocean
Gregory F. de Souza
Maribel I. García-Ibáñez
Christina L. De La Rocha
The stable isotope composition of dissolved silicon in seawater (δ30SiDSi) was examined at 10 stations along the GEOVIDE section (GEOTRACES GA-01), spanning the North Atlantic Ocean (40–60∘ N) and Labrador Sea. Variations in δ30SiDSi below 500 m were closely tied to the distribution of water masses. Higher δ30SiDSi values are associated with intermediate and deep water masses of northern Atlantic or Arctic Ocean origin, whilst lower δ30SiDSi values are associated with DSi-rich waters sourced ultimately from the Southern Ocean. Correspondingly, the lowest δ30SiDSi values were observed in the deep and abyssal eastern North Atlantic, where dense southern-sourced waters dominate. The extent to which the spreading of water masses influences the δ30SiDSi distribution is marked clearly by Labrador Sea Water (LSW), whose high δ30SiDSi signature is visible not only within its region of formation within the Labrador and Irminger seas, but also throughout the mid-depth western and eastern North Atlantic Ocean. Both δ30SiDSi and hydrographic parameters document the circulation of LSW into the eastern North Atlantic, where it overlies southern-sourced Lower Deep Water. The GEOVIDE δ30SiDSi distribution thus provides a clear view of the direct interaction between subpolar/polar water masses of northern and southern origin, and allow examination of the extent to which these far-field signals influence the local δ30SiDSi distribution.
- Article
(4846 KB) -
Supplement
(481 KB) - BibTeX
- EndNote


Proxies of nutrient utilization, such as the silicon stable isotopic composition (δ30Si) of diatom silica, provide a means of reconstructing the past behaviour of marine nutrient cycles, giving insight into the strength of the biological pump in the past, and its influence over atmospheric concentrations of CO2. However, diatom silica δ30Si does not depend solely on the degree of utilization of dissolved silicon (DSi) at the ocean's surface, but also on the δ30Si value of its source DSi. Since the δ30Si of DSi (δ30SiDSi) at any given location in the ocean results from the combined effects of biological uptake of dissolved silicon, dissolution of sinking biogenic silica, and meso- to macro-scale features of ocean circulation, successfully reconstructing past silica cycling from the variations in δ30Si of diatoms accumulating in sediments requires a reasonable understanding of the processes that control the δ30SiDSi distribution.
Significant progress has been made in this regard by fifteen years' worth of work in the Southern Ocean (Varela et al., 2004; Cardinal et al., 2005; De La Rocha et al., 2011; Fripiat et al., 2011), in the North, Equatorial and South Pacific (De La Rocha et al., 2000; Reynolds et al., 2006; Beucher et al., 2008, 2011; de Souza et al., 2012a), and recently in the Arctic Ocean (Varela et al., 2016), in conjunction with various models (De La Rocha and Bickle, 2005; Reynolds, 2009; Coffineau et al., 2014), not the least of which are global circulation models (Wischmeyer et al., 2003; de Souza et al., 2014, 2015; Holzer and Brzezinski, 2015). It is now widely understood that fractionation of silicon isotopes during uptake and biomineralization of silica in surface waters increasingly elevates the δ30SiDSi in surface waters (De La Rocha et al., 1997; Sutton et al., 2013). At the same time, dissolution of biogenic silica exported to deeper layers works to enrich them in dissolved silicon of lower δ30SiDSi (Demarest et al., 2009; de Souza et al., 2014; Wetzel et al., 2014). For many deep waters of the ocean, the mixing between water masses of vastly different origin (and thus different δ30SiDSi) as they circulate through the ocean basins plays a much greater role than the dissolution of sinking biogenic silica in setting geographic patterns in deep ocean δ30SiDSi (de Souza et al., 2014).
This is particularly true of the deep Atlantic Ocean, which displays a notable north–south gradient in both the concentrations of dissolved silicon (from <10 µM in the North Atlantic to >125 µM in the South Atlantic) and its δ30SiDSi (from roughly +1.9 ‰ in the North Atlantic down to +1.2 ‰ in the South Atlantic) (de Souza et al., 2012b; Brzezinski and Jones, 2015). Based on modelling results (de Souza et al., 2014), the bulk of the change in δ30SiDSi occurs mainly in the northern North Atlantic for reasons that are unique to this area of the ocean. The Labrador Sea, located between Greenland and the North American continent, is a key site contributing to the formation of North Atlantic Deep Water (NADW). The surface waters that cool in this region and sink to form Labrador Sea Water (LSW), an important component of NADW, are nutrient-poor. This means that their DSi concentration is markedly low and its δ30SiDSi is notably high, characteristics that are imparted to the deep water mass during formation. Its low DSi concentration makes the δ30SiDSi of deep water in this area very susceptible to change via the addition of dissolved silicon by mixing or dissolution of opal. Unfortunately, only one depth profile of δ30SiDSi is currently available for the entire Labrador Sea DSi (de Souza et al., 2012b). Even without taking into account its dynamic nature, the North Atlantic bears better mapping of the δ30SiDSi of its waters.
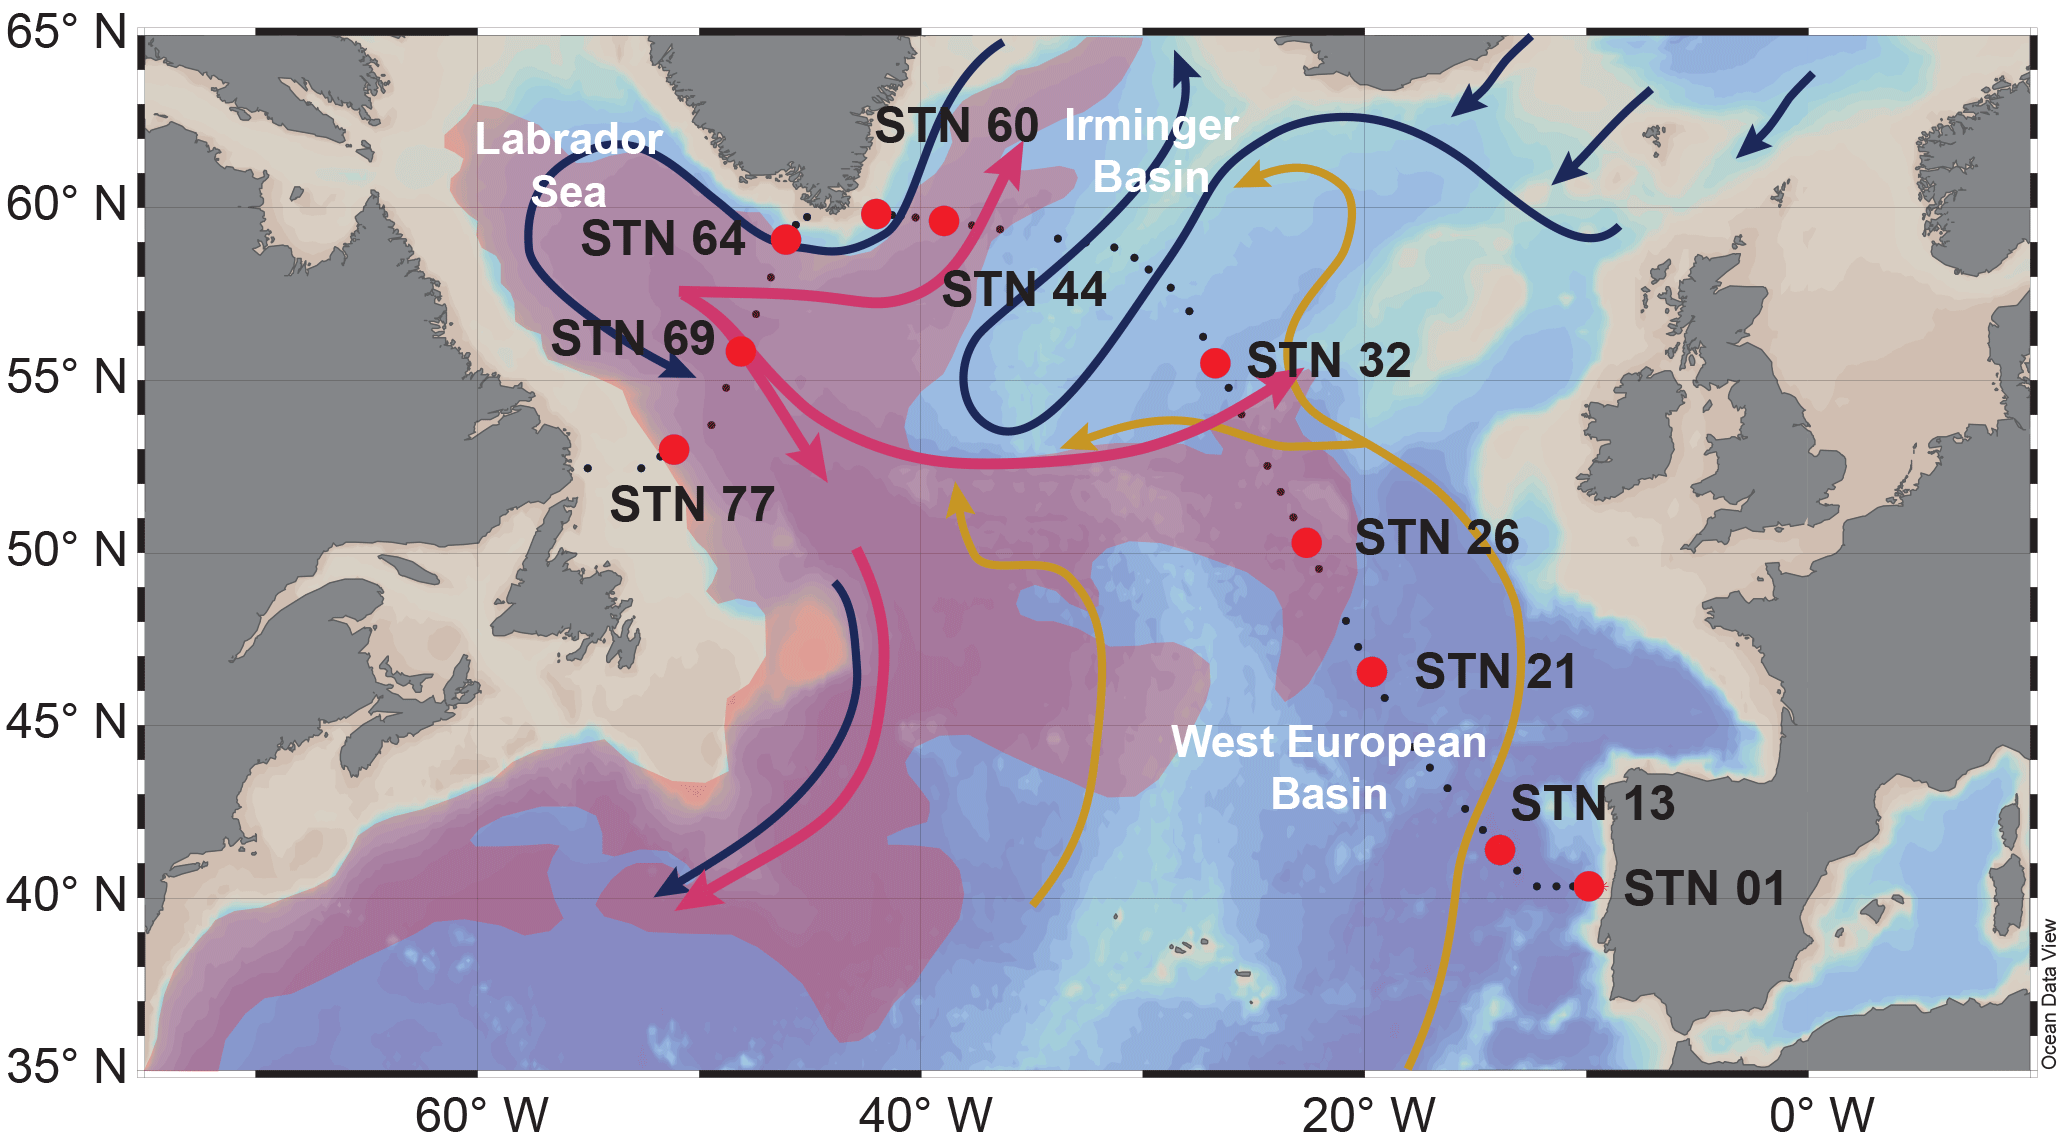
Figure 1Map showing the sampling locations from the GEOVIDE voyage, overlain on a schematic of the intermediate and deep ocean circulation. Pink shading indicates the spreading of Labrador Sea Water (LSW) as documented by the extent of a water column minimum potential vorticity of m−1 s−1 (McCartney, 1992). Dark blue arrows represent bottom-hugging Nordic Sea Overflows (ISOW and DSOW), pink arrows represent LSW, and orange arrows represent Lower Deep Water (McCartney, 1992; Dickson and Brown, 1994; Lambelet et al., 2016; see also García-Ibáñez et al., 2018).
Recently, we began rectifying the situation via an internationally funded GEOTRACES campaign (GEOTRACES GA-01) that was carried out along the OVIDE section of the North Atlantic Ocean and Labrador Sea (GEOVIDE). We use the δ30SiDSi distribution to constrain the processes that influence the distribution and cycling of silica in the North Atlantic Ocean and Labrador Sea.
2.1 Sample collection and processing
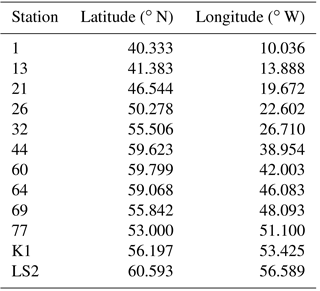
Samples were collected aboard the R/V Pourquoi Pas? during GEOVIDE. The cruise began on 15 May 2014 in Lisbon, Portugal, headed north towards Greenland, and then traversed south-west to St. John's, Canada, arriving on 30 June 2014 (Fig. 1). Seawater samples for δ30SiDSi analysis were collected using Niskin bottles attached to a standard rosette conductivity–temperature–depth (CTD) unit from 10 locations in the North Atlantic Ocean and Labrador Sea (Fig. 1 and Table 1). Samples were filtered through polycarbonate 0.45 µm filters (Millipore) and stored in acid-cleaned, low-density polyethylene bottles at room temperature. The DSi concentration of all samples collected (n=56) was determined via molybdate blue spectrophotometry (Strickland and Parsons, 1972). For the measurement of δ30SiDSi, DSi was extracted from the seawater by precipitating it as trimethylamine silicomolybdate, which was subsequently combusted to form SiO2 (De La Rocha et al., 1996). This SiO2 was dissolved at room temperature in polypropylene microcentrifuge tubes (1.5 mL) containing 23 M HF (Suprapur) to yield a final solution concentration of 0.23 M Si (e.g., 4 µmol of SiO2 dissolved in 17.4 µL of HF).
Table 1Sampling locations from the GEOVIDE voyage in the North Atlantic Ocean and Labrador Sea (stations 1–77) and GEOVIDE/Canada GEOTRACES intercalibration stations (stations K1 and LS2).
2.2 Purification
Every sample was further purified using ion exchange chromatography following Engström et al. (2006). Briefly, 17.4 µL of a 0.23 M Si solution was diluted in 7.7 mL of Ultra Hiqh Quality water (UHQ H2O; 18.2 MΩ-cm; Millipore Direct-Q) and loaded onto columns containing AG1-X8 resin (100–200 mesh size, BioRad) that had been preconditioned with 2 M NaOH. The sample matrix was eluted using 95 mM HCl + 23 mM HF followed by the elution of the purified Si using 0.14 M HNO3,+ 5.6 mM HF. All acids were Suprapur (Merck) and were diluted with UHQ H2O.
2.3 Isotopic measurements
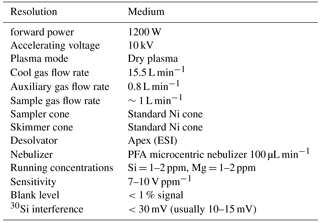
Silicon stable isotope composition (δ30Si) of the purified samples was measured using standard-sample bracketing combined with external normalization by doping the samples with magnesium (Mg) (e.g., Cardinal et al., 2003) on a Thermo Scientific Neptune multi-collector inductively coupled plasma mass spectrometer (MC–ICP-MS) at the Unité Géosciences Marines (Ifremer, Plouzané). Prior to the isotopic analysis, the purified samples were diluted with 0.16 M HNO3 (1 % HNO3) to 1 ppm Si, yielding a roughly 12 V signal on mass 28 at medium resolution (see Table 2 for additional information on operating conditions). All samples and standards (NBS28 and a 99.995 % pure silica sand (Alfa Aesar) used as a working standard) were passed through column chemistry and matrix-matched to give the same signal strength (within 10 %) and to contain the same amount of HF (generally 1 mM). Magnesium (1000 ppm, NIST SRM) was added to the samples and standards just prior to measurement at a final concentration of 0.1 ppm (Cardinal et al., 2003; Abraham et al., 2008). Si solutions were introduced into the plasma via an Apex desolvating system equipped with a PFA nebulizer (uptake rate = 100 µL min−1) without additional gas.
For each measurement, beam intensities at masses 25 and 26 (Mg) and 28, 29, and 30 (Si) were monitored in dynamic mode (i.e., switching between Si and Mg masses) for one block of 25 cycles of 8 s integrations. Five minutes of rinse with 2 % HNO3 followed each sample and each standard solution. Solutions were analyzed in medium-resolution mode ().
Using a standard-sample-standard bracketing technique, δ30Si values for the samples were expressed as follows:
The Si isotope ratios in Eq. (1) above (30Si ∕ 28Si and 29Si ∕ 28Si) were corrected for mass bias by external normalization using Mg doping. For example, the corrected 30Si to 28Si ratio (30Si ∕ 28Si)corr is
where (30Si ∕ 28Si)meas is the measured ratio, and 30SiAM and 28SiAM are the atomic masses of 30Si and 28Si. εMg is calculated from the beam intensities on masses 25 and 26:
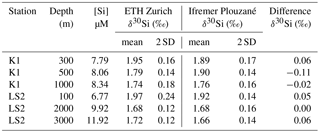
Table 3Results of the GEOVIDE/Canada GEOTRACES intercalibration exercise for δ30SiDSi (‰). Following the GEOTRACES intercalibration protocol for a cruise without a cross-over station (i.e., duplicate samples at three depths and two stations; see Table 1 for location details), the mean δ30Si (±2 standard deviations; 2 SD) was analyzed by two separate laboratories (ETH Zurich and Ifremer Plouzané). The difference in δ30Si between the laboratories (values determined for ETH Zurich minus values determined for Ifremer/UBO) is also presented.
where 25MgA ∕ 26MgA is the expected ratio of the natural abundances of the isotopes, (25Mg ∕ 26Mg)meas is the measured ratio, and 25MgAM and 26MgAM are the atomic masses of 25Mg and 26Mg respectively. Each measurement of a sample fell between two measurements of the standard, and each sample was measured three times. This total of three sample measurements and five standard measurements was repeated 2–3 times in each mass spectrometry session and used to calculate one replicate value of δ30Si and δ29Si. As discussed below, full chemistry replicates were routine for each sample (see Table S2 in the Supplement).
Interference-free measurement was ensured by checking that δ29Si and δ30Si for all samples was consistent with the mass-dependent fractionation line (). The signal was optimized to reduce the 14N16O interference on m∕z 30 to below 0.5 % of the 30Si peak. Measurements were performed on the low-mass side of the peak where interference is minimal. Blanks were maintained below 1 % of the main signal and were subtracted for each sample and standard. Long-term reproducibility and accuracy on δ30Si values of the analytical procedure were assessed using the standard deviation of 54 analyses of NBS28 and 29 analyses of a secondary reference standard (Silicon (IV) oxide, Alfa Aesar) generated over 6 years (±0.10 ‰, 2σ). Reproducibility of the full chemical and analytical procedure was estimated using at least one replicate of each sample (chemical preparation plus isotopic measurements) and average reproducibility on replicate δ30Si was ±0.10 ‰ (2σ). Measurements of Big Batch (n=3) produced an average value of (2σ), well within the range of intercalibration values reported by Reynolds et al. (2007). Measurement of the US GEOTRACES intercalibration reference seawater standard from the Aloha Station (1000 m) gave a δ30SiDSi value of ‰ (2σ, n=3), within the range of intercalibration values (1.24±0.20 ‰; Grasse et al., 2017). Measurement of the Canada/GEOVIDE GEOTRACES intercalibration samples, where duplicate samples at three depths and two stations were analyzed by two different laboratories (Ifremer Plouzané and ETH Zurich), conforming to the GEOTRACES intercalibration protocol for a cruise without a cross-over station, gave similar δ30SiDSi values (see Table 3). Note that ETH Zurich uses a different purification method (cation exchange resin; see de Souza et al., 2012b) and MC-ICPMS instrument (Nu Plasma 1700) than Ifremer Plouzané (described in Sect. 2.2). The methods for each laboratory that participated in the Canada/GEOVIDE GEOTRACES intercalibration study are also presented in the US GEOTRACES intercalibration study (Grasse et al., 2017).
2.4 Optimum multiparameter analysis to determine the water mass structure in the North Atlantic Ocean
In order to accurately examine the relationship between the distribution of δ30SiDSi and water masses, the results of the optimum multiparameter (OMP) analysis of García-Ibáñez et al. (2018) were used to identify the mixture of water masses present within each sample and their contribution to the DSi budget.
The upper layers of the GEOVIDE section were represented by the North Atlantic Central Waters (NACW), transported by the North Atlantic Current (NAC; Pollard et al., 1996), and Subpolar Mode Waters (SPMW), the end-product of the transformation of NACW through air-sea interaction (McCartney and Talley, 1982; Tsuchiya et al., 1992). To account for the change in the temperature of SPMW along the path of the NAC as the result of air-sea interaction, two SPMWs were differentiated: IcSPMW (Iceland-Subpolar Mode Water) and IrSPMW (Irminger-Subpolar Mode Water). The intermediate layers of the section were represented by LSW, Mediterranean Water (MW), Subarctic Intermediate Water (SAIW), and Polar Intermediate Water (PIW). LSW is the last stage of the transformation of SPMWs and forms in the Labrador and Irminger seas (e.g., Pickart et al., 2003; de Jong and de Steur, 2016; Fröb et al., 2016). MW enters the North Atlantic from the Mediterranean Sea through the Strait of Gibraltar (Ambar and Howe, 1979; Baringer and Price, 1997). SAIW originates in the Labrador Current by mixing of the NAC waters with LSW (Iselin, 1936; Arhan, 1990; Read, 2000). The deep layers of the section were represented by Denmark Strait Overflow Water (DSOW), Iceland–Scotland Overflow Water (ISOW), North East Atlantic Deep Water (NEADW) and Lower Deep Water (LDW). Overflow waters (DSOW and ISOW) form after the deep waters of the Nordic Seas flow over the Greenland–Iceland–Scotland sills and entrain Atlantic waters (van Aken and de Boer, 1995; Read, 2000; Dickson et al., 2002; Fogelqvist et al., 2003; Yashayaev and Dickson, 2008). NEADW is formed as a result of entrainment events that occur along the journey of ISOW through the Iceland Basin (van Aken, 2000). NEADW recirculates in the West European Basin and mixes with the surrounding waters, including the Antarctic Bottom Water (AABW) (van Aken and Becker, 1996), resulting in the formation of LDW.
3.1 Water column profiles of DSi
Dissolved silicon (DSi) concentrations were measured throughout the water column (Fig. 2a, Table S1), but only the samples collected below 500 m are discussed since no δ30SiDSi samples were collected from within the upper water column. DSi concentrations below 500 m along the GEOVIDE section ranged from 7 to 47 µM (Fig. 2a). The stations located to the east of the Mid-Atlantic Ridge (MAR; STN 01, STN 13, STN 21, STN 26, and STN 32) show DSi increasing in concentration from <10 to 20–50 µM below about 2000 m (Fig. 2a). Stations located to the west of the MAR (STN 44, STN 60, STN 64, STN 69, and STN 70) show only slight increases in DSi concentration with depth, with most of the values falling between 9 and 12 µM (Fig. 2a). This difference relates to the distribution of water masses in the northern North Atlantic, with the predominance of the most egregiously Si-poor northern-sourced water masses (LSW, ISOW/NEADW, DSOW) predominating in the western Atlantic while abyssal layers in the eastern Atlantic have had more of a contribution from Si-rich southern-sourced waters (LDW) (see Sect. 4.1). A clear pattern in the DSi concentration throughout the water column is that the eastern profiles exhibit a more typically “nutrient-like” profile than in the western profiles (Table S1; Fig. 2a).
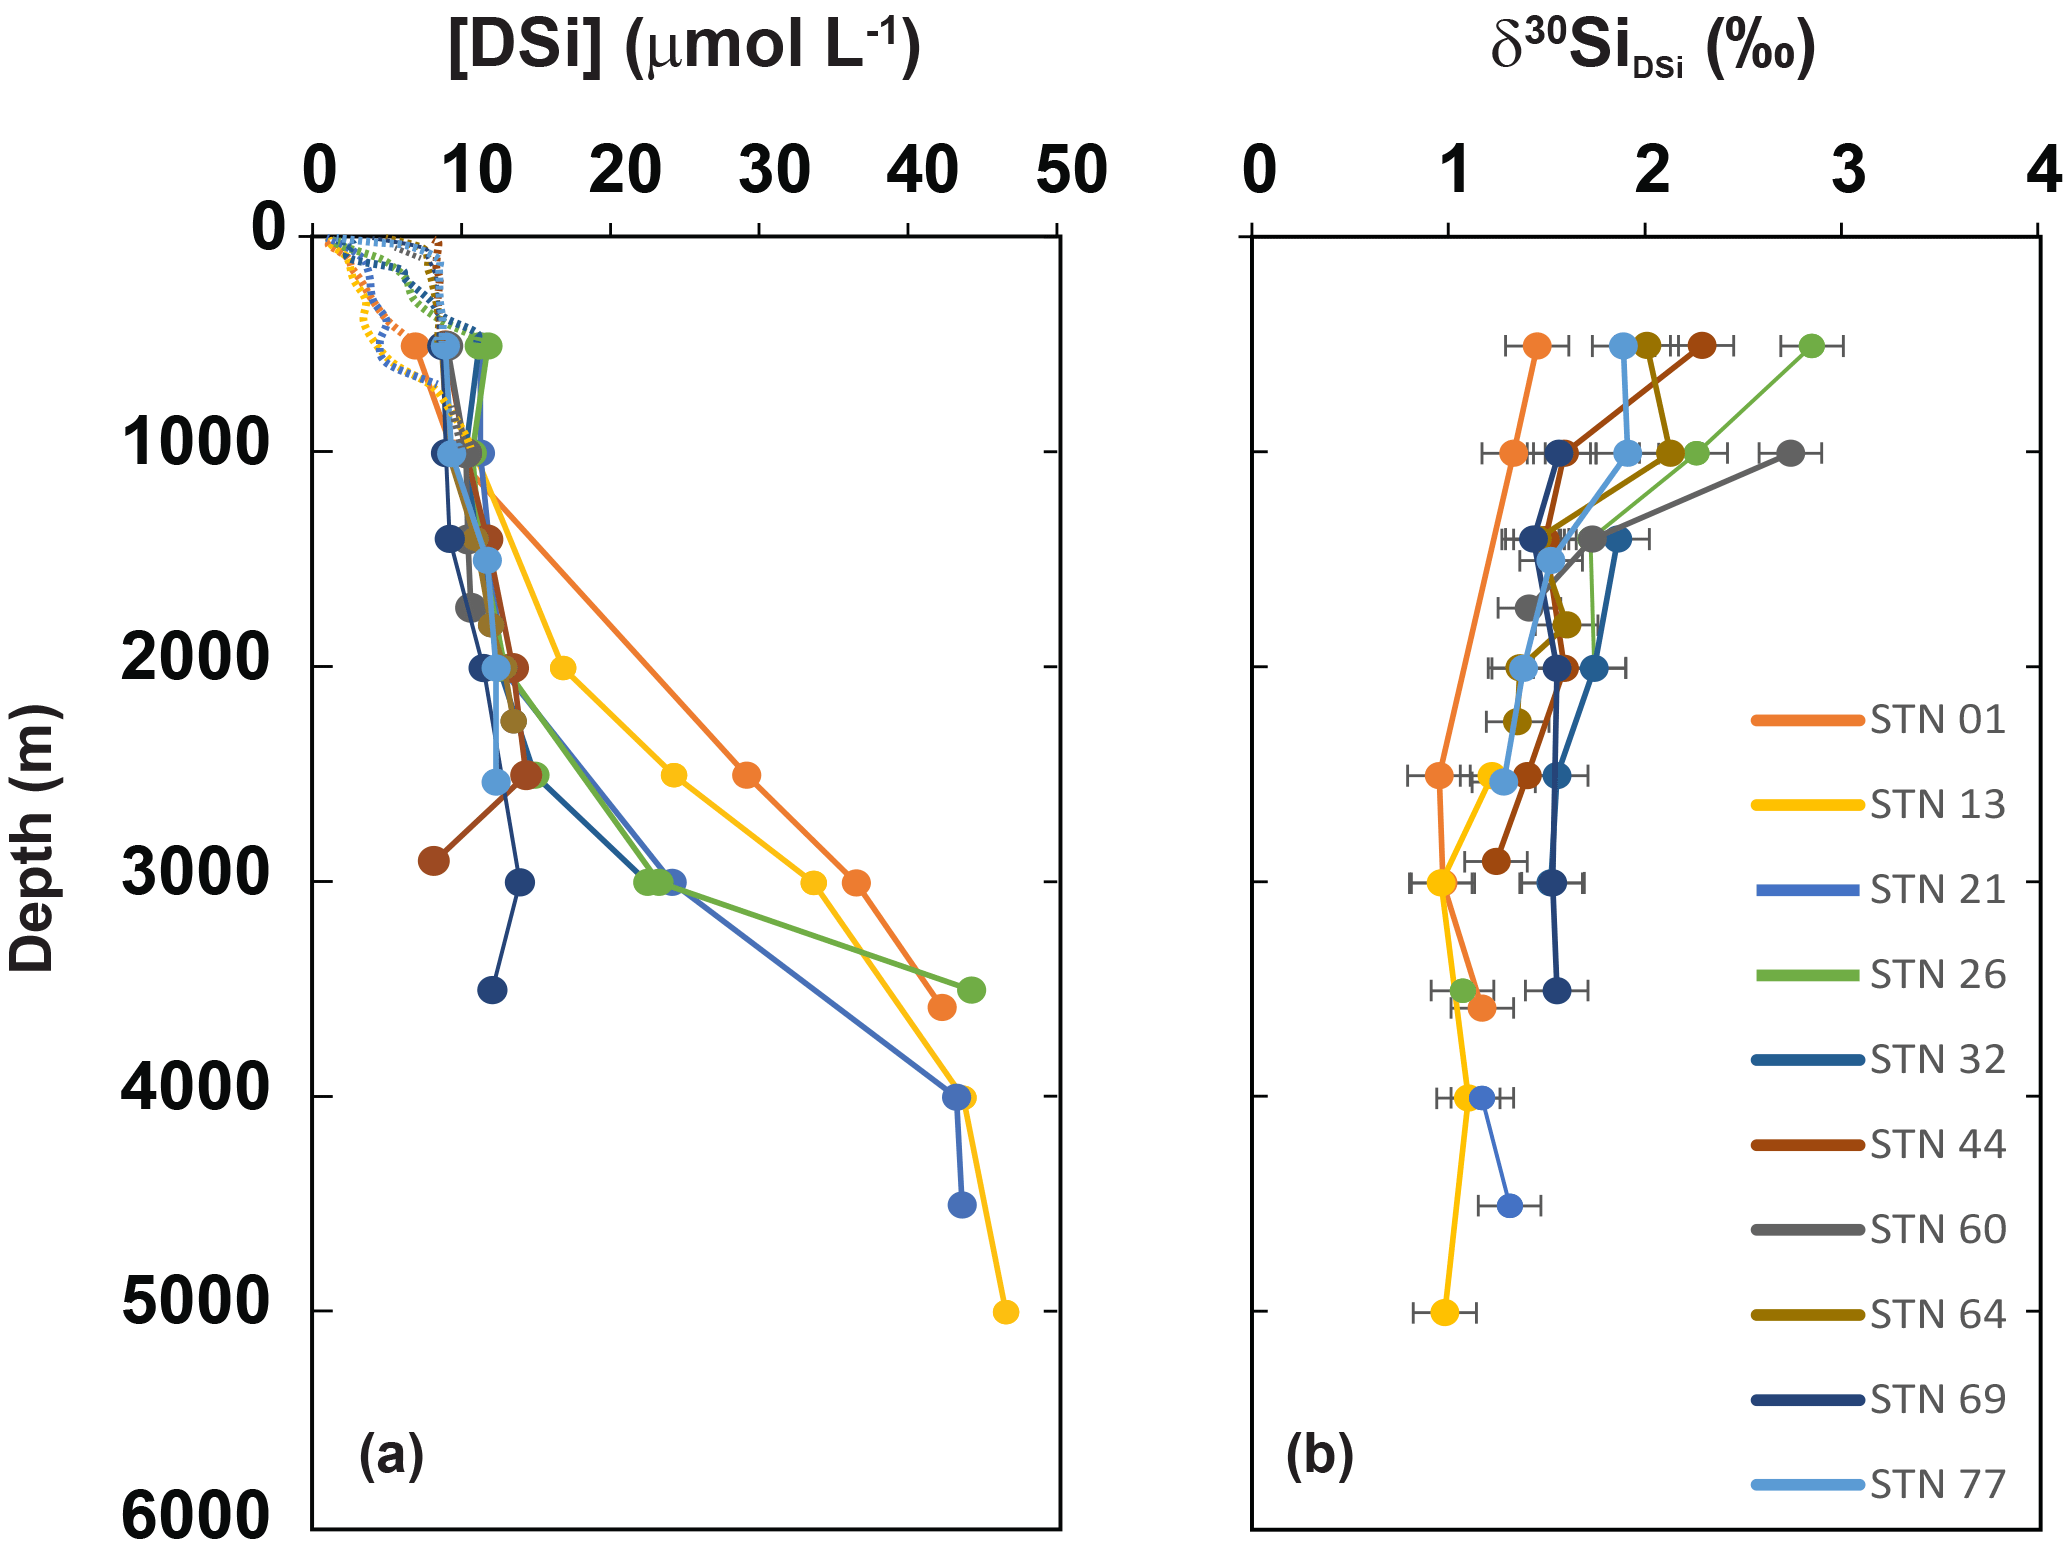
Figure 2Depth profiles of (a) Si concentration and (b) δ30SiDSi values for the North Atlantic Ocean and Labrador Sea. Nutrient data collected during the GEOVIDE cruise from a separate cast are indicated as dashed lines (see Table S1).
3.2 Water column profiles of δ30SiDSi
All GEOVIDE water column profiles have relatively high δ30SiDSi (+1.5 ‰ to +3 ‰) between 500–1000 m, and show a trend towards lower δ30SiDSi values with depth (although none significantly lower than +1 ‰) (Fig. 2b). Strikingly, the lowest values of δ30SiDSi occur at stations nearer to the Iberian margin (e.g., STN 01, STN 13: 0.95 ‰ and 0.98 ‰, respectively), while the highest values tend to occur at the upper depths of the profiles (500–1000 m) at stations north of 50∘ N and west of 20∘ W (stations 26, 32, 44, 60, 64, 69, and 77; Fig. 2b), mirroring the differences in DSi between these locations (Fig. 2a, Tables S1 and S2). Profiles of δ30SiDSi in the Labrador Sea (stations 64, 69, and 77) show high values (above +1.5 ‰) extending below 2000 m water depth. These high values reach the bottom within the central Labrador Sea (STN 69). Elevated δ30SiDSi values at depths between 1000 and 2000 m can be found at all stations in the Irminger Basin and extend eastwards into the western portion of the West European Basin (up to STN 26), but the mid-depths of the far eastern Atlantic are marked by lower δ30SiDSi values around +1 ‰. Near-surface water δ30SiDSi could not be evaluated due to the very low dissolved silicon (DSi) concentrations (<5 µM).
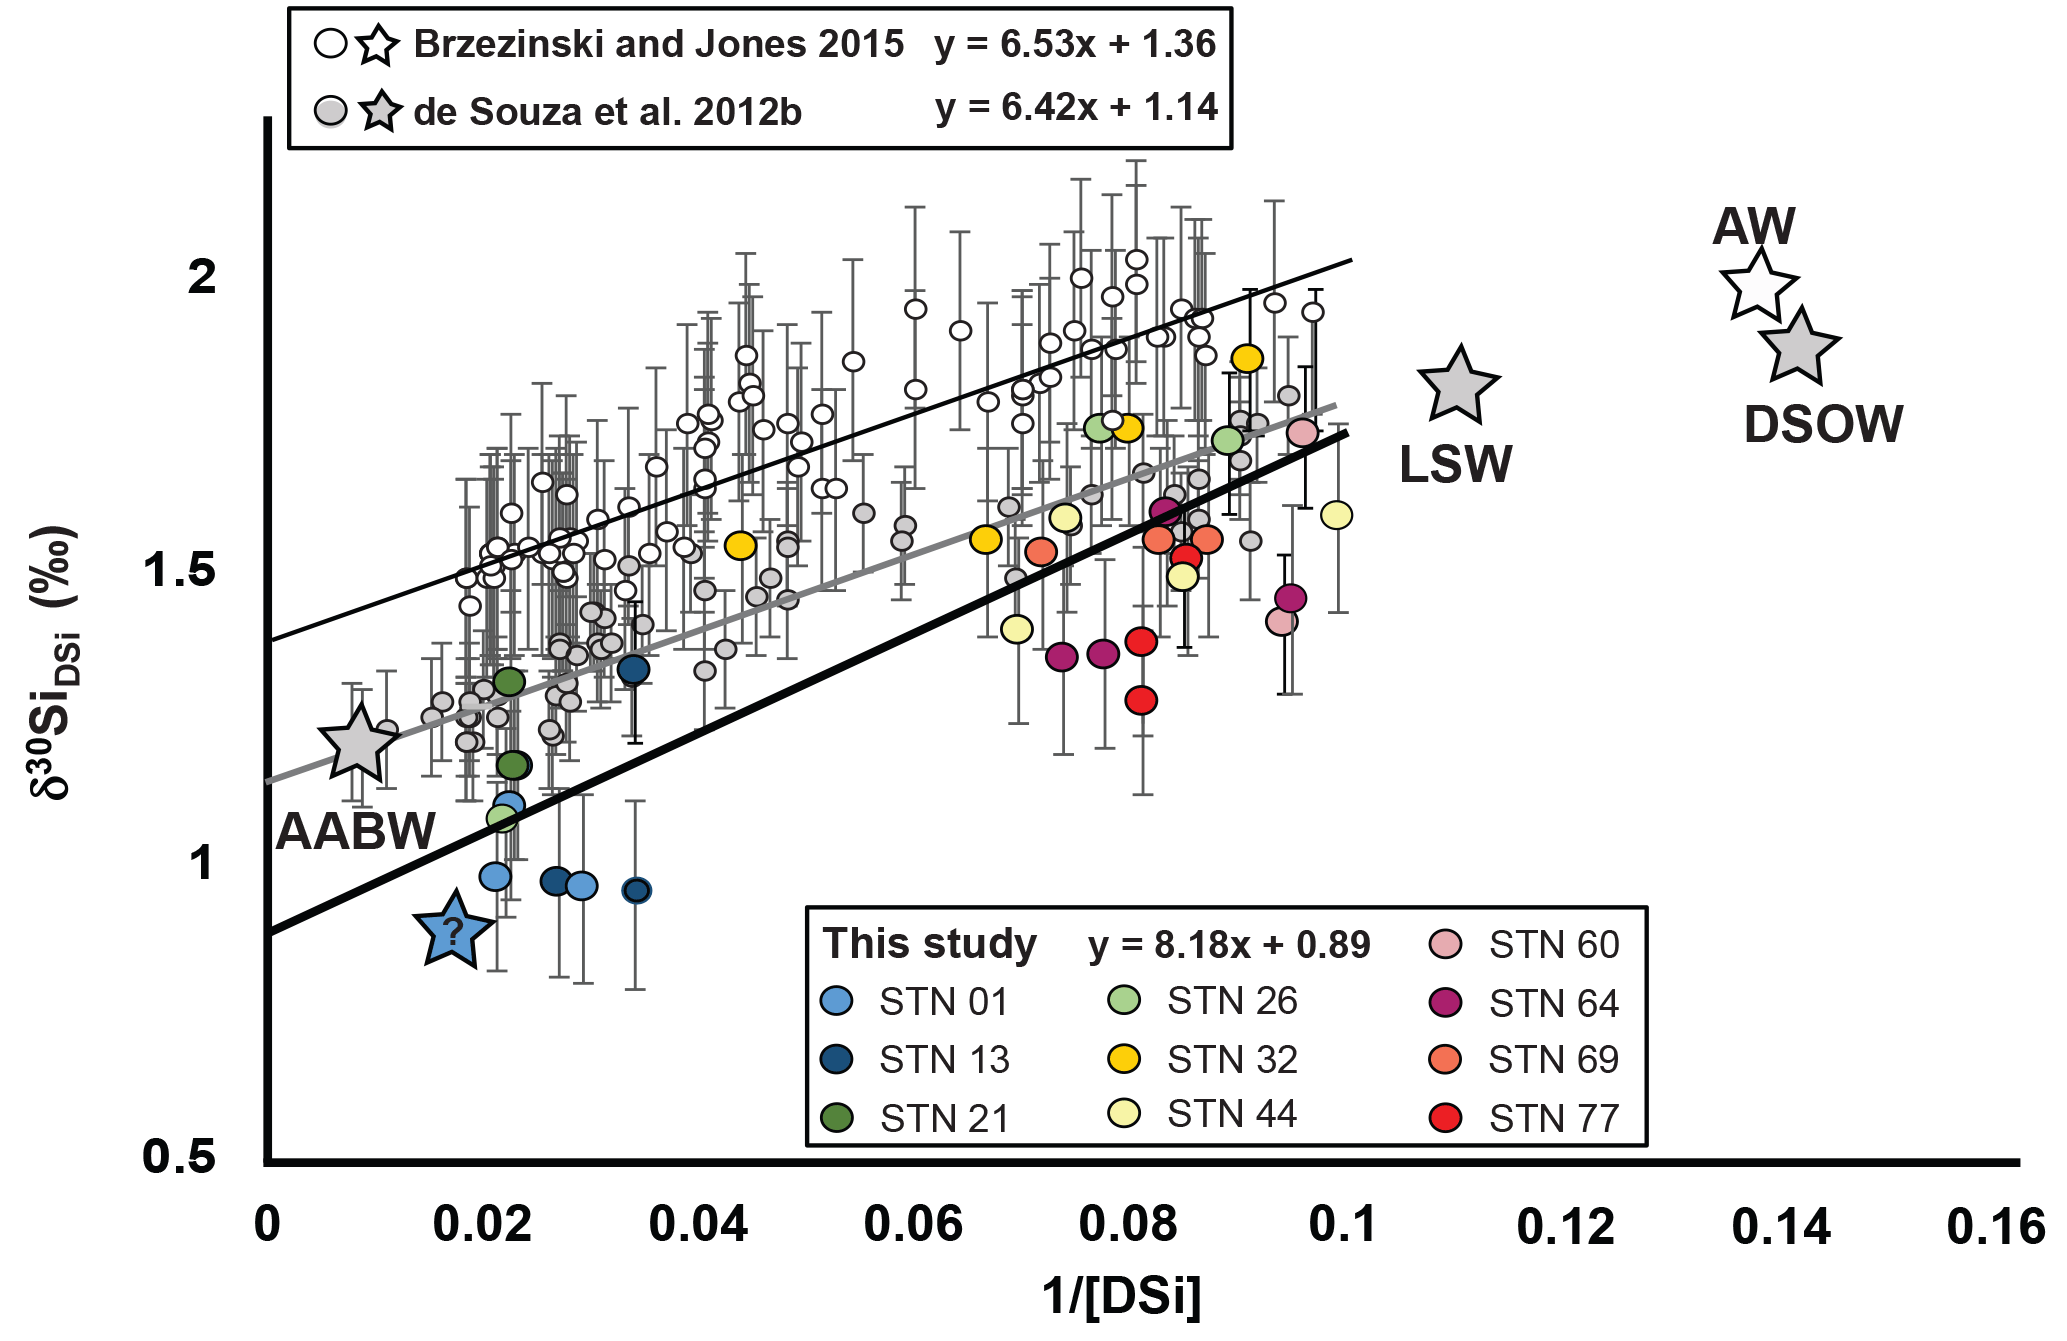
Figure 3δ30SiDSi versus the inverse of DSi concentration for this study (coloured circles identified by station; STN), de Souza et al. (2012b; grey circles) and Brzezinski and Jones (2015; open circles) for waters >1000 m depth. Equations reported in the figure refer to linear regressions produced for each dataset (de Souza et al., 2012b – grey line, ; Brzezinski and Jones, 2015 – thin black line, ; this study – thick black line, ). The statistics associated with each linear regression are as follows: de Souza et al. (2012b) – standard deviation of the slope (SDs) = 0.31, standard deviation of the y (SDy) = 0.06, standard deviation of the intercept (SDi) = 0.02, R2 = 0.86, n=58; Brzezinski and Jones (2015) – SDs = 0.32, SDy = 0.07, SDi = 0.02, R2=0.83, n=83; these results – SDs = 1.1, SDy = 0.17, SDi = 0.08, R2=0.64, n=29. The stars presented in this figure represent the end-members for the AABW, LSW, and DSOW previously published by de Souza et al. (2012b – grey stars), the Arctic Water (AW) previously published by Brzezinksi and Jones (2015 – the white star), and an unknown end-member (blue star, see text for details).
4.1 North Atlantic δ30SiDSi systematics in a basin-wide context
The deep Atlantic Ocean below 1000 m exhibits a wide variation in DSi concentrations, ranging from ∼10 µM in the mid-depths of the subpolar North Atlantic Ocean to ∼120 µM in the abyssal southern Atlantic. Since at least the work of Broecker and Takahashi (1980), it has been known that this variation is primarily brought about by the quasi-conservative mixing of DSi between Si-rich abyssal waters derived from the Southern Ocean and Si-poor waters of North Atlantic origin. The analysis of Sarmiento et al. (2007), which takes the effects of water mass mixing into account, has shown that the effect of opal dissolution on deep Atlantic DSi is resolvable, but plays a near-negligible role in controlling the deep DSi distribution.
The first systematic study of the Atlantic δ30SiDSi distribution (de Souza et al., 2012b) showed that the quasi-conservative behaviour of DSi is clearly reflected by the δ30SiDSi of the deep Atlantic Ocean. Surveying deep water over a wide range of latitudes within the Atlantic Ocean, they found that values of δ30SiDSi vary coherently from high values (>2.0 ‰) in the Si-poor waters that contribute to NADW to low values (1.2 ‰) in the Si-rich Southern Ocean deep waters (Fig. 3). The more recent work of Brzezinski and Jones (2015) found near-identical behaviour within Atlantic deep waters along a near-zonal transect across the subtropical North Atlantic (Fig. 3).
Our data agree with the systematics of these two studies, with each uncorrected dataset exhibiting similar linear regressions, except for the value of the y intercepts, and the slope of the current data being slightly exaggerated relative to the other datasets (see Fig. 3). Although the previously published data for the North Atlantic Ocean have nearly identical linear regressions, an offset of +0.11 ‰ relative to the de Souza et al. (2012b) data was observed and discussed by Brzezinski and Jones (2015), concluding that an analytical bias existed. Such offsets of order ±0.2 ‰ have been recognized to exist between seawater δ30Si data produced in different laboratories (Grasse et al., 2017); their origin remains unclear, although they may have to do with differences in sample processing and chemical purification. The offset of the new data to that of de Souza et al. (2012b), produced at ETH Zurich, is somewhat surprising given the good agreement in δ30SiDSi for six seawater samples analyzed both at Plouzané and Zurich, but a small offset to lower δ30SiDSi at Plouzané is consistent with the offset (0.1 ‰) in these two laboratories' mean δ30SiDSi values for the seawater reference Aloha-1000 (Grasse et al., 2017). Whilst not ideal for the determination of the absolute δ30SiDSi value for each basin, the existence of such interlaboratory offsets does not impair our ability to analyze the distribution of δ30SiDSi along the GEOVIDE transect, with the systematics of our data exhibiting similar behaviour to previously published studies (Fig. 3).
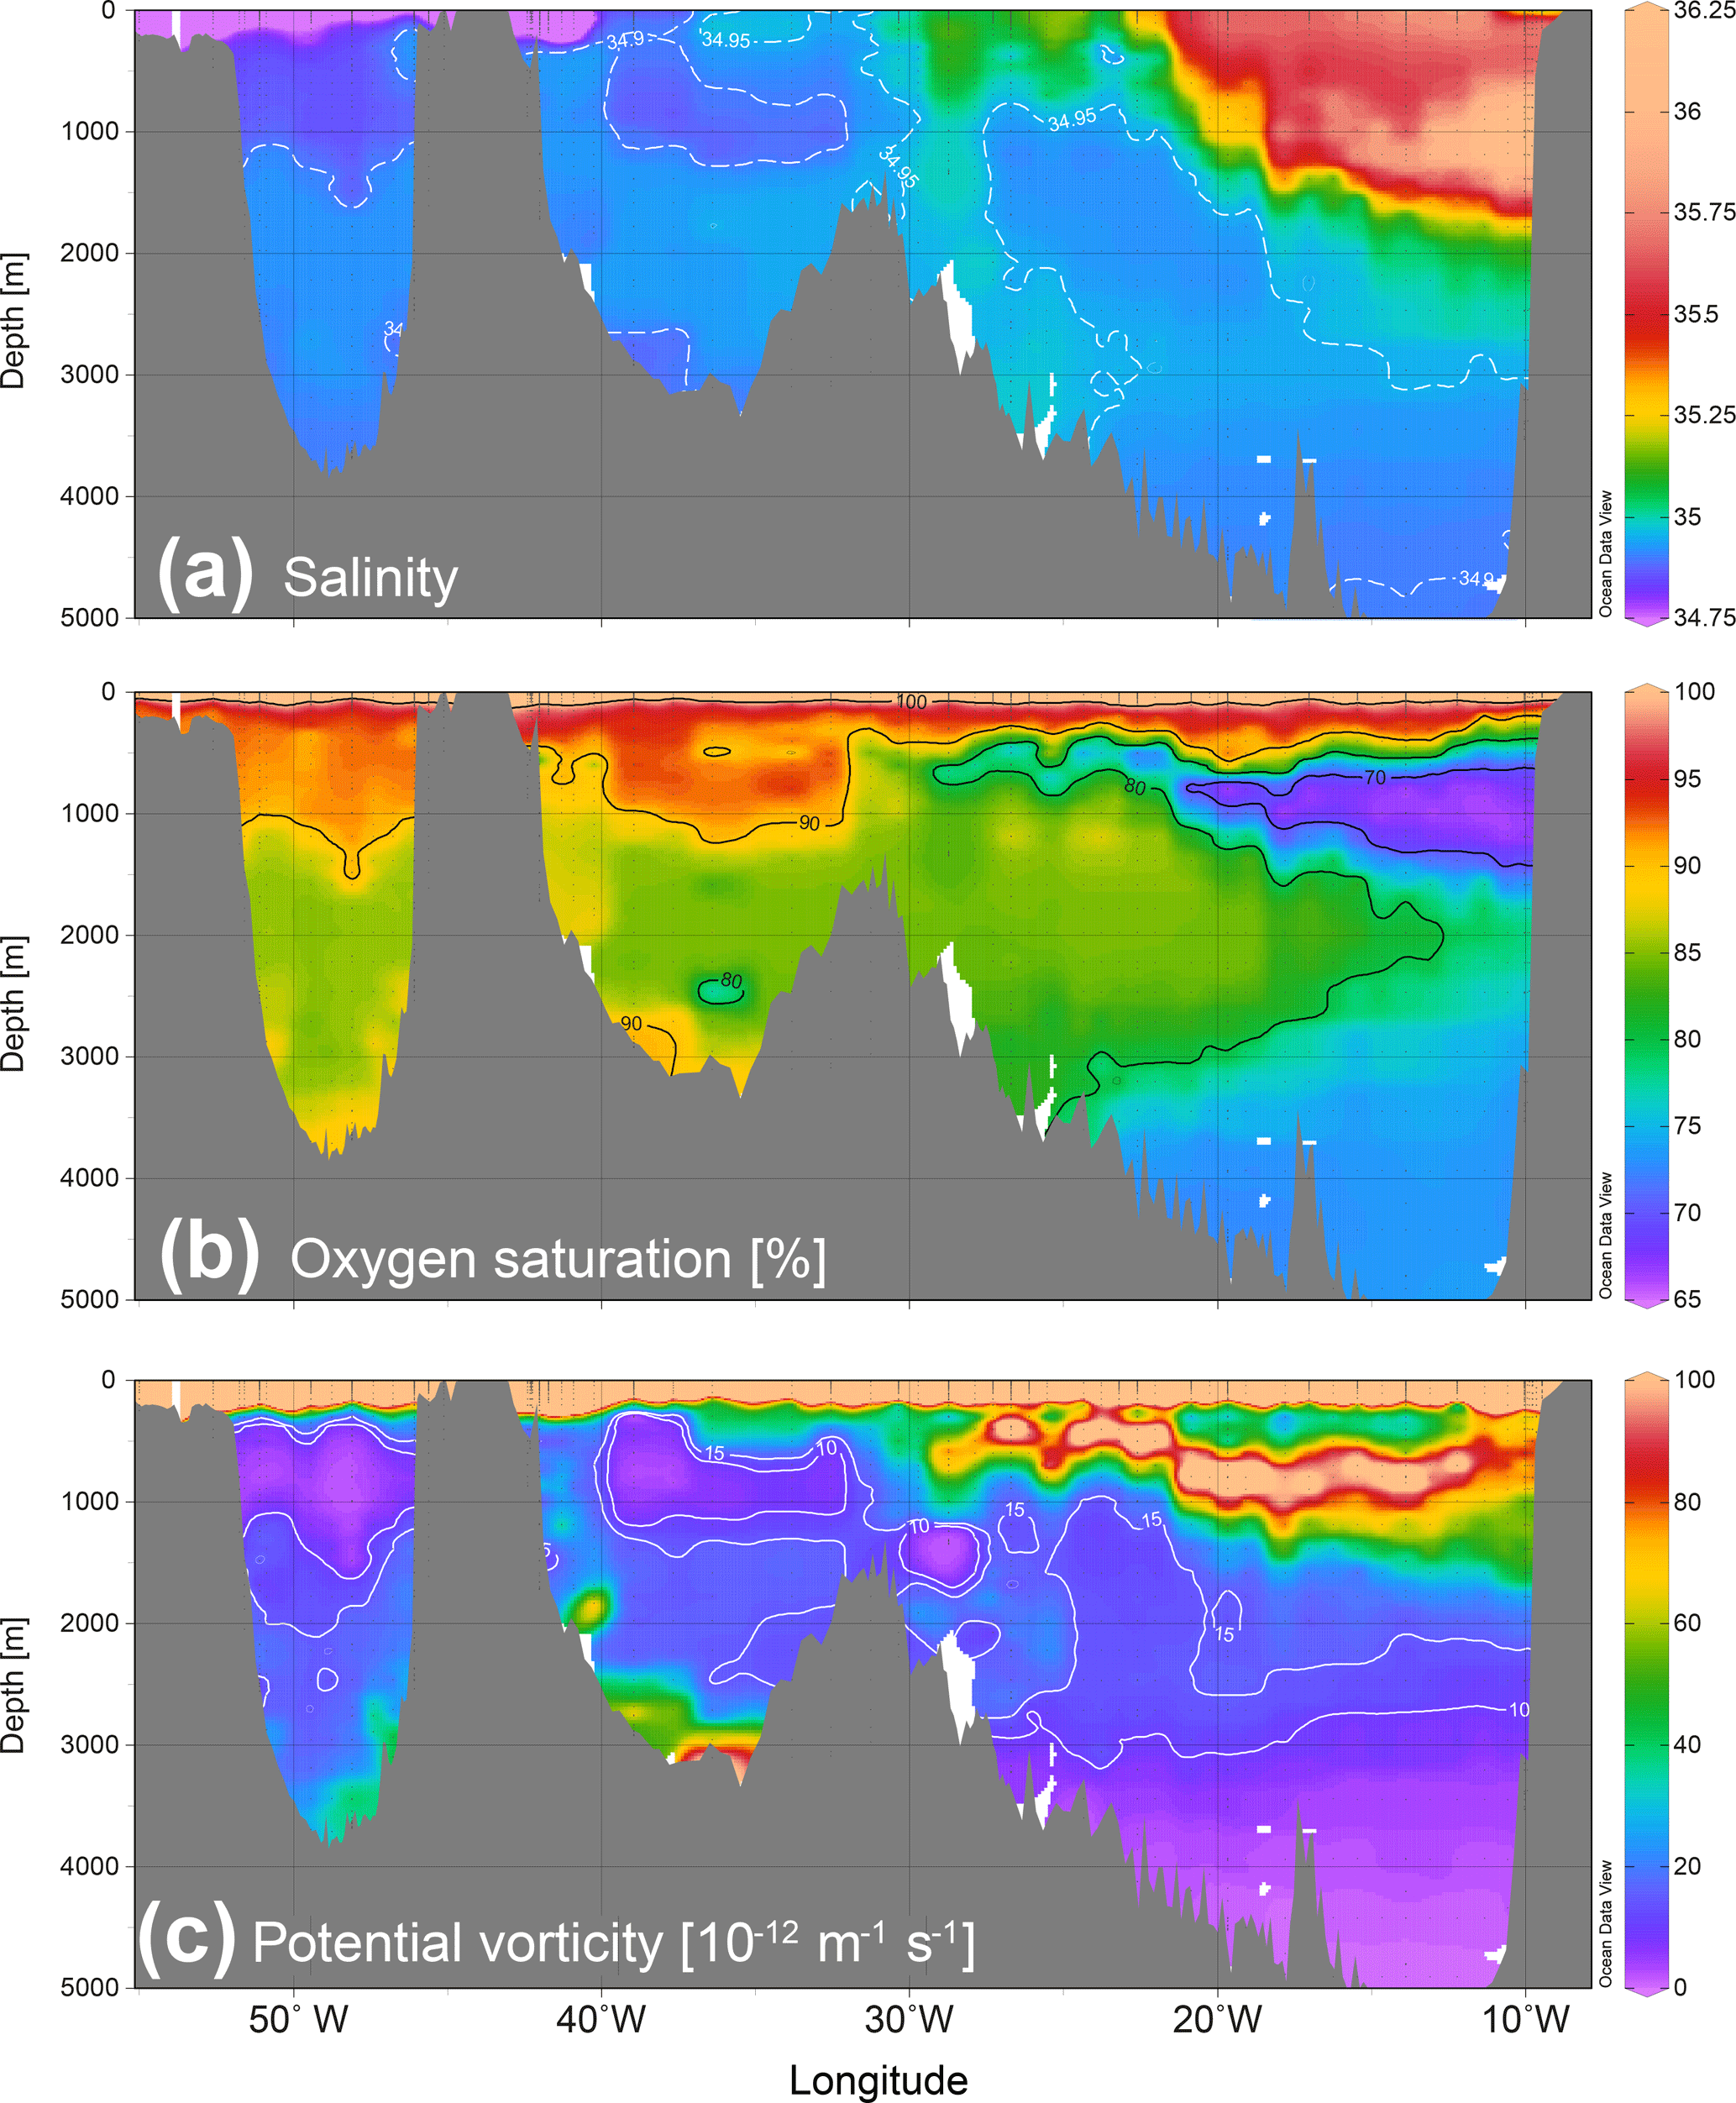
Figure 4Depth section across the GEOVIDE transect with hydrographic parameters (a) salinity, (b) oxygen (O2) saturation, and (c) potential vorticity (PV). Spreading of Labrador Sea Water, reflected in hydrography by low-salinity, low-PV, high-O2 signals (panels a, b, and c).
Factoring out the offset in absolute δ30SiDSi values and the greater variability in our data (see Fig. 3 for details), it is interesting to note that our deep North Atlantic samples exhibit essentially the same δ30SiDSi range (∼0.6 ‰; Fig. 3) as that observed over the entire latitudinal range of the Atlantic Ocean (de Souza et al., 2012b). Our dataset thus indicates that DSi in the North Atlantic Ocean is an important source of isotopic variability in the deep ocean. This is at least partially due to the transport of isotopically heavy DSi to the North Atlantic by northward-flowing Subantarctic Mode Water/Antarctic Intermediate Water (de Souza et a., 2012b, 2015) and its incorporation into NADW, e.g., during the formation of LSW. However, Brzezinski and Jones (2015) hypothesized that the Arctic Ocean may also play an important role in producing deep North Atlantic δ30SiDSi variability, via overflows across the Greenland–Iceland–Scotland ridge (i.e., DSOW and ISOW), which dominantly contribute to Lower NADW. It thus remains to be understood how the isotopic compositions of various precursors of NADW contribute to its isotopic signal. In the following, we discuss our δ30SiDSi dataset in the context of regional oceanography, in order to study the control of interacting interior water masses on the δ30SiDSi distribution of the high North Atlantic.
4.2 Relationship between North Atlantic δ30SiDSi distribution and water mass structure
The GEOVIDE section intersects numerous water masses of various origins whose presence is reflected in the distributions of salinity, dissolved oxygen (O2), and potential vorticity (PV) along the section (Fig. 4a, b, c; dissolved O2 is presented as percent saturation, i.e., , where is the saturation O2 concentration). Since δ30SiDSi was only measured at depths below 500 m, we focus on the intermediate and deep ocean water masses. In discussing the relationship between the δ30SiDSi distribution and water mass structure, we initially focus on the westernmost and easternmost sections of the GEOVIDE transect, where water masses are in their most unadulterated form along the transect, prior to discussing their extension into the mid-Atlantic.
Starting with the westernmost profiles, those of stations 77, 69, and 64 in the Labrador Sea, we see relatively well-oxygenated waters with low PV (Fig. 4c) extending to depths below 2000 m, reflecting the presence of LSW. This water mass, which contributes to NADW, is formed by deep convection in the Labrador and Irminger seas (e.g., de Jong and de Steur, 2016) and spreads across the North Atlantic at intermediate to middle depths (see Fig. 1). Two distinct types of LSW can be distinguished and are indeed visible in our profiles. There is an extremely low-PV ( m−1 s−1) and well-oxygenated (>90 % saturation) pycnostad extending from around 400 to 1200 m in the Labrador and Irminger basins, and a saltier, less well-oxygenated water mass observed from roughly 1500 to 2300 m. These two water masses have been called Upper and Lower LSW, respectively (e.g., Kieke et al., 2007), and reflect variability in the severity of heat loss and depth of convection in the Labrador Sea (Yashayaev et al., 2003, 2007) most likely associated with differences in atmospheric forcing during different phases of the North Atlantic Oscillation (NAO; Dickson et al., 1996; Lazier et al., 2002).
At the three stations in the Labrador Sea, Upper LSW has a δ30SiDSi of around +2 ‰ and a DSi concentration of <10 µM (Fig. 3). Lower LSW has slightly lower δ30SiDSi values (around +1.5 ‰) and slightly higher DSi concentrations (∼10–15 µM). These differences could be due to a slightly greater proportion of regenerated silica in these deeper layers, less frequently and intensively penetrated by deep convection, or to differences in the preformed properties of Upper and Lower LSW, a result of convection to greater depths during the formation of Lower LSW.
Below LSW, the central Labrador Sea (STN 69) exhibits an exemplary “stacking” of the water masses contributing to NADW. Specifically, an increase in salinity at 3000 m points to the presence of NEADW, a modified version of the eastern Atlantic overflow water mass ISOW (van Aken and de Boer, 1995) that has crossed into the western Atlantic at the Charlie-Gibbs Fracture Zone (van Aken, 2000). At this point, NEADW has a δ30SiDSi of +1.5 ‰ and a DSi concentration of about 15 µM, values essentially equal to that of Lower LSW since ISOW has entrained LSW during its journey from the Iceland–Scotland sill. At the very base of the water column, beginning at about 3500 m water depth, a decrease in salinity and increase in O2 saturation point to the presence of DSOW, which flows from the Arctic Ocean into the North Atlantic as a bottom-hugging overflow off the eastern coast of Greenland, and represents the densest water contributing to NADW (Dickson and Brown, 1994). Our δ30SiDSi sample is situated within the transition between NEADW and DSOW, with slightly lower DSi than in NEADW, but no distinguishable difference in terms of its δ30SiDSi value of around +1.5 ‰.
Moving eastwards along the GEOVIDE transect brings us next to STN 60, on the southeastern coast of Greenland. This relatively shallow station has sampled IrSPMW at its upper two depths, which have high δ30SiDSi values (2.8 ‰ at 1000 m and 1.8 ‰ at 1400 m) and relatively low DSi concentrations (around 10 µM), reflective of the mixing of nutrient-depleted surface waters into this water mass. Subpolar Mode Waters can be seen as precursors to LSW, as they form pycnostads of progressively greater density from east to west in the subarctic gyre, preconditioning the upper water column for deep-reaching Labrador Sea convection by producing a relatively unstratified water column (Brambilla and Talley, 2008). Their more elevated δ30SiDSi values than that of LSW imply that the entrainment of DSi during deep convection associated with LSW formation plays an important role in setting the final δ30SiDSi signature of this water mass. The deepest depth sampled at STN 60 (1800 m), on the other hand, is probably LSW, with its low PV, high O2, and δ30SiDSi around +1.4 ‰, similar to the value observed in the central Labrador Sea.
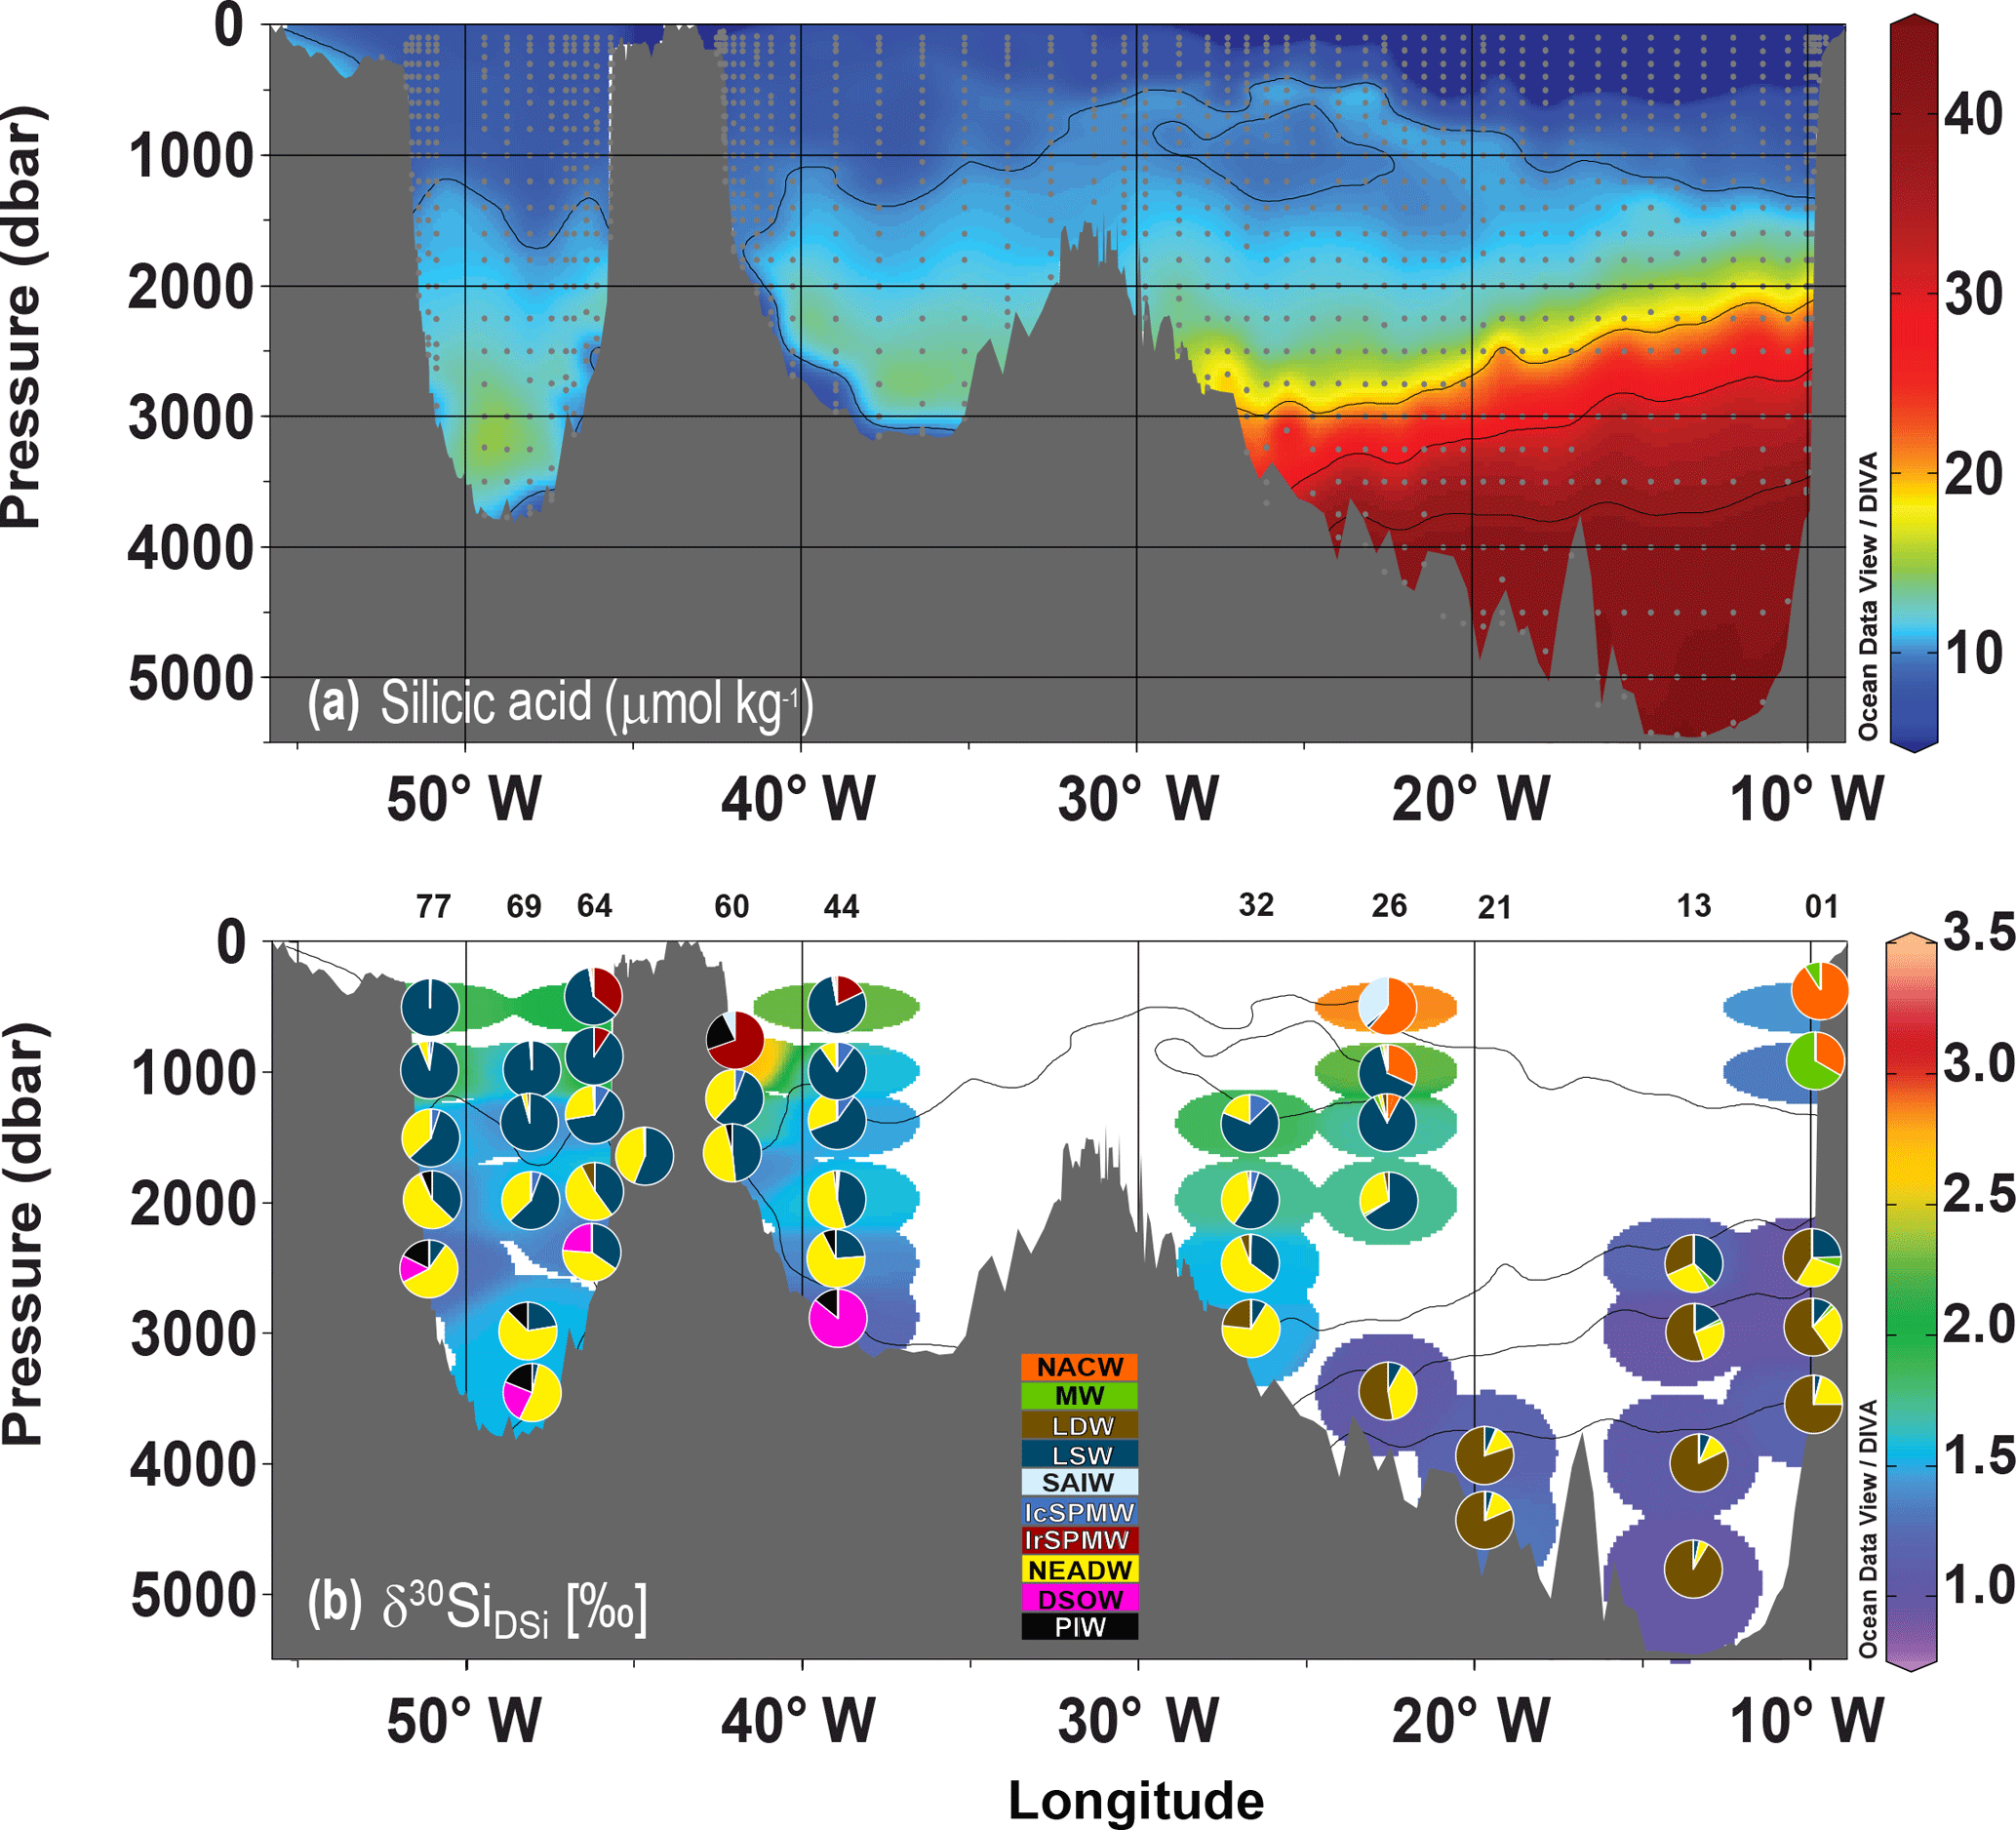
Figure 5Depth section across the GEOVIDE transect with (a) silicic acid concentration (dissolved silicon; DSi) together with (b) δ30SiDSi data overlain by pie charts of the fraction of DSi in each sample contributed by various water masses, as calculated by OMP analysis (García-Ibáñez et al., 2018). Spreading of Labrador Sea Water, as shown in Fig. 4 and in the OMP results (see Supplement Table S4) by a dominant Si contribution from this water mass, produces a mid-depth extension of elevated δ30Si values into the eastern Atlantic. For water mass abbreviations see the main text (Sect. 2.4).
Moving all the way across the Atlantic to the easternmost portion of the GEOVIDE transect allows us to focus in on two more important interior water masses. One of the most striking features in the distributions of salinity and O2 is the tongue of salty, O2-poor water extending westward from the Iberian margin at about 1000 m water depth. This is predominantly MW that has entered the Atlantic through the Strait of Gibraltar (Iorga and Lozier, 1999). The one sample we have of predominantly MW is at 1000 m depth at STN 01, just off of the Iberian Peninsula, with a δ30SiDSi of +1.2 ‰ and a DSi concentration of about 10 µM. The δ30SiDSi value of +1.2 ‰ corresponds well to the value of +1.3 ‰ measured by Coffineau (2013) in samples from closer to the point of origin of this water mass.
The other water mass sampled for δ30SiDSi in the eastern Atlantic Ocean is an O2-poor, low-PV, Si-rich abyssal water mass that is present below about 3000 m. This is LDW (McCartney, 1992), which derives from northward-flowing AABW that has entered the eastern Atlantic Ocean via the Vema Fracture Zone (Mantyla and Reid, 1983; McCartney et al., 1991). The OMP results of García-Ibáñez et al. (2018) shown in Fig. 5b nicely illustrate that LDW (which they denote as NEADWL) is the dominant contributor to the DSi inventory of the deep eastern Atlantic. This is a direct result of LDW being rich in DSi (25–45 µM) when compared to the other water masses in the North Atlantic Ocean.
The influence of this Si-rich southern-sourced water mass is also clearly seen in the δ30SiDSi distribution (Fig. 2b): δ30SiDSi values below 3000 m in the far-eastern Atlantic (stations 01, 13 and 21) range from +0.95 ‰ to +1.3 ‰, significantly lower than values at similar depths in the western Atlantic, which is dominated by northern-sourced water masses. The low δ30SiDSi values we observe for LDW compare very well with the value of +1.2 ‰ observed in AABW in the South Atlantic (de Souza et al., 2012b), indicating that the Si richness of this water mass makes its δ30SiDSi value insensitive to mixing or opal dissolution as it flows northwards in the abyssal Atlantic Ocean. Interestingly, four of our deep samples from stations 1 and 13 have low δ30SiDSi, perhaps indicative of another unknown source of isotopically light DSi (see Fig. 3). However, this still needs to be confirmed.
The remaining three stations in the mid-Atlantic (22–38∘ W; stations 26, 32 and 44) are influenced by varying combinations of the water masses of northern and southern origin that were discussed above. The easternmost of these three stations, STN 26 at the edge of the Porcupine Abyssal Plain, provides an exemplary illustration of the interaction of these water masses. At a depth of 500 m, the δ30SiDSi value (+2.85 ‰) is our most elevated isotopic composition, which may be influenced by the SAIW, but this is difficult to argue since this sample site is the only partial sample from this water mass, At depths of 1400 and 2000 m, the water column at this station is dominated by Lower LSW, as reflected by the PV, O2 and salinity distributions (Fig. 4a, b, c). As in the Labrador Sea itself, Lower LSW bears an elevated δ30SiDSi value, here about +1.7 ‰, and a relatively low DSi concentration of ∼15 µM. This Si-poor water mass is underlain, at the very bottom of the profile (3500 m) by the Si-rich southern-sourced LDW (45 µM DSi) that bears a typically low δ30SiDSi value of +1.1 ‰.
The influence of dense LDW does not extend further west than the Porcupine Abyssal Plain, and thus at stations 44 and 32, Upper and Lower LSW give way to the denser ISOW (or its modified product, NEADW) with depth. As it flows over the Iceland–Scotland Ridge, ISOW mixes with more saline waters of the Atlantic thermocline to form NEADW that, being quite dense, comes to lie below LSW as it flows geostrophically along the western edge of the West European Basin (Fig. 1). The differences in DSi concentration and δ30SiDSi between these northern-sourced water masses are small: ISOW-influenced waters at depths of 2500–3000 m bear values of +1.4 ‰ to +1.5 ‰ for δ30SiDSi and 15–25 µM for DSi, whilst LSW is only slightly more DSi-poor and correspondingly higher in δ30SiDSi (10–12 µM and +1.4 ‰ to +1.9 ‰, respectively). The resemblance in DSi concentration and δ30SiDSi between these two water masses is also due to the entrainment of LSW into ISOW. Interestingly, the very base of the water column at STN 44 is occupied by the dense and Si-poor DSOW, where it has a dissolved silicon concentration of about 8 µM and a δ30SiDSi of +1.2 ‰. Although the DSi is typical for DSOW, the δ30SiDSi value of +1.2 ‰ is unexpectedly low for this water mass.
4.3 The influence of Labrador Sea Water on the North Atlantic distribution of δ30SiDSi
The most important isotope fractionation signal in marine DSi is produced by diatom DSi uptake in the surface ocean (De La Rocha et al., 1997; Varela et al., 2004; Sutton et al., 2013), due to the dominant importance of these phytoplankton for the marine Si cycle (Tréguer and De La Rocha, 2013; Hendry and Brzezinski, 2014). As a result, elevated values of δ30SiDSi can be produced only within the well-lit surface ocean, where photosynthesizing organisms can grow and silicify. This surface–ocean signal is communicated more broadly by the process of water mass subduction, i.e., the transport of surface water parcels into the ocean interior (Stommel, 1979). This is seen particularly clearly in our dataset, which spans a region in which exceptionally deep winter convection gives rise to mixed layers over 1 km deep in the Labrador Sea and Irminger Sea, injecting isotopically fractionated DSi into the ocean interior.
As can be seen from Figs. 4 and 5, there is a clear association of elevated δ30SiDSi values with the low-PV and high-O2 signal of LSW (e.g., STN 77, 502 m), the water mass that is produced by deep winter convection. Indeed, the eastward spread of these elevated values coincides remarkably well with the extension of LSW mapped by McCartney and Talley (1982) based on PV (as shown in Fig. 1). The influence of LSW on the North Atlantic δ30SiDSi distribution is also nicely illustrated by the depth profiles in Figs. 2b and 5, which show that, unlike the eastern Atlantic with low δ30SiDSi values at mid-depths, the central and western North Atlantic bears elevated δ30SiDSi values close to those observed within the Labrador Sea itself (stations 64, 69, and 77), which consists primarily of subducted surface water. Such high values at mid-depths are unique to the North Atlantic Ocean amongst the major open-ocean basins, and result from the local formation of deep waters from Si-depleted surface waters of the subpolar North Atlantic.
Thus, one proximal physical control on the North Atlantic δ30SiDSi distribution is the vertical transport of DSi from the surface ocean to mid-depths during LSW formation. Another physical control is shown by the close correlation between elevated δ30SiDSi and lower PV even within the eastern Atlantic Ocean, far from the region of deep convection (Figs. 4 and 5). This highlights the fact that the spreading of LSW as a result of the regional circulation transports its isotopic signal within the ocean interior, resulting in mid-depth δ30SiDSi values around +1.5 ‰ in regions where the physical signatures of LSW can be seen, documenting the importance of water mass structure on the marine δ30SiDSi distribution. Furthermore, this circulation pattern results in the direct interaction of this northern-sourced water mass with the southern-sourced LDW, producing strong local δ30SiDSi gradients whose systematics correspond nicely to the basin-scale systematics (60∘ S to 60∘ N) documented by de Souza et al. (2012b; see Sect. 4.1 and Fig. 3).
Elevated values of δ30SiDSi are also associated with the dense overflows from the Nordic Seas. Whilst our single sample of predominantly DSOW (STN 44, 2900 m) surprisingly bears a low δ30SiDSi value of +1.2 ‰, ISOW and its derivative NEADW bear similarly low DSi concentrations and similarly elevated δ30SiDSi values to LSW, reaching up to +1.5 ‰ in the abyssal Labrador Sea. They originate as dense bottom-hugging overflows of mid-depth Nordic Sea waters, influenced by the Arctic Ocean, that enter the North Atlantic across the submarine sills running between Greenland, Iceland and Scotland, and the elevated δ30SiDSi values of ISOW and NEADW reflect the isotopically heavy nature of the deep Arctic (Varela et al., 2016). Both Brzezinski and Jones (2015) and Varela et al. (2016) suggest that this feature results from the nature of the inflows to the Arctic Ocean, which receives isotopically fractionated DSi via the upper-ocean inflows from the Atlantic (and, to a lesser extent, the Pacific) due to the shallow sills that form its boundaries to these ocean basins. Observational and modelling studies indicate that these inflows are isotopically heavy primarily due to isotope fractionation during diatom DSi uptake in the Southern Ocean, although more proximal fractionation within the Atlantic and Pacific oceans most likely also plays some role (de Souza et al., 2012a, 2015).
Finally, interesting insights may be gained from a comparison of our Labrador Sea data with the only other published data from this region (de Souza et al., 2012b). Figure 6 compares data from the central Labrador Sea (STN 69) from the GEOVIDE study with literature data from within the Labrador Sea and slightly further south, in the vicinity of the Grand Banks (de Souza et al., 2012b), tracing LSW and NADW as they flow southwards. The three profiles agree within uncertainty at mid-depths and below, but diverge in the upper ocean at depths associated with Upper LSW. Since deep winter convection occurs up to depths of 1000–1500 m regularly within the Labrador Sea, this water mass is frequently ventilated locally, which may result not only in variable physical properties (as shown in Fig. 4) but also changes in its chemical characteristics, such as δ30SiDSi. However, care should be taken not to over-interpret such differences of ∼0.3 ‰, given the potential for δ30SiDSi offsets between laboratories of ±0.2 ‰, as discussed in Sect. 4.1 (Reynolds et al., 2007; Grasse et al., 2017).
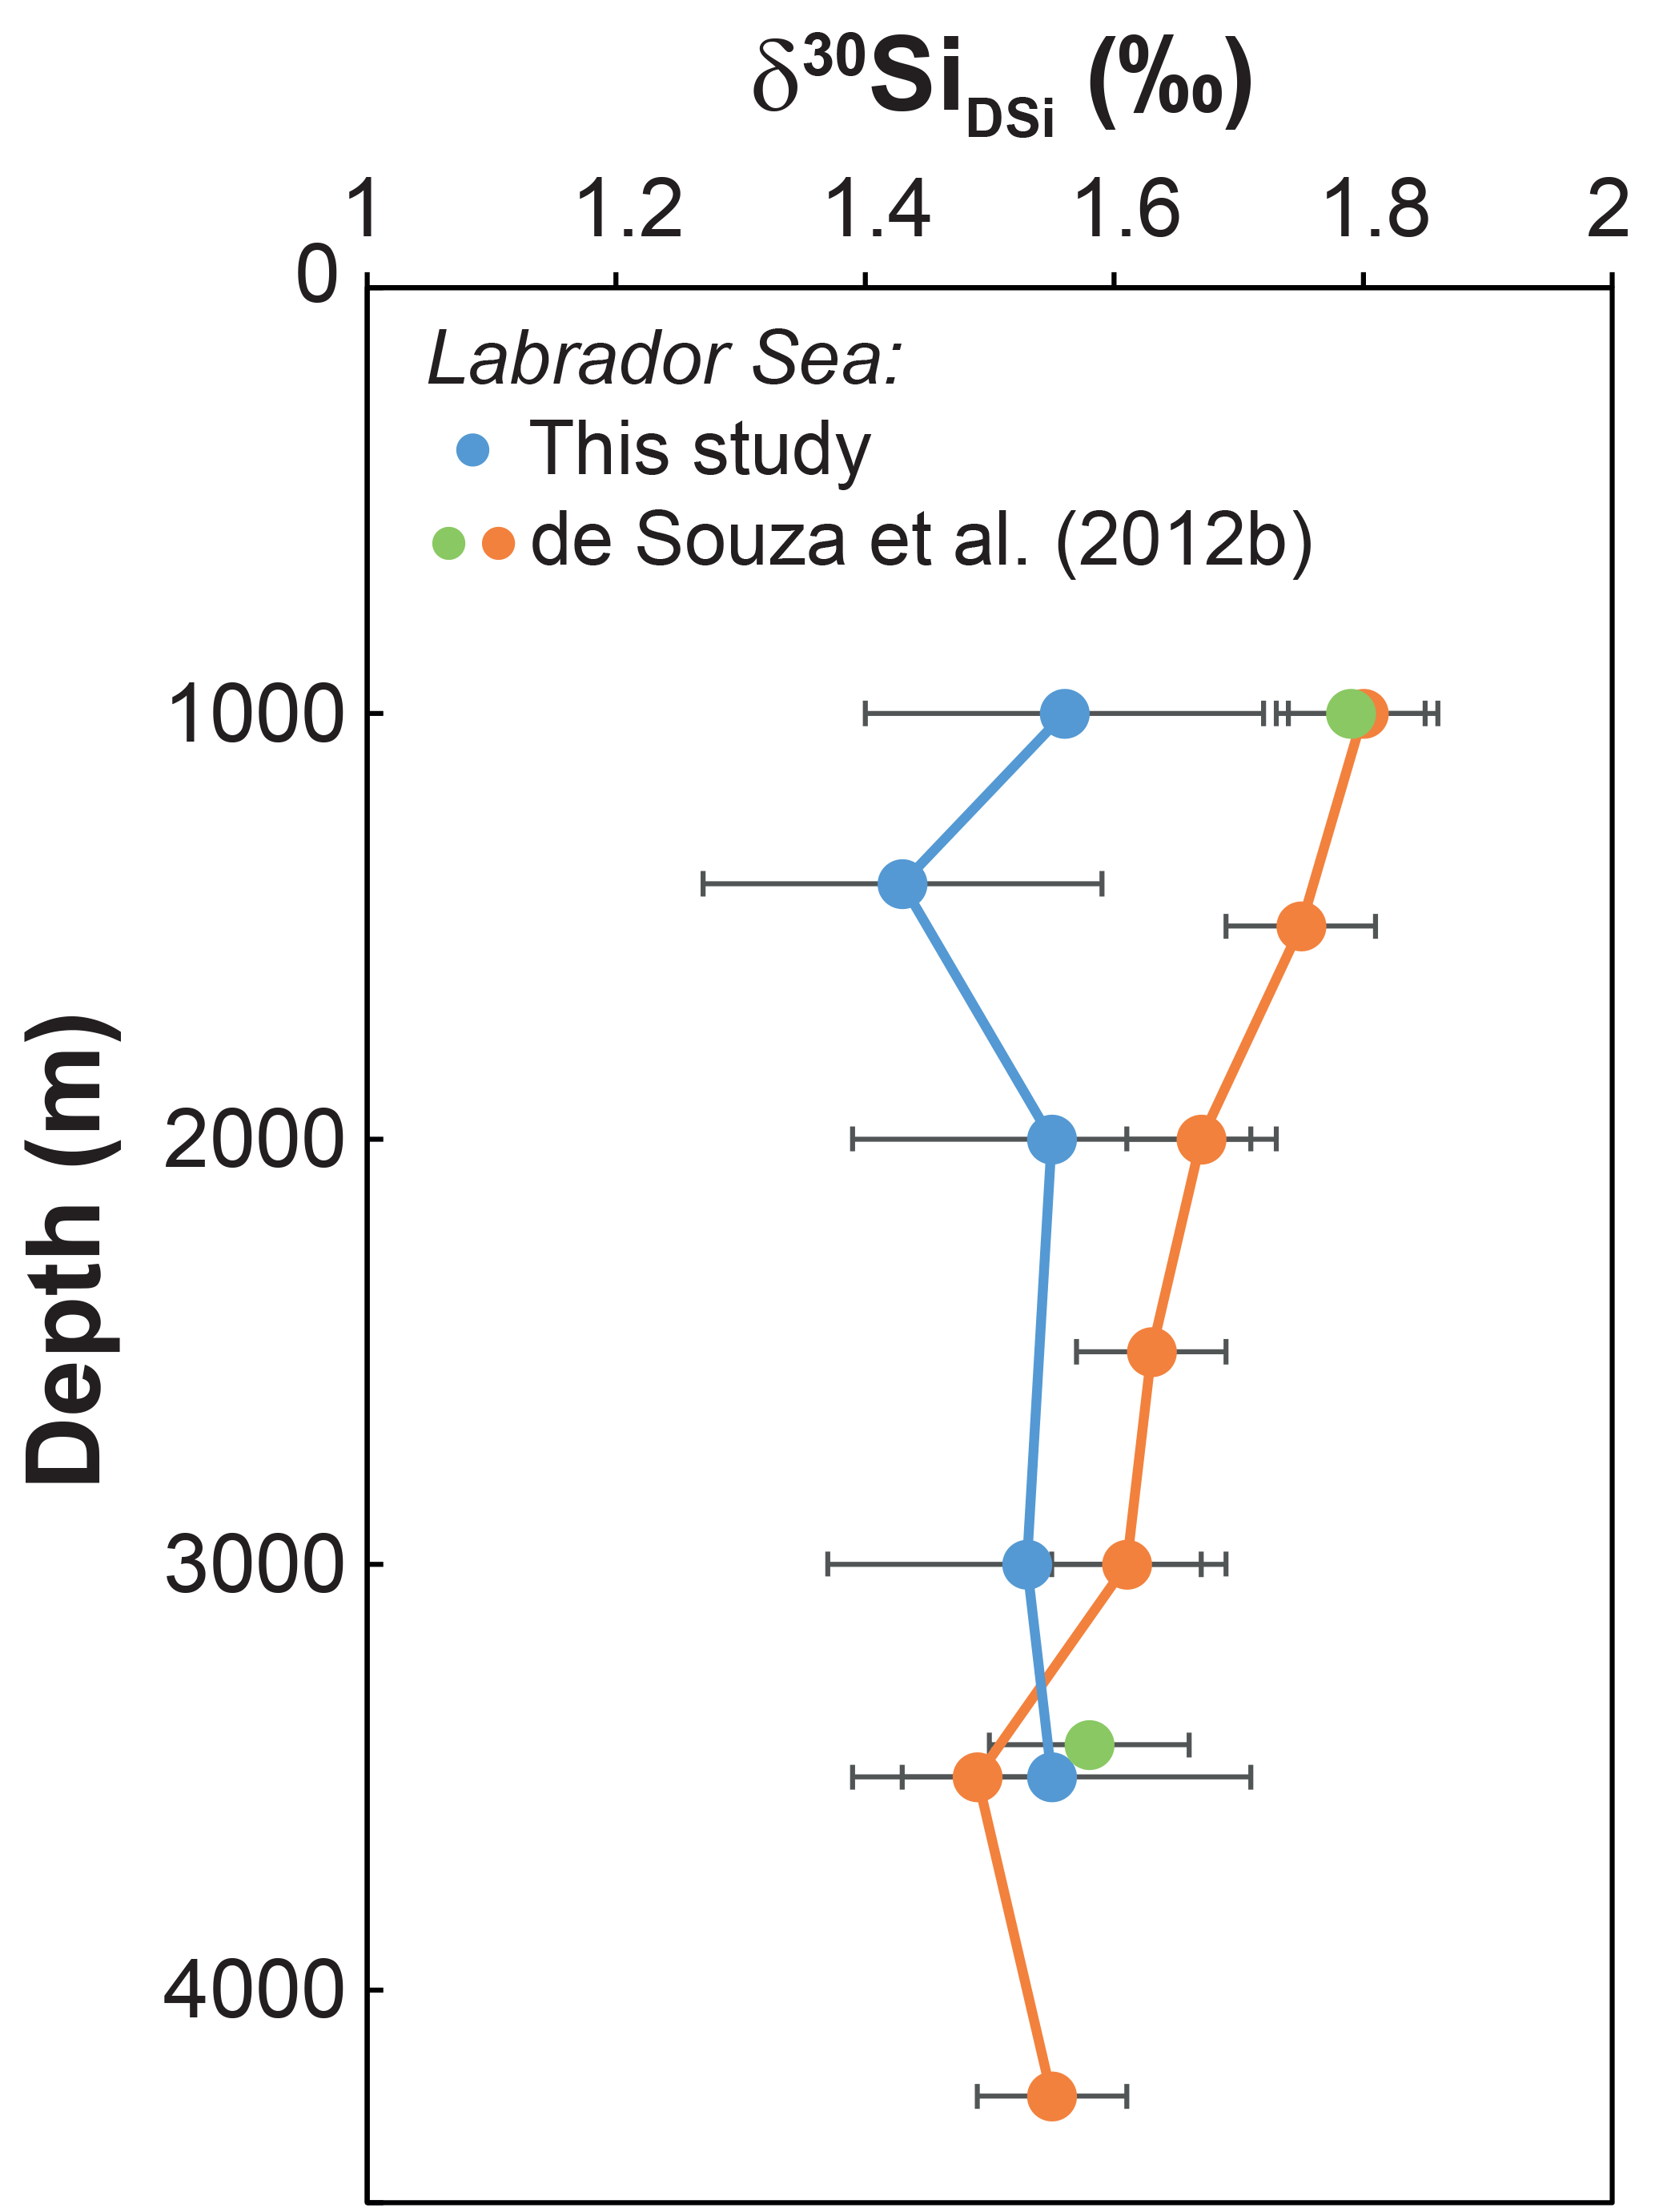
Figure 6Data from the Labrador Sea (STN 69; blue) during the GEOVIDE cruise (2014) compared with data from samples collected in 2010 from nearby stations in the Labrador Sea (green) and at the Grand Banks (orange) (stations 8 and 11 in de Souza et al. (2012b).
Water mass subduction and circulation appears to be the dominant process influencing the distribution of DSi in the North Atlantic Ocean and Labrador Sea. Our dataset of δ30SiDSi along the GEOVIDE transect documents the extent to which the distribution of δ30SiDSi in the North Atlantic Ocean and Labrador Sea is influenced by the hydrography of this region. At depths below 1000 m, the distribution of δ30SiDSi is clearly linked to water mass structure, with the two dominant influences coming from northern-sourced waters (LSW and ISOW) and southern-sourced waters (LDW). The Si-poor northern-sourced waters impart the intermediate and mid-depth North Atlantic Ocean with elevated δ30SiDSi values over +1.4 ‰ and up to +1.9 ‰, whilst the Si-rich abyssal LDW results in low δ30SiDSi values of +1.1 ‰ to +1.3 ‰ in the deepest eastern Atlantic Ocean. By combining our isotope data with hydrographic information and results from an optimum multiparameter analysis, we show that the δ30SiDSi distribution bears clear evidence of the influence of LSW flowing across the Atlantic Ocean into the eastern basins, in a manner consistent with McCartney and Talley's (1982) canonical map of the extent of this water mass. As a result, the eastern Atlantic exhibits the direct “stacking” of young, Si-poor LSW above old, Si-rich LDW, producing a range in deep ocean δ30SiDSi values within this one ocean basin that is comparable to that observed over the entire latitudinal range of the Atlantic Ocean and, indeed, in the global deep ocean.
All data are published in this paper or in the Supplement: therefore all the data are publicly accessible.
The supplement related to this article is available online at: https://doi.org/10.5194/bg-15-5663-2018-supplement.
JNS and CDLR conceived of the project and wrote the proposals that funded the work. JNS performed the measurements except for the interlaboratory calibration analyses, which were in part analyzed by GFdS. JNS conducted the data analysis. Interpretation was led by JNS with input from GFdS and CDLR and MIGB. JNS drafted the paper, which was edited by all the authors.
The authors declare that they have no conflict of interest.
This article is part of the special issue “GEOVIDE, an international GEOTRACES study along the OVIDE section in the North Atlantic and in the Labrador Sea (GA01)”. It is not directly associated with a conference. Partial results were presented at the Ocean Sciences meeting in 2016 (New Orleans, USA) and the Isotopes in Biogenic Silica (IBiS) meeting in 2015 (London, England).
The authors thank the UMS flotte, GENAVIR, DT INSU in the realization of the
GEOVIDE mission and the captain, Gilles Ferrand, and crew of the R/V
Pourquoi Pas?, as well as chief scientists Geraldine Sarthou and
Pascale Lherminier. Special thanks to Morgane Gallinari, Manon Le Goff,
Emilie Grossteffan, and Paul Tréguer for the nutrient analyses;
Karina Giesbrecht, and Lorna Foliot for helping with the sampling of water
for this project; and Emmanuel Ponzevera (Unité Géosciences Marines;
Ifremer) for providing assistance with the mass spectrometry. In addition, we
would like to give thanks to Pierre Branellec,
Floriane Desprez de Gésincourt, Michel Hamon, Catherine Kermabon,
Philippe Le Bot, Stéphane Leizour, Olivier Ménage, Fabien Pérault
and Emmanuel de Saint Léger for their technical expertise and to
Catherine Schmechtig for the GEOVIDE database management. This work was
supported by the “Laboratoire d'Excellence” LabexMER (ANR-10-LABX-19) and
co-funded by a grant from the French government under the program
“Investissements d'Avenir”, and by a grant from the Regional Council of
Brittany (SAD programme). The GEOVIDE project was funded by CNRS-INSU
(programme LEFE-CYBER), the French National Research Agency
(ANR-13-BS06-0014, ANR-12-PDOC-0025-01) and “RPDOC” BITMAP
(ANR-12-PDOC-0025), the LabexMER ANR-10-LABX-19) and Ifremer. The GEOVIDE
project was also supported for logistics by DT-INSU and GENAVIR. Gregory de
Souza was supported by a Marie Skłodowska-Curie Research Fellowship under
EU Horizon 2020 (SOSiC; no. 708407). Maribel I. Garcia-Ibáñez was
supported by the Spanish Ministry of Economy and Competitiveness through the
BOCATS (CTM2013-41048-P) project co-funded by the Fondo Europeo de Desarrollo
Regional 2014–2020 (FEDER).
Edited by:
Catherine Jeandel
Reviewed by: Patricia Grasse and Damien
Cardinal
Abraham, K., Opfergelt, S., Fripiat, F., Cavagna, A. J., de Jong, J. T. M., Foley, S. F., André, L., and Cardinal, D.: δ30Si and δ29Si determinations on USGS BHVO-1 and BHVO-2 reference materials with a new configuration on a Nu plasma multi-collector ICPMS, Geostand. Geoanal. Res., 32, 193–202, 2008.
Ambar, I. and Howe, M. R.: Observations of the Mediterranean outflow-I: mixing in the Mediterranean outflow, Deep-Sea Res. Pt. A, 26, 535–554, https://doi.org/10.1016/0198-0149(79)90095-5, 1979.
Arhan, M.: The North Atlantic Current and subarctic intermediate water, J. Mar. Res., 48, 109–144, https://doi.org/10.1357/002224090784984605, 1990.
Baringer, M. O. and Price, J. F.: Mixing and spreading of the Mediterranean outflow, J. Phys. Oceanogr., 27, 1654–1677, https://doi.org/10.1175/1520-0485(1997)027<1654:MASOTM>2.0.CO;2, 1997.
Beucher, C., Brzezinski, M. A., and Jones, J. L.: Mechanisms controlling silicon isotope distribution in the eastern Equatorial Pacific, Geochim. Cosmochim. Ac., 75, 4286–4294, 2011.
Beucher, C. P., Brzezinski, M. A., and Jones, J. L.: Sources and biological fractionation of Silicon isotopes in the Eastern Equatorial Pacific, Geochim. Cosmochim. Ac., 72, 3063–3073, 2008.
Brambilla, E. and Talley, L. D.: Subpolar Mode Water in the northeastern Atlantic: 1. Averaged properties and mean circulation, J. Geophys. Res.-Oceans, 113, C04025, https://doi.org/10.1029/2006jc004062, 2008.
Broecker, W. and Takahashi, T.: Hydrography of the Central Atlantic – III. The North Atlantic deep-water complex, Deep-Sea Res. Pt. A, 27, 591–613, 1980.
Brzezinski, M. A. and Jones, J. L.: Coupling of the distribution of silicon isotopes to the meridional overturning circulation of the North Atlantic Ocean, Deep-Sea Res. Pt. II, 116, 79–88, 2015.
Cardinal, D., Alleman, L. Y., De Jong, J., Ziegler, K., and Andre, L.: Isotopic composition of silicon measured by multicollector plasma source mass spectrometry in dry plasma mode, J. Anal. Atom. Spectrom., 18, 213–218, 2003.
Cardinal, D., Alleman, L. Y., Dehairs, F., Savoye, N., Trull, T. W., and André, L.: Relevance of silicon isotopes to Si-nutrient utilization and Si-source assessment in Antarctic waters, Global Biogeochem. Cy., 19, GB2007, https://doi.org/10.1029/2004GB002364, 2005.
Coffineau, N.: Processus contrôlant la distribution des isotopes du silicium dissous dans l'océan Atlantique et Indien, Doctoral thesis, Université de Bretagne Occidentale, Brest, France, 2013.
Coffineau, N., De La Rocha, C. L., and Pondaven, P.: Exploring interacting influences on the silicon isotopic composition of the surface ocean: a case study from the Kerguelen Plateau, Biogeosciences, 11, 1371–1391, https://doi.org/10.5194/bg-11-1371-2014, 2014.
de Jong, M. F. and de Steur, L.: Strong winter cooling over the Irminger Sea in winter 2014–2015, exceptional deep convection, and the emergence of anomalously low SST, Geophys. Res. Lett., 43, 7106–7113, https://doi.org/10.1002/2016GL069596, 2016.
De La Rocha, C. L. and Bickle, M. J.: Sensitivity of silicon isotopes to whole-ocean changes in the silica cycle, Mar. Geol., 217, 267–282, 2005.
De La Rocha, C. L., Brzezinski, M. A., and DeNiro, M. J.: Purification, recovery, and laser-driven fluorination of silicon from dissolved and particulate silica for the measurement of natural stable isotope abundances, Anal. Chem., 68, 3746–3750, 1996.
De La Rocha, C. L., Brzezinski, M. A., and DeNiro, M. J.: Fractionation of silicon isotopes by marine diatoms during biogenic silica formation, Geochim. Cosmochim. Ac., 61, 5051–5056, 1997.
De La Rocha, C. L., Brzezinski, M. A., and DeNiro, M. J.: A first look at the distribution of the stable isotopes of silicon in natural waters, Geochim. Cosmochim. Ac., 64, 2467–2477, 2000.
De La Rocha, C. L. Bescont, P., Croguennoc, A., and Ponzevera, E.: The silicon isotopic composition of surface waters in the Atlantic and Indian sectors of the Southern Ocean, Geochim. Cosmochim. Ac., 75, 5283–5295, 2011.
de Souza, G. F., Reynolds, B. C., Johnson, G. C., Bullister, J. L., and Bourdon, B.: Silicon stable isotope distribution traces Southern Ocean export of Si to the eastern South Pacific thermocline, Biogeosciences, 9, 4199–4213, https://doi.org/10.5194/bg-9-4199-2012, 2012a.
de Souza, G. F., Reynolds, B. C., Rickli, J., Frank, M., Saito, M. A., Gerringa, L. J. A., and Bourdon, B.: Southern Ocean Control of Silicon Stable Isotope Distribution in the Deep Atlantic Ocean, Global Biogeochem. Cy., 26, GB2035, https://doi.org/10.1029/2011gb004141, 2012b.
de Souza, G. F., Slater, R. D., Dunne, J. P., and Sarmiento, J. L.: Deconvolving the controls on the deep ocean's silicon stable isotope distribution, Earth Planet. Sc. Lett., 398, 66–76, 2014.
de Souza, G. F., Slater, R. D., Hain, M. P., Brzezinski, M. A., and Sarmiento, J. L.: Distal and proximal controls on the silicon stable isotope signature of North Atlantic Deep Water, Earth Planet. Sc. Lett., 432, 342–353, 2015.
Demarest, M. R., Brzezinski, M. A., and Beucher, C. P.: Fractionation of silicon isotopes during biogenic silica dissolution, Geochim. Cosmochim. Ac., 73, 5572–5583, 2009.
Dickson, B., Yashayaev, I., Meincke, J., Turrell, B., Dye, S., and Holfort, J.: Rapid freshening of the deep North Atlantic Ocean over the past four decades, Nature, 416, 832–837, https://doi.org/10.1038/416832a, 2002.
Dickson, R., Lazier, J., Meincke, J., Rhines, P., and Swift, J.: Long-term coordinated changes in the convective activity of the North Atlantic, Prog. Oceanogr., 38, 241–295, 1996.
Dickson, R. R. and Brown, J.: The production of North Atlantic Deep Water: Sources, rates, and pathways, J. Geophys. Res.-Oceans, 99, 12319–12341, 1994.
Engström, E., Rodushkin, I., Baxter, D. C., and Öhlander, B.: Chromatographic Purification for the Determination of Dissolved Silicon Isotopic Compositions in Natural Waters by High-Resolution Multicollector Inductively Coupled Plasma Mass Spectrometry, Anal. Chem., 78, 250–257, 2006.
Fripiat, F., Cavagna, A.-J., Savoye, N., Dehairs, F., Andre, L., and Cardinal, D.: Isotopic constraints on the Si-biogeochemical cycle of the Antarctic Zone in the Kerguelen area (KEOPS), Mar. Chem., 123, 11–22, 2011.
Fogelqvist, E., Blindheim, J., Tanhua, T., Østerhus, S., Buch, E., and Rey, F.: Greenland-Scotland overflow studied by hydro-chemical multivariate analysis, Deep-Sea Res. Pt. I, 50, 73–102, https://doi.org/10.1016/S0967-0637(02)00131-0, 2003.
Fröb, F., Olsen, A., Våge, K., Moore, G. W. K., Yashayaev, I., Jeansson, E., and Rajasakaren, B.: Irminger Sea deep convection injects oxygen and anthropogenic carbon to the ocean interior, Nat. Commun., 7, 13244, https://doi.org/10.1038/ncomms13244, 2016.
García-Ibáñez, M. I., Pérez, F. F., Lherminier, P., Zunino, P., Mercier, H., and Tréguer, P.: Water mass distributions and transports for the 2014 GEOVIDE cruise in the North Atlantic, Biogeosciences, 15, 2075–2090, https://doi.org/10.5194/bg-15-2075-2018, 2018.
Grasse, P., Brzezinski, M. A., Cardinal, D., de Souza, G. F., Andersson, P., Closset, I. et al.: GEOTRACES inter-calibration of the stable silicon isotope composition of dissolved silicic acid in seawater. Journal of Analytical Atomic Spectrometry, 32, 562–578, https://doi.org/10.1039/C6JA00302H, 2017.
Hendry, K. R. and Brzezinski, M. A.: Using silicon isotopes to understand the role of the Southern Ocean in modern and ancient biogeochemistry and climate, Quaternary Sci. Rev., 89, 13–26, https://doi.org/10.1016/j.quascirev.2014.01.019, 2014.
Holzer, M. and Brzezinski, M.: Controls on the silicon isotope distribution in the ocean: New diagnostics from a data-constrained model, Global Biogeochem. Cy., 29, 267–287, 2015.
Iorga, M. C. and Lozier, M. S.: Signatures of the Mediterranean outflow from a North Atlantic climatology: 1. Salinity and density fields, J. Geophys. Res.-Oceans, 104, 25985–26009, 1999.
Iselin, C. O.: A Study of the Circulation of the Western North Atlantic, Pap. Phys. Oceanogr. Meteorol. Massachusetts Inst. Tech. and Woods Hole Oceanographic Inst., 101 pp., 1936.
Kieke, D., Rhein, M., Stramma, L., Smethie, W. M., Bullister, J. L., and LeBel, D. A.: Changes in the pool of Labrador Sea Water in the subpolar North Atlantic, Geophys. Res. Lett., 34, L06605, https://doi.org/10.1029/2006GL028959, 2007.
Lambelet, M., van de Flierdt, T., Crocket, K., Rehkämper, M., Kreissig, K., Coles, B., Rijkenberg, M. J. A., Gerringa, L. J. A., de Baar, H. J. W., and Steinfeldt, R.: Neodymium isotopic composition and concentration in the western North Atlantic Ocean: Results from the GEOTRACES GA02 section, Geochim. Cosmochim. Ac., 177, 1–29, 2016.
Lazier, J., Hendry, R., Clarke, A., Yashayaev, I., and Rhines, P.: Convection and restratification in the Labrador Sea, 1990–2000, Deep-Sea Res. Pt. I, 49, 1819–1835, 2002.
Mantyla, A. W. and Reid, J. L.: Abyssal characteristics of the world ocean waters, Deep-Sea Res. Pt. A, 30, 805–833, 1983.
McCartney, M. S.: Recirculating components to the deep boundary current of the northern North Atlantic, Prog. Oceanogr., 29, 283–383, 1992.
McCartney, M. S. and Talley, L. D.: The Subpolar Mode Water of the North Atlantic Ocean, J. Phys. Oceanogr., 12, 1169–1188, 1982.
McCartney, M. S., Bennett, S. L., and Woodgate-Jones, M. E.: Eastward flow through the Mid-Atlantic Ridge at 11∘ N and its influence on the abyss of the eastern basin, J. Phys. Oceanogr., 21, 1089–1121, 1991.
Pickart, R. S., Straneo, F., and Moore, G. K.: Is Labrador Sea Water formed in the Irminger basin?, Deep-Sea Res. Pt. I, 50, 23–52, https://doi.org/10.1016/S0967-0637(02)00134-6, 2003.
Pollard, R. T., Grifftths, M. J., Cunningham, S. A., Read, J. F., Pérez, F. F., and Ríos, A. F.: Vivaldi 1991 – a study of the formation, circulation and ventilation of Eastern North Atlantic Central Water, Prog. Oceanogr., 37, 167–192, https://doi.org/10.1016/S0079-6611(96)00008-0, 1996.
Read, J. F.: CONVEX-91: water masses and circulation of the Northeast Atlantic subpolar gyre, Prog. Oceanogr., 48, 461–510, https://doi.org/10.1016/S0079-6611(01)00011-8, 2000.
Reynolds, B. C., Frank, M., and Halliday, A. N.: Silicon isotope fractionation during nutrient utilization in the North Pacific, Earth Planet. Sc. Lett., 244, 431–443, 2006.
Reynolds, B. C., Aggarwal, J., André, L., Baxter, D., Beucher, C., Brzezinski, M. A., Engström, E., Georg, R. B., Land, M., Leng, M. J., Opfergelt, S., Rodushkin, I., Sloane, H. J., van den Boorn, S. H. J. M., Vroon, P. Z., and Cardinal, D.: An inter-laboratory comparison of Si isotope reference materials, J. Anal. Atom. Spectrom., 22, 561–568, 2007.
Reynolds, B. C.: Modeling the modern marine δ30Si distribution, Global Biogeochem. Cy., 23, GB2015, https://doi.org/10.1029/2008GB003266, 2009.
Sarmiento, J. L., Simeon, J., Gnanadesikan, A., Gruber, N., Key, R. M., and Schlitzer, R.: Deep ocean biogeochemistry of silicic acid and nitrate, Global Biogeochem. Cy., 21, GB1S90, https://doi.org/10.1029/2006GB002720, 2007.
Stommel, H.: Determination of water mass properties of water pumped down from the Ekman layer to the geostrophic flow below, P. Natl. Acad. Sci. USA, 76, 3051–3055, 1979.
Strickland, J. D. H. and Parsons, T. R.: A Practical Handbook of Seawater Analysis, Fisheries Research Board of Canada, Ottawa, 310 p., 1972.
Sutton, J. N., Varela, D. E., Brzezinksi, M. A., and Beucher, C. P.: Species-dependent silicon isotope fractionation by marine diatoms, Geochim. Cosmochim. Ac., 104, 300–309, 2013.
Tréguer, P. J. and De La Rocha, C. L.: The world ocean silica cycle, Annu. Rev. Mar. Sci., 5, 477–501, 2013.
Tsuchiya, M., Talley, L. D., and McCartney, M. S.: An eastern Atlantic section from Iceland southward across the equator, Deep-Sea Res. Pt. A, 39, 1885–1917, https://doi.org/10.1016/0198-0149(92)90004-D, 1992.
van Aken, H. M.: The hydrography of the mid-latitude northeast Atlantic Ocean I: The deep water masses, Deep-Sea Res. Pt. I, 47, 757–788, 2000.
van Aken, H. M. and Becker, G.: Hydrography and through-flow in the northeastern North Atlantic Ocean: the NANSEN project, Prog. Oceanogr., 38, 297–346, https://doi.org/10.1016/S0079-6611(97)00005-0, 1996.
van Aken, H. M. and de Boer, C. J.: On the synoptic hydrography of intermediate and deep water masses in the Iceland Basin, Deep-Sea Res. Pt. I, 42, 165–189, 1995.
Varela, D. E., Pride, C. J., and Brzezinski, M. A.: Biological fractionation of silicon isotopes in Southern Ocean surface waters, Global Biogeochem. Cy., 18, GB1047, https://doi.org/10.1029/2003GB002140, 2004.
Varela, D. E., Brzezinski, M. A., Beucher, C. P., Jones, J. L., Giesbrecht, K. E., Lansard, B., and Mucci, A.: Heavy silicon isotopic composition of the silicic acid and biogenic silica in Arctic waters over the Beaufort shelf and the Canada Basin, Global Biogeochem. Cy., 30, 804–824, https://doi.org/10.1002/2015GB005277, 2016.
Wetzel, F., de Souza, G. F., and Reynolds, B. C.: What controls silicon isotope fractionation during dissolution of diatom opal?, Geochim. Cosmochim. Ac., 131, 128–137, 2014.
Wischmeyer, A. G., De La Rocha, C. L., Maier-Reimer, E., and Wolf-Gladrow, D. A.: Control mechanisms for the oceanic distribution of silicon isotopes, Global Biogeochem. Cy., 17, 1083, https://doi.org/10.1029/2002GB002022, 2003.
Yashayaev, I. and Dickson, R. R.: Transformation and fate of overflows in the Northern North Atlantic, in: Arctic-Subarctic Ocean Fluxes: Defining the Role of the Northern Seas in Climate, edited by: Dickson, R. R., Jens, M., and Rhines, P., Springer, Science + Business Media B.V., P.O. Box 17, AA Dordrecht, the Netherlands, 505–526, 2008.
Yashayaev, I., Lazier, J. R. N., and Clarke, R. A.: Temperature and salinity in the central Labrador Sea during the 1990s and in the context of the longer-term change, ICES Marine Science Symposia 219, 32–39, 2003.
Yashayaev, I., Bersch, M., and van Aken, H. M.: Spreading of the Labrador Sea Water to the Irminger and Iceland basins, Geophys. Res. Lett., 24, L10602, https://doi.org/10.1029/2006GL028999, 2007.