the Creative Commons Attribution 4.0 License.
the Creative Commons Attribution 4.0 License.
 | 29 Aug 2018
Carbonate system distribution, anthropogenic carbon and acidification in the western tropical South Pacific (OUTPACE 2015 transect)
Thibaut Wagener
Nicolas Metzl
Mathieu Caffin
Jonathan Fin
Sandra Helias Nunige
Dominique Lefevre
Claire Lo Monaco
Gilles Rougier
Thierry Moutin
The western tropical South Pacific was sampled along a longitudinal 4000 km transect (OUTPACE cruise, 18 February, 3 April 2015) for the measurement of carbonate parameters (total alkalinity and total inorganic carbon) between the Melanesian Archipelago (MA) and the western part of the South Pacific gyre (WGY). This paper reports this new dataset and derived properties: pH on the total scale (pHT) and the CaCO3 saturation state with respect to aragonite (Ωara). We also estimate anthropogenic carbon (CANT) distribution in the water column using the TrOCA method (Tracer combining Oxygen, inorganic Carbon and total Alkalinity). Along the OUTPACE transect a deeper penetration of CANT in the intermediate waters was observed in the MA, whereas highest CANT concentrations were detected in the subsurface waters of the WGY. By combining our OUTPACE dataset with data available in GLODAPv2 (1974–2009), temporal changes in oceanic inorganic carbon were evaluated. An increase of 1.3 to 1.6 µmol kg−1 a−1 for total inorganic carbon in the upper thermocline waters is estimated, whereas CANT increases by 1.1 to 1.2 µmol kg−1 a−1. In the MA intermediate waters (27 kg m−3 kg m−3) an increase of 0.4 µmol kg−1 a−1 CANT is detected. Our results suggest a clear progression of ocean acidification in the western tropical South Pacific with a decrease in the oceanic pHT of up to −0.0027 a−1 and a shoaling of the saturation depth for aragonite of up to 200 m since the pre-industrial period.
Please read the corrigendum first before continuing.
-
Notice on corrigendum
The requested paper has a corresponding corrigendum published. Please read the corrigendum first before downloading the article.
-
Article
(5199 KB)
-
The requested paper has a corresponding corrigendum published. Please read the corrigendum first before downloading the article.
- Article
(5199 KB) - Corrigendum
- BibTeX
- EndNote


Human activities inject about 10 petagrams of carbon per year into the atmosphere, which might have major consequences on climate. It is recognized that the ocean plays a key role in the control of atmospheric CO2 through uptake by the so-called “oceanic carbon pump”. Through this “pump”, the ocean sequesters ca. 25 % of the CO2 injected annually into the atmosphere by human activities (Le Quéré et al., 2018). A consequence of the ocean carbon uptake is a decrease in the oceanic pH (Feely et al., 2004), which is described as ocean acidification (the so-called “other” CO2 problem). Effects of ocean acidification have been observed in marine organisms and could affect the marine ecosystems (Riebesell et al., 2000). Improving our understanding of the oceanic CO2 uptake relies primarily on observations of the marine carbonate cycle. Studies on the oceanic carbonate cycle have been mostly conducted in the framework of international programs. The World Ocean Circulation Experiment (WOCE) and the Joint Global Flux Study (JGOFS) in the 1990s coordinated oceanographic cruises along large sections in the ocean to collect samples through the water column and to perform accurate measurements of carbonate parameters and ancillary parameters (temperature, salinity, dissolved oxygen, nutrients, etc.). Since 2000, efforts have been made to revisit oceanic sections according to the WOCE strategy in order to assess oceanic changes at the scale of a decade. These programs have generated important databases for oceanic carbonate chemistry (e.g., GLODAPv2, Olsen et al., 2016; Key et al., 2015).
In order to better assess the role of the ocean for the global carbon cycle, the concept of oceanic anthropogenic carbon (CANT) has been introduced and refers to the fraction of dissolved inorganic carbon (CT) in the ocean that originates from carbon injected into the atmosphere by human activities since the industrial revolution. As CANT is not a directly measurable quantity, it can only be estimated through assumptions that are subject to intense scientific debate (Sabine and Tanhua, 2010). In particular, it has been recently recognized that ocean circulation changes drive significant variability in carbon uptake (DeVries et al., 2017). Detecting, separating and attributing decadal changes in the carbonate system (CT and total alkalinity, AT), CANT and pH in the ocean at global or regional scales remains challenging.
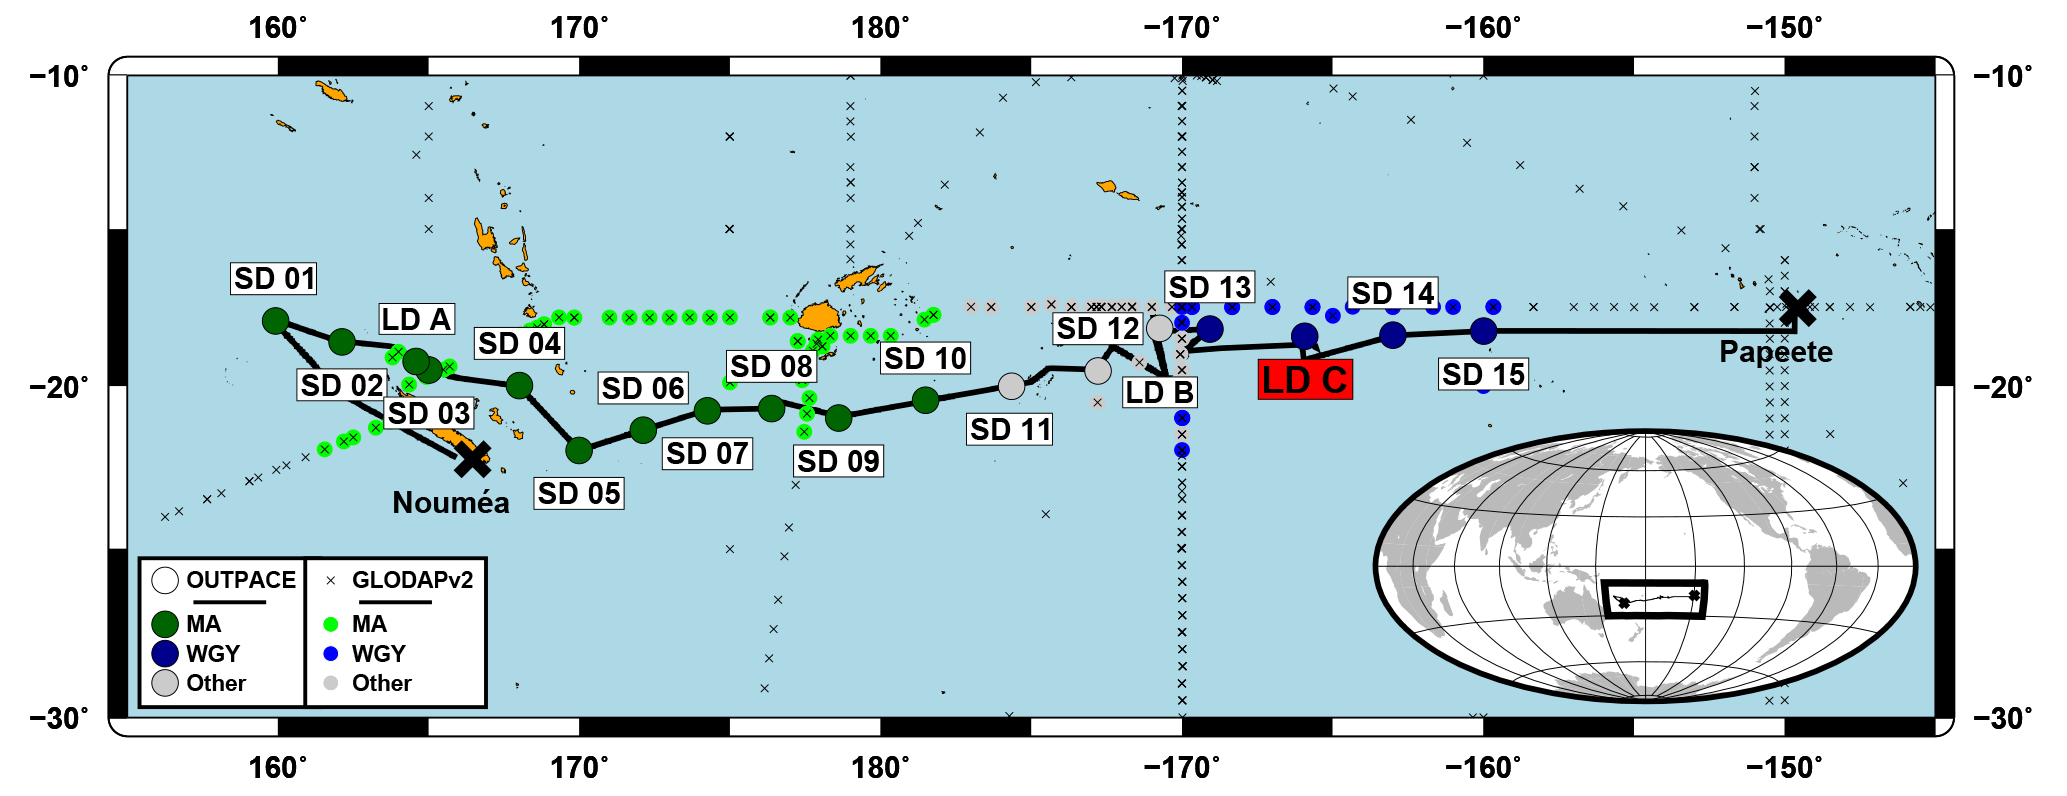
Figure 1Map of the OUTPACE cruise transect. Melanesian Archipelago (MA) stations are indicated by large dark green large dots and the western gyre (WGY) stations by large dark blue dots. Stations outside of these two areas are in gray. The station in red corresponds to the station where the deep cast and intercomparison cast were made. Stations from the GLODAPv2 database are indicated with small crosses: small green dots correspond to GLODAPv2 stations considered for comparison in the MA area; small blue dots correspond to GLODAPv2 stations considered for comparison in the WGY area and small gray dots are the other GLODAPv2 stations considered for comparison.
Within this context, the Pacific Ocean is a particularly challenging area to study due to its size (ca. one-third of the Earth's and one half of the oceanic surface). Even if, due to its remoteness from land, it remains largely underexplored by oceanographic vessels compared to other oceanic areas, the Pacific Ocean has been covered by cruises along long sections (the “P sections” from the WOCE program). Most of these sections have been revisited during the last years (e.g., Sabine et al., 2008; Kouketsu et al., 2013). In a recent study based on repeated sections in the Pacific (P16 at 150∘ W), Carter et al. (2017) observed a significant increase in CANT in the top 500 m around 10–30∘ S and a local carbon storage maximum around 20∘ S in recent years (between 2005 and 2014). In this context, the OUTPACE data presented in this study, associated with historical observations (since the pioneer 1974 GEOSECS, Geochemical Ocean Sections Program) offer a new view to evaluate variability and decadal changes in CT, CANT and pHT in the tropical Pacific, here focusing on the western tropical South Pacific (WTSP).
The aim of this paper is to report a new dataset of oceanic inorganic carbon (based on measurements of CT and AT) acquired in the WTSP during the OUTPACE (Oligotrophic to UltTra oligotrophic PACific Experiment) cruise performed in 2015 (Moutin et al., 2017). The main focus of the OUTPACE cruise was to study the complex interactions between planktonic organisms and the cycle of biogenic elements on different scales, motivated by the fact that the WTSP has been identified as a hot spot of N2 fixation (Bonnet et al., 2017). The data presented here have been partially used in another paper of this special issue (Moutin et al., 2018) in order to study the biological carbon pump in the upper (surface to 200 m) water column. In this paper we will explore the carbonate data between the surface and 2000 m depth. The OUTPACE transect (Fig. 1) is close to existing WOCE and GO-SHIP (Global Ocean Ship-based Hydrographic Investigations Program) lines in the South Pacific: it is parallel to the zonal P21 line (18∘ S visited in 1994 and 2009) and the P06 line (32∘ S visited in 1992, 2003 and 2010), it is crossed by the meridional P14 line (180∘ E visited in 1994 and 2007) and P15 line (170∘ W visited in 2001, 2009 and 2016), and it is situated at the eastern side of the P16 line (150∘ W visited in 1992, 2005 and 2014). However, the OUTPACE transect does not correspond to any earlier occupation of the “WOCE lines” in the South Pacific and no tracers of water mass age were measured during the cruise, which limits the possibilities of a robust analysis of CANT accumulation in the area. Moreover, the horizontal and vertical resolution of the OUTPACE dataset is low. In consequence, the OUTPACE dataset cannot be used to look at decadal changes in CANT content in the South Pacific (e.g., Carter et al., 2017; Kouketsu et al., 2013). Here, CANT estimates based on the TrOCA (Tracer combining Oxygen, inorganic Carbon and total Alkalinity) method will be used as as a tool to investigate changes in CT. Moreover, comparing our data with the high-quality data (internally consistent through a secondary quality control; Olsen et al., 2016) available in the Global Ocean Data analysis Project version 2 (GLODAPv2 database) will allow us to evaluate CT, AT, CANT (from TrOCA) and pHT trends in subsurface waters and at depth.
Table 1General description of the casts sampled for carbonate chemistry parameters during the OUTPACE cruise.
a SHAW stands for casts up to 200 dbar, INT stands for casts up to 2000 dbar, DEEP stands for the deep cast and REPRO stands for the cast with reproducibility measurements. b A CTD was rosette used for the cast. CLA is the normal CTD rosette, and TMC is the trace metal clean rosette (see Sect. 2.1).
The paper is organized as follows: after describing the methods used to acquire the dataset and the way the auxiliary data have been used in Sect. 2, we briefly present the hydrographic context of the cruise in Sect. 3. We then present in Sect. 4, the carbonate dataset acquired during the cruise. In Sect. 5, estimated CANT values in the water column are presented, the validity of these estimates based on the TrOCA method is discussed and geographical patterns are evoked. In Sect. 6, the temporal changes in oceanic inorganic carbon in the WTSP combining data available in GLODAPv2 and our OUTPACE dataset are presented and discussed. Finally, in Sect. 7, some features in relation to ocean acidification are inferred from our dataset.
2.1 Cruise and sampling strategy
The OUTPACE cruise took place between 18 February and 3 April 2015 from Nouméa (New Caledonia) to Papeete (French Polynesia), in the WTSP on board the French research vessel L'Atalante (Fig. 1). A total of 18 stations were sampled, mostly in the top 2000 m of the water column along a ∼4000 km transect from Melanesia to the South Pacific gyre (Moutin et al., 2017). A conductivity–temperature–depth (CTD) rosette was deployed to acquire data with CTD and associated sensors along vertical profiles and to collect discrete seawater samples from twenty-four 12 L Niskin bottles for chemical analysis. Due to technical failures on the main CTD rosette, for two of the casts considered in this study, a trace metal clean CTD rosette (TM-R) equipped with 24 teflon-lined GO-FLO bottles devoted to trace metal analyses was used. The configurations of both CTD rosettes are detailed elsewhere (Moutin et al., 2017).
For carbonate parameters, seawater was sampled from 37 casts over the 18 stations. At each station, on a regular basis, samples were collected at 12 depths between the surface and 2000 m on two distinct casts: six samples on a 0–200 m cast and six samples on a 0–2000 m cast. At station SD 13, only one cast was sampled down to 500 m depth. In addition, at station LD C, samples were collected at 24 depths on a deep cast (down to 5000 m) and 12 samples were collected at the same depth (25 m) on a “repeatability” cast. Details on the casts performed for this study are summarized in Table 1.
2.2 Chemical measurements on discrete samples
All samples were collected within less than 1 h after arrival of the CTD rosette on deck.
2.2.1 Total alkalinity and dissolved inorganic carbon
Samples for AT and CT were collected in one 500 mL borosilicate glass flask (Schott Duran®) and poisoned with HgCl2 immediately after collection (final concentration 20 mg L−1). Samples were stored at 4 ∘C during transport and were analyzed (within 10 days of each other) 5 months after the end of the cruise at the SNAPO-CO2 (Service National d'Analyse des paramètres Océaniques du CO2 – LOCEAN – Paris). AT and CT were measured on the same sample based on a potentiometric titration in a closed cell (Edmond, 1970). A nonlinear curve fitting approach was used to estimate AT and CT from the recorded titration data (Dickson, 1981; Dickson and Goyet, 1994). Measurements were calibrated with certified reference material (CRM) provided by Andrew Dickson, University of Southern California (batch 139 – CT: 2023.23±0.70 µmol kg−1 and AT: 2250.82±0.60 µmol kg−1; see Dickson, 2010). The reproducibility, expressed as the standard deviation of the CRM analysis (n=15), was 4.6 µmol kg−1 for AT and 4.7 µmol kg−1 for CT. Based on replicate measurements at station LD C (cast out_c_194; see Table 1), the reproducibility, expressed as the standard deviation of the analysis of the replicates collected at the same depth (ca. 25 m, n=12) from different Niskin bottles, was 3.6 µmol kg−1 for AT (average value:2324.7 µmol kg−1) and 3.7 µmol kg−1 for CT (average value:1969.7 µmol kg−1).
2.2.2 Oxygen concentration
Dissolved oxygen concentration [O2] was measured following the Winkler method (Winkler, 1888) with potentiometric endpoint detection (Oudot et al., 1988). For sampling, reagent preparation and analysis, the recommendations from Langdon (2010) were carefully followed. The thiosulfate solution was calibrated by titrating it against a potassium iodate certified standard solution of 0.0100 N (CSK standard solution – WAKO™). The reproducibility, expressed as the standard deviation of replicates samples was 0.8 µmol kg−1 (n=15; average value:195.4 µmol kg−1).
2.3 Vertical profiles of hydrological and biogeochemical parameters
2.3.1 CTD measurements
CTD measurements were ensured by a Seabird™ 911+ underwater unit, which interfaced an internal pressure sensor, two redundant external temperature probes (SBE3plus) and two redundant external conductivity cells (SBE4C). The sensors were calibrated pre- and post-cruise by the manufacturer. No significant drift between the redundant sensors was observed. For vertical profiles, full-resolution data (24 Hz) were reduced to 1 dbar binned vertical profiles on the downcast with a suite of processing modules using the Seabird™ dedicated software (SbeDataProcessing). For values at the closure of the Niskin bottles, values collected at 24 Hz were averaged 3 s before and 5 s after closure of the bottle. In this study, for temperature and conductivity the signal of the first sensors has been used systematically. For the two TM-R casts, no significant difference with the main CTD rosette on temperature and conductivity was observed.
2.3.2 Oxygen measurements
[O2] was also measured with a SBE43 electrochemical sensor interfaced with the CTD unit. The raw voltage was converted to oxygen concentration with 13 calibration coefficients based on the Seabird™ methodology derived from Owens and Millard (1985). Three of these coefficients (the oxygen signal slope, the voltage at zero oxygen signal, the pressure correction factor) were adjusted with the concentrations estimated with the Winkler method on samples collected at the closure of the bottles. One unique set of calibration coefficients has been applied to all oxygen profiles from the cruise because no significant drift of the sensor was observed during the time of the cruise. For the two TM-R casts, values have been corrected with a drift and offset based on the comparison of 15 pairs of casts (main CTD rosette/TM-R) collected close in time (less than 2 h) and space (less than 1 nautical mile) over the entire OUTPACE transect.
2.4 Derived parameters
Practical salinity (SP) was derived from conductivity, temperature and pressure with the EPS-78 algorithm. Absolute salinity (SA), potential temperature (θ), conservative temperature (Θ) and potential density (σθ) were derived from SP, temperature, pressure and the geographic position with the TEOS-10 algorithms (Valladares et al., 2011). These five derived parameters were calculated within the processing with Seabird™ dedicated software.
Seawater pH on the total scale (pHT) and the CaCO3 saturation state with respect to aragonite (Ωara) were derived from AT and CT with the “Seacarb” R package (Gattuso and Lavigne, 2009). CaCO3 saturation state with respect to calcite was not considered because seawater up to 2000 dbar was supersaturated with respect to calcite (Ωcal>1). Following the recommendations from Dickson et al. (2007), the constants for carbonic acid K1 and K2 from Lueker et al. (2000), the constant for hydrogen fluoride KF from Pérez and Fraga (1987), and the constant for hydrogen sulfate KS from Dickson (1990) were used. Orthophosphate and silicate concentration were considered in the calculation. Methods for nutrient measurement are presented in detail in Fumenia et al. (2018). When nutrient data were not available (station SD 8), silicate and orthophosphate were estimated from the nutrient profile measured on cast out_c_163 (interpolated values). Apparent oxygen utilization (AOU) was computed from the difference between oxygen solubility (at p=0 dbar, and SP) estimated with the “Benson and Krause coefficients” in Garcia and Gordon (1992) and in situ [O2].
For the estimation of CANT, the TrOCA method was used. The TrOCA approach was first proposed in Touratier and Goyet (2004a, b) with improvements in Touratier et al. (2007). In brief, the TrOCA parameter is defined as a combination of AT, CT and [O2] that accounts for biologically induced relative changes among these parameters (with constant stoichiometric ratios). TrOCA is thus a quasi-conservative tracer derived from CT in the ocean. Within a defined water mass, changes in TrOCA over time are independent of biology and can be attributed to the penetration of CANT. In consequence CANT can be calculated in a parcel of water from the difference between current and pre-industrial TrOCA (TrOCA∘) divided by a stoichiometric coefficient. The simplicity of the TrOCA method relies on the fact that a simple formulation for TROCA∘ has been proposed based on potential temperature and alkalinity and thus an estimation of CANT can be done by a simple calculation using CT, AT, [O2] and θ. In this study, the formulation proposed in Eq. (11) in Touratier et al. (2007) is used to calculate CANT and is recalled here in Eq. (1).
This formulation is based on an adjustment of the TrOCA coefficients using Δ14C and CFC-11 from the GLODAPv1 database (Key et al., 2004). Touratier et al. (2007) estimated the overall uncertainty of the CANT with TrOCA method to be ca. 6 µmol kg−1 based on the random propagation of the uncertainties in the variables (CT, AT, [O2] and θ) and coefficients used in Eq. (1). The limitations and validity of the TrOCA method will be discussed in detail in Sect. 5.
2.5 Data from available databases
For comparison with existing values of carbonate chemistry in the area of the OUTPACE cruise, relevant data were extracted from GLODAPv2 database (NDP-93 – Olsen et al., 2016; Key et al., 2015). The specific data file for the Pacific Ocean was used (downloaded from https://www.nodc.noaa.gov/ocads/oceans/GLODAPv2/, last access: 14 December 2017). For comparison with OUTPACE data, GLODAPv2 data were selected between 22 and 17∘ S and between 159∘ E and 159∘ W (going westwards). For specific comparisons in the MA and the South Pacific western gyre waters (WGY) a zonal subset of the extracted data was used: 159∘ E and 178∘ W for MA and 170 to 159∘ W for WGY (see Fig. 1).
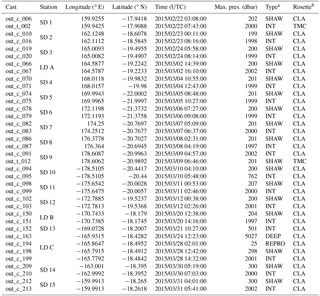
The hydrological context encountered during the OUTPACE transect is presented with a Θ−SA diagram between 0 and 2000 dbar in Fig. 2. A detailed description of the water masses encountered during the OUTPACE cruise can be found in Fumenia et al. (2018). Briefly, from the surface to 2000 dbar, the following features are distinguished: the surface waters (σθ<23.5 kg m−3) were characterized by temperatures over 25 ∘C with increasing temperature and salinity towards the east and AOU close to zero. Under the surface water, the upper thermocline waters (UTW) presented a maximum in salinity, reaching values higher than 36 g kg−1 in the eastern part of the cruise. In the lower thermocline waters, SA decreased with depth with a more pronounced decrease in the eastern part than in the western part, whereas AOU is higher in the eastern part than in the western part of the studied area. These differences in lower thermocline waters have been described for South Pacific Central Waters (SPCW) with more saline western (WSPCW) and less saline eastern (ESPCW) waters (Tomczak and Godfrey, 2003). Below the thermocline, intermediate waters are made up of Subantarctic Mode Waters (SAMW) and Antarctic Intermediate Waters (AAIWs). AAIWs have a salinity minimum close to the σθ=27 kg m−3 isopycnal. Hartin et al. (2011) defines SAMW as having σθ values between 26.80 and 27.06 kg m−3, corresponding to a minimum in potential vorticity, and AAIW as having σθ values between 27.06 and 27.40 kg m−3. The separation of both waters is not trivial in the subtropical area. SAMW is generally associated with lower AOU than AAIW. Finally, deep waters made up of Upper Circumpolar Deep Waters (UCDW) correspond to an increase in salinity and AOU for depth corresponding to σθ>27.4 kg m−3.
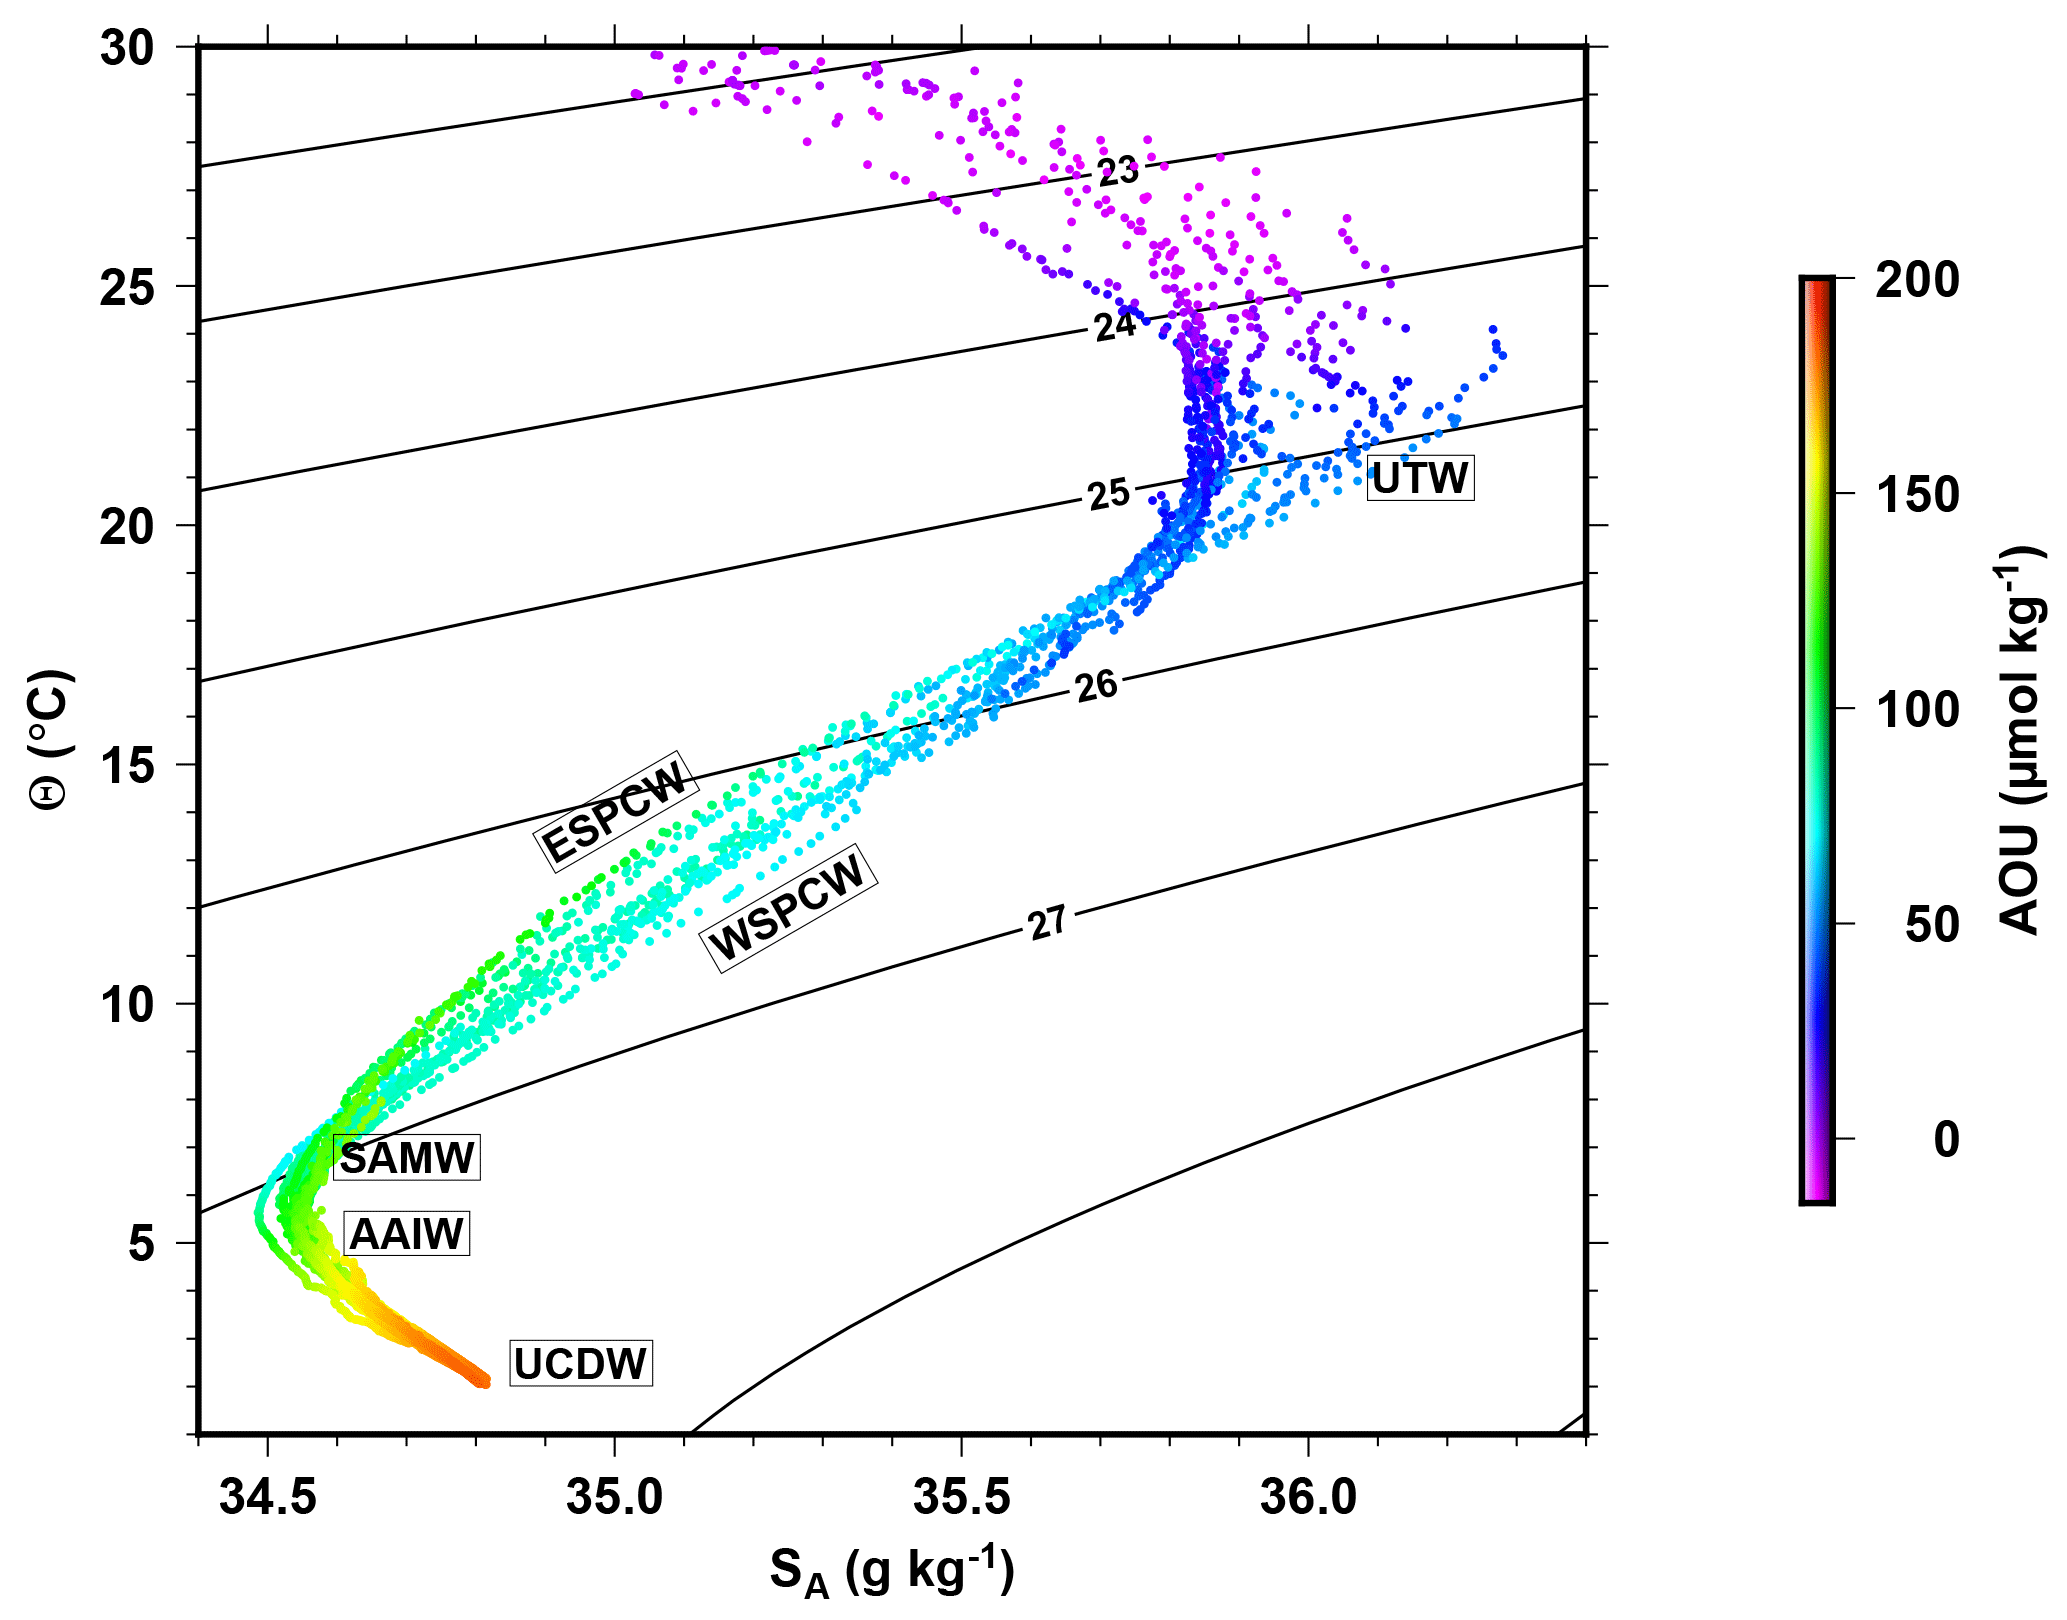
Figure 2Θ−SA diagram with colors indicating the AOU. Black contour lines represent the isopycnal horizons based on potential density referenced to a pressure of 0 dbar (σθ).
Figure 3Longitudinal variations in (a) AT, (b) CT, (c) pHT and (d) Ωara along the OUTPACE transect between the surface and 2000 dbar depth. Black contour lines represent the isopycnal horizons based on potential density referenced to a pressure of 0 dbar. Vertical profiles of (e) AT, (f) AT n35 and (g) CT of the entire OUTPACE dataset (red dots) superimposed on the GLODAPv2 data corresponding to the OUTPACE area (gray dots).
In this study, discussion will sometimes make a distinction between two subregions along the OUTPACE transect: MA and WGY (see Sect. 2.5 for definition). This distinction is mainly based on geographic and oceanographic arguments. Indeed, these two subregions are geographically separated by the Tonga volcanic arc. WGY is characterized by higher surface temperature and a higher salinity in the upper thermocline waters than MA. The difference between these subregions is evidenced by the difference in oligotrophy (Moutin et al., 2018). Due to specific conditions in the transition area between the MA and WGY (de Verneil et al., 2017), SD 11, SD 12 and LD B were discarded from both groups in this study following the arguments in Moutin et al. (2018).
AT and CT measured along the OUTPACE transect are presented in Fig. 3a and b. All vertical profiles for AT, AT normalized to SA=35 g kg−1 (AT n35) and CT are presented in Fig. 3e, f and g. AT ranged between 2300 and 2400 µmol kg−1. Below the surface, a pronounced maximum in AT was observed associated with the saltier upper thermocline waters. When normalized to SA=35 g kg−1, AT n35 values are remarkably constant in the upper 500 dbar with values between 2270 and 2310 µmol kg−1. Below 500 dbar, AT increases with depth up to ca. 2400 µmol kg−1 indicating that alkalinity changes are mostly due to salinity changes in the upper water column, whereas the increase in the deep waters is mainly due to carbonate biomineral remineralization. CT values are close to 1950 µmol kg−1 in the surface and increase with depth up to 2300 µmol kg−1 at 2000 dbar. The CT gradient in the upper water column has been described in Moutin et al. (2018). Below 2000 dbar, CT is relatively invariant with slightly lower values in the bottom waters (below 4000 dbar) due to the presence of very old deep waters originating from the North Pacific relative to the northward moving bottom waters that have not accumulated as much carbon (Murata et al., 2007). AT and CT values in deep waters measured during OUTPACE are in good agreement with the data of the GLODAPv2 database (Fig. 3e, f and g). No systematic adjustment of the OUTPACE dataset with the GLODAPv2 dataset was performed because only very few data are available in the deep ocean where crossover comparison can be performed for cruises carried out in different decades. Nevertheless, for the only “deep” cast performed during OUTPACE (out_c_163 at station LD C), we performed a simple crossover analysis with the station 189 (located at 107 km kilometers from OUTPACE station LD C) of the Japanese “P21 revisited” cruise in 2009. We compared interpolated profiles on density surfaces values (27.75 kg m−3 kg m−1 corresponding to pressure levels of ca. 3000 to 5500 dbar). The estimated offsets are µmol kg−1 for AT and µmol kg−1 for CT suggesting measurement biases are likely no larger. This simple quality control procedure seems to indicate that no systematic adjustment is needed.
Derived parameters from the AT and CT measurements are presented in Fig. 3c for pHT values (estimated at in situ temperature and pressure). pHT decreases from values close to 8.06 in surface to values close to 7.84 at 2000 m. Surface values of pHT are typical of subtropical warm waters and are in a similar range as the austral summer values estimated by Takahashi et al. (2014) in this area (8.06–8.08). Figure 3d represents the vertical distribution of computed values of Ωara along the OUTPACE transect. Seawater is supersaturated with respect to aragonite (Ωara>1) at the surface with Ωara values of ca. 4.0 again in good agreement with the austral summer values of 4–4.4 estimated by Takahashi et al. (2014) in this area. Values of Ωara decrease with depth, and seawater becomes undersaturated with respect to aragonite (Ωara<1) at an horizon situated below 1000 dbar in the west and above 1000 dbar in the eastern part of the cruise, with a general shoaling of the Ωara values from west to east, in good agreement with a previous study by Murata et al. (2015) in this area.
The TrOCA method is a way to quantify CANT in the ocean based on CT, AT, [O2] and θ. This method has been used and compared to other methods in different oceanic areas (e.g., Lo Monaco et al., 2005; Álvarez et al., 2009; Vázquez-Rodríguez et al., 2009). Based on specific CANT inventories in the water column, the TrOCA method reasonably agreed with the other methods (including the transient tracer-based method). However, Yool et al. (2010) “tested” the TrOCA method within an ocean general circulation model and argued that the use of globally uniform parameterization for the estimation of the pre-industrial TrOCA is a source of significant overestimation but also that even with regionally “tuned” parameters a global positive bias in the method exists. As no tracers of water mass age were measured during the OUTPACE cruise, the main motivation for using the TrOCA method was to make CANT estimations based on a simple calculation from parameters acquired within the cruise as done in other cruises conducted in tropical South Pacific waters (e.g., Azouzi et al., 2009; Ganachaud et al., 2017). Even if CANT estimates from TrOCA are biased, the application of a simple back-calculation method that accounts for biologically induced relative changes in CT is used here to identify some spatial features in the distribution of the carbonate system along the OUTPACE transect. Here, an error in the TrOCA CANT estimates of 67 % will be considered based on the standard deviation for the TrOCA variant optimized with world ocean data and normalized such that standard deviation in the simulated CANT in the ocean general circulation model is exactly 1 (see Table 2 in Yool et al., 2010).
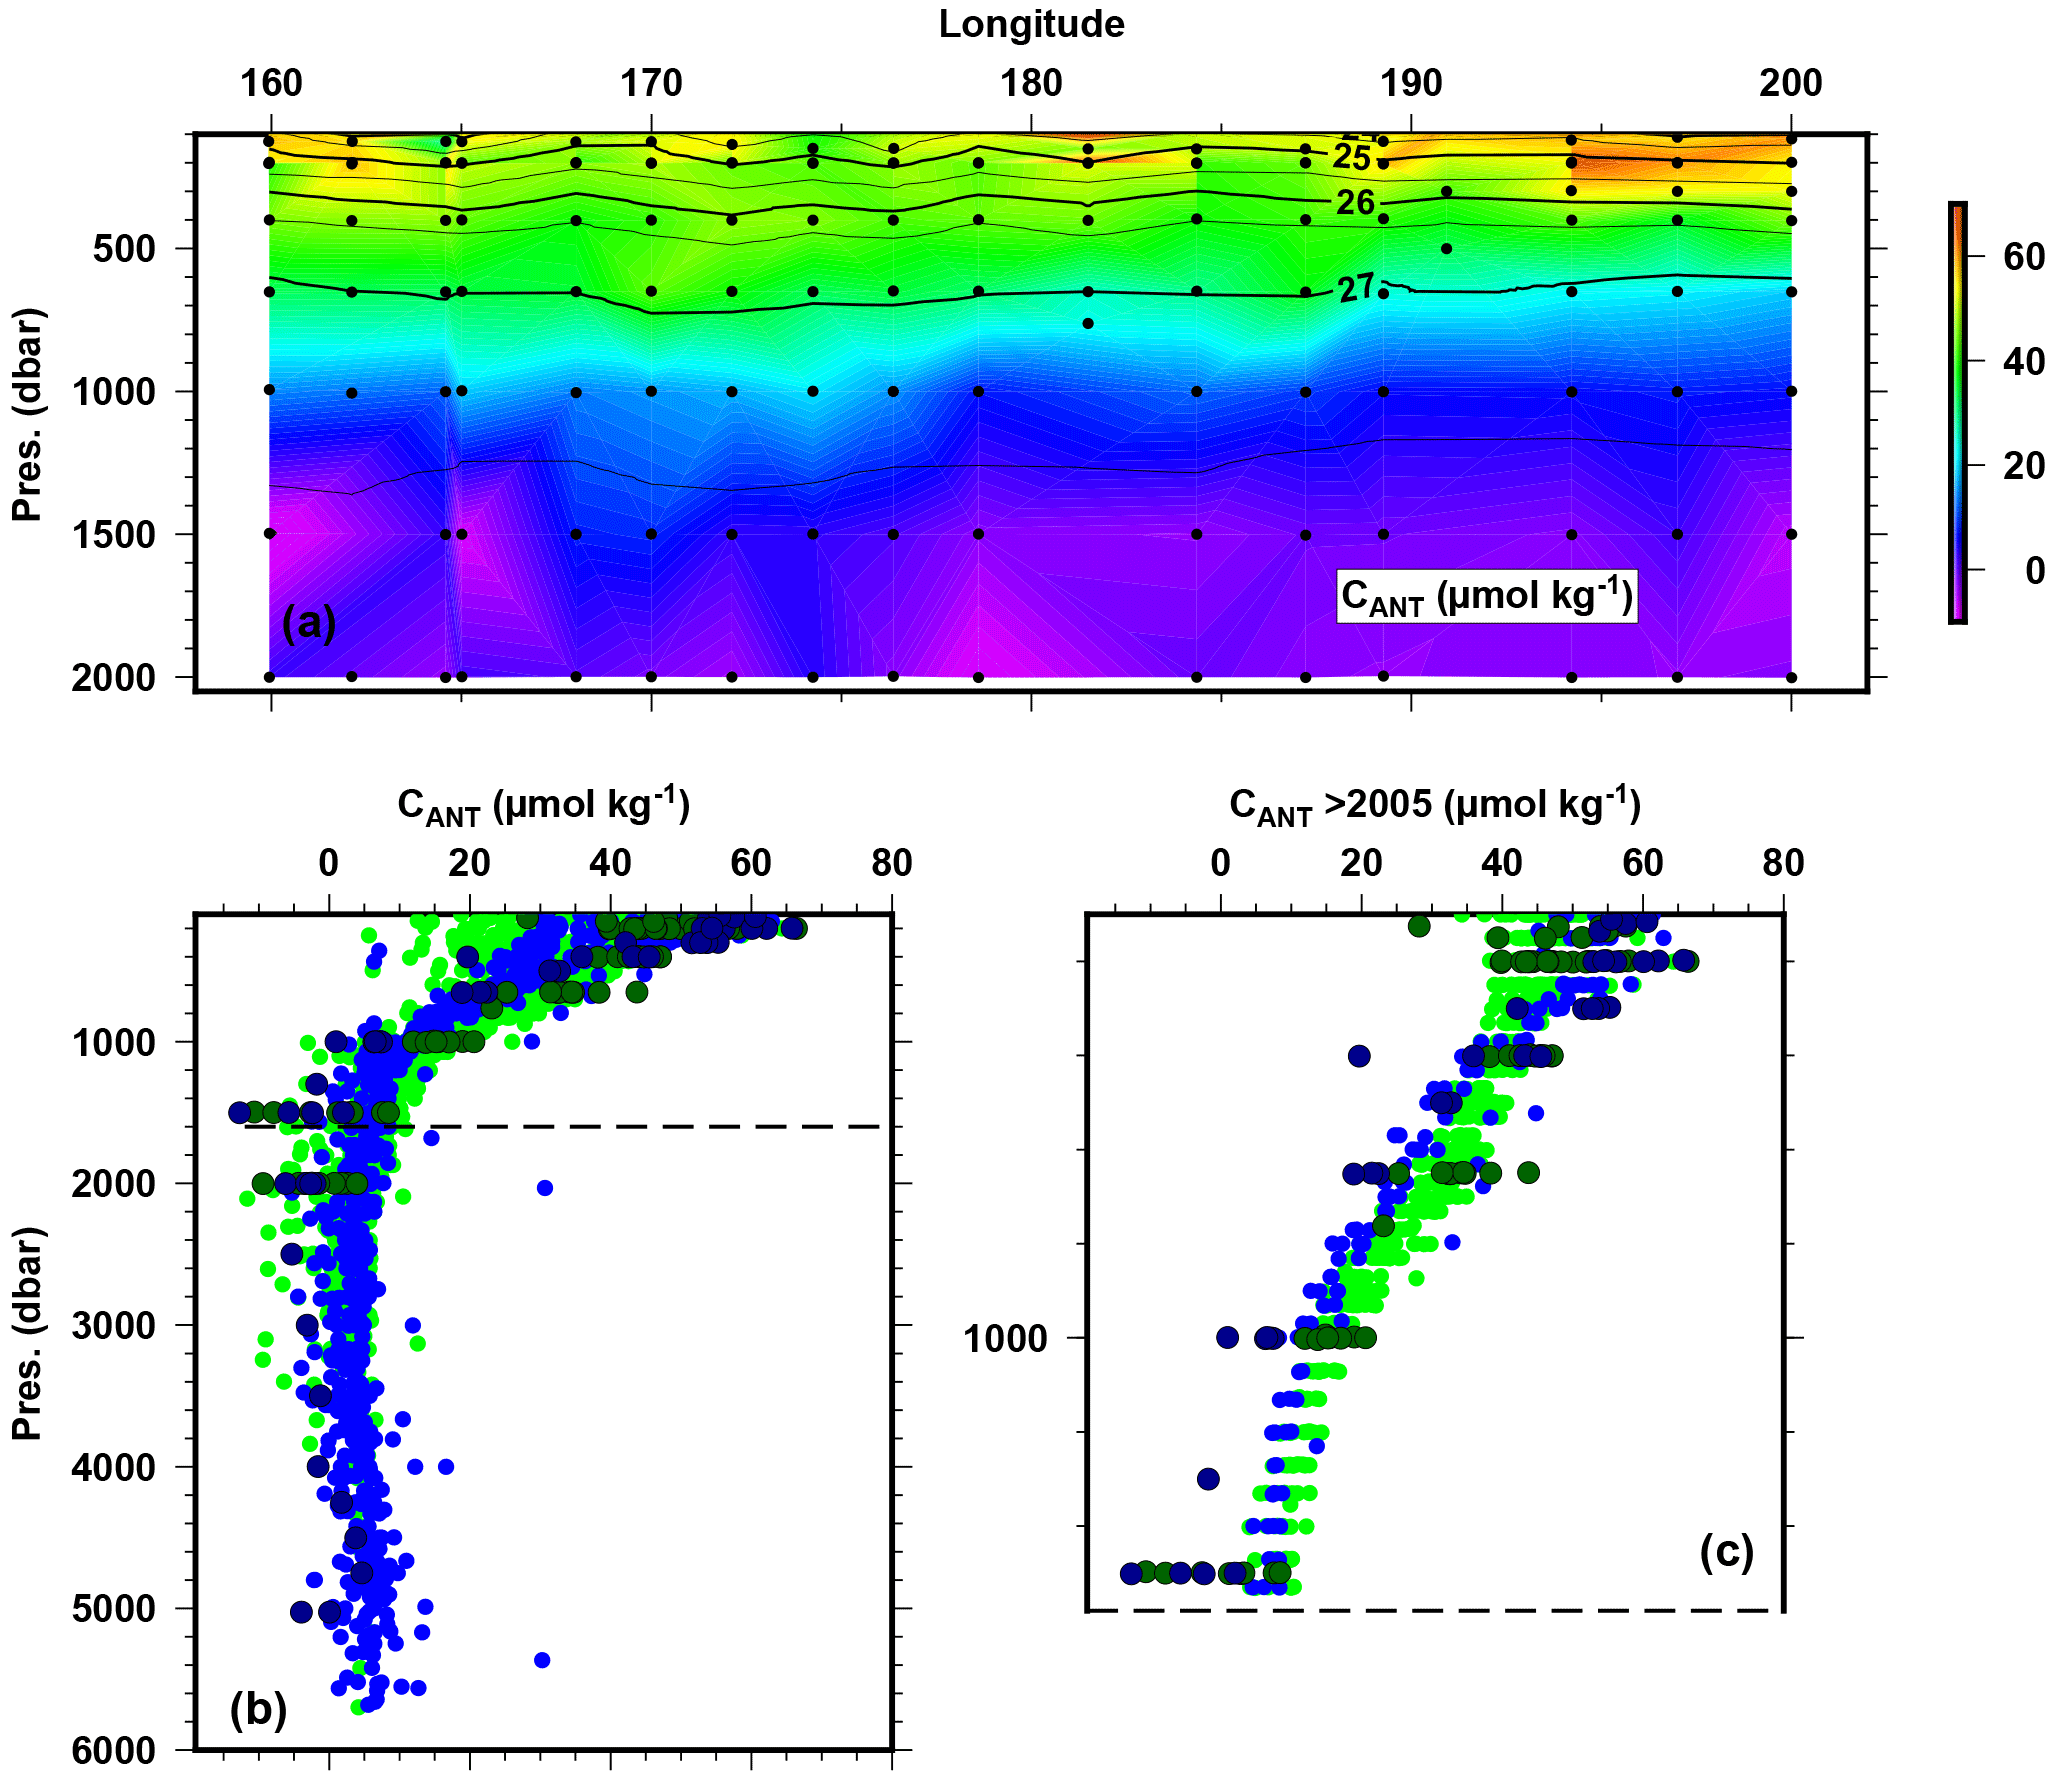
Figure 4Longitudinal variations in CANT (estimated with the TrOCA method) along the OUTPACE transect between 100 and 2000 dbar depth (a). Black contour lines represents the isopycnal horizons based on potential density referenced to a pressure of 0 dbar. Vertical profiles of CANT for the entire OUTPACE dataset superimposed on the values estimated from the GLODAPv2 data (b) and vertical profiles of CANT between 100 and 1500 dbar superimposed on the values estimated from the recent (after 2005) GLODAPv2 data (c). The color code for the dots is the same as for Fig. 1.
As mentioned by Touratier et al. (2007), CANT estimates cannot be considered within the mixed layer because the underlying hypotheses used in the formulation of TrOCA may not be verified due to biological activity and gas transfers across the air–sea interface. To avoid this issue, CANT estimates are generally used below the “permanent” mixed layer depth (e.g., Álvarez et al., 2009; Carter et al., 2017). For the OUTPACE area, Moutin et al. (2018) show that the mixed layer depth does not exceed 70 m in the area. Even if the depths of the deep chlorophyll maximum were encountered below 100 dbar along the transect, we will consider CANT values up to 100 dbar. It can be mentioned that the CANT values of 50–60 µmol kg−1 in the top of the water column (100 dbar) are in reasonable agreement with a rough estimate of thermodynamically consistent CT changes: by assuming that CO2 in surface seawater is in equilibrium with the atmosphere, we estimated that with a partial pressure of CO2 (pCO2) of 280 µatm in the pre-industrial period, a pCO2 of 380 µatm during OUTPACE (Moutin et al., 2018) and a constant AT over time of 2300 µmol kg−1, CT change in surface waters between the pre-industrial period and 2015 is ca. 65 µmol kg−1 for a temperature of surface waters between 25 and 28 ∘C. For OUTPACE, CANT estimates below 1000 dbar were not significantly different from 0 µmol kg−1, with a standard deviation of 6.3 µmol kg−1.
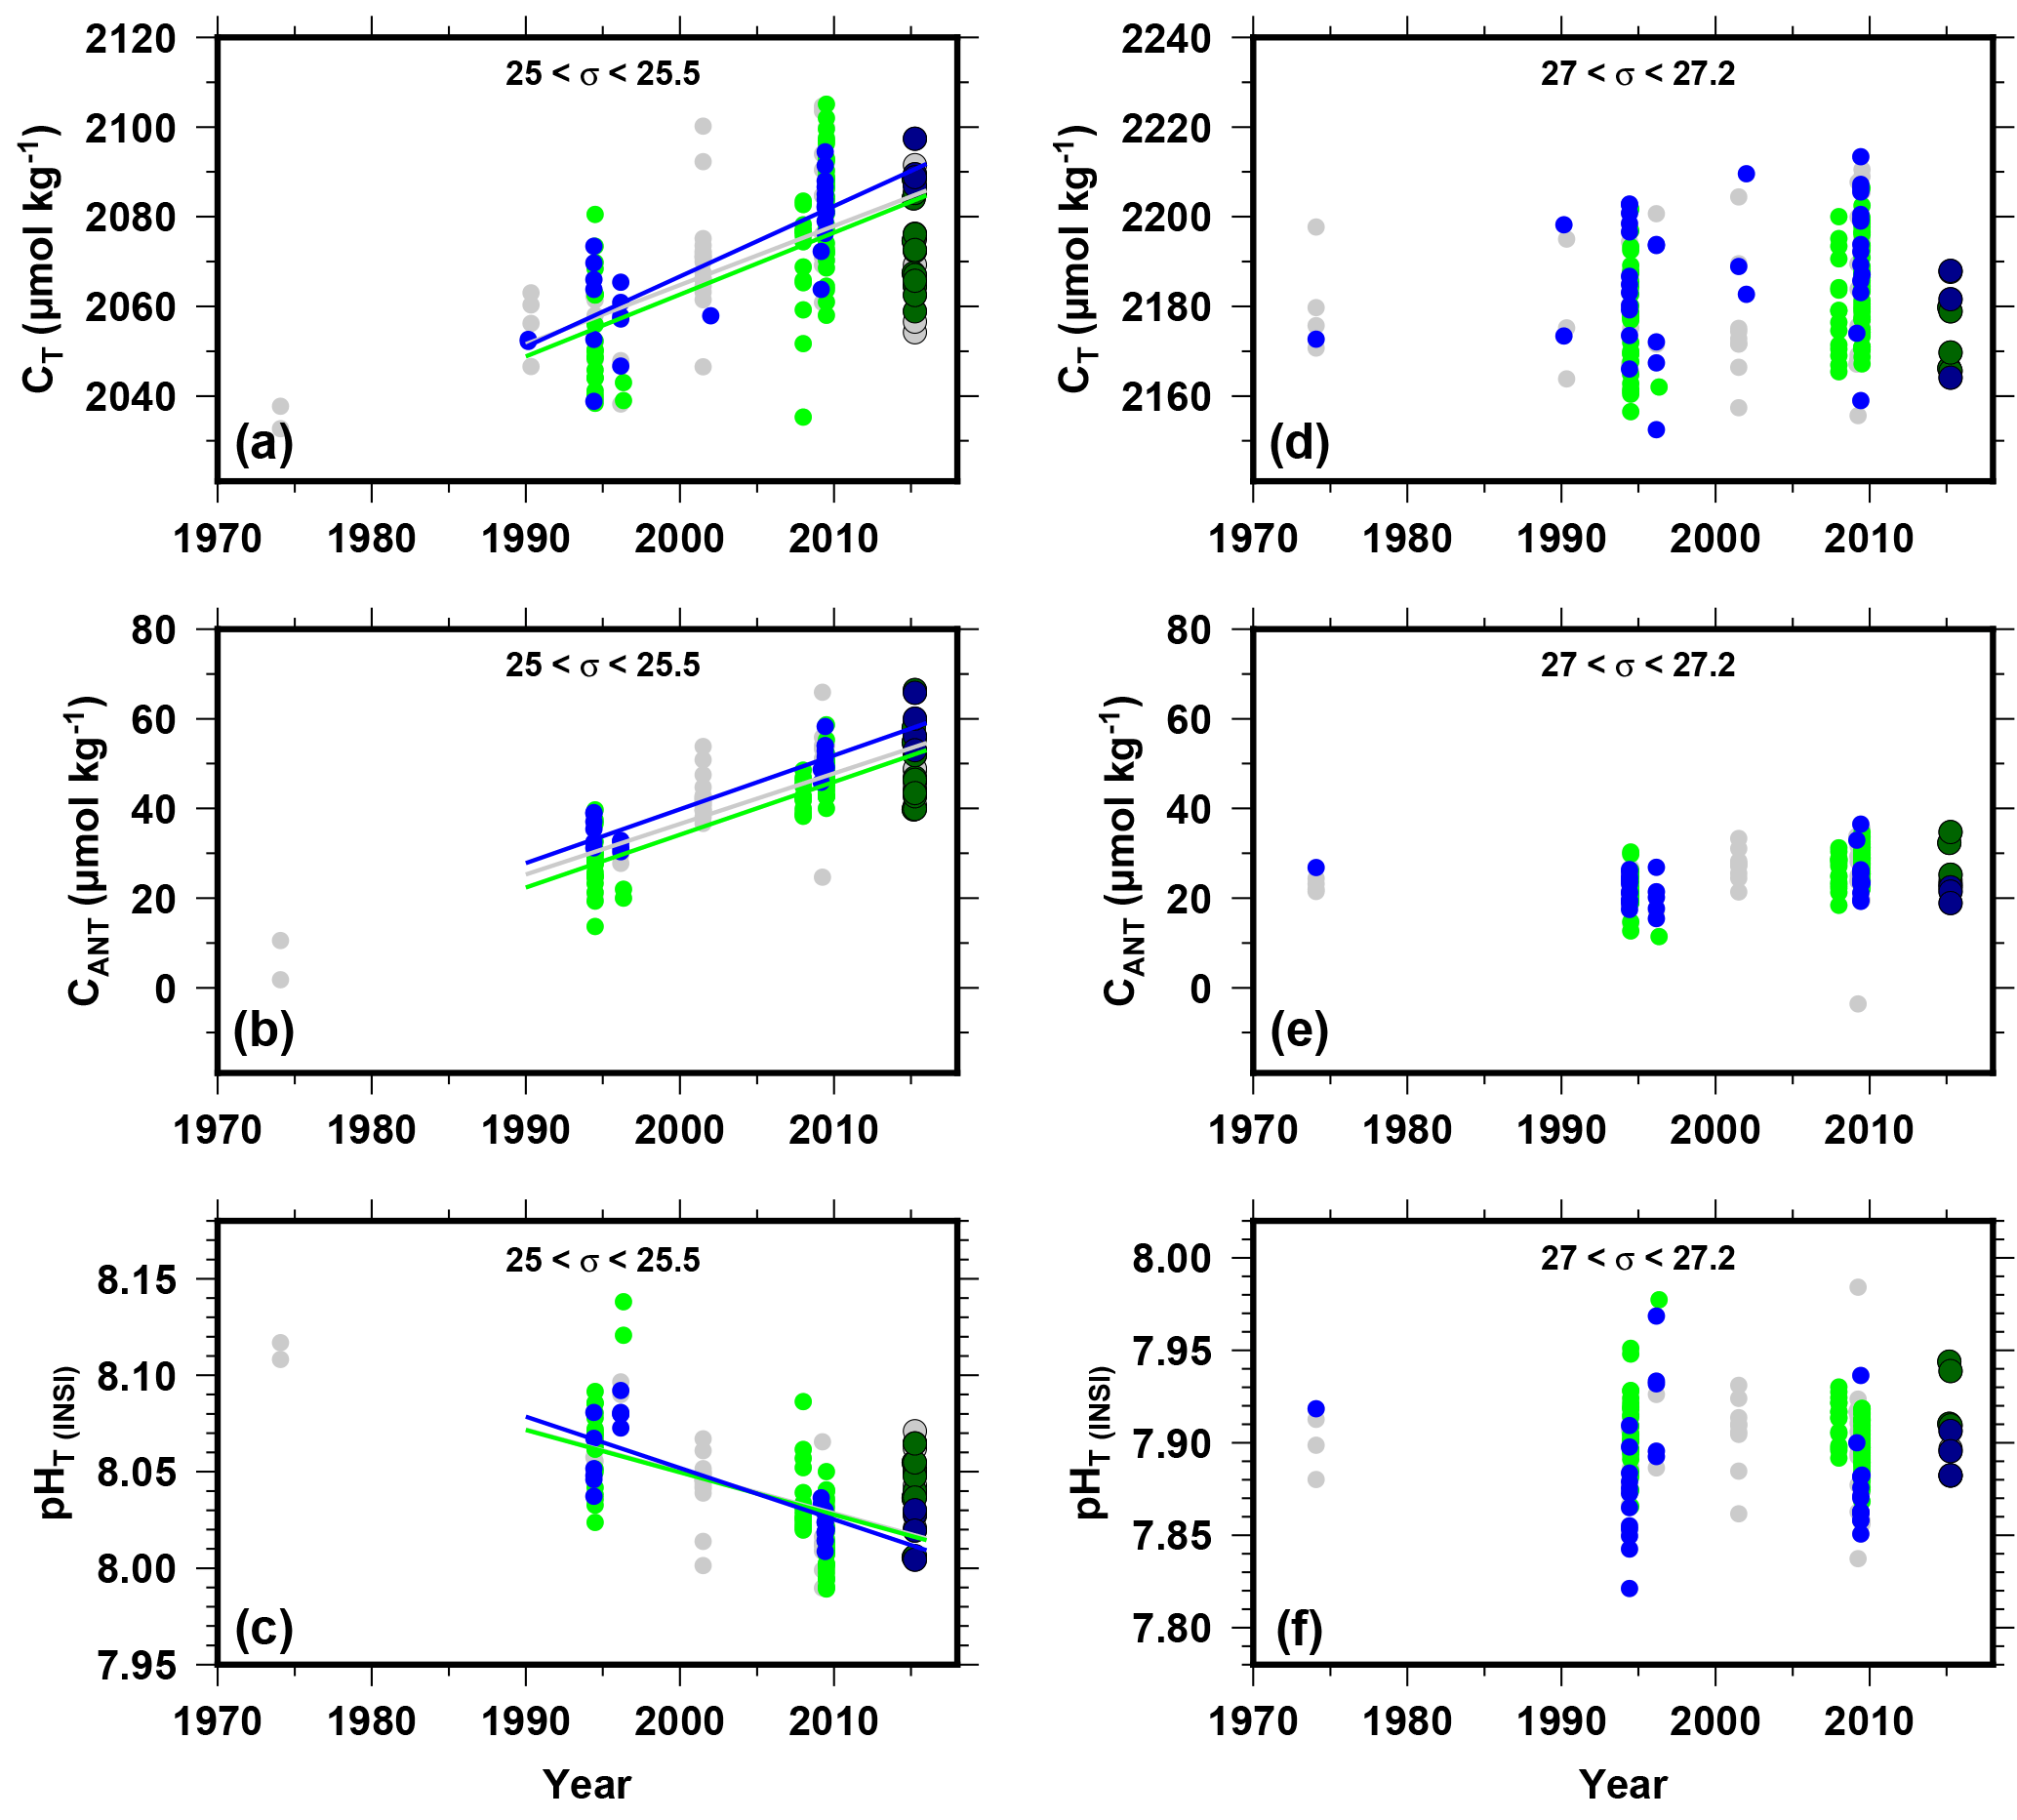
Figure 5Temporal evolution in the OUTPACE area of CT (a, d), CANT (b, e) and pHTinsi (c, f) based on GLODAPv2 and OUTPACE data along two isopycnal layers: 25–25.5 kg m−3 (a, b, c) and 27–27.2 kg m−3 (d, e, f). The color code for the dots is the same as for Fig. 1.
CANT distribution along the OUTPACE transect is presented in Fig. 4a, and all vertical profiles for CANT are presented in Fig. 4b with a more detailed view of the first 1500 dbar of the water column in Fig. 4c. Figure 4b and c distinguish values from the MA and the WGY area. The CANT vertical profiles suggest a penetration of anthropogenic carbon up to 1000 dbar. As mentioned before, estimated values of CANT reach values of 60±40 µmol kg−1 at a depth of 100 dbar; CANT then regularly decreases to values close to 10–20±13 µmol kg−1 at a depth of 1000 dbar and reaches values close to 0 µmol kg−1 below 1500 dbar. The zonal CANT section along the OUTPACE transect (Fig. 4a) presents two features: (1) a deeper penetration of CANT in the western part of the transect with values of CANT reaching 40±25 µmol kg−1 around the isopycnal layer of 27 kg m−3 (ca. 700 dbar) with a coherent behavior with the distribution of AOU and (2) a larger accumulation of CANT in the eastern part of the transect centered around the isopycnal layer of 25 kg m−3 (ca. 200 dbar).
Several studies have identified deeper CANT penetration in the western South Pacific than in the eastern South Pacific at tropical and subtropical latitudes. The primary reason for this longitudinal difference might be associated with deeper convection in the western part and upwelling in the eastern part. AAIW has been described as the lower limit of the penetration of CANT in the ocean interior of the South Pacific (Sabine et al., 2004). Moreover, a recent study by DeVries et al. (2017) shows that ocean circulation variability is the primary driver for changes in oceanic CO2 uptake at decadal scales. Based on CT changes between the two repeated visits of the longitudinal P21 line (18∘ S close to the OUTPACE transect) in 1994 and 2009, Kouketsu et al. (2013) show a faster increase in CANT in the western part than in the eastern part of the section. They also postulate that CANT may have been transported by deep circulation associated with the AAIW. In the subtropical Pacific along the P06 line (longitudinal section at ca. 32∘ S), Murata et al. (2007) also identified an increase in CANT in the SAMW and AAIW. Waters et al. (2011) attribute the deeper penetration of CANT in the western part of the section to the local formation of subtropical mode water in the area based on the extended multiple linear regression (eMLR) method along the P06 line (and taking into account a third visit).
Table 2Estimated trends on AT, [O2], CT , CANT and pHT changes in two different layers of the water column defined by isopycnal layers between 1980 and 2015 based on GLODAPv2 with (column WITH) and without (column WITHOUT) OUTPACE data added. Estimated trends are obtained from slope values of a linear regression between the studied parameters and time.
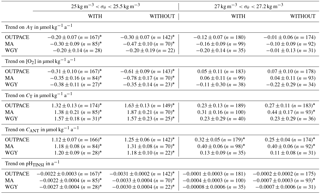
∗ Trend significant (p level<0.05).
In the eastern part of the OUTPACE cruise, the detected accumulation of CANT in the upper thermocline waters may be related to recent observations of a significant accumulation of CANT at latitudes around 20∘ S on the P16 meridional transect along 150∘ W by Carter et al. (2017). This change in CANT accumulation is attributed to changes in the degree of the water mass ventilation due to variability in a southern Pacific subtropical cell. Along the P16 line, Carter et al. (2017) observed high values of CANT (up to 60 µmol kg−1) for the upper water column at the latitude of the OUTPACE area in good agreement with our estimates in WGY in the upper water column. Finally, it should also be mentioned that, due to the presence of one of the main oxygen minimum zone (OMZ) area, denitrification occurs in the eastern South Pacific and can be traced by the N* parameter (Gruber and Sarmiento, 1997). Denitrification, by transforming organic carbon to inorganic carbon without the consumption of oxygen, could induce an overestimation of CANT by the TrOCA method (and other back-calculation methods) due to a biological release of CT that is not taken into account in the formulation of the quasi-conservative TrOCA tracer. Horizontal advection by the south equatorial current of the strong negative N* signal originating from the eastern Pacific towards the western Pacific has been described previously (Yoshikawa et al., 2015). Fumenia et al. (2018) have estimated N* along the OUTPACE transect and show slightly negative N* values in the upper thermocline waters at the eastern side of the OUTPACE transect where the highest CANT values are estimated. However, Murata et al. (2015) showed that, based on a direct relation between CT and N*, the influence of denitrification should be negligible on CANT estimations in this area. Therefore, the N* correction has not been introduced in the CANT estimates and the effect of denitrification was not quantified here.
Based on the available GLODAPv2 data, temporal changes in the OUTPACE area have been assessed (Fig. 5 and Table 2). The variation in oceanic parameters with time is estimated on two isopycnal layers: a layer with 25 kg m kg m−3 (hereafter named σθ 25) and a layer with 27 kg m kg m−3 (hereafter named σθ27). These two layers correspond to the features in CANT discussed in the previous section. σθ25 can be considered characteristic of the upper thermocline waters (core of the salinity maximum, Fig. 2), whereas σθ27 can be considered characteristic of intermediate waters of southern origin (core of the salinity minimum). All the values associated with these two layers are spread between 145 and 301 dbar for σθ25 and between 571 and 896 dbar for σθ27. It must be mentioned that the study of temporal changes is based on a large sampling grid, which covers the entire OUTPACE transect (see Sect. 2.5 and Fig. 1). This could add a spatial variability that may interfere in the estimation of temporal changes.
Table 3Estimated depth of the Ωara=1 horizon along the OUTPACE cruise (see text for details). No values are available for stations where data up to 2000 dbar were not available (SD2 and SD13). No values were estimated for stations with µmol kg−1.
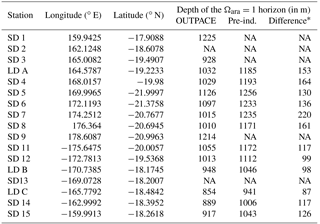
∗ Difference (in m) between the depth of the Ωara=1 horizon at the pre-industrial period and the OUTPACE cruise. NA – not available.
Temporal variations in CT and CANT between 1970 and 2015 are presented in Fig. 5. As mentioned earlier, even if CANT estimates from TrOCA are biased, a previous study by Pérez et al. (2010) suggests that the TrOCA method gives similar values to other methods for estimating CANT accumulation rates. A linear fit was applied to the observed temporal variations for AT, [O2], CT and CANT to check for significant trends on data collected between 1980 and 2015. The results of the performed regression analyses are presented in Table 2. Trends are evaluated with and without the data of the OUTPACE cruise in order to estimate the influence of this new dataset on the observed trends. Trends are evaluated for the entire OUTPACE area and for the MA and the WGY area. Even if presented in Fig. 5, data collected before 1980 from the GLODAPv2 database are disregarded in the estimation of the temporal trends. Indeed, for the OUTPACE area, data prior to 1980 originate from one single GEOSEC cruise in 1974, with only one measured point for σθ27 at WGY and no points at σθ25 for WGY and MA.
At σθ25, a significant decrease in AT of µmol kg−1 a−1 is observed over the entire OUTPACE area. A decrease of µmol kg−1 a−1 is also observed in the MA area, whereas no significant trend is observed for the WGY area. However, when AT is normalized to salinity, no significant trends are observed in AT n35 suggesting that the observed trend in AT can be attributed to salinity changes rather than changes in calcification. Significant negative trends are observed for [O2] over the entire area ( µmol kg−1 a−1), in MA ( µmol kg−1 a−1) and in WGY ( µmol kg−1 a−1). The decrease in [O2] which corresponds to a positive trend in AOU suggested an increase in the remineralization of organic matter at σθ25. Significant increasing trends were observed for CT over the entire area ( µmol kg−1 a−1), in MA ( µmol kg−1 a−1) and in WGY ( µmol kg−1 a−1). For CANT, the trends were slightly slower ( to µmol kg−1 a−1) and not significantly different between MA and WGY. Taking into account the OUTPACE dataset does not change the overall significance of the observed trends and only minor changes (mostly within the error of the estimates) are observed. If we assume a CT increase of 0.5 to 1 µmol kg−1 a−1 (depending on the buffer factors considered) associated with the recent rise in atmospheric CO2 (see for example Murata et al., 2007), the CT increase in the OUTPACE area is faster than thermodynamics would govern, whereas the CANT is closer to this thermodynamic value. The higher increase in CT could be related to an increase in remineralization processes as deduced from [O2] trends, with an overall consistency between the rate of CT increase and the rate of decrease in [O2]. However, the important increase in CANT observed between 2005 and 2015 between 10 and 30∘ S on the P16 line (at the eastern side of the OUTPACE transect) by Carter et al. (2017) is not supported by significant differences in the trends of CANT observed between MA and WGY in this study.
At σθ27, the only significant trend observed is an increase in CANT of ca. 0.40±0.06 µmol kg−1 a−1 in the MA area. When the OUTPACE dataset is not considered, a similar trend is observed for CT in the MA area. This trend is compatible with the observed increase in CANT by Kouketsu et al. (2013) along the P21 line close to the isopycnal layer 27 kg m−3. As this increase is not observed in WGY and if we assume that the σθ27 is filed with AAIWs, this suggest that the accumulation of CANT in AAIW is faster west of the 170∘ W line than to the east, but no clear explanation for this trend can be given.
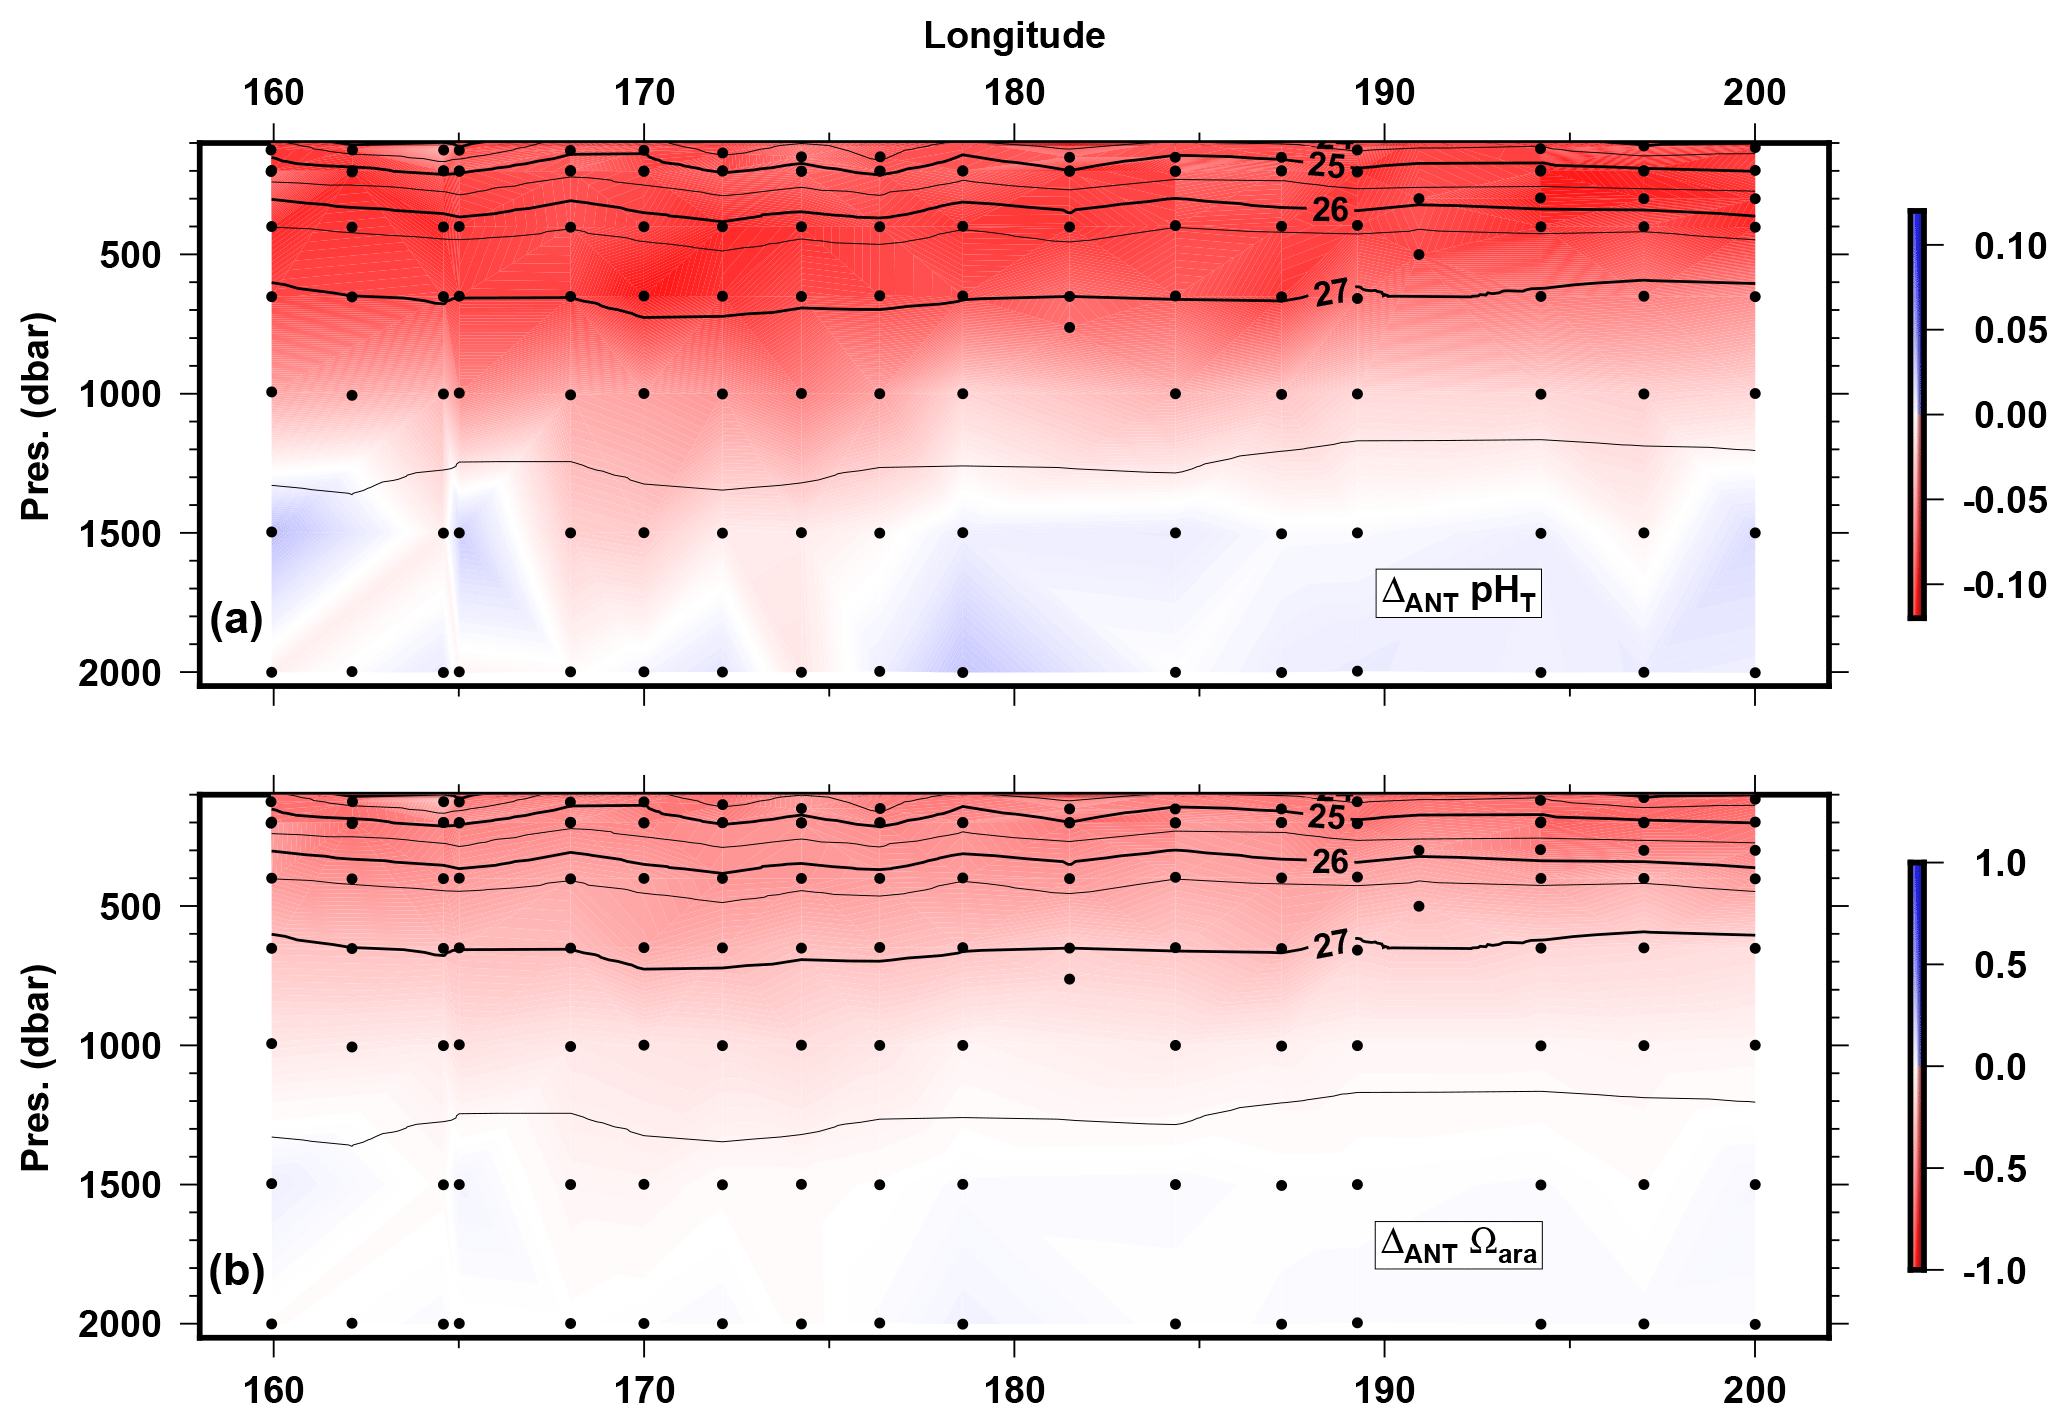
Figure 6Longitudinal variations in (a) pHT changes and (b) Ωara changes between the pre-industrial period and the present time along the OUTPACE transect between 100 and 2000 dbar depth (see text for details). Black contour lines represent the isopycnal horizons based on potential density referenced to a pressure of 0 dbar.
Temporal variations in pHT between 1970 and 2015 are presented in Fig. 5c and f with rates of pHT decrease of a−1 for MA and a−1 for WGY at σθ25 (Table 2) between 1980 and 2015. Based on the CANT rates estimated in the previous section (1.1 to 1.2 µmol kg−1 a−1) and based on a constant value of AT of 2285 µmol kg−1 (mean value of AT n35 on σθ25) and a constant temperature of 20 ∘C (mean value of temperature on σθ25), we can estimate a pHT decrease rate of −0.0023 to −0.0025 a−1. This indicates that rates of oceanic pHT decrease (ocean acidification) can mostly be explained by the increase in CANT. These rates of acidification are higher than the values reported by Waters et al. (2011) in the western South Pacific along the P06 Line (south of OUTPACE area at 32∘ S) between two visits in 1992 and 2008. They are also higher than the surface rates of pHT decrease of a−1 recorded at the HOT station in the tropical North Pacific and of and a−1 in the tropical North Atlantic at BATS and ESTOC stations, respectively (Bates et al., 2014). However, differences in buffer factors between the surface and subsurface can partially explain these differences. Nevertheless, our results in the subsurface (σθ25) based on GLODAPv2 and OUTPACE data (CT and AT) are similar to pHT trends derived from fCO2 surface observations (e.g., Lauvset et al., 2015). In the southern subtropical and equatorial Pacific regions, using SOCAT version2, Lauvset et al. (2015) evaluate contrasting fCO2 and pHT trends, ranging between +1.1 and +3.5 µatm a−1 for fCO2 and between −0.001 and −0.0023 a−1 for pHT. If we revisit these estimates, using surface fCO2 observations available in the OUTPACE region (18–22∘ S/170–200∘ E) in SOCAT version 6 (Bakker et al., 2016; http://www.socat.info, last access: 10 August 2018) and assuming a constant alkalinity (2300 µmol kg−1, average of surface data), we can calculate pHT and CT from fCO2 and temperature data. The resulting long-term trends for the period 1980–2016 for fCO2, CT and pHT are, respectively, µatm a−1, µmol kg−1 a−1 and a−1. Interestingly, for the period 2000–2016 the trends are µatm a−1, µmol kg−1 a−1 and a−1, suggesting an acceleration of the signals in recent years. These results, based on fCO2 observations in surface waters, confirm the trends we detected for CT and pHT in subsurface layers (σθ25).
In Fig. 6, estimates of the so-called “anthropogenic pHT change” (ΔANTpHT) and “anthropogenic Ωara change” (ΔANTΩara), which correspond to the difference in pHT and Ωara between the time of the OUTPACE cruise (modern time) and the pre-industrial period, are presented. The pHT and Ωara correspond to the values presented in Fig. 3, whereas the pre-industrial values corresponds to pHT and Ωara estimated with CT minus CANT. All other parameters (temperature, salinity, alkalinity and nutrients) are assumed to remain constant over time. The main features for the distribution of ΔANTpHT and ΔANTΩara logically reflect the distribution of the estimated CANT in this study because CANT is the only driving force in these estimations. The estimated pHT decrease reaches values slightly higher than 0.1 and the estimated Ωara decrease reaches values of 0.75 since the pre-industrial period for areas with the highest CANT accumulation. When considering an error in CANT of 6 µmol kg−1, we can assume that we are able to distinguish changes of 0.0012 for pHT and 0.06 for Ωara. Decreases in pHT and Ωara are thus detectable below 1000 dbar in the MA waters and above 1000 dbar in WGY waters.
A decrease in pHT of 0.1 units since the pre-industrial period is a generally accepted value for oceanic waters affected by CANT penetration (e.g., Royal Society (Great Britain), 2005). Several studies have assessed the rate of ocean acidification based on successive visits to different oceanic areas. For the South Pacific Ocean, Carter et al. (2017) reports decreases in oceanic pHT since the pre-industrial period of −0.09 and −0.11 pHT units for the latitude band from 10 to 20∘ S and from 20 to 30∘ S, respectively, along the P16 line (150∘ W) situated on the eastern side of the OUTPACE area. These are in good agreement with our estimates in this area.
Based on an interpolation of the estimated Ωara during OUTPACE and the pre-industrial Ωara, we calculated the depth of the horizon where Ωara=1 for the different stations of the OUTPACE transect (Table 3) in 2015 and the pre-industrial period based on the ΔANTΩara estimates. We observed an upward migration of the aragonite saturation horizon of up to 220 m in the MA area along the OUTPACE transect (Table 3). This upward migration of the Ωara=1 horizon is higher than the migration of 30 to 100 m observed between the 1990s and the pre-industrial period in early studies (Feely et al., 2004) in the Pacific based on the WOCE dataset illustrating the continuous acidification of the WTSP.
Based on AT and CT data and related properties collected during the OUTPACE cruise, we estimated different parameters of the carbonate system along a longitudinal section of nearly 4000 km and up to 2000 dbar in WTSP. Even if the vertical and horizontal resolution is low compared to the WOCE lines and precludes a rigorous comparison with this high-quality dataset, we estimated that the measured carbonate chemistry parameters are in good agreement with previous data collected in this area. Based on the estimation of CANT from the TrOCA method, we find CANT penetration in the WTSP and impacts on pHT and saturation state of calcium carbonate since the pre-industrial period that are in good agreement with previous observations in this area. As mentioned above, CANT values from TrOCA estimates are not reliable in surface layer. However, based on GLODAPv2 and the SOCAT database, our estimation of CANT in the subsurface seems to be in good agreement with expected changes in surface waters. The enhanced impact of ocean acidification in the subtropical South Pacific suggested by our study highlights the necessity of sustained research efforts in this largely underexplored part of the world ocean. The presented dataset collected along the OUTPACE transect could complement existing sections visited nearly every decade in the South Pacific Ocean and in particular the P21 line, which was last visited in 2009.
OUTPACE cruise data are available at the French INSU/CNRS LEFE CYBER database (scientific coordinator: Hervé Claustre; data manager and webmaster: Catherine Schmechtig) at the following web address: http://www.obs-vlfr.fr/proof/php/outpace/outpace.php (last access: 10 August 2018). GLODAPv2 data are available at the following web address: https://www.glodap.info/ (last access: 10 August 2018). SOCAT version 6 data are available at the following web address: https://www.socat.info/ (last access: 10 August 2018).
The authors declare that they have no conflict of interest.
This article is part of the special issue “Interactions between planktonic organisms and biogeochemical cycles across trophic and N2 fixation gradients in the western tropical South Pacific Ocean: a multidisciplinary approach (OUTPACE experiment)”. It is not associated with a conference.
This is a contribution of the OUTPACE (Oligotrophy from Ultra-oligoTrophy
PACific Experiment) project (https://outpace.mio.univ-amu.fr/, last
access: 10 August 2018) funded by the French national research agency
(ANR-14-CE01-0007-01), the LEFE-CyBER program (CNRS-INSU), the GOPS program
(IRD) and the CNES (BC T23, ZBC 4500048836). The OUTPACE cruise
(https://doi.org/10.17600/15000900) was managed by the MIO (OSU Institut Pytheas, AMU)
from Marseille (France), which has received funding from the European FEDER
Fund under project 1166-39417. The SNAPO-CO2 service at LOCEAN is
supported by CNRS-INSU and OSU Ecce-Terra. The Surface Ocean CO2
Atlas (SOCAT) is an international effort, endorsed by the International Ocean
Carbon Coordination Project (IOCCP), the Surface Ocean Lower Atmosphere Study
(SOLAS) and the Integrated Marine Biosphere Research (IMBeR) program, to
deliver a uniformly quality-controlled surface ocean CO2 database.
The many researchers and funding agencies responsible for the collection of
data and quality control are thanked for their contributions to SOCAT. The
authors thank the crew of the R/V L'Atalante for outstanding
shipboard operation. Catherine Schmechtig is warmly thanked for the LEFE
CYBER database management. Aurelia Lozingot is acknowledged for the
administrative work. Pierre Marrec is thanked for his insightful comments on
the present work. The two anonymous referees are thanked for helping improve
a previous version of this paper. The authors acknowledge the assistance of
the editorial staff of Biogeosciences.
Edited by: Emilio Marañón
Reviewed by:
two anonymous referees
Álvarez, M., Lo Monaco, C., Tanhua, T., Yool, A., Oschlies, A., Bullister, J. L., Goyet, C., Metzl, N., Touratier, F., McDonagh, E., and Bryden, H. L.: Estimating the storage of anthropogenic carbon in the subtropical Indian Ocean: a comparison of five different approaches, Biogeosciences, 6, 681–703, https://doi.org/10.5194/bg-6-681-2009, 2009. a, b
Azouzi, L., Goyet, C., Gonçalves Ito, R., and Touratier, F.: Corrigendum to “Anthropogenic carbon distribution in the eastern South Pacific Ocean” published in Biogeosciences, 6, 149–156, 2009, Biogeosciences, 6, 361–361, https://doi.org/10.5194/bg-6-361-2009, 2009. a
Bakker, D. C. E., Pfeil, B., Landa, C. S., Metzl, N., O'Brien, K. M., Olsen, A., Smith, K., Cosca, C., Harasawa, S., Jones, S. D., Nakaoka, S.-I., Nojiri, Y., Schuster, U., Steinhoff, T., Sweeney, C., Takahashi, T., Tilbrook, B., Wada, C., Wanninkhof, R., Alin, S. R., Balestrini, C. F., Barbero, L., Bates, N. R., Bianchi, A. A., Bonou, F., Boutin, J., Bozec, Y., Burger, E. F., Cai, W.-J., Castle, R. D., Chen, L., Chierici, M., Currie, K., Evans, W., Featherstone, C., Feely, R. A., Fransson, A., Goyet, C., Greenwood, N., Gregor, L., Hankin, S., Hardman-Mountford, N. J., Harlay, J., Hauck, J., Hoppema, M., Humphreys, M. P., Hunt, C. W., Huss, B., Ibánhez, J. S. P., Johannessen, T., Keeling, R., Kitidis, V., Körtzinger, A., Kozyr, A., Krasakopoulou, E., Kuwata, A., Landschützer, P., Lauvset, S. K., Lefèvre, N., Lo Monaco, C., Manke, A., Mathis, J. T., Merlivat, L., Millero, F. J., Monteiro, P. M. S., Munro, D. R., Murata, A., Newberger, T., Omar, A. M., Ono, T., Paterson, K., Pearce, D., Pierrot, D., Robbins, L. L., Saito, S., Salisbury, J., Schlitzer, R., Schneider, B., Schweitzer, R., Sieger, R., Skjelvan, I., Sullivan, K. F., Sutherland, S. C., Sutton, A. J., Tadokoro, K., Telszewski, M., Tuma, M., van Heuven, S. M. A. C., Vandemark, D., Ward, B., Watson, A. J., and Xu, S.: A multi-decade record of high-quality fCO2 data in version 3 of the Surface Ocean CO2 Atlas (SOCAT), Earth Syst. Sci. Data, 8, 383–413, https://doi.org/10.5194/essd-8-383-2016, 2016. a
Bates, N., Astor, Y., Church, M., Currie, K., Dore, J., Gonazález-Dávila, M., Lorenzoni, L., Muller-Karger, F., Olafsson, J., and Santa-Casiano, M.: A Time-Series View of Changing Ocean Chemistry Due to Ocean Uptake of Anthropogenic CO2 and Ocean Acidification, Oceanography, 27, 126–141, https://doi.org/10.5670/oceanog.2014.16, 2014. a
Bonnet, S., Caffin, M., Berthelot, H., and Moutin, T.: Hot spot of N2 fixation in the western tropical South Pacific pleads for a spatial decoupling between N2 fixation and denitrification, P. Natl. Acad. Sci. USA, 114, E2800–E2801, https://doi.org/10.1073/pnas.1619514114, 2017. a
Carter, B. R., Feely, R. A., Mecking, S., Cross, J. N., Macdonald, A. M., Siedlecki, S. A., Talley, L. D., Sabine, C. L., Millero, F. J., Swift, J. H., Dickson, A. G., and Rodgers, K. B.: Two decades of Pacific anthropogenic carbon storage and ocean acidification along Global Ocean Ship-based Hydrographic Investigations Program sections P16 and P02: Decadal Pacific Canth Changes by EMLR, Global Biogeochem. Cy., 31, 306–327, https://doi.org/10.1002/2016GB005485, 2017. a, b, c, d, e, f, g
de Verneil, A., Rousselet, L., Doglioli, A. M., Petrenko, A. A., and Moutin, T.: The fate of a southwest Pacific bloom: gauging the impact of submesoscale vs. mesoscale circulation on biological gradients in the subtropics, Biogeosciences, 14, 3471–3486, https://doi.org/10.5194/bg-14-3471-2017, 2017. a
DeVries, T., Holzer, M., and Primeau, F.: Recent increase in oceanic carbon uptake driven by weaker upper-ocean overturning, Nature, 542, 215–218, https://doi.org/10.1038/nature21068, 2017. a, b
Dickson, A.: An exact definition of total alkalinity and a procedure for the estimation of alkalinity and total inorganic carbon from titration data, Deep-Sea Res. Pt. A, 28, 609–623, https://doi.org/10.1016/0198-0149(81)90121-7, 1981. a
Dickson, A.: Standards for Ocean Measurements, Oceanography, 23, 34–47, https://doi.org/10.5670/oceanog.2010.22, 2010. a
Dickson, A. and Goyet, C. (Eds.): Handbook of methods for the analysis of the various parameters of the carbon dioxide system in sea water, version 2, no. 74 in ORNL/CDIAC-74, US Departement of Energy, 1994. a
Dickson, A. G.: Standard potential of the reaction: , and and the standard acidity constant of the ion in synthetic sea water from 273.15 to 318.15 K, J. Chem. Thermodyn., 22, 113–127, https://doi.org/10.1016/0021-9614(90)90074-Z, 1990. a
Dickson, A. G., Sabine, C. L., Christian, J. R., Bargeron, C. P., and North Pacific Marine Science Organization (Eds.): Guide to best practices for ocean CO2 measurements, no. 3 in PICES special publication, North Pacific Marine Science Organization, Sidney, BC, 2007. a
Edmond, J. M.: High precision determination of titration alkalinity and total carbon dioxide content of sea water by potentiometric titration, Deep-Sea Research and Oceanographic Abstracts, 17, 737–750, https://doi.org/10.1016/0011-7471(70)90038-0, 1970. a
Feely, R. A., Sabine, C. L., Lee, K., Berelson, W., Kleypas, J., Fabry, V. J., and Millero, F. J: Impact of Anthropogenic CO2 on the CaCO3 System in the Oceans, Science, 305, 362–366, https://doi.org/10.1126/science.1097329, 2004. a, b
Fumenia, A., Moutin, T., Bonnet, S., Benavides, M., Petrenko, A., Helias Nunige, S., and Maes, C.: Excess nitrogen as a marker of intense dinitrogen fixation in the Western Tropical South Pacific Ocean: impact on the thermocline waters of the South Pacific, Biogeosciences Discuss., https://doi.org/10.5194/bg-2017-557, in review, 2018. a, b, c
Ganachaud, A., Cravatte, S., Sprintall, J., Germineaud, C., Alberty, M., Jeandel, C., Eldin, G., Metzl, N., Bonnet, S., Benavides, M., Heimburger, L.-E., Lefèvre, J., Michael, S., Resing, J., Quéroué, F., Sarthou, G., Rodier, M., Berthelot, H., Baurand, F., Grelet, J., Hasegawa, T., Kessler, W., Kilepak, M., Lacan, F., Privat, E., Send, U., Van Beek, P., Souhaut, M., and Sonke, J. E.: The Solomon Sea: its circulation, chemistry, geochemistry and biology explored during two oceanographic cruises, Elem. Sci. Anth., 5, 33, https://doi.org/10.1525/elementa.221, 2017. a
Garcia, H. E. and Gordon, L. I.: Oxygen solubility in seawater: Better fitting equations, Limnol. Oceanogr., 37, 1307–1312, https://doi.org/10.4319/lo.1992.37.6.1307, 1992. a
Gattuso, J.-P. and Lavigne, H.: Technical Note: Approaches and software tools to investigate the impact of ocean acidification, Biogeosciences, 6, 2121–2133, https://doi.org/10.5194/bg-6-2121-2009, 2009. a
Gruber, N. and Sarmiento, J. L.: Global patterns of marine nitrogen fixation and denitrification, Global Biogeochem. Cy., 11, 235–266, https://doi.org/10.1029/97GB00077, 1997. a
Hartin, C. A., Fine, R. A., Sloyan, B. M., Talley, L. D., Chereskin, T. K., and Happell, J.: Formation rates of Subantarctic mode water and Antarctic intermediate water within the South Pacific, Deep-Sea Res. Pt. I, 58, 524–534, https://doi.org/10.1016/j.dsr.2011.02.010, 2011. a
Key, R. M., Kozyr, A., Sabine, C. L., Lee, K., Wanninkhof, R., Bullister, J. L., Feely, R. A., Millero, F. J., Mordy, C., and Peng, T.-H.: A global ocean carbon climatology: Results from Global Data Analysis Project (GLODAP): GLOBAL OCEAN CARBON CLIMATOLOGY, Global Biogeochem. Cy., 18, GB4031, https://doi.org/10.1029/2004GB002247, 2004. a
Key, R., Olsen, A., Van Heuven, S., Lauvset, S., Velo, A., Lin, X., Schirnick, C., Kozyr, A., Tanhua, T., Hoppema, M., Jutterstrom, S., Steinfeldt, R., Jeansson, E., Ishi, M., Perez, F., and Suzuki, T.: Global Ocean Data Analysis Project, Version 2 (GLODAPv2), ORNL/CDIAC-162, ND-P093, dataset, https://doi.org/10.3334/CDIAC/OTG.NDP093_GLODAPv2, 2015. a, b
Kouketsu, S., Murata, A., and Doi, T.: Decadal changes in dissolved inorganic carbon in the Pacific Ocean: DIC changes in the pacific, Global Biogeochem. Cy., 27, 65–76, https://doi.org/10.1029/2012GB004413, 2013. a, b, c
Langdon, C.: Determination of Dissolved Oxygen in Seawater by Winkler Titration Using the Amperometric Technique, no. 14 in IOCCP Report, ICPO Publication, available at: http://www.go-ship.org/HydroMan.html (last access: 10 August 2018), 2010. a
Lauvset, S. K., Gruber, N., Landschützer, P., Olsen, A., and Tjiputra, J.: Trends and drivers in global surface ocean pH over the past 3 decades, Biogeosciences, 12, 1285–1298, https://doi.org/10.5194/bg-12-1285-2015, 2015. a, b
Le Quéré, C., Andrew, R. M., Friedlingstein, P., Sitch, S., Pongratz, J., Manning, A. C., Korsbakken, J. I., Peters, G. P., Canadell, J. G., Jackson, R. B., Boden, T. A., Tans, P. P., Andrews, O. D., Arora, V. K., Bakker, D. C. E., Barbero, L., Becker, M., Betts, R. A., Bopp, L., Chevallier, F., Chini, L. P., Ciais, P., Cosca, C. E., Cross, J., Currie, K., Gasser, T., Harris, I., Hauck, J., Haverd, V., Houghton, R. A., Hunt, C. W., Hurtt, G., Ilyina, T., Jain, A. K., Kato, E., Kautz, M., Keeling, R. F., Klein Goldewijk, K., Körtzinger, A., Landschützer, P., Lefèvre, N., Lenton, A., Lienert, S., Lima, I., Lombardozzi, D., Metzl, N., Millero, F., Monteiro, P. M. S., Munro, D. R., Nabel, J. E. M. S., Nakaoka, S.-I., Nojiri, Y., Padin, X. A., Peregon, A., Pfeil, B., Pierrot, D., Poulter, B., Rehder, G., Reimer, J., Rödenbeck, C., Schwinger, J., Séférian, R., Skjelvan, I., Stocker, B. D., Tian, H., Tilbrook, B., Tubiello, F. N., van der Laan-Luijkx, I. T., van der Werf, G. R., van Heuven, S., Viovy, N., Vuichard, N., Walker, A. P., Watson, A. J., Wiltshire, A. J., Zaehle, S., and Zhu, D.: Global Carbon Budget 2017, Earth Syst. Sci. Data, 10, 405–448, https://doi.org/10.5194/essd-10-405-2018, 2018. a
Lo Monaco, C., Goyet, C., Metzl, N., Poisson, A., and Touratier, F.: Distribution and inventory of anthropogenic CO2 in the Southern Ocean: Comparison of three data-based methods, J. Geophys. Res., 110, C09S02, https://doi.org/10.1029/2004JC002571, 2005. a
Lueker, T. J., Dickson, A. G., and Keeling, C. D.: Ocean pCO2 calculated from dissolved inorganic carbon, alkalinity, and equations for K1 and K2: validation based on laboratory measurements of CO2 in gas and seawater at equilibrium, Mar. Chem., 70, 105–119, https://doi.org/10.1016/S0304-4203(00)00022-0, 2000. a
Moutin, T., Doglioli, A. M., de Verneil, A., and Bonnet, S.: Preface: The Oligotrophy to the UlTra-oligotrophy PACific Experiment (OUTPACE cruise, 18 February to 3 April 2015), Biogeosciences, 14, 3207–3220, https://doi.org/10.5194/bg-14-3207-2017, 2017. a, b, c
Moutin, T., Wagener, T., Caffin, M., Fumenia, A., Gimenez, A., Baklouti, M., Bouruet-Aubertot, P., Pujo-Pay, M., Leblanc, K., Lefevre, D., Helias Nunige, S., Leblond, N., Grosso, O., and de Verneil, A.: Nutrient availability and the ultimate control of the biological carbon pump in the western tropical South Pacific Ocean, Biogeosciences, 15, 2961–2989, https://doi.org/10.5194/bg-15-2961-2018, 2018. a, b, c, d, e, f
Murata, A., Kumamoto, Y., Watanabe, S., and Fukasawa, M.: Decadal increases of anthropogenic CO2 in the South Pacific subtropical ocean along 32∘ S, J. Geophys. Res., 112, C05033, https://doi.org/10.1029/2005JC003405, 2007. a, b, c
Murata, A., Hayashi, K., Kumamoto, Y., and Sasaki, K.-I.: Detecting the progression of ocean acidification from the saturation state of CaCO3 in the subtropical South Pacific, Global Biogeochem. Cy., 29, 463–475, https://doi.org/10.1002/2014GB004908, 2015. a, b
Olsen, A., Key, R. M., van Heuven, S., Lauvset, S. K., Velo, A., Lin, X., Schirnick, C., Kozyr, A., Tanhua, T., Hoppema, M., Jutterström, S., Steinfeldt, R., Jeansson, E., Ishii, M., Pérez, F. F., and Suzuki, T.: The Global Ocean Data Analysis Project version 2 (GLODAPv2) – an internally consistent data product for the world ocean, Earth Syst. Sci. Data, 8, 297–323, https://doi.org/10.5194/essd-8-297-2016, 2016. a, b, c
Oudot, C., Gerard, R., Morin, P., and Gningue, I.: Precise shipboard determination of dissolved oxygen (Winkler procedure) for productivity studies with a commercial system1, Limnol. Oceanogr., 33, 146–150, https://doi.org/10.4319/lo.1988.33.1.0146, 1988. a
Owens, W. B. and Millard, R. C.: A New Algorithm for CTD Oxygen Calibration, J. Phys. Oceanogr., 15, 621–631, https://doi.org/10.1175/1520-0485(1985)015<0621:ANAFCO>2.0.CO;2, 1985. a
Pérez, F. F. and Fraga, F.: A precise and rapid analytical procedure for alkalinity determination, Mar. Chem., 21, 169–182, https://doi.org/10.1016/0304-4203(87)90037-5, 1987. a
Pérez, F. F., Vázquez-Rodríguez, M., Mercier, H., Velo, A., Lherminier, P., and Ríos, A. F.: Trends of anthropogenic CO2 storage in North Atlantic water masses, Biogeosciences, 7, 1789–1807, https://doi.org/10.5194/bg-7-1789-2010, 2010. a
Riebesell, U., Zondervan, I., Rost, B., Tortell, P. D., Zeebe, R. E., and Morel, F. M. M.: Reduced calcification of marine plankton in response to increased atmospheric CO2, Nature, 407, 364–367, https://doi.org/10.1038/35030078, 2000. a
Royal Society (Great Britain): Ocean acidification due to increasing atmospheric carbon dioxide, Royal Society, London, oCLC: 60805277, available at: https://royalsociety.org/topics-policy/publications/2005/ocean-acidification/ (last access: 10 August 2018), 2005. a
Sabine, C. L. and Tanhua, T.: Estimation of Anthropogenic CO2 Inventories in the Ocean, Annu. Rev. Mar. Sci., 2, 175–198, https://doi.org/10.1146/annurev-marine-120308-080947, 2010. a
Sabine, C. L., Feely, R. A., Gruber, N., Key, R. M., Lee, K., Bullister, J. L., Wanninkhof, R., Wong, C. S., Wallace, D. W. R., Tilbrook, B., Millero, F. J., Peng, T.-H., Kozyr, A., Ono, T., and Rios, A. F.: The Oceanic Sink for Anthropogenic CO2, Science, 305, 367–371, https://doi.org/10.1126/science.1097403, 2004. a
Sabine, C. L., Feely, R. A., Millero, F. J., Dickson, A. G., Langdon, C., Mecking, S., and Greeley, D.: Decadal changes in Pacific carbon, J. Geophys. Res., 113, C07021, https://doi.org/10.1029/2007JC004577, 2008. a
Takahashi, T., Sutherland, S., Chipman, D., Goddard, J., Ho, C., Newberger, T., Sweeney, C., and Munro, D.: Climatological distributions of pH, pCO2, total CO2, alkalinity, and CaCO3 saturation in the global surface ocean, and temporal changes at selected locations, Mar. Chem., 164, 95–125, https://doi.org/10.1016/j.marchem.2014.06.004, 2014. a, b
Tomczak, M. and Godfrey, J. S.: Regional oceanography: an introduction, 2nd Edn., Daya Publ. House, Delhi, 2003. a
Touratier, F. and Goyet, C.: Applying the new TrOCA approach to assess the distribution of anthropogenic CO2 in the Atlantic Ocean, J. Marine Syst., 46, 181–197, https://doi.org/10.1016/j.jmarsys.2003.11.020, 2004a. a
Touratier, F. and Goyet, C.: Definition, properties, and Atlantic Ocean distribution of the new tracer TrOCA, J. Marine Syst., 46, 169–179, https://doi.org/10.1016/j.jmarsys.2003.11.016, 2004b. a
Touratier, F., Azouzi, L., and Goyet, C.: CFC-11, Δ14C and 3H tracers as a means to assess anthropogenic CO2 concentrations in the ocean, Tellus B, 59, 318–325, https://doi.org/10.1111/j.1600-0889.2006.00247.x, 2007. a, b, c, d
Valladares, J., Fennel, W., and Morozov, E.: Replacement of EOS – 80 with the International Thermodynamic Equation of Seawater – 2010 (TEOS–10), Deep-Sea Res. Pt. I, 58, p. 978, https://doi.org/10.1016/j.dsr.2011.07.005, 2011. a
Vázquez-Rodríguez, M., Touratier, F., Lo Monaco, C., Waugh, D. W., Padin, X. A., Bellerby, R. G. J., Goyet, C., Metzl, N., Ríos, A. F., and Pérez, F. F.: Anthropogenic carbon distributions in the Atlantic Ocean: data-based estimates from the Arctic to the Antarctic, Biogeosciences, 6, 439–451, https://doi.org/10.5194/bg-6-439-2009, 2009. a
Waters, J. F., Millero, F. J., and Sabine, C. L.: Changes in South Pacific anthropogenic carbon, Global Biogeochem. Cy., 25, GB4011, https://doi.org/10.1029/2010GB003988, 2011. a, b
Winkler, L. W.: Die Bestimmung des im Wasser gelösten Sauerstoffes, Ber. Dtsch. Chem. Ges., 21, 2843–2854, https://doi.org/10.1002/cber.188802102122, 1888. a
Yool, A., Oschlies, A., Nurser, A. J. G., and Gruber, N.: A model-based assessment of the TrOCA approach for estimating anthropogenic carbon in the ocean, Biogeosciences, 7, 723–751, https://doi.org/10.5194/bg-7-723-2010, 2010. a, b
Yoshikawa, C., Makabe, A., Shiozaki, T., Toyoda, S., Yoshida, O., Furuya, K., and Yoshida, N.: Nitrogen isotope ratios of nitrate and N* anomalies in the subtropical South Pacific, Geochem. Geophy. Geosy., 16, 1439–1448, https://doi.org/10.1002/2014GC005678, 2015. a
- Abstract
- Introduction
- Material and methods
- Hydrological context along the OUTPACE transect
- Carbonate chemistry along the OUTPACE transect
- Anthropogenic carbon estimation along the OUTPACE transect
- Temporal changes in carbonate chemistry in the OUTPACE area
- Towards an enhanced “ocean acidification” in the WTSP?
- Conclusions
- Data availability
- Competing interests
- Special issue statement
- Acknowledgements
- References
The requested paper has a corresponding corrigendum published. Please read the corrigendum first before downloading the article.
- Article
(5199 KB) - Full-text XML
- Abstract
- Introduction
- Material and methods
- Hydrological context along the OUTPACE transect
- Carbonate chemistry along the OUTPACE transect
- Anthropogenic carbon estimation along the OUTPACE transect
- Temporal changes in carbonate chemistry in the OUTPACE area
- Towards an enhanced “ocean acidification” in the WTSP?
- Conclusions
- Data availability
- Competing interests
- Special issue statement
- Acknowledgements
- References