the Creative Commons Attribution 4.0 License.
the Creative Commons Attribution 4.0 License.
 | 29 Aug 2018
Environmental and taxonomic controls of carbon and oxygen stable isotope composition in Sphagnum across broad climatic and geographic ranges
Håkan Rydin
Jennifer L. Baltzer
Fia Bengtsson
Nicholas Boncek
Luca Bragazza
Zhao-Jun Bu
Simon J. M. Caporn
Ellen Dorrepaal
Olga Galanina
Mariusz Gałka
Anna Ganeva
David P. Gillikin
Irina Goia
Nadezhda Goncharova
Michal Hájek
Akira Haraguchi
Lorna I. Harris
Elyn Humphreys
Martin Jiroušek
Katarzyna Kajukało
Edgar Karofeld
Natalia G. Koronatova
Natalia P. Kosykh
Mariusz Lamentowicz
Elena Lapshina
Juul Limpens
Maiju Linkosalmi
Jin-Ze Ma
Marguerite Mauritz
Tariq M. Munir
Susan M. Natali
Rayna Natcheva
Maria Noskova
Richard J. Payne
Kyle Pilkington
Sean Robinson
Bjorn J. M. Robroek
Line Rochefort
David Singer
Hans K. Stenøien
Eeva-Stiina Tuittila
Kai Vellak
Anouk Verheyden
James Michael Waddington
Steven K. Rice
Rain-fed peatlands are dominated by peat mosses (Sphagnum sp.), which for their growth depend on nutrients, water and CO2 uptake from the atmosphere. As the isotopic composition of carbon (12,13C) and oxygen (16,18O) of these Sphagnum mosses are affected by environmental conditions, Sphagnum tissue accumulated in peat constitutes a potential long-term archive that can be used for climate reconstruction. However, there is inadequate understanding of how isotope values are influenced by environmental conditions, which restricts their current use as environmental and palaeoenvironmental indicators. Here we tested (i) to what extent C and O isotopic variation in living tissue of Sphagnum is species-specific and associated with local hydrological gradients, climatic gradients (evapotranspiration, temperature, precipitation) and elevation; (ii) whether the C isotopic signature can be a proxy for net primary productivity (NPP) of Sphagnum; and (iii) to what extent Sphagnum tissue δ18O tracks the δ18O isotope signature of precipitation. In total, we analysed 337 samples from 93 sites across North America and Eurasia using two important peat-forming Sphagnum species (S. magellanicum, S. fuscum) common to the Holarctic realm. There were differences in δ13C values between species. For S. magellanicum δ13C decreased with increasing height above the water table (HWT, R2=17 %) and was positively correlated to productivity (R2=7 %). Together these two variables explained 46 % of the between-site variation in δ13C values. For S. fuscum, productivity was the only significant predictor of δ13C but had low explanatory power (total R2=6 %). For δ18O values, approximately 90 % of the variation was found between sites. Globally modelled annual δ18O values in precipitation explained 69 % of the between-site variation in tissue δ18O. S. magellanicum showed lower δ18O enrichment than S. fuscum (−0.83 ‰ lower). Elevation and climatic variables were weak predictors of tissue δ18O values after controlling for δ18O values of the precipitation. To summarize, our study provides evidence for (a) good predictability of tissue δ18O values from modelled annual δ18O values in precipitation, and (b) the possibility of relating tissue δ13C values to HWT and NPP, but this appears to be species-dependent. These results suggest that isotope composition can be used on a large scale for climatic reconstructions but that such models should be species-specific.
- Article
(3400 KB) -
Supplement
(550 KB) - BibTeX
- EndNote


Peatlands in temperate, boreal and arctic regions form large reservoirs of carbon, which are vulnerable to release under expected changes in global climate and land management (Rydin and Jeglum, 2013; Loisel et al., 2014). Because peat decomposes slowly and gradually accumulates, it preserves information on past peatland ecosystem dynamics and responses to allogenic and autogenic forcings. Palaeoenvironmental studies of peat may, therefore, help to anticipate the future responses of these globally important ecosystems to climate change (Loader et al., 2016). Past climate and local hydrology can be estimated using a variety of biotic and biogeochemical proxies, including the δ13C and δ18O values of organic material (e.g. van der Knaap, 2011; Royles et al., 2016; Lamentowicz et al., 2015). However, the environmental (e.g. climate) and biotic (e.g. species identity) controls of isotope differentiation in peatland-dwelling plants are still poorly understood and current assumptions regarding these controlling factors are yet to be tested on larger spatial scales.
Sphagnum mosses are the most dominant peat-forming plant group in acidic peatlands. The composition of stable isotopes of carbon and oxygen in their tissues is affected by different environmental conditions, operating through their impact on fractionation processes. When not submerged, carbon isotope signals in bulk tissues or components such as cellulose depend mainly on the concentration and isotopic composition of CO2 in the chloroplast, which alters isotope discrimination during biochemical fixation of CO2 (Farquhar et al., 1989; O'Leary, 1988). In mosses, the CO2 concentration in the chloroplast, [CO2]c, is determined by temperature, light availability, CO2 partial pressure and, most importantly, plant water status (Finsinger et al., 2013; van der Knaap et al., 2011; Ménot and Burns, 2001; Ménot-Combes et al., 2004; Royles et al., 2014; Skrzypek et al., 2007a; Kaislahti Tillman et al., 2013). When wet, external water films on leaf surfaces impede diffusion and [CO2]c is lowered (Rice and Giles, 1996; Rice, 2000; Williams and Flanagan, 1996); consequently, the proportion of fixed 13C increases due to internal drawdown of the preferred isotope 12C. When submerged, assimilation of respired or methane-derived CO2 can alter [CO2] and also the isotopic composition of C in Sphagnum (Raghoebarsing et al., 2005). Even when not submerged, respiratory carbon can be refixed by Sphagnum (Turetsky and Wieder, 1999; Limpens et al., 2008). Given that respired CO2 is isotopically lighter than that in the atmosphere, it may also contribute to variation in tissue isotope values. Despite many detailed studies, there remains uncertainty about how the multiple controls on 13C isotope values combine to determine isotopic composition, and how universal the proposed mechanisms are on a global scale. This uncertainty currently restricts the utility of C isotope signals as palaeoclimatic or palaeoenvironmental indicators in peatlands (Loader et al., 2016).
Oxygen isotope values in moss tissues depend on the isotopic composition of the water sources, enrichment associated with evaporation from the moss surface and biochemical fractionation (Dawson et al., 2002). Once on the plant, 18O present in water equilibrates with that in atmospheric CO2 prior to fixation as well as being incorporated directly during hydrolysis reactions, especially during the initial stages of carbon fixation (Gessler et al., 2014; Sternberg et al., 2006). Hence, variation in tissue oxygen isotopes reflect environmental conditions that control source water (rainfall, snowfall, groundwater) as well as fractionation caused by evaporation prior to fixation, which is controlled by micrometeorological conditions (mainly temperature, relative humidity and incident energy) (Daley et al., 2010; Moschen et al., 2009; Royles et al., 2013; Kaislahti Tillman et al., 2010). Oxygen isotope composition has, therefore, been used to reconstruct climatic conditions and to infer the dominant water source in peatlands (Aravena and Warner, 1992; Ellis and Rochefort, 2006; van der Knaap et al., 2011). Ongoing measurements of oxygen isotopes in precipitation across the globe (Bowen, 2010; IAEA/WMO, 2015) have generated models that predict spatial patterns in oxygen isotope composition of precipitation based on temperature, elevation, atmospheric residence time and circulation patterns (e.g. Bowen, 2010). Once isotopic composition of the source water is accounted for, variation in moss tissue isotopic values should be largely determined by fractionation that accompanies evaporation from the surface of plants. How well oxygen isotopes in Sphagnum tissues reflect atmospheric water or plant surface water depends on local weather conditions such as precipitation, air temperature and humidity. For example, Bilali et al. (2013) suggest that oxygen isotopes in Sphagnum mosses from maritime bogs will track variation in precipitation patterns whereas isotopic values in continental habitats will be more dependent on summer temperature, as temperature and humidity are more variable in those regions. On local scales, oxygen isotope values also vary as a function of temperature and humidity. Aravena and Warner (1992) found differences that correspond with changes in microtopography. Elevated microsites (hummocks) were enriched in 18O, which they ascribed to higher evaporation compared to that of neighbouring wet depressions (hollows). However, as with 13C, there remains uncertainty in how 18O signatures relate to environmental factors and species identity and to what extent global 18O patterns in precipitation dominate over local processes.
Stable isotopes can also serve as indicators of net primary productivity (NPP) (Rice and Giles, 1996; Williams and Flanagan, 1996; Rice, 2000). However, few studies have explored these relationships in the field. In a multispecies comparison of peat mosses, Rice (2000) found that plants with higher relative growth rates had lower discrimination against 13C and therefore were more enriched in 13C. This was attributed to the local environment, with fast-growing plants of wetter microhabitats having thicker water films that inhibit CO2 diffusion into the plant and to species-specific differences in maximum rates of photosynthesis. Both factors would reduce internal [CO2] and thereby lower discrimination. In line with this, a warming experiment by Deane-Coe et al. (2015) reported a positive relationship between moss net NPP and δ13C values for tundra mosses (Dicranum, Pleurozium, Sphagnum). Clearly, carbon isotope values show promise as indicators of peat moss contemporary growth and potentially as an NPP proxy in palaeoecological studies. This could be particularly valuable to differentiate productivity and decomposition controls in long-term carbon accumulation studies. To date, we are not aware of attempts to explore the robustness of these relationships across large spatial scales.
Together, tissue carbon and oxygen isotope compositions are controlled both by environmental factors at micro- and macro-scales, and by species-specific differences that relate to water balance and carbon dynamics in peat mosses. Palaeoecological studies rely on such environment–isotope relationships for environmental reconstructions (Ellis and Rochefort, 2006; van der Knaap et al., 2011). The underlying mechanisms are, however, rarely fully explored using known environmental gradients (but see Ménot and Burns, 2001 for an example) or only tested across narrow bands of environmental variation, often with sets of correlated environmental factors (Loader et al., 2016). Moreover, interactions with biotic factors such as species identity have received little attention despite the large variations in Sphagnum species dominance commonly observed down peat cores (e.g. Ménot and Burns, 2001). Here we aim to provide a robust, cross-scale evaluation of how environmental factors and species identity influence the C and O isotope compositions of Sphagnum using two common and widely distributed peat-forming species (S. magellanicum and S. fuscum) that are primarily rain-fed. To achieve this, we performed an unprecedented large sampling campaign across the Holarctic realm.
Specifically, we (i) investigated relationships between C and O isotope values and factors known to influence plant water availability (height above the water table – HWT, temperature, evaporation and precipitation) and CO2 partial pressure (elevation), and tested whether their effects were modified by species identity; (ii) tested the prediction that Sphagnum tissue δ13C values are associated with NPP; and (iii) tested whether tissue δ18O in rain-fed Sphagna is predicted by the δ18O isotope signature in precipitation but modified by negative relationships with precipitation and positive ones with temperature/evaporation. Across these objectives we examined how C and O isotope values varied with scale (within-peatland versus between-peatlands) and to what extent HWT and NPP could explain variation within and between peatlands.
2.1 Study species and collection sites
Our study focused on two common peat-forming Sphagnum species, S. fuscum (Schimp.) H. Klinggr. (circumpolar distribution) and S. magellanicum Brid. (cosmopolitan distribution). In general, these species are confined to primarily rain-fed peatlands (bogs) and described as hummock (S. fuscum) and lawn (S. magellanicum) species. However, S. magellanicum is a species with a very broad niche and found in a range of habitats with varying degrees of groundwater influence (Flatberg, 2013). These species are easy to identify, but recent research has shown that the dark European morph of S. fuscum is conspecific to the North American S. beothuk (Kyrkjeeide et al., 2015), and S. magellanicum has been shown to consist of two genetically diverged morphotypes (Kyrkjeeide et al., 2016) that recently were separated at the species level (Hassel et al., 2018). Unpublished genetic data suggest that samples collected in our study consist of both S. magellanicum morphs (approximately 50/50) and possibly one or two samples of S. beothuk (Narjes Yousefi, personal communication, 2018). Hence, we here treat our species as aggregates (i.e. species collectiva), S. fuscum coll. and S. magellanicum coll.
The two species were sampled across the Holarctic region at a total of 93 sites (Fig. 1; Table S1 in the Supplement) at the end of the growing season. To make comparisons between species and between sites possible, we focused on habitats where both species can be found and have low influence of surrounding groundwater. Thus, we only sampled bogs (including a few poor fens with ombrotrophic character) and open (no tree canopy) habitats. Sampling was conducted mainly during 2013, but a few sites were sampled at a similar time of year in 2014. At each site two patches (minimum 10 m apart) for each species were sampled (except for 11 sites that contained only one patch for one species). At each sampling patch we recorded moss growth, HWT and GPS coordinates, and collected a moss sample (78 cm2 and 5 cm deep) at the end of the growing season (September to November depending on location and generally coincided with when there was a risk of the first snowfall to occur). Moss samples were dried (24 h at 60–65 ∘C) within 72 h or immediately frozen and later thawed and dried. The apical part (the capitula, top 1 cm) of the dried plant shoots was used for isotope analysis, while the stem section was used for bulk density estimation to calculate moss NPP.
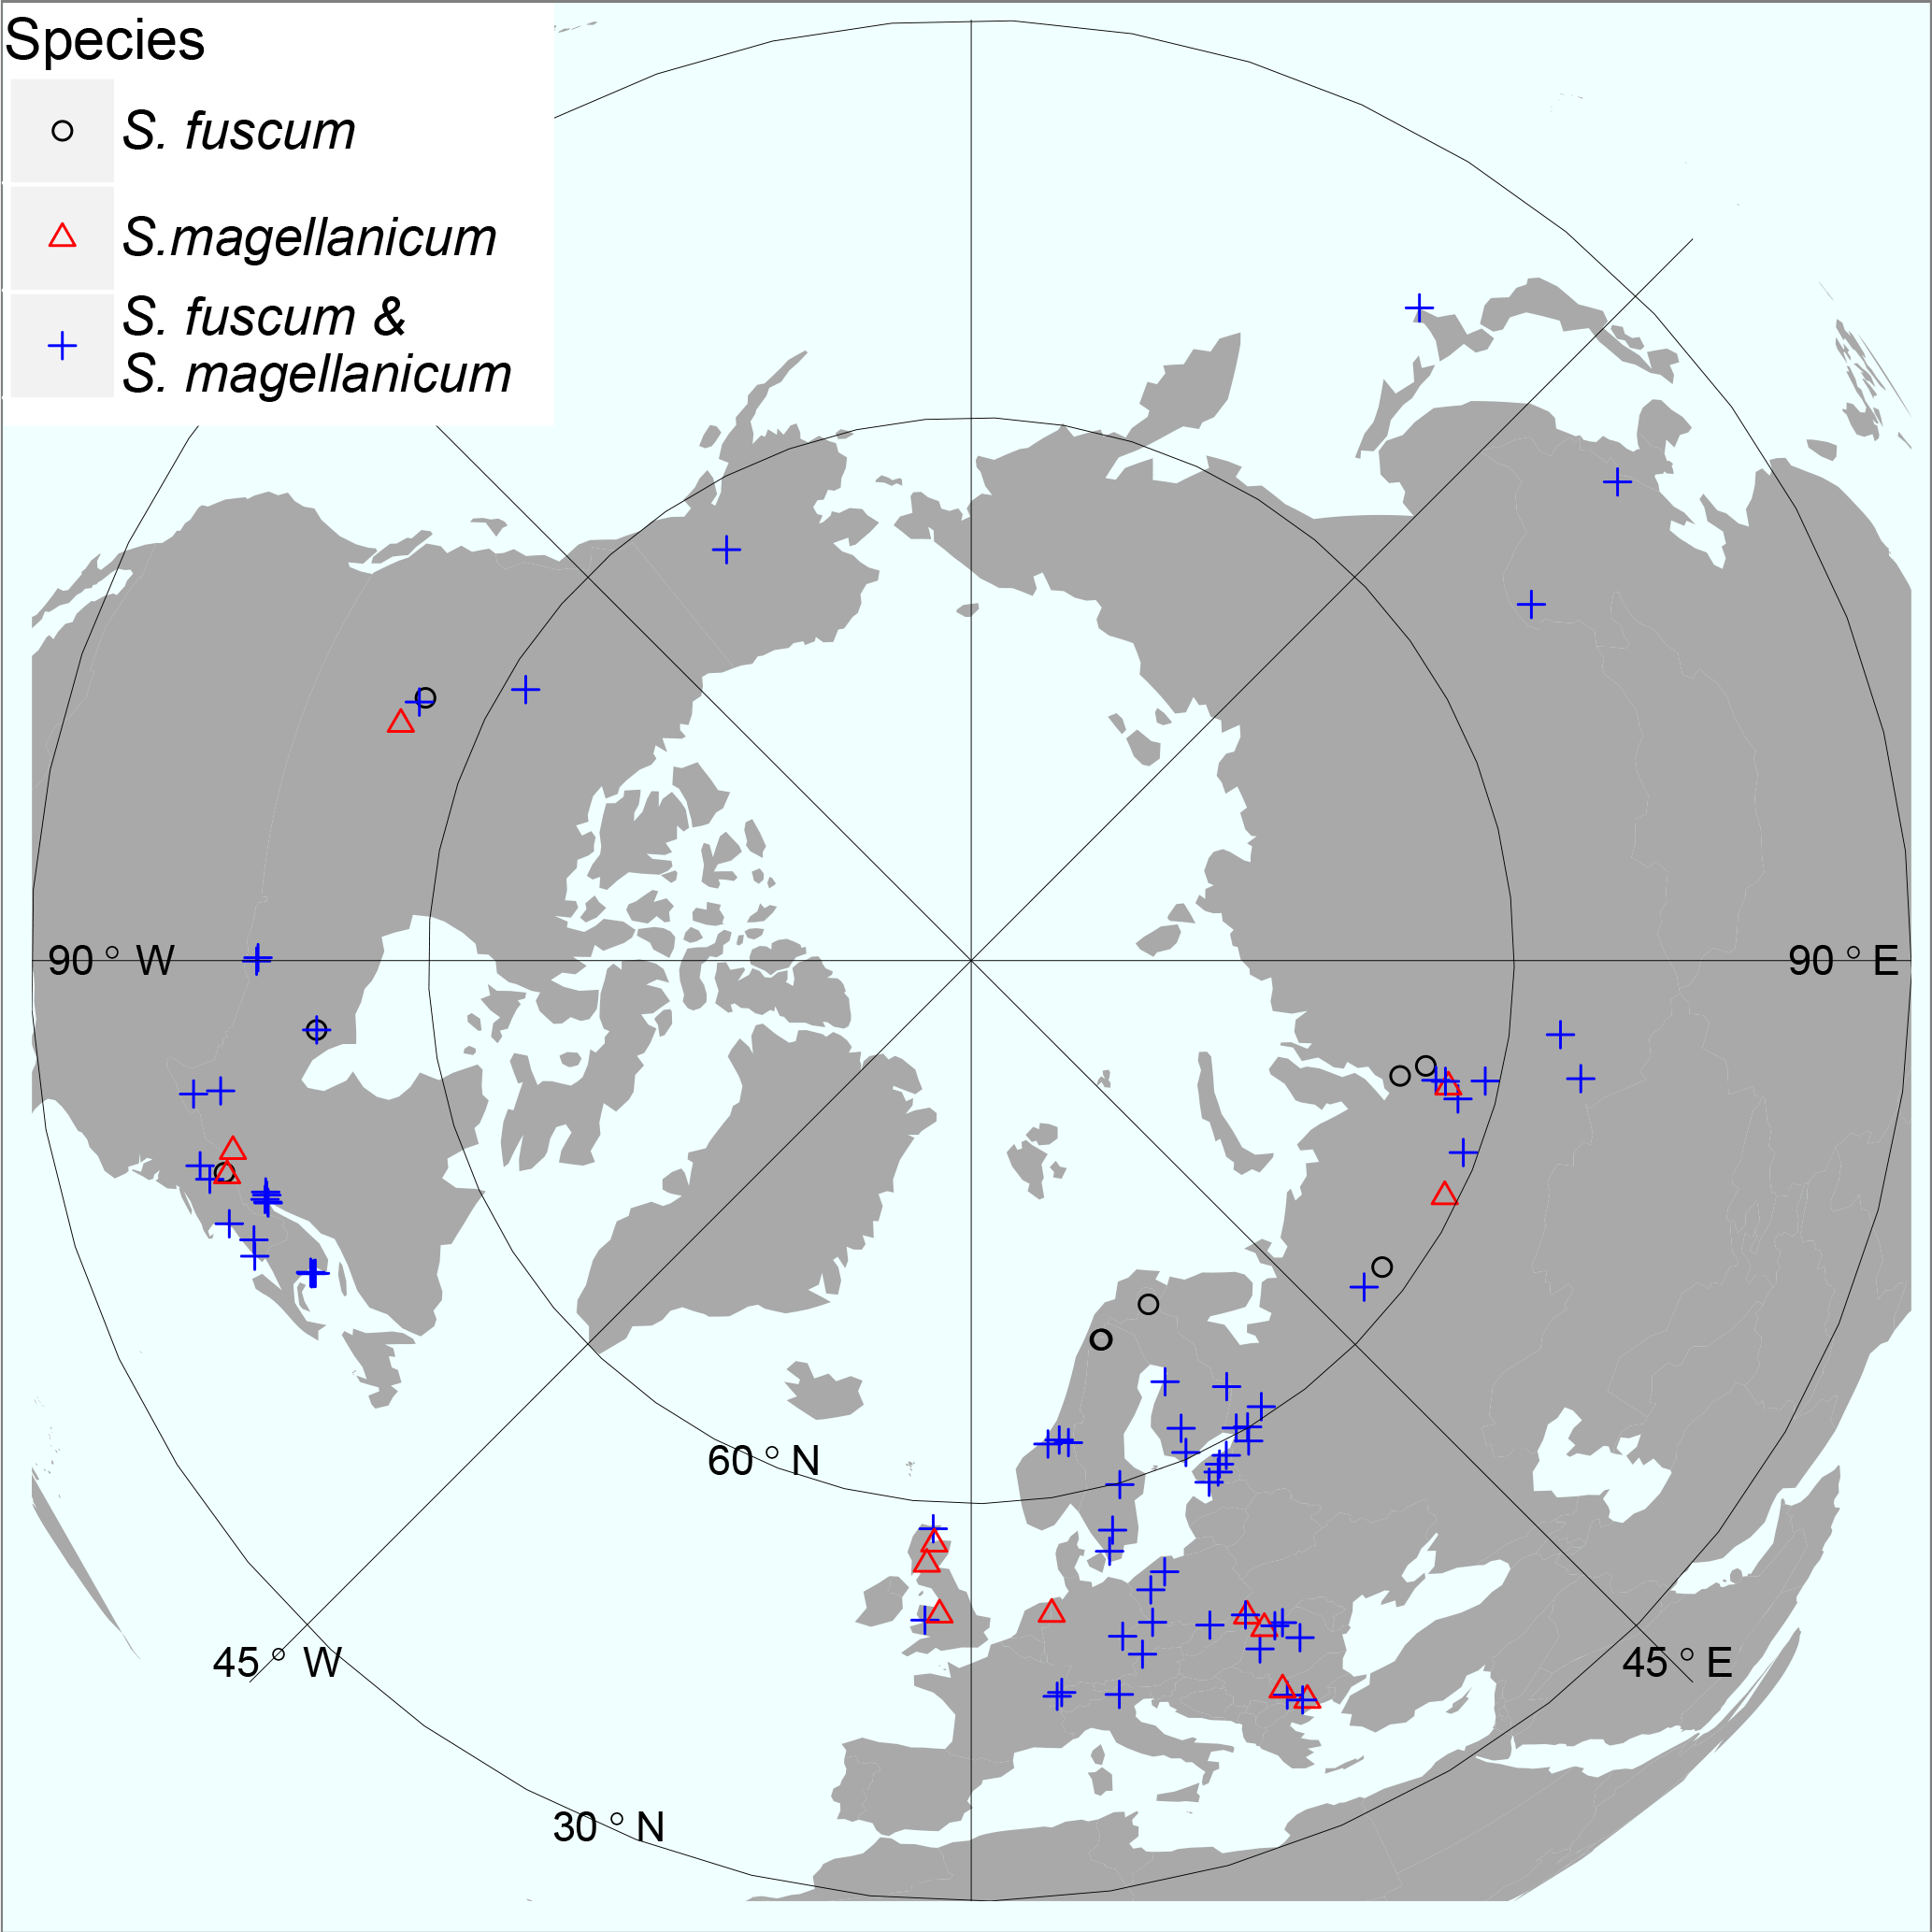
Figure 1Map illustrating sample sites for the investigated species. At some sites only one of the two Sphagnum species was sampled, indicated by red triangles or black circles. Otherwise sites contained both species (blue crosses). The map is centred on the North Pole and has an orthographic projection. Geographical ranges: latitude 41.6–69.1 N, elevation 2 – 1829 m a.s.l. See Table S1 for details.
2.2 Isotope determination
Ten capitula from each patch were selected and finely chopped with a single-edge razor by hand and mixed. Capitula were chosen as they reflect the most recently fixed organic matter and should relate better to recent growing season conditions. In Sphagnum, δ13C from the capitulum is similar to that of branches within the top 15 cm of plants but is approximately 1–2 ‰ less negative than stems (Loader et al., 2007). For δ18O, the offset between branches and stems is around 1 ‰ (Moschen et al., 2009). Standard deviations of repeated samples were 0.6 ‰ and 0.7 ‰ for δ13C and δ18O, respectively. Approximately 0.5 mg of dry sample was packed in tin cups for δ13C analyses, and ∼0.2 mg in silver cups for δ18O analyses. Samples were analysed at Union College (Schenectady, NY, USA) using a Thermo Delta Advantage mass spectrometer in continuous flow mode connected (via a ConFlo IV) to a Costech Elemental Analyzer for δ13C analysis or a Thermo TC/EA for δ18O analyses. Isotope values are presented as , where Rsample and Rstandard are the ratios of heavy to light isotopes (e.g. 13C ∕ 12C) and are referenced to VPDB and VSMOW for C and O, respectively. Carbon isotope data were corrected using sucrose (IAEA-CH-6, −10.449 ‰), acetanilide (in house, −37.07 ‰) and caffeine (IAEA-600, −27.771 ‰). Oxygen isotope data were corrected using sucrose (IAEA-CH-6, 36.4 ‰), cellulose (IAEA-C3, 31.9 ‰) and caffeine (IAEA-600, −3.5 ‰) with values from Hunsinger et al. (2010). Oxygen isotope standardization was further checked with the whole wood standards USGS54 and USGS56. The combined instrument uncertainty for δ13C (VPDB) is <0.1 ‰ based on the in-house acetanilide standard and <0.5 ‰ for δ18O (VSMOW) based on the cellulose standard (IAEA-C3).
We performed isotope analyses on whole-plant tissue rather than on cellulose extracts. In living Sphagnum samples, there is a strong linear relationship between the isotopic composition of these two components for both δ13C (R2 values 0.89–0.96; Kaislahti Tillman et al., 2010; Ménot and Burns, 2001; Skrzypek et al., 2007b) and for δ18O (R2 values 0.53–0.69; Kaislahti Tillman et al., 2010; Jones et al., 2014). Focussing on whole-plant tissue allowed us to analyse a higher number of samples for this study, allowing larger numbers of sites and more replication.
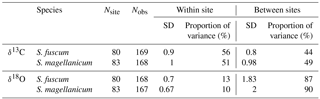
Table 1Sample sizes, standard variation and overall partitioning of measured variation for each species and response (δ13C and δ18O). Nsite is the number of sites and Nobs the total sample size. Standard deviation of the responses is given for within and between sites, together with the proportion of total variance measured between sites and within sites.
2.3 Environmental variables
The modelled δ18O signal in meteoric water (precipitation) (Bowen and Wilkinson, 2002) was obtained from http://www.waterisotopes.org (last access: 2 October 2017) as annual and monthly isotope ratio estimates at 10 arcmin resolution. These global estimates have shown to be highly accurate (R2=0.76 for mean annual δ18O in precipitation) and are based on absolute latitude and elevation and account for regional effects on atmospheric circulation patterns (for details see Bowen, 2010, 2017; IAEA/WMO, 2015). To test which temporal period of δ18O values in precipitation showed the highest correlation with tissue δ18O values, we calculated annual (January–December), growing season (May–October) and winter–spring (January–April) mean isotope ratio. We calculated both unweighted and weighted means against precipitation for each month. Monthly precipitation (PRECTOTCORR), land evapotranspiration (EVLAND) and surface air temperature (TLML) for each site and year of sampling (2013 or 2014) were retrieved from the NASA GESDISC data archive, land surface and flux diagnostics products (M2T1NXLND, M2TMNXFLX; resolution longitude 0.667∘, latitude 0.5∘; Global Modeling and Assimilation Office, 2015a, b). Total precipitation and evapotranspiration (ET), and mean temperature, from April to October were used as predictors in the statistical models. As ET can be compensated for by precipitation, we used the ET/P quotient as a predictor for the effect of water loss. A high value (>1) indicates a net loss of water to the atmosphere. Site altitude was retrieved from a global database using the R package elevatr (ver 0.1-2, Hollister and Shah, 2017).
The distance from the moss surface to the water table (HWT) was measured using water wells (commonly a PVC pipe, 2–5 cm in diameter and slotted or perforated along the sides) with a “plumper” (a cylinder on a string that makes a “plump” sound when it hits the water surface) or a “bubbler” (a narrow tube that makes bubbles when it hits the water surface while the user blows into it). HWT was measured in the spring and in the autumn and there was a strong correlation between the two time points (r=0.74). As growth mainly occurs in late summer to autumn in temperate and boreal regions, we used HWT at the end of the season as the proxy of relative HWT between sites.
2.4 Moss growth
Moss growth (or productivity, NPP) was measured with a modified version of the cranked wire method (see Clymo, 1970; Rydin and Jeglum, 2013 for details), with bristles from a paint brush spirally attached to a wire. These “brush wires” were inserted in the moss layer with the end of the wire protruding above the surface. Height increment (i.e. vertical growth) was measured over the growing season as the change in distance (to nearest millimetres) between the moss layer and the top of the wire. A minimum of three wires were inserted within a 1×1 m uniform area (same microhabitat, vegetation and general structure). To determine moss bulk density (kg m−3), we dried (24 h at 60–65 ∘C) the top 30 mm of the stems (area 78 cm2) in our collected core (see Sect. 2.1). Biomass growth on an area basis (g m−2 yr−1) was calculated as height increment × bulk density.
2.5 Statistical analyses
To test and quantify the influence of environmental variables and species identity on isotope composition, we used linear mixed models in R (R core team, 2016), employing the R package lme4 ver 1.1-12 (Bates et al., 2015). Site dependence (i.e. multiple samples from the same site) was accounted for by adding site as a random factor. For tissue δ13C, we first fitted two separate models to test the independent effects of HWT, NPP and species identity (S. fuscum and S. magellanicum), and whether the HWT or NPP effect varied between species by fitting a species interaction term. To test the explanatory power of environmental variables (ET/P, precipitation, temperature, elevation) we first constructed a base model with HWT and NPP, as they were identified as the main predictors in literature. For simplicity we removed negligible interactions from this model. Each environmental variable and its interaction with species was then tested against the base model. For tissue δ18O, we first explored which temporal period of modelled δ18Oprecip (annual, growing season, winter–spring) had the highest explanatory power and whether the relationship varied between species. The identified best model was then used as the base model to separately test each environmental variable (HWT, ET/P, precipitation, temperature) and its interaction with the species.
The proportion of variance explained by the predictors was calculated at the site level (Gelman and Hill, 2007) or as marginal R2 (Nakagawa and Schielzeth, 2013; R package piecewiseSEM ver 1.1-4; Lefcheck, 2016). Although our study focused on explained variance by predictors, we also performed statistical tests of predictors and their interactions using type-2 (main effects tested after all the others in the model but without the interaction term) F tests, applying Kenward–Roger adjustments to the degrees of freedom, as implemented in the car package (ver. 2.1-3, Fox and Weisberg, 2011). Standard model checking was performed (e.g. residual analyses and distribution of random effects) to ensure compliance with model assumptions. Covariances between predictors were small (r<0.15) or moderate (r=0.40–0.50 between ET/P, precipitation and temperature) and this multicollinearity had minor impact on model estimates.
Table 2Results from linear mixed models for δ13C values. Statistical tests are based on type-2 F test using Kenward–Roger-adjusted degrees of freedom. The second model only included S. magellanicum. Elevation (m a.s.l.) and the three climatic variables (growing season sums and means: ET/P, P in millimetres, temperature in degrees Celcius) were tested one by one in the model including HWT (height above the water table in centimetres), species and NPP (g m−2 yr−1). For simplicity, the negligible HWT×NPP term was dropped from this model (P=0.36). Estimated effects (± SEs) are only given for the main effects if interactions were considered negligible. These effects are slopes for continuous variables (all variables except species) and for species (categorical) the difference between S. magellanicum and S. fuscum (i.e. S. fuscum being the reference level). In the presence of an interaction between HWT and species, the species effect was estimated at mean HWT. is explained between-site variance; is explained total variance.
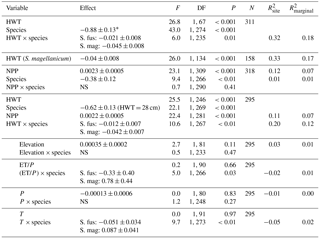
* The effect of S. magellanicum compared to S. fuscum at HWT 28 cm.
Data collection from a geographically broad area resulted in large variation of isotope values and explanatory variables (Table S2). Due to uncertainty in height increment measurement we recorded a few negative values resulting in negative NPP. These values were kept in the analyses. The means and standard deviations (in parenthesis) of height increment (HI, millimetres) were 14.3 (10.1) for S. fuscum and 19.5 (14.1) for S. magellanicum, and the means and standard deviations of bulk density (BD, kg m−3) were 17.8 (9.9) for S. fuscum and 10.2 (7.6) for S. magellanicum.
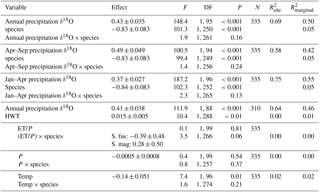
Table 3Results from linear mixed models for δ18O values. Statistical tests are based on type-2 F test using Kenward–Roger-adjusted degrees of freedom. Three time periods for modelled δ18O values (‰) in precipitation were tested individually: annual mean, growing season (April–September) and spring (January–April). The three climatic variables (growing season sums and mean: ET/P, P (mm), temp [∘C]) were tested one by one in a model including HWT (cm) and mean annual δ18O values). Estimated effects (± SEs) are only given for the main effects if interactions were considered negligible. These effects are slopes for continuous variables (all variables except species) and for species (categorical) the difference between S. magellanicum and S. fuscum (i.e. S. fuscum being the reference level). is explained between-site variance; is explained total variance.
3.1 δ13C signal
Variation in Sphagnum tissue δ13C values was marginally greater within sites than between sites (Table 1). HWT predicted the δ13C values, but the relationship differed between the two species (Table 2, Fig. 2). Although δ13C values decreased with increasing HWT for both species, the slope was less steep for S. fuscum and this species had slightly higher δ13C values overall. In separate models for the two species, HWT for S. fuscum had near-zero explanatory power, while for S. magellanicum HWT explained 33 % of the between-site variation and 17 % of the total variance (i.e. marginal R2).

Figure 2Relationship between height above the water table (HWT, measured at the end of the growing season) and δ13C values in two Sphagnum species sampled across the Holarctic realm. Lines show the pooled regression line in a mixed-effect model. Shaded areas indicate approximate 95 % confidence intervals (2 × SE) of the regression coefficients that do not include the uncertainty of the random effects. Equations: S. fuscum, δ13C = ; S. magellanicum, δ13C = . Nsite=83, Ntotal=311. See also Table 1.
Measured δ13C values were related to moss NPP and δ13C values increased by 0.0023 ‰ (SE: 0.00048) for each milligram of biomass produced per square metres. NPP explained 11 % of the between-site variation in δ13C and 7 % of the total variation. HWT and NPP explained 48 % of the between-site variation of δ13C in S. magellanicum and 24 % of the total variation. Corresponding values for S. fuscum were 6 % and 7 %. Of the additional environmental variables tested, we found weak evidence that ET/P and temperature were positively correlated with δ13C but only for S. magellanicum (Table 2).
3.2 δ18O signal
Sphagnum tissue δ18O values varied more between sites than within sites, and at similar magnitudes and proportions for both species (Table 1). Tissue δ18O values were predicted by the spatially explicit estimates of δ18O value isotope signature in precipitation (Fig. 3, Table 3). Annual mean δ18Oprecip explained 69 % of the variation in δ18Otissue between sites. This was similar to mean winter–spring (January–April) δ18Oprecip values (75 % explained) but higher than the growing season (April–September) δ18Oprecip (58 %). Using precipitation-weighted δ18Oprecip values resulted in lower percentages of explained variance for all three time periods (: annual 52 %, January–April 65 %, April–September 52 %). S. magellanicum had consistently lower δ18O values than S. fuscum (−0.83 ‰), but both species had a similar relationship between tissue δ18O and δ18Oprecip (Fig. 3, Table 3).
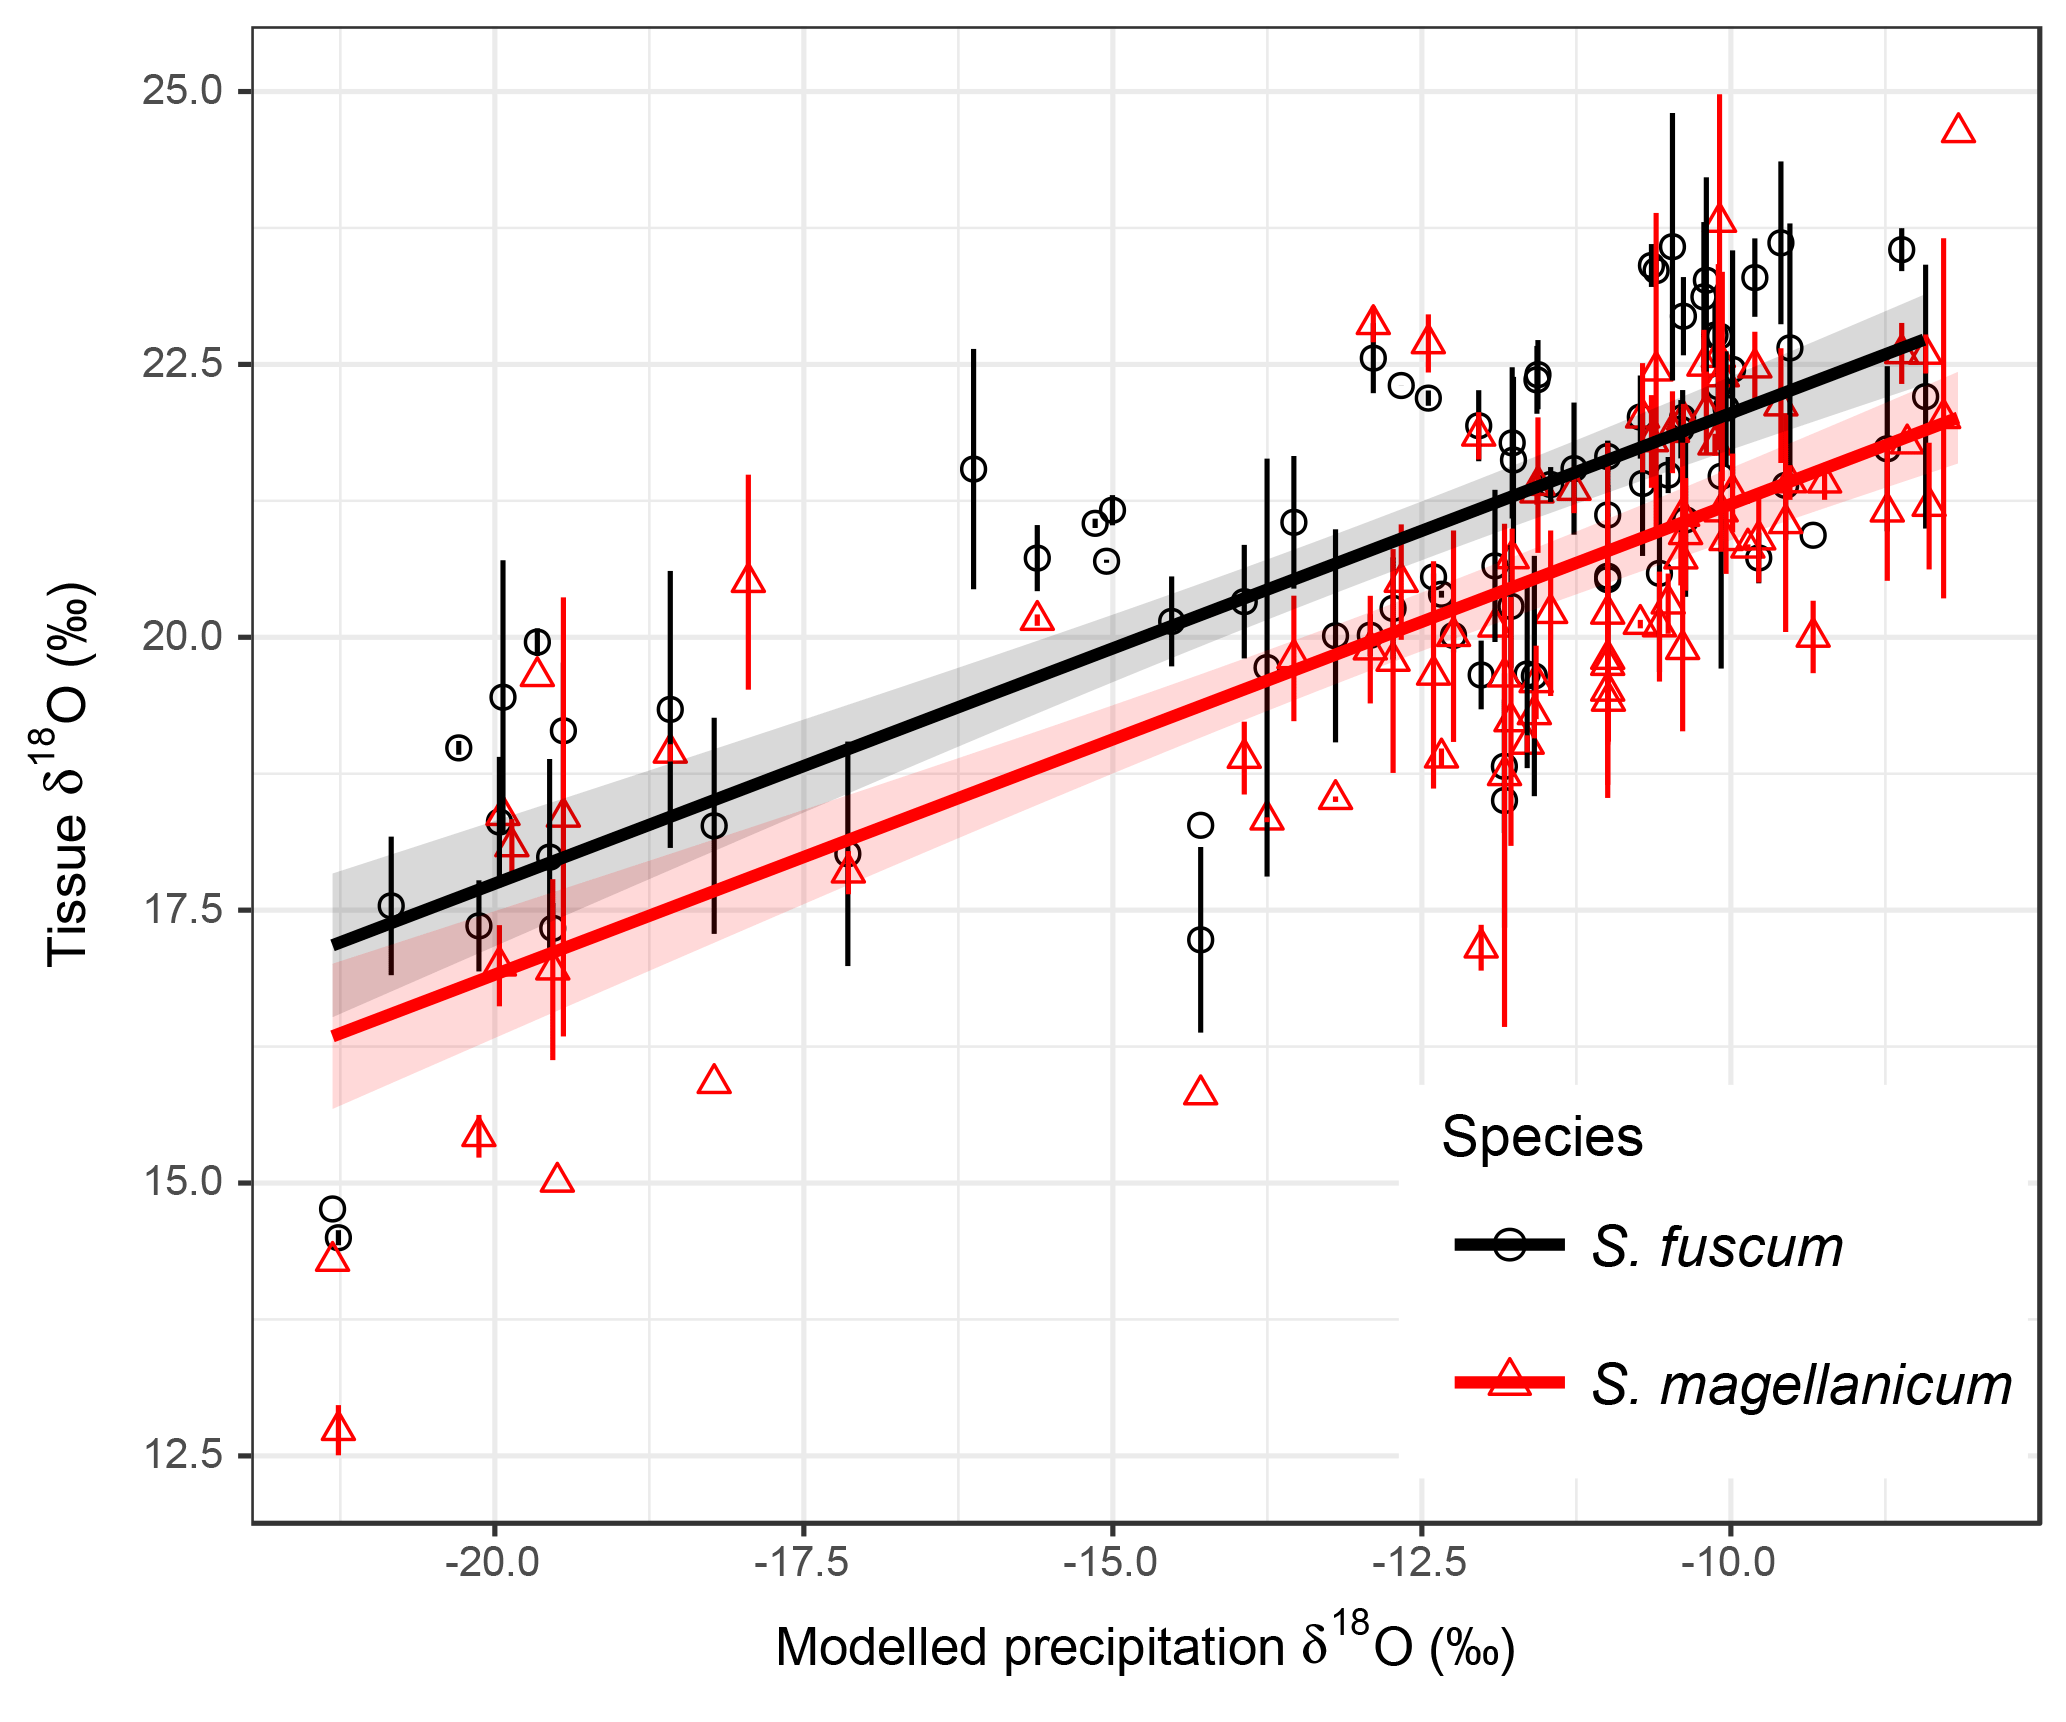
Figure 3Association between modelled annual mean δ18Oprecip values and δ18O values in two Sphagnum species. Data show site means for each species and error bars represent the standard deviation (at some sites only one sample of a species was taken). Regression lines with different intercepts (P<0.001, Table 2) illustrate the relationship between modelled δ18Oprecip and Sphagnum δ18O. Equations: S. fuscum, (n=1–2, Nsite=80); S. magellanicum, (n=1–2, Nsite=83). Shaded areas indicate approximate 95 % confidence intervals (2×SE) of the regression coefficients that do not include the uncertainty of the random effects.
HWT at the end of the growing season was, on average, 11 cm lower in S. magellanicum patches (wetter habitat) compared to S. fuscum (HWT = 33 cm) patches (, P<0.0001). However, we found only very weak support for the hypothesis that HWT predicts tissue δ18O values, as HWT explained <1 % of the δ18O variation (Table 2). There was negligible influence of the additional environmental variables on δ18O values (Table 2). ET/P was associated with higher δ18O values in S. magellanicum and lower in S. fuscum (but not different from the zero effect), while increasing temperature was weakly associated with overall lower δ18O values.
4.1 Stable carbon isotope discrimination in Sphagnum
Our data were consistent with the hypothesis that moss growing closer to the water table (low HWT) has reduced carbon isotope fractionation, leading to greater fixation of 13CO2 and more 13C-enriched tissue (Rice and Giles, 1996; Williams and Flanagan, 1996). Given that the water table position was measured in different places at different times and all are one-time measurements, this result is remarkably robust. For example refixation of 12C-enriched substrate-derived CO2 in living Sphagna (Turetsky and Wieder, 1999; Raghoebarsing et al., 2005) can potentially contribute to within-site variation in δ13C as it potentially affects both the ambient concentration of CO2 as well as its isotopic composition. Interestingly, the strength of the δ13C – HWT relationship differed in the two species, with S. magellanicum exhibiting a greater reduction in δ13C in response to drier conditions (high HWT) than S. fuscum. The weaker effect of HWT on δ13C values in S. fuscum is likely a consequence of limited fluctuation in tissue water content, as this species is well known to store abundant water within capillary spaces and resist drying (Rydin, 1985), thus maintaining the waterfilm that results in reduced fractionation. Loader et al. (2016) reported a similar slope estimate for S. magellanicum in a single peatland, and several studies have confirmed the effects of contrasting microtopography (i.e. hummock – hollow differences) using multi-species comparisons (Price et al., 1997; Loisel et al., 2009; Markel et al., 2010). As such, our results suggest that species-specific differences in carbon isotope discrimination in Sphagnum are related to water retention capacity and, consequently, become more apparent under drier conditions. This supports the results of previous, smaller-scale studies (Rice, 2000).
The influence of species identity on the relationship between δ13C values and water table position has important implications for palaeoenvironmental reconstructions based on δ13C values. The relationship between δ13C and HWT has been used in palaeoecological reconstructions of surface wetness (e.g. Loisel et al., 2009). In our data set the strength of the relationship was weaker than previously reported. For instance, Loader et al. (2016) reported R2=54 % for S. magellanicum in a single site. Given the characteristics of our data (large-scale, circumpolar), the explanatory power ( %) can be considered acceptable and comparable to other proxies such as testate amoebae (16 % in Loader et al., 2016; Sullivan and Booth, 2011). Our results imply that isotopic signals of peatland wetness in hummock-dwelling species (such as S. fuscum) may be weaker or absent compared to lawn species. It is therefore important that the same species or species type (e.g. lawn species as they likely have a broad HWT niche) is used if δ13C values are employed as a proxy to infer changes in HWT.
We also identified evidence that evapotranspiration (ET) and NPP modify δ13C values, although the effect of ET was weak and restricted to S. magellanicum. We expected a stronger relationship, as ET and temperature control δ13C by increasing water loss at the moss surface and reducing the diffusive resistance (i.e. reducing CO2 limitation), enabling increased discrimination against 13C (Williams and Flanagan, 1996). NPP only explained a small proportion of the variation in δ13C values, but the relationship was apparent across species. Several studies have proposed the use of δ13C values to infer Sphagnum productivity (e.g. Rice and Giles, 1996; Rice, 2000; Munir et al., 2017) and our study is the first to test this at the pan-Holarctic scale. Deane-Coe et al. (2015) investigated δ13C values across moss species (including Sphagnum) and years at one site and found a weak relationship between productivity and δ13C values (R2=0.10 and 0.31). Similarly, Rice (2000) reported that the relative growth rate explained about 25 % of the variation in 13C discrimination. We did not find as strong a relationship (R2<0.12), but our study was geographically broader and less controlled; consequently, our results were likely influenced by more complex interactions among environmental factors that affect Sphagnum growth across our sites. Nevertheless, our results indicate independent effects of evaporation and productivity on δ13C values. The lack of a strong NPP pattern somewhat limits the ability to infer productivity of Sphagnum in palaeoecological studies.
4.2 Global patterns of δ18O values in Sphagnum
Modelled δ18O values in precipitation (Bowen, 2010) explained much of the variation in δ18Otissue values between sites (R2=68 % for annual mean δ18Oprecip). The percent variance explained was even higher if the spring period for modelled 18Oprecip was used but was lower for the growing season average. This result does not necessarily mean that spring season water was utilized by the plants during the growing season. Between-site variation in 18Oprecip values are much larger in the winter (Fig. S1), more effectively discriminating maritime and continental regions (Bowen, 2010). The better fit may simply be an effect of a more distinct separation of 18Oprecip in the winter data. Although the δ18Otissue−18Oprecip relationship presented here is robust, a few δ18O values are less well predicted by the regression model and they originate from Northwest Territories (Canada) and West Siberia (Russia). Likely, this suggests that the 18Oprecip model is less accurate in these interior regions with fewer precipitation collection stations.
In contrast, the data did not support a negative correlation between precipitation amount and δ18Otissue values and δ18Otissue values were only weakly affected by predictors associated with water loss (ET/P and/or temperature) and species identity. The indication of 18O enrichment in S. magellanicum due to ET/P was expected as the lighter isotope 16O needs less energy to vaporize. However, the opposite trend was suggested for S. fuscum, and surprisingly, higher surface temperatures decreased 18O enrichment. Hence we conclude that climatic variables associated with water loss were weak predictors after controlling for δ18Oprecip values. This result may not be too unexpected as laboratory experiments have so far failed to relate 18O enrichment in Sphagnum to differences in evaporation rates (Brader et al., 2010).
There have been few regional studies on moss δ18Otissue values that span gradients of δ18Oprecip values (Royles et al., 2016; Skrzypek et al., 2010) and most interpretations of moss δ18Otissue – climate relationships come from peat core studies (e.g. van der Knaap et al., 2011). In Antarctic non-Sphagnum peat banks variation in δ18Ocellulose values tracked δ18O values in moss water across a latitudinal gradient (61–65∘ S) despite a lack of difference in δ18Oprecip. This result led Royles et al. (2016) to suggest that moss water and tissue δ18O values are better temporal integrators of source water than point rainfall measurements. The authors interpreted site-to-site differences as relating to differential evaporative enrichment and other physio-chemical factors that affect 18O exchange, fixation and biochemical synthesis. Skrzypek et al. (2010) explored variation in Sphagnum δ18Otissue values across a regional altitudinal gradient and found no consistent trend or significant relationship linking δ18Otissue values to altitude, where δ18O in source water is expected to differ. Although fractionation in source water caused by adiabatic cooling with altitude should lead to altitudinal effects, differences in precipitation amount can confound this pattern (Gat et al., 2000). Unfortunately, there are limited regional studies that have tested the effects of variation in source water on δ18Otissue values. The present study provides a much greater range of geographical and environmental variation and shows strong support for Sphagnum strongly tracking source water.
Interestingly, the relationship between δ18Otissue and δ18Oprecip values detected here is very similar to that proposed some time ago by Epstein et al. (1977); (note that Jones et al., 2014, show high correspondence between δ18Ocellulose and δ18Otissue values). However, our data suggest a slightly steeper slope and lower intercept, particularly for S. magellanicum. The species effect on δ18O suggests a difference in the degree of evaporation from the plant surface prior to the uptake of water. The lower δ18O values for S. magellanicum compared to S. fuscum (−0.83 ‰) is comparable to the results from bogs in Canada for the same species (−2.2 ‰, Aravena and Warner, 1992) and between a hollow and a hummock species in the Netherlands (−2 ‰, Brenninkmeijer et al., 1982). This suggests that the absorbed water in S. magellanicum was subject to less evaporation. In Sphagnum plants, surface water is largely affected by capillarity, water storage and reducing conductance with compact morphology. Plant traits that enhance these functions are more pronounced in species and individuals found at high HWT as these characteristics maintain high tissue water content (Hayward and Clymo, 1982; Laing et al., 2014; Waddington et al., 2015). Consequently, during droughts, Sphagnum species growing close to the water table will dry out quickly as the evaporative demand cannot be balanced, and simultaneously photosynthesis is shut down. Sphagnum species higher above the water table wick water from below and store water effectively, thereby remaining photosynthetically active while water is lost due to evaporation. This mechanism would result in 18O enrichment being higher above the water table (Brenninkmeijer et al., 1982; Aravena and Warner, 1992) and explains the positive relationship between HWT and δ18O in S. magellanicum reported by Loader et al. (2016) along a 10 m transect. We found a weak positive relationship of δ18O with HWT, which suggests that HWT cannot entirely explain species-specific differences in 18O enrichment. Instead, this can be attributed to lower water retention (i.e. higher evaporation at the same water deficit) in S. magellanicum compared to S. fuscum (Clymo, 1973; McCarter and Price, 2014). Although species differences in 18O have been reported (Aravena and Warner, 1992; Zanazzi and Mora, 2005; Bilali et al., 2013), our study suggests that the species-specific δ18O signals may not simply be a consequence of growing at different HWT but can rather reflect distinct water retention capacity in these species.
The strong influence of δ18Oprecip values and, to a much lesser extent, environmental variables related to water loss, combined with a relatively small within-site variation in δ18Otissue values, suggest that macroclimatic drivers, such as precipitation inputs, largely determine the δ18O value of peatland moss tissue. These results are promising for the use of oxygen isotopes in large-scale palaeoecological reconstructions from peat cores (Ellis and Rochefort, 2006; Chambers et al., 2012; Daley et al., 2010), although a better understanding of O isotope fractionation within tissue components and their decay relationships would improve their utility. Moreover, the simple relationships presented here can potentially be utilized to trace changes in δ18Oprecip values that mirror climate variability.
Our study provides new insights into large-scale variation in Sphagnum tissue isotopic signature and suggests that isotopic composition can be used for climatic reconstructions. We show a close link between precipitation and tissue δ18O values and conclude that variation in δ18O values are mainly driven by the macroclimate, but species differences exist. In contrast, δ13C values were strongly related to local microtopography, while the influence of macroclimate was negligible. As suggested in earlier studies, δ13C values were also weakly associated with NPP. These conclusions were most strongly supported for the cosmopolitan S. magellanicum complex and species identity should be accounted for in future carbon isotope studies to avoid spurious conclusions.
Data and R-script used to reproduce results are available on Figshare, https://doi.org/10.6084/ m9.figshare.6969497 (Granath et al., 2018).
The supplement related to this article is available online at: https://doi.org/10.5194/bg-15-5189-2018-supplement.
SKR, GG and HR initiated the study and formulated the research objectives. All authors were involved in data collection and SKR, NB, KP, AV and DPG performed the isotope analyses. GG performed the statistical analyses and wrote the first draft with input from SKR and HR. All authors read and commented on the manuscript and approved the final version.
The authors declare that they have no conflict of interest.
To the memory of coauthor and Sphagnum enthusiast Maria Noskova, who
passed away tragically before this paper was finished. We thank Union
College and the US National Science Foundation for providing funding for
Union isotope ratio mass spectrometer and peripherals (NSF-MRI #1229258)
and Sarah Katz for laboratory assistance. The project was supported by the
Swedish Research Council (2015-05174), the Russian Science Foundation (grant
14-14-00891), the Russian Foundation for Basic Research (research projects
nos. 14-05-00775, 15-44-00091 and 16-55-16007), University of Ferrara (FAR
2013 and 2014), the Polish National Centre for Research and Development
(within the Polish-Norwegian Research Programme: the project WETMAN (Central
European Wetland Ecosystem Feedbacks to Changing Climate Field Scale
Manipulation) Project ID: 203258), the National Science Centre, Poland (ID:
2015/17/B/ST10/01656), institutional research funds from the Estonian
Ministry of Education and Research (grant IUT34-7), the Natural Sciences and
Engineering Research Council of Canada Discovery Grants program awarded to
Jennifer L. Baltzer, an NSERC Strategic Grant, and with generous support
awarded to Lorna I. Harris from the W. Garfield Weston Foundation Fellowship for Northern
Conservation, administered by Wildlife Conservation Society (WCS) Canada, and
National Science Foundation (NSF-1312402) to Susan M. Natali. We acknowledge the Adirondack and Maine offices of The Nature
Conservancy, the Autonomous Province of Bolzano (Italy), Staatsbosbeheer and
Landschap Overijssel (the Netherlands), the Greenwoods Conservancy, NY and
the University of Maine for access to field sites.
Edited by: Marcel van der Meer
Reviewed by:
Julie Loiesel and one anonymous referee
Aravena, R. and Warner, B. G.: Oxygen-18 composition of Sphagnum, and microenvironmental water relations, Bryologist, 95, 445–448, 1992.
Bates, D., Mächler, M., Bolker, B., and Walker, S.: Fitting Linear Mixed-Effects Models Using lme4, J. Stat. Softw., 67, https://doi.org/10.18637/jss.v067.i01, 2015.
Bilali, H. E., Patterson, R. T., and Prokoph, A.: A Holocene paleoclimate reconstruction for eastern Canada based on δ18O cellulose of Sphagnum mosses from Mer Bleue Bog, Holocene, 23, 1260–1271, https://doi.org/10.1177/0959683613484617, 2013.
Bowen, G. J.: Isoscapes: spatial pattern in isotopic biogeochemistry, Annu. Rev. Earth Pl. Sc., 38, 161–187, https://doi.org/10.1146/annurev-earth-040809-152429, 2010.
Bowen, G. J.: Gridded maps of the isotopic composition of meteoric waters, available at: http://www.waterisotopes.org (last access: 17 September 2017), 2017.
Bowen, G. J. and Wilkinson, B.: Spatial distribution of δ18O in meteoric precipitation, Geology, 30, 315–318, https://doi.org/10.1130/0091-7613(2002)030<0315:SDOOIM>2.0.CO;2, 2002.
Brader, A. V., van Winden, J. F., Bohncke, S. J. P., Beets, C. J., Reichart, G.-J., and de Leeuw, J. W.: Fractionation of hydrogen, oxygen and carbon isotopes in n-alkanes and cellulose of three Sphagnum species, Org. Geochem., 41, 1277–1284, https://doi.org/10.1016/j.orggeochem.2010.09.006, 2010.
Brenninkmeijer, C. A. M., van Geel, B., and Mook, W. G.: Variations in the D ∕ H and 18O ∕ 16O ratios in cellulose extracted from a peat bog core, Earth Planet. Sc. Lett., 61, 283–290, https://doi.org/10.1016/0012-821X(82)90059-0, 1982.
Chambers, F. M., Booth, R. K., De Vleeschouwer, F., Lamentowicz, M., Le Roux, G., Mauquoy, D., Nichols, J. E., and van Geel, B.: Development and refinement of proxy-climate indicators from peats, Quaternary Int., 268, 21–33, https://doi.org/10.1016/j.quaint.2011.04.039, 2012.
Clymo, R. S.: The growth of Sphagnum?: Methods of measurement, J. Ecol., 58, 13–49, 1970.
Clymo, R. S.: The growth of Sphagnum?: Some effects of environment, J. Ecol., 61, 849–869, 1973.
Daley, T. J., Barber, K. E., Street-Perrott, F. A., Loader, N. J., Marshall, J. D., Crowley, S. F., and Fisher, E. H.: Holocene climate variability revealed by oxygen isotope analysis of Sphagnum cellulose from Walton Moss, northern England, Quaternary Sci. Rev., 29, 1590–1601, https://doi.org/10.1016/j.quascirev.2009.09.017, 2010.
Dawson, T. E., Mambelli, S., Plamboeck, A. H., Templer, P. H. and Tu, K. P.: Stable isotopes in plant ecology, Annu. Rev. Ecol. Syst., 33, 507–559, https://doi.org/10.1146/annurev.ecolsys.33.020602.095451, 2002.
Deane-Coe, K. K., Mauritz, M., Celis, G., Salmon, V., Crummer, K. G., Natali, S. M., and Schuur, E. A. G.: Experimental warming alters productivity and isotopic signatures of tundra mosses, Ecosystems, 18, 1070–1082, https://doi.org/10.1007/s10021-015-9884-7, 2015.
Ellis, C. J. and Rochefort, L.: Long-term sensitivity of a High Arctic wetland to Holocene climate change, J. Ecol., 94, 441–454, https://doi.org/10.1111/j.1365-2745.2005.01085.x, 2006.
Epstein, S., Thompson, P., and Yapp, C. J.: Oxygen and hydrogen isotopic ratios in plant cellulose, Science, 198, 1209–1215, https://doi.org/10.1126/science.198.4323.1209, 1977.
Farquhar, G. D., Ehleringer, J. R., and Hubick, K. T.: Carbon isotope discrimination and photosynthesis, Annu. Rev. Plant Phys., 40, 503–537, https://doi.org/10.1146/annurev.pp.40.060189.002443, 1989.
Finsinger, W., Schoning, K., Hicks, S., Lücke, A., Goslar, T., Wagner-cremer, F., and Hyyppä, H.: Climate change during the past 1000 years: a high-temporal-resolution multiproxy record from a mire in northern Finland, J. Quaternary Sci., 28, 152–164, https://doi.org/10.1002/jqs.2598, 2013.
Flatberg, K. I.: Norges torvmoser, Akad. Forl, Oslo, 2013.
Fox, J. and Weisberg, S.: An R companion to applied regression, 2nd Edn., SAGE Publications, Thousand Oaks, Calif., 2011.
Gat, J. R., Mook, W. G., and Meijer Harro, A. J.: Observed isotope effects in precipitation. Environmental Isotopes in the Hydrological Cycle: Principles and Applications, International Atomic Energy Agency and United Nations Educational, Scientific and Cultural Organization, 2, 197–207, 2000.
Gelman, A. and Hill, J.: Data analysis using regression and multilevel/hierarchical models, Cambridge University Press, Cambridge, New York, 2007.
Gessler, A., Ferrio, J. P., Hommel, R., Treydte, K., Werner, R. A., and Monson, R. K.: Stable isotopes in tree rings: towards a mechanistic understanding of isotope fractionation and mixing processes from the leaves to the wood, Tree Physiol., 34, 796–818, https://doi.org/10.1093/treephys/tpu040, 2014.
Global Modeling and Assimilation Office (GMAO): MERRA2 tavg1_2d_flx_Nx: 2d,1-Hourly,Time-Averaged,Single-Level,Assimilation,Surface Flux Diagnostics V5.12.4, NASA Goddard Earth Sciences Data and Information Services Center, Greenbelt, MD, USA, 2015a.
Global Modeling and Assimilation Office (GMAO): MERRA2 tavg1_2d_lnd_Nx: 2d,1-Hourly,Time-Averaged,Single-Level,Assimilation,Land Surface Diagnostics V5.12.4, NASA Goddard Earth Sciences Data and Information Services Center, Greenbelt, MD, USA, 2015b.
Granath, G., Rydin, H., Baltzer, J. L., Bengtsson, F., Boncek, N., Bragazza, L., Bu, Z.-J., Caporn, S. J. M., Dorrepaal, E., Galanina, O., Gałka, M., Ganeva, A., Gillikin, D. P., Goia, I., Goncharova, N., Hájek, M., Haraguchi, A., Harris, L. I., Humphreys, E., Jiroušek, M., Kajukało, K., Karofeld, E., Koronatova, N. G., Kosykh, N. P., Lamentowicz, M., Lapshina, E., Limpens, J., Linkosalmi, M., Ma, J.-Z., Mauritz, M., Munir, T. M., Natali, S., Natcheva, R., Noskova, M., Payne, R. J., Pilkington, K., Robinson, S., Robroek, B. J. M., Rochefort, L., Singer, D., Stenøien, H. K., Tuittila, E.-S., Vellak, K., Verheyden, A., Waddington, J. M., and Rice, S. K.: Data from: Environmental and taxonomic controls of carbon and oxygen stable isotope composition in Sphagnum across broad climatic and geographic ranges, https://doi.org/10.6084/m9.figshare.6969497, 2018.
Hassel, K., Kyrkjeeide, M. O., Yousefi, N., Prestø, T., Stenøien, H. K., Shaw, A. J., and Flatberg, K. I.: Sphagnum divinum (sp. nov.) and S. medium Limpr. and their relationship to S. magellanicum Brid., J. Bryol., 40, 197–222, https://doi.org/10.1080/03736687.2018.1474424, 2018.
Hayward, P. M. and Clymo, R. S.: Profiles of water content and pore size in Sphagnum and peat, and their relation to peat bog ecology, P. Roy. Soc. Lond. B Bio., 215, 299–325, 1982.
Hollister, J. W. and Shah, T.: Elevatr: Access elevation data from various APIs, CRAN, version 0.1.4, available at: https://CRAN.R-project.org/package=elevatr (last access: 28 August 2018), 2017.
Hunsinger, G. B., Hagopian, W. M., and Jahren, A. H.: Offline oxygen isotope analysis of organic compounds with high N : O, Rapid Commun. Mass Sp., 24, 3182–3186, https://doi.org/10.1002/rcm.4752, 2010.
IAEA/WMO: Global Network of Isotopes in Precipitation, The GNIP Database, 2015.
Jones, M. C., Wooller, M., and Peteet, D. M.: A deglacial and Holocene record of climate variability in south-central Alaska from stable oxygen isotopes and plant macrofossils in peat, Quaternary Sci. Rev., 87, 1–11, https://doi.org/10.1016/j.quascirev.2013.12.025, 2014.
Kaislahti Tillman, P., Holzkämper, S., Kuhry, P., Sannel, A. B. K., Loader, N. J., and Robertson, I.: Stable carbon and oxygen isotopes in Sphagnum fuscum peat from subarctic Canada: Implications for palaeoclimate studies, Chem. Geol., 270, 216–226, https://doi.org/10.1016/j.chemgeo.2009.12.001, 2010.
Kaislahti Tillman, P., Holzkämper, S., Andersen, T. J., Hugelius, G., Kuhry, P., and Oksanen, P.: Stable isotopes in Sphagnum fuscum peat as late-Holocene climate proxies in northeastern European Russia, Holocene, 23, 1381–1390, https://doi.org/10.1177/0959683613489580, 2013.
Kyrkjeeide, M. O., Hassel, K., Stenøien, H. K., Prestø, T., Boström, E., Shaw, A. J., and Flatberg, K. I.: The dark morph of Sphagnum fuscum (Schimp.) H.Klinggr. in Europe is conspecific with the North American S. beothuk, J. Bryol., 37, 251–266, https://doi.org/10.1179/1743282015Y.0000000020, 2015.
Kyrkjeeide, M. O., Hassel, K., Flatberg, K. I., Shaw, A. J., Yousefi, N., and Stenøien, H. K.: Spatial genetic structure of the abundant and widespread peatmoss Sphagnum magellanicum Brid., PLOS ONE, 11, e0148447, https://doi.org/10.1371/journal.pone.0148447, 2016.
Laing, C. G., Granath, G., Belyea, L. R., Allton, K. E., and Rydin, H.: Tradeoffs and scaling of functional traits in Sphagnum as drivers of carbon cycling in peatlands, Oikos, 123, 817–828, https://doi.org/10.1111/oik.01061, 2014.
Lamentowicz, M., Gałka, M., Lamentowicz, Ł., Obremska, M., Kühl, N., Lücke, A., and Jassey, V. E. J.: Reconstructing climate change and ombrotrophic bog development during the last 4000years in northern Poland using biotic proxies, stable isotopes and trait-based approach, Palaeogeogr. Palaeocl., 418, 261–277, https://doi.org/10.1016/j.palaeo.2014.11.015, 2015.
Lefcheck, J. S.: piecewiseSEM: Piecewise structural equation modelling in R for ecology, evolution, and systematics, Methods Ecol. Evol., 7, 573–579, https://doi.org/10.1111/2041-210X.12512, 2016.
Limpens, J., Robroek, B. J. M., Heijmans, M. M. P. D., and Tomassen, H. B. M.: Mixing ratio and species affect the use of substrate-derived CO2 by Sphagnum, J. Veg. Sci., 19, 841–848, https://doi.org/10.3170/2008-8-18456, 2008.
Loader, N. J., McCarroll, D., van der Knaap, W. O., Robertson, I., and Gagen, M.: Characterizing carbon isotopic variability in Sphagnum, Holocene, 17, 403–410, 2007.
Loader, N. J., Street-Perrott, F. A., Mauquoy, D., Roland, T. P., van Bellen, S., Daley, T. J., Davies, D., Hughes, P. D. M., Pancotto, V. O., Young, G. H. F., Amesbury, M. J., Charman, D. J., Mallon, G., and Yu, Z. C.: Measurements of hydrogen, oxygen and carbon isotope variability in Sphagnum moss along a micro-topographical gradient in a southern Patagonian peatland, J. Quaternary Sci., 31, 426–435, https://doi.org/10.1002/jqs.2871, 2016.
Loisel, J., Garneau, M., and Hélie, J.-F.: Modern Sphagnum δ13C signatures follow a surface moisture gradient in two boreal peat bogs, James Bay lowlands, Québec, J. Quaternary Sci., 24, 209–214, https://doi.org/10.1002/jqs.1221, 2009.
Loisel, J., Yu, Z., Beilman, D. W., Camill, P., Alm, J., Amesbury, M. J., Anderson, D., Andersson, S., Bochicchio, C., Barber, K., Belyea, L. R., Bunbury, J., Chambers, F. M., Charman, D. J., De Vleeschouwer, F., Fia kiewicz-Kozie, B., Finkelstein, S. A., Gaka, M., Garneau, M., Hammarlund, D., Hinchcliffe, W., Holmquist, J., Hughes, P., Jones, M. C., Klein, E. S., Kokfelt, U., Korhola, A., Kuhry, P., Lamarre, A., Lamentowicz, M., Large, D., Lavoie, M., MacDonald, G., Magnan, G., Makila, M., Mallon, G., Mathijssen, P., Mauquoy, D., McCarroll, J., Moore, T. R., Nichols, J., O'Reilly, B., Oksanen, P., Packalen, M., Peteet, D., Richard, P. J., Robinson, S., Ronkainen, T., Rundgren, M., Sannel, A. B. K., Tarnocai, C., Thom, T., Tuittila, E.-S., Turetsky, M., Valiranta, M., van der Linden, M., van Geel, B., van Bellen, S., Vitt, D., Zhao, Y., and Zhou, W.: A database and synthesis of northern peatland soil properties and Holocene carbon and nitrogen accumulation, Holocene, 24, 1028–1042, https://doi.org/10.1177/0959683614538073, 2014.
Markel, E. R., Booth, R. K., and Qin, Y.: Testate amoebae and δ13C of Sphagnum as surface-moisture proxies in Alaskan peatlands, Holocene, 20, 463–475, https://doi.org/10.1177/0959683609354303, 2010.
McCarter, C. P. R. and Price, J. S.: Ecohydrology of Sphagnum moss hummocks: mechanisms of capitula water supply and simulated effects of evaporation, Ecohydrology, 7, 33–44, https://doi.org/10.1002/eco.1313, 2014.
Ménot, G. and Burns, S. J.: Carbon isotopes in ombrogenic peat bog plants as climatic indicators: calibration from an altitudinal transect in Switzerland, Org. Geochem., 32, 233–245, https://doi.org/10.1016/S0146-6380(00)00170-4, 2001.
Menot-Combes, G., Combes, P.-P., and Burns, S. J.: Climatic information from δ13C in plants by combining statistical and mechanistic approaches, Holocene, 14, 931–939, https://doi.org/10.1191/0959683604hl771rp, 2004.
Moschen, R., Kühl, N., Rehberger, I., and Lücke, A.: Stable carbon and oxygen isotopes in sub-fossil Sphagnum: Assessment of their applicability for palaeoclimatology, Chem. Geol., 259, 262–272, https://doi.org/10.1016/j.chemgeo.2008.11.009, 2009.
Munir, T. M., Khadka, B., Xu, B., and Strack, M.: Mineral nitrogen and phosphorus pools affected by water table lowering and warming in a boreal forested peatland, Ecohydrology, 10, e1893, https://doi.org/10.1002/eco.1893, 2017.
Nakagawa, S. and Schielzeth, H.: A general and simple method for obtaining R2 from generalized linear mixed-effects models, Methods Ecol. Evol., 4, 133–142, https://doi.org/10.1111/j.2041-210x.2012.00261.x, 2013.
O'Leary, M. H.: Carbon isotopes in photosynthesis, Bioscience, 38, 328–336, 1988.
Price, G. D., McKenzie, J. E., Pilcher, J. R., and Hoper, S. T.: Carbon-isotope variation in Sphagnum from hummock-hollow complexes: implications for Holocene climate reconstruction, Holocene, 7, 229–233, https://doi.org/10.1177/095968369700700211, 1997.
Raghoebarsing, A. A., Smolders, A. J. P., Schmid, M. C., Rijpstra, W. I. C., Wolters-Arts, M., Derksen, J., Jetten, M. S. M., Schouten, S., Damste, J. S. S., Lamers, L. P. M., Roelofs, J. G. M., den Camp, H., and Strous, M.: Methanotrophic symbionts provide carbon for photosynthesis in peat bogs, Nature, 436, 1153–1156, 2005.
R core team: R: a language and environment for statistical computing, R Foundation for Statistical Computing, Vienna, Austria, available at: https://www.R-project.org (last access: 28 August 2018), 2016.
Rice, S. K.: Variation in carbon isotope discrimination within and among Sphagnum species in a temperate wetland, Oecologia, 123, 1–8, 2000.
Rice, S. K. and Giles, L.: The influence of water content and leaf anatomy on carbon isotope discrimination and photosynthesis in Sphagnum, Plant Cell Environ., 19, 118–124, 1996.
Royles, J., Sime, L. C., Hodgson, D. A., Convey, P., and Griffiths, H.: Differing source water inputs, moderated by evaporative enrichment, determine the contrasting δ18OCELLULOSE signals in maritime Antarctic moss peat banks, J. Geophys. Res.-Biogeo., 118, 184–194, https://doi.org/10.1002/jgrg.20021, 2013.
Royles, J., Horwath, A. B., and Griffiths, H.: Interpreting bryophyte stable carbon isotope composition: Plants as temporal and spatial climate recorders, Geochem. Geophy. Geosy., 15, 1462–1475, https://doi.org/10.1002/2013GC005169, 2014.
Royles, J., Amesbury, M. J., Roland, T. P., Jones, G. D., Convey, P., Griffiths, H., Hodgson, D. A., and Charman, D. J.: Moss stable isotopes (carbon-13, oxygen-18) and testate amoebae reflect environmental inputs and microclimate along a latitudinal gradient on the Antarctic Peninsula, Oecologia, 181, 931–945, https://doi.org/10.1007/s00442-016-3608-3, 2016.
Rydin, H.: Effect of water level on desiccation of Sphagnum in relation to surrounding Sphagna, Oikos, 45, 374–379, 1985.
Rydin, H. and Jeglum, J. K.: The Biology of Peatlands, 2nd Edn., Oxford University Press Inc., New York, 2013.
Skrzypek, G., Jezierski, P., and Szynkiewicz, A.: Preservation of primary stable isotope signatures of peat-forming plants during early decomposition – observation along an altitudinal transect, Chem. Geol., 273, 238–249, https://doi.org/10.1016/j.chemgeo.2010.02.025, 2010.
Skrzypek, G., Kałużny, A., and Jędrysek, M. O.: Carbon stable isotope analyses of mosses – Comparisons of bulk organic matter and extracted nitrocellulose, J. Am. Soc. Mass Spectr., 18, 1453–1458, https://doi.org/10.1016/j.jasms.2007.04.020, 2007a.
Skrzypek, G., Kałużny, A., Wojtuń, B., and Jędrysek, M.-O.: The carbon stable isotopic composition of mosses: A record of temperature variation, Org. Geochem., 38, 1770–1781, https://doi.org/10.1016/j.orggeochem.2007.05.002, 2007b.
Sternberg, L., Pinzon, M. C., Anderson, W. T., and Jahren, A. H.: Variation in oxygen isotope fractionation during cellulose synthesis: intramolecular and biosynthetic effects, Plant Cell Environ., 29, 1881–1889, https://doi.org/10.1111/j.1365-3040.2006.01564.x, 2006.
Sullivan, M. E. and Booth, R. K.: The potential influence of short-term environmental variability on the composition of testate amoeba communities in Sphagnum peatlands, Microbiol. Ecol., 62, 80–93, https://doi.org/10.1007/s00248-011-9875-y, 2011.
Turetsky, M. R. and Wieder, K.: Boreal bog Sphagnum refixes soil-produced and respired 14CO2, Écoscience, 6, 587–591, 1999.
van der Knaap, W. O., Lamentowicz, M., van Leeuwen, J. F. N., Hangartner, S., Leuenberger, M., Mauquoy, D., Goslar, T., Mitchell, E. A. D., Lamentowicz, Ł., and Kamenik, C.: A multi-proxy, high-resolution record of peatland development and its drivers during the last millennium from the subalpine Swiss Alps, Quaternary Sci. Rev., 30, 3467–3480, https://doi.org/10.1016/j.quascirev.2011.06.017, 2011.
Waddington, J. M., Morris, P. J., Kettridge, N., Granath, G., Thompson, D. K., and Moore, P. A.: Hydrological feedbacks in northern peatlands, Ecohydrology, 8, 113–127, https://doi.org/10.1002/eco.1493, 2015.
Williams, T. G. and Flanagan, L. B.: Effect of changes in water content on photosynthesis, transpiration and discrimination against 13CO2 and C18O16O in Pleurozium and Sphagnum, Oecologia, 108, 38–46, 1996.
Zanazzi, A. and Mora, G.: Paleoclimatic implications of the relationship between oxygen isotope ratios of moss cellulose and source water in wetlands of Lake Superior, Chem. Geol., 222, 281–291, https://doi.org/10.1016/j.chemgeo.2005.08.006, 2005.