the Creative Commons Attribution 4.0 License.
the Creative Commons Attribution 4.0 License.
 | 27 Aug 2018
Modulation of the vertical particle transfer efficiency in the oxygen minimum zone off Peru
Marine Bretagnon
Aurélien Paulmier
Véronique Garçon
Boris Dewitte
Séréna Illig
Nathalie Leblond
Laurent Coppola
Fernando Campos
Federico Velazco
Christos Panagiotopoulos
Andreas Oschlies
J. Martin Hernandez-Ayon
Helmut Maske
Oscar Vergara
Ivonne Montes
Philippe Martinez
Edgardo Carrasco
Jacques Grelet
Olivier Desprez-De-Gesincourt
Christophe Maes
Lionel Scouarnec
The fate of the organic matter (OM) produced by marine life controls the major biogeochemical cycles of the Earth's system. The OM produced through photosynthesis is either preserved, exported towards sediments or degraded through remineralisation in the water column. The productive eastern boundary upwelling systems (EBUSs) associated with oxygen minimum zones (OMZs) would be expected to foster OM preservation due to low O2 conditions. But their intense and diverse microbial activity should enhance OM degradation. To investigate this contradiction, sediment traps were deployed near the oxycline and in the OMZ core on an instrumented moored line off Peru. Data provided high-temporal-resolution O2 series characterising two seasonal steady states at the upper trap: suboxic ([O2]<25 µmol kg−1) and hypoxic–oxic ( µmol kg−1) in austral summer and winter–spring, respectively. The OMZ vertical transfer efficiency of particulate organic carbon (POC) between traps (Teff) can be classified into three main ranges (high, intermediate, low). These different Teff ranges suggest that both predominant preservation (high Teff>50 %) and remineralisation (intermediate Teff 20 < 50 % or low Teff<6 %) configurations can occur. An efficient OMZ vertical transfer (Teff>50 %) has been reported in summer and winter associated with extreme limitation in O2 concentrations or OM quantity for OM degradation. However, higher levels of O2 or OM, or less refractory OM, at the oxycline, even in a co-limitation context, can decrease the OMZ transfer efficiency to below 50 %. This is especially true in summer during intraseasonal wind-driven oxygenation events. In late winter and early spring, high oxygenation conditions together with high fluxes of sinking particles trigger a shutdown of the OMZ transfer (Teff<6 %). Transfer efficiency of chemical elements composing the majority of the flux (nitrogen, phosphorus, silica, calcium carbonate) follows the same trend as for carbon, with the lowest transfer level being in late winter and early spring. Regarding particulate isotopes, vertical transfer of δ15N suggests a complex pattern of 15N impoverishment or enrichment according to Teff modulation. This sensitivity of OM to O2 fluctuations and particle concentration calls for further investigation into OM and O2-driven remineralisation processes. This should include consideration of the intermittent behaviour of OMZ towards OM demonstrated in past studies and climate projections.
- Article
(3824 KB) -
Supplement
(1295 KB) - BibTeX
- EndNote


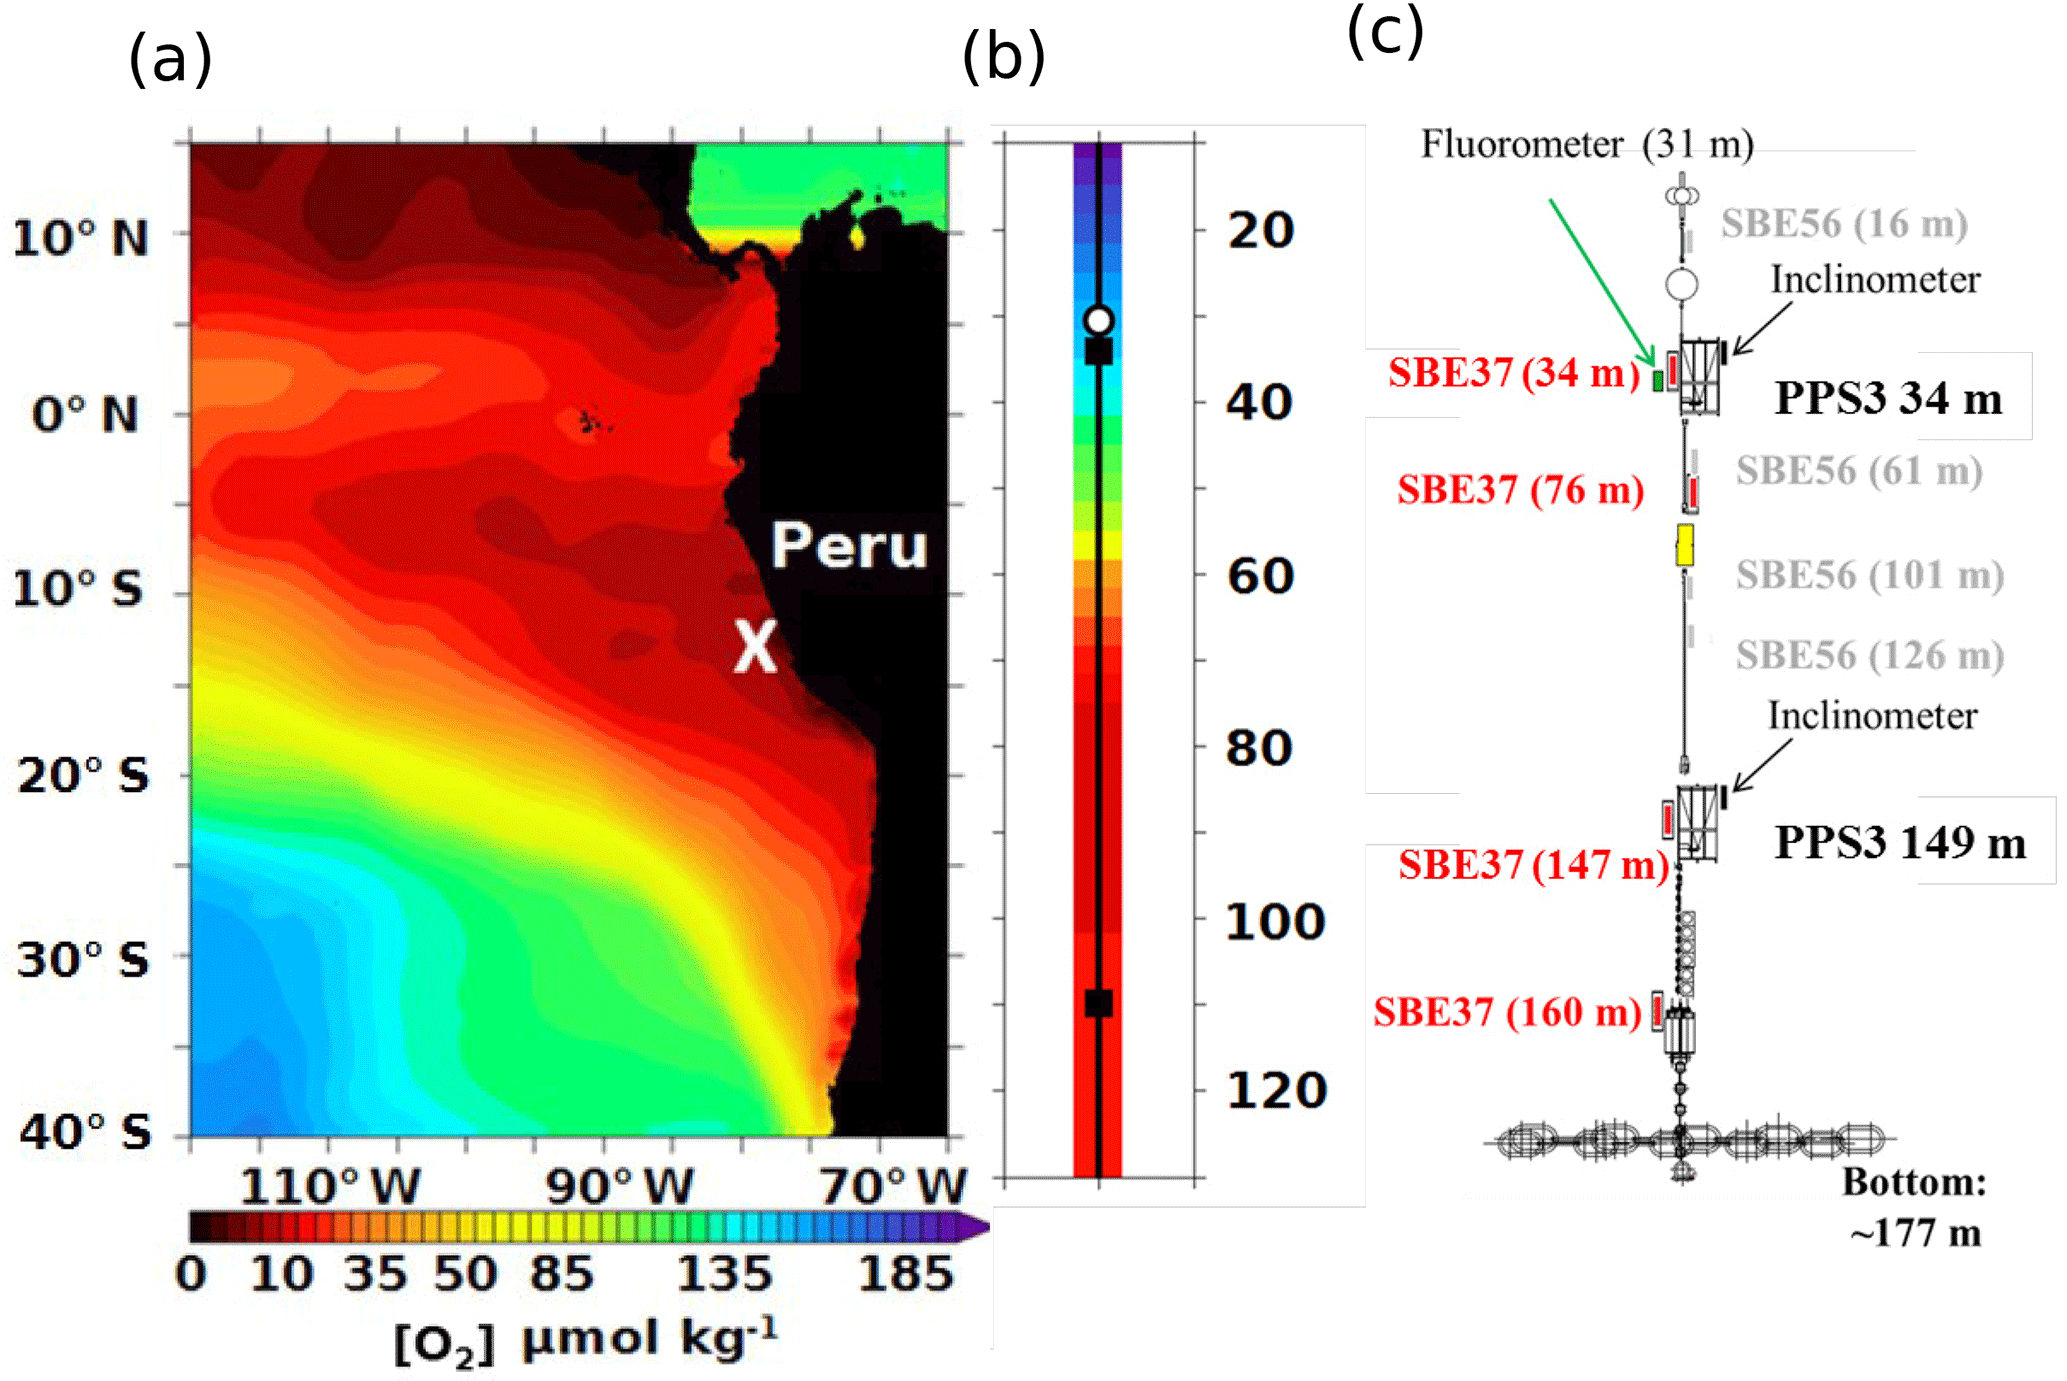
Figure 1Study area, OMZ O2 conditions and design of the mooring. (a) Map of the eastern South Pacific oxygen minimum zone (in red with [O2]minimal<20 µmol kg−1 from WOA2013 climatology). This map includes the location of the AMOP mooring (white cross, 77.40∘ W – 12.02∘ S) off Peru. (b) Vertical distribution of the oxygen concentration at the mooring location (from WOA2013 climatology with the two sediment trap locations in the black square). (c) Design of the fixed mooring line including two sediment traps, PPS3 with two inclinometers at 34 m near the oxycline and at 149 m in the OMZ core, as well as five sensors of pressure, temperature, salinity and oxygen (SBE37-ODO63) at 34, 76, 147 and 160 m, a fluorometer at 31 m, and complementary temperature sensors (SBE56). Sensor depths are indicated to ±1 m, estimated from sensor pressure and inclinometer data (see Sect. 2).
Table 1POC flux, transfer efficiency Teff and b for each main Teff range. Teff is determined from the %Flux149 m ∕ Flux34 m ratio and is given as a percentage (Eq. 1). b is the coefficient from the Martin's curve theory (Suess, 1980; Martin et al., 1987). Italic and non-italic values correspond to the fluxes at 34 and 149 m, respectively. In the last lines of the table, POC fluxes, Teff and b are averaged for low, intermediate and high Teff, respectively, with the relative standard deviation among samples (±SD %). Analysis accuracy on the POC fluxes is ±0.2 %, inducing an absolute uncertainty on its vertical transfer efficiency estimated from a logarithmic expansion of ±0.2 % (see Sect. 2).
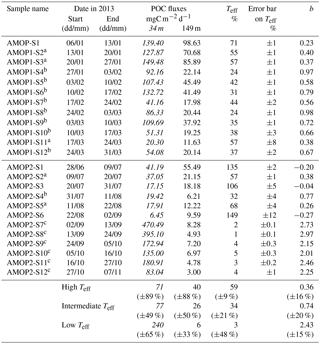
a Samples considered to calculate the high Teff average. b Samples considered to calculate the intermediate Teff average. c Samples considered to calculate the low Teff average.
Eastern boundary upwelling systems (EBUSs) are generally known to be highly productive (Chavez and Messié, 2009), associated with significant primary production (479 to 1213 gC m−2 yr−1) and elevated concentrations of chlorophyll a (1.5 to 4.3 mg m−3). The high production is caused by prevailing equatorward alongshore coastal winds triggering the dynamic upwelling of cold nutrient-rich waters from the subsurface to the well-lit surface layer. The associated intense biological surface activity produces a large amount of organic matter (OM). Part of the OM will sink and be degraded by catabolic processes. Therefore, subsurface OM degradation contributes to the consumption of oxygen (O2). In conjunction with poor ventilation of the water mass, O2 consumption leads to the formation of oxygen minimum zones (OMZs), characterised in the global ocean by a suboxic layer between 100 and 1000 m in depth (Paulmier and Ruiz-Pino, 2009). OM degradation associated with O2 consumption via respiration or remineralisation may influence biological productivity (fixed nitrogen loss). OM degradation may also influence climate on both short and long timescales (Buesseler et al., 2007; Law et al., 2012; Moffitt et al., 2015; Chi Fru et al., 2016) via modulation of the air–sea exchange of climatically important gases (e.g. CO2, N2O and CH4). Moreover, these impacts on climate and ecosystems may be significant when remineralisation stimulated by high surface productivity takes place in waters that feed the upwelling close to the ocean–atmosphere interface (Helmke et al., 2005; Paulmier et al., 2008). Although poorly documented, the OM fate in OMZs stands out as a major issue, due to O2 deficiency and its effect on remineralisation processes. Progress will depend on two different hypothesised mechanisms. On the one hand, weak oxygenation appears to decrease OM degradation because anaerobic remineralisation is considered to be of an order of magnitude less efficient than aerobic remineralisation (Sun et al., 2002). This low remineralisation efficiency suggests a tendency toward OM preservation and enhanced sediment export. On the other hand, the intense and diverse microbial activity (Devol, 1978; Lipschultz et al., 1990; Azam et al., 1994; Ramaiah et al., 1996; Lam et al., 2009; Stewart et al., 2012; Roullier et al., 2014) may induce efficient remineralisation and/or respiration. This may particularly be the case in the more oxygenated, warmer upper OMZ layer associated with the oxycline, leading to substantial OM recycling. Remineralisation, involving a relatively variable stoichiometry in the OMZ (Paulmier et al., 2009), depends on several factors. In addition to its quantity, OM recycling relies on quality (e.g. lability) and its sinking time through the OMZ layer. The depth of euphotic zone with OM production compared to the depth of oxycline that defines O2 availability is of particular importance, together with particle size and shape (Paulmier et al., 2006; Stemmann et al., 2004). The conditions that control particle export and remineralisation also affect oxygen distribution and biogeochemical cycles. A better understanding of the processes that constrain particle export should help to improve estimations of OMZ development and maintenance (Cabré et al., 2015; Oschlies et al., 2017). It is also important to explore the detailed O2 feedback effect on particles.
The EBUS off Peru is one of the most productive systems, accounting for 10 % of the world's fisheries (Pennington et al., 2006; Chavez et al., 2008), with the shallowest oxycline and one of the most intense OMZs (Fig. 1a–b; Paulmier et al., 2009). Thus, it provides perfect conditions for investigating the relative importance of the aforementioned mechanisms. In order to examine the particle fluxes and their variability, this study focusses on the analysis of a time series compiled from moored sediment traps deployed in the Peruvian OMZ (Fig. 1c). This dataset is part of the AMOP (“Activities of research dedicated to the Minimum of Oxygen in the eastern Pacific”; see Sect. 2) project.
Table 2Oxygen concentration in the upper and bottom OMZ layer, proportion of Polychaetes number of individuals, and POC flux ∕ O2 concentration ratios. O2 concentration corresponds to the oxygen concentration averaged on the sampling acquisition periods: for AMOPsummer (denoted AMOP1) and for AMOPwinter–spring (denoted AMOP2). %Poly corresponds to the percentage of number of individuals of Polychaetes relative to all collected swimmers, per day. The POC flux ∕ O2 concentration corresponds to the ratio of both weekly quantities (POC flux collected in the trap and determined from the O2 sensor). Italic values correspond to the [O2], %Poly and POC flux ∕ O2 concentration at the upper trap, and non-italic values at the lower trap. In the last lines of the table, [O2], %Poly and POC flux ∕ [O2] averaged values for low, intermediate and high Teff ranges, respectively, with the relative standard deviation among samples (±SD %). %Poly is determined from a significant number of Polychaetes individuals collected per sample (4607 on average, between 50 and 31 099). Note that Polychaetes and copepods represent 97 % of all the reported swimmers.
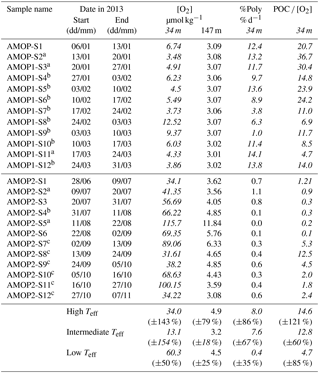
a Samples considered to calculate the high Teff average. b Samples considered to calculate the intermediate Teff average. c Samples considered to calculate the low Teff average.
A fixed mooring line was deployed in January 2013 by R/V Meteor ∼50 km off Lima at 12∘02′ S; 77∘40′ W (Fig. 1). It was recovered in February 2014 by R/V L'Atalante within the framework of the AMOP project (“Activities of research dedicated to the Minimum of Oxygen in the eastern Pacific”; http://www.legos.obs-mip.fr/recherches/projets-en-cours/amop, last access: 16 August 2018). Sediment traps (PPS3 from Technicap) were deployed along the line in the oxycline–upper OMZ core (34 m) and in the lower OMZ core (149 m) in order to study particle flux through the water column (Figs. 1c, 2 and S1 in the Supplement; Tables 1 and S1 in the Supplement). The line was also equipped with five sensors measuring pressure, temperature, salinity and oxygen (SMP 37-SBE63), one sensor for fluorescence (ECO FLSB) and four additional temperature sensors (SBE56; Fig. 1c). The oxygen sensors have a resolution (smallest change detection) of 0.2 µmol kg−1 and an initial accuracy and detection limit of 3 µmol kg−1 (Fig. 3, Table 2). The resolutions and initial accuracies for the pressure, temperature and salinity sensors (0.2–0.7 and 0.1–0.35 dbar; 0.002 and 0.0001 ∘C; 0.0003 and 0.00001; respectively) induce an estimated resolution and accuracy for density (Fig. 4a–b) of 0.01 kg m−3 for both according to the standard TEOS-10 equation. Each sediment trap was equipped with an inclinometer, allowing any incline to be recorded, which is fundamental for data interpretation. Also, to avoid OM decay (e.g. grazing) before analysis, the OM was collected in a poisoned solution of sea water with 5 % of formaldehyde. The traps sampled particles simultaneously over a period of 7 days, during the 3 months of austral summer (AMOPsummer period: 6 January to 31 March 2013). The mooring was serviced in June 2013 and then re-deployed on 26 June 2013; the collection of material in traps resumed on 28 June. The sampling interval was extended to 11 days to fit the planned recovery date and to cover a wider period including two seasons (austral winter–spring during AMOPwinter–spring). The traps were full on 6 November 2013 but the mooring could not be recovered until February 2014 by R/V L'Atalante. Note that the SMP 37-SBE63 sensors started recording on 5 January at 34 m, on 7 January at 76 m, on 8 January at both 147 and 160 m (Fig. 3), and on 27 June 2013 at 50 m only (due to a technical breakdown).
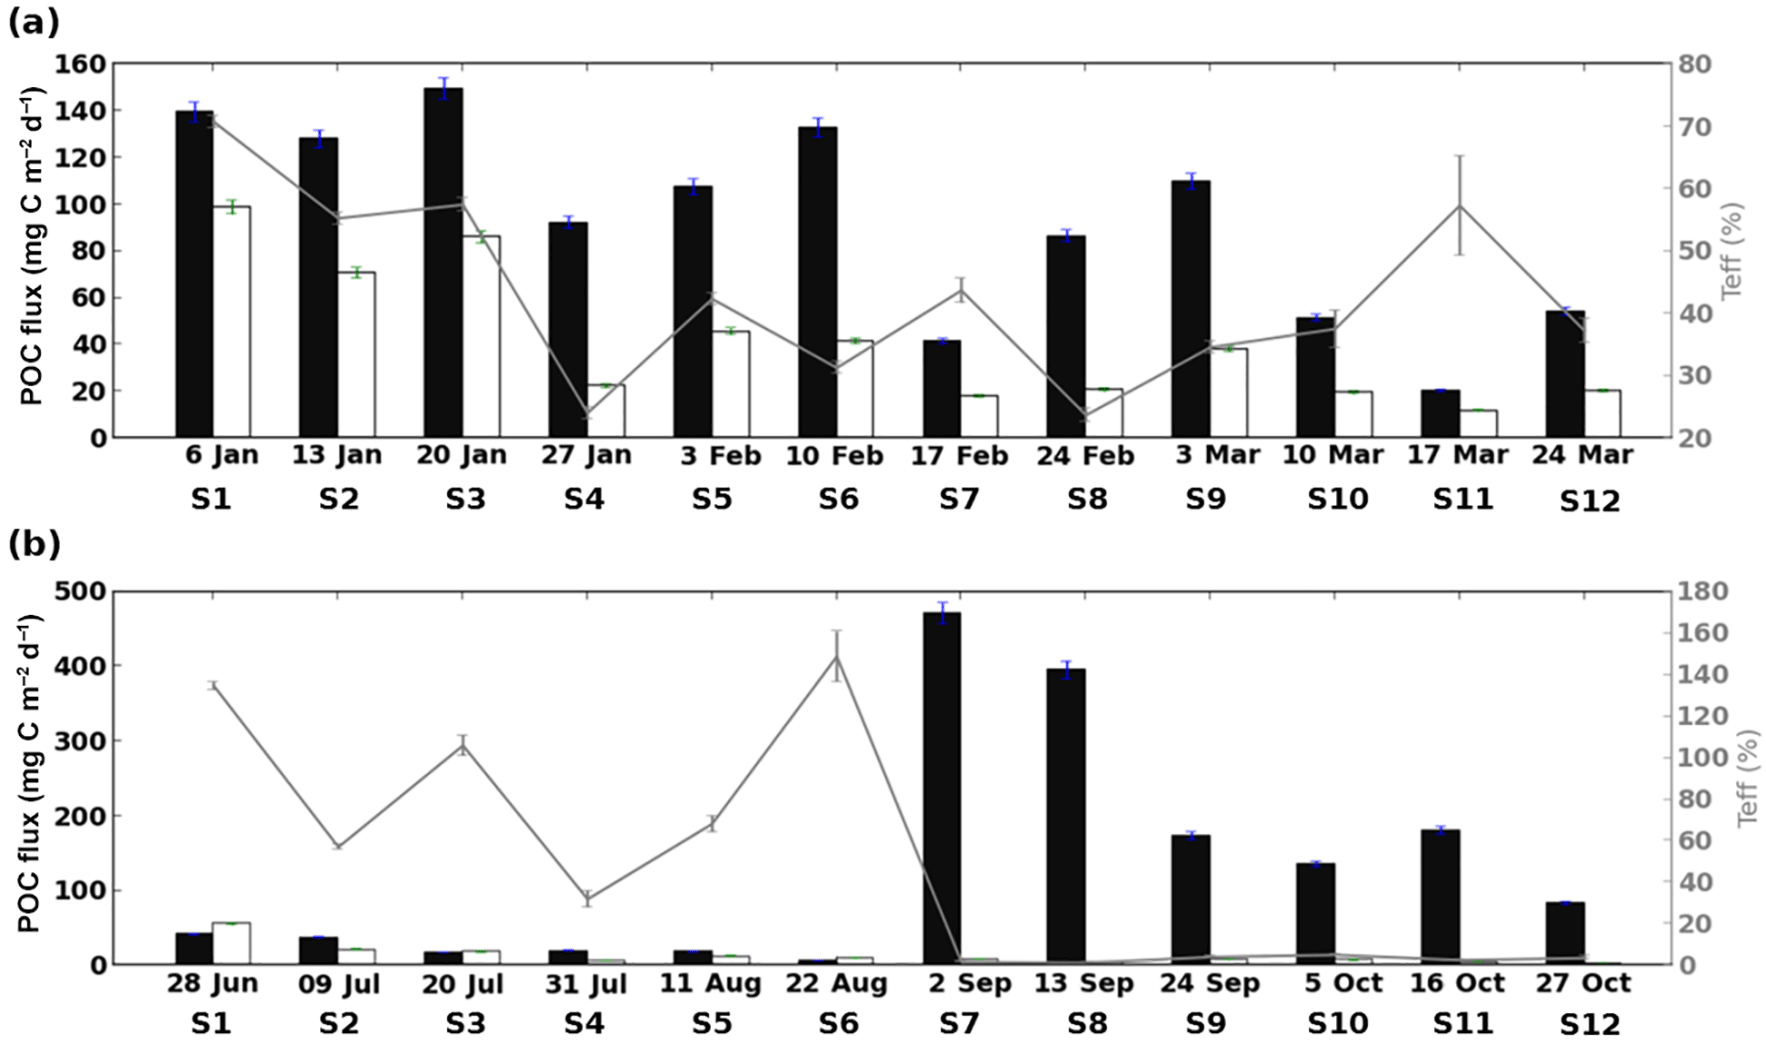
Figure 2Time series in 2013 for POC flux (left-hand scale) at 34 m (black bar) and 149 m (white bar) and the corresponding transfer efficiency (Teff; from Eq. (1), grey line, right-hand scale), covering the AMOPsummer (denoted AMOP1) (a) and AMOPwinter–spring (denoted AMOP2) (b) periods. Error bars correspond to the accuracy of analytical determination for the POC flux, which is estimated through a logarithmic expansion of Eq. (1) for Teff (see Sect. 2, Tables 3a and S1 for details).
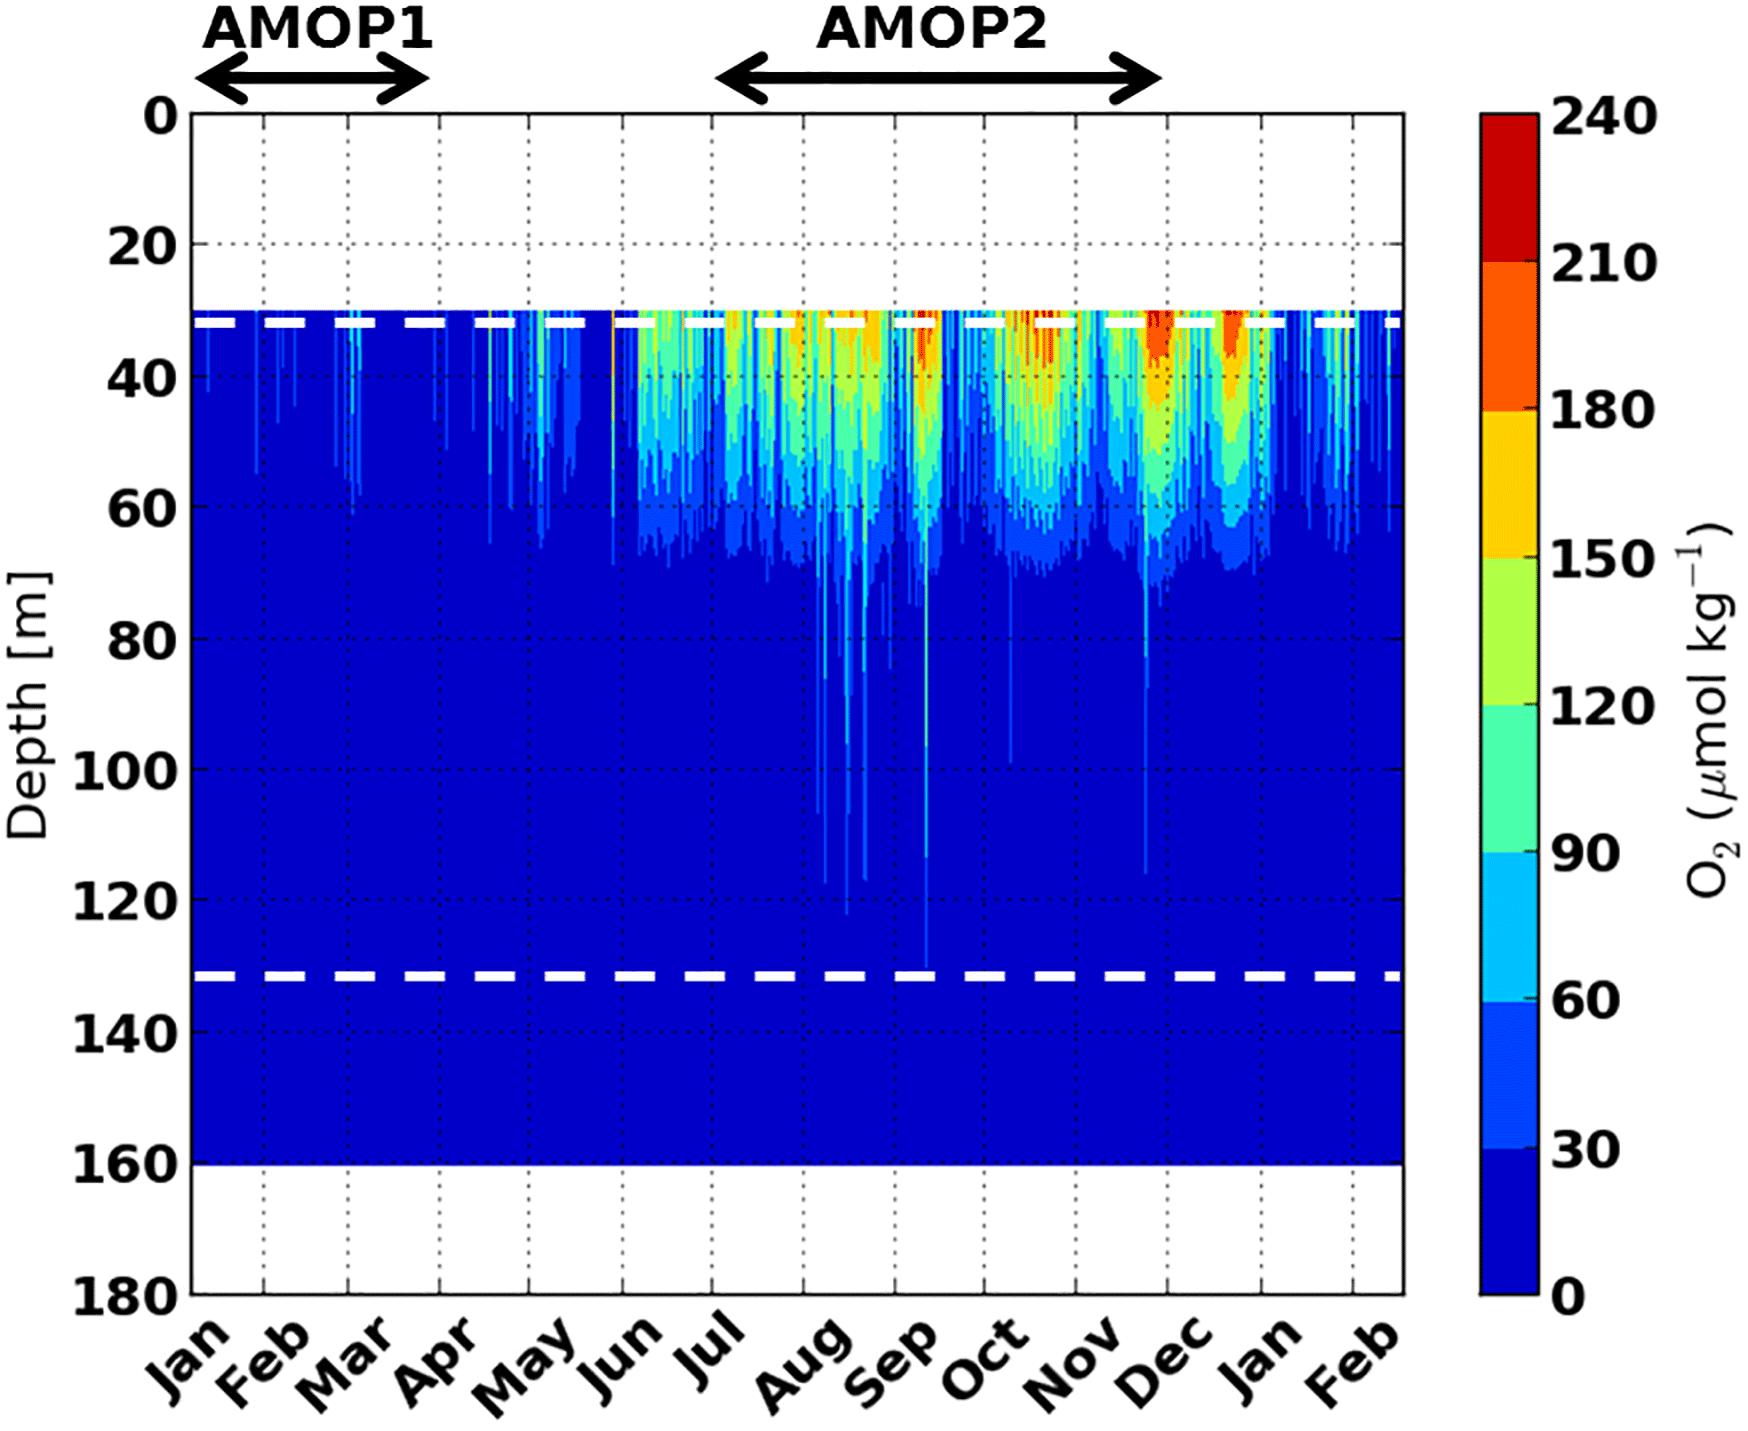
Figure 3Time series in 2013 of the oxygen concentration (µmol kg−1) covering the AMOPsummer (denoted AMOP1) and AMOPwinter–spring (denoted AMOP2) periods, acquired on the mooring location line through oxygen sensors at 34, 76, 147 and 160 m of depth with a 15 min acquisition frequency and vertically interpolated (see Fig. 1c and Sect. 2). The dashed horizontal white lines indicate the depth of the traps.
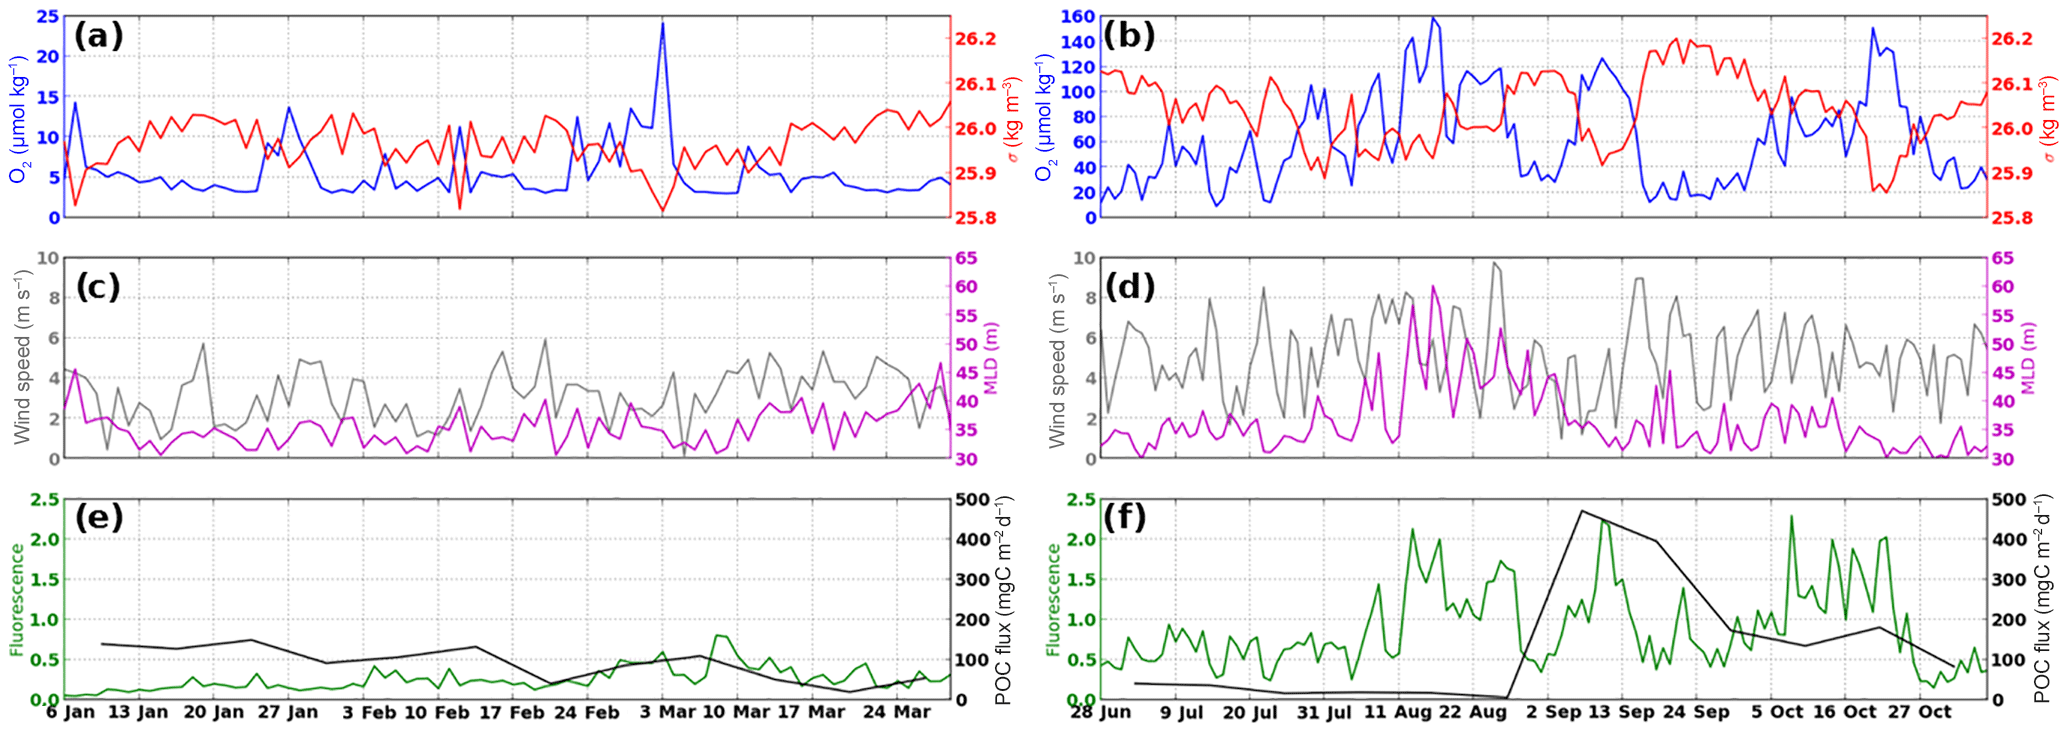
Figure 4Time series documented at the mooring site in 2013 of oxygen concentration and density at the upper trap, of mixed-layer depth (MLD) and wind speed at the surface, and of POC flux and fluorescence at the upper trap, for each sample. Left and right panels are for AMOPsummer (denoted AMOP1) and AMOPwinter–spring (denoted AMOP2), respectively. (a–b) Daily oxygen concentration (, blue line) and density (red line) calculated from pressure, temperature and salinity data acquired with the PTS sensors (see Fig. 1c) at 34 m of depth. (c–d) Daily MLD (purple) and wind velocity (grey) from the ASCAT satellite. (e–f) Weekly POC flux at 34 m (black) in mgC m−2 d−1 and daily fluorescence data at 31 m (green) in relative units. For more details, see Sect. 2.
Before analysing particle samples, we removed the swimmers, which could have actively entered the trap and thus would not represent the strict vertical sinking mass flux. After freeze-drying, the mass flux (dry weight; Fig. S1, Table S1) was determined with an accuracy of ±3 %. Total carbon (Ctot), particulate organic and isotopic carbon (POC, δ13C), and nitrogen (PON, δ15N) were analysed via an isotope ratio mass spectrometer (IRMS) IsoPrime100 paired with an elementary analyser (EA) Elementar vario PYRO cube. The carbon and nitrogen content (Figs. 2 and S2; Tables 3a, S2a–b and S3) was measured with an accuracy of ±0.2 %, and the isotopic δ13C and δ15N measurements (Tables 3c and S4) with an accuracy of ±0.006 ‰, and 0.007 ‰, respectively. Phosphorus and silica (Tables 3a, S2c–d and S3) were measured by colorimetry, using a spectrophotometer SPECORD 250 plus. Particulate organic phosphorus (POP) was analysed using the standard method (Strickland and Parsons, 1972) with an accuracy of ±3 %. The biogenic silica (BSi) was extracted with an alkaline dissolution at 95 ∘C using a kinetic method (DeMaster, 1981) with an accuracy of ±5 %. Ca (for CaCO3 estimation; Table S5) was determined from inductively coupled plasma–optical emission spectroscopy (ICP-OES) analysis with an accuracy of ±3 %. Systematic replicates for all sediment trap parameters have been analysed to estimate reproducibility, which mainly represents the heterogeneity of the sample. The reproducibility estimated from the standard deviation (SD) of the replicates for the total mass flux determination (0.12 %) is generally lower than the accuracy, except for δ13C.
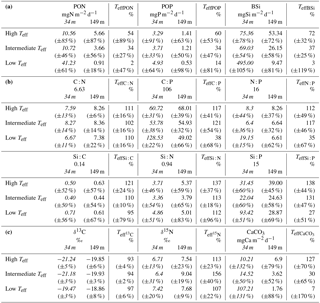
Table 3Organic elemental fluxes and the corresponding molar ratios as well as inorganic and isotopic fluxes, and their transfer efficiencies for each main Teff range. (a) Organic elementary fluxes in mg m−2 d−1 and their transfer efficiency as a percentage (Teff, TeffPON, TeffPOP, TeffBSi; see Table 1 caption for calculation) in terms of particulate organic carbon (POC), nitrogen (PON), phosphorus (POP) and biogenic silica (BSi) for each three main Teff ranges (low in red, intermediate in yellow, high in blue) with the temporal standard deviation among samples (±SD %). Italic and non-italic values correspond to the fluxes at 34 and 149 m, respectively. Analysis accuracies on the elementary fluxes are ±0.2 % for both POC and PON, ±3 % for POP, and ±5 % for BSi, inducing an absolute uncertainty of ±0.2 % (Teff), ±0.2 % (TeffPON), ±3 % (TeffPOP) and ±5 % (TeffBSi) on the transfer efficiency (see Sect. 2). (b) Values of elementary ratios (C : N, C : P, N : P, Si : C, Si : N, Si : P) and transfer efficiency of these ratios as a percentage (TeffC : N, TeffC : P, TeffN : P, TeffSi : N, TeffSi : N, TeffSi : P; see Table 1 caption for calculation) for each three main Teff ranges with the temporal standard deviation between samples (±SD %). Italic and non-italic values correspond to the fluxes at 34 and 149 m, respectively. Analysis accuracies on the elementary ratios are ±0.4 %, 3.2 %, and 3.2 % and ±5.2 %, 5.2 %, and 8 % for C : N, C : P, and N : P and Si : C, Si ∕ N, and Si : P, respectively, inducing an absolute uncertainty of ±0.9 % (TeffC : N), ±6.3 % (TeffC : P), and ±6 % (TeffN : P) and ±12 % (TeffSi : C), ±13.4 % (TeffSi : N), and ±19 % (TeffSi : P) on the transfer efficiency (see Sect. 2). Classical (reference) molar ratios have been reported on the second lines from Redfield et al. (1963) and Brzezinski (1985). (c) Fluxes of inorganic calcium carbonate (CaCO3) in mgCa m−2 d−1 and of carbon isotopic ratio (δ13C) and nitrogen isotopic ratio (δ15N) in ‰ and their transfer efficiency in % (, , ; see Table 1 caption for calculation) for each three main Teff ranges (low in red, intermediate in yellow, high in blue) with the temporal standard deviation among samples (±SD %). Italic and non-italic values correspond to the fluxes at 34 and 149 m, respectively. Analysis accuracies on the elementary fluxes are ±3 % for CaCO3, ±0.006 ‰ for δ13C and ±0.007 ‰ for δ15N, inducing an absolute uncertainty of ±3 % (), ±0.06 % () and ±0.26 % () on the transfer efficiency (see Sect. 2).
Daily satellite ASCAT wind measurements (Fig. 4c–d), produced by remote-sensing systems (http://www.remss.com, last access: 16 August 2018; sponsored by the NASA Ocean Vector Winds Science Team) were used with an accuracy of 2 m s−1. The satellite wind data are consistent with the available in situ wind measurements taken from R/V Meteor during the initial mooring deployment. Wind direction corresponds to alongshore winds favourable to upwelling Ekman transport. The mixed-layer depth (MLD; Fig. 4c–d) was estimated from a difference of temperature of 0.5 ∘C following De Boyer Montegut et al. (2004), in phase with the 0.2 and 0.8 ∘C criteria.
In situ pHsw (Fig. S3) and calcite saturation state (Ωcalcite) were calculated with the CO2SYS program (Lewis and Wallace, 1998), using discrete dissolved inorganic carbon measured using a LI-COR 7000 and potentiometric pHsw measurements (25 ∘C). The dissociation constants proposed by Lueker et al. (2000) were used for the calculation with an estimated precision of ±0.04 units for in situ pHsw and ±0.2 units for Ωcalcite. Certified reference material (CRM) from Dr. Andrew Dickson's laboratory at Scripps Institution of Oceanography (University of California, San Diego) was used for assessing the precision and accuracy of measurements. The reference material gave a relative difference averaging 2.2±1.1 µmol kg−1, with a peak of 4 µmol kg−1 (0.2 % error) with respect to the certified value.
The analysis accuracy for the sediment trap samples is indicated in Fig. 2. The analysis accuracy has been estimated by propagation of the accuracy of each parameter from a logarithmic expansion for the molar ratios (C : P, N : P, N : P, Si : C, Si : N and Si : P) and all the calculated vertical transfer efficiencies as Teff for POC fluxes (see Eq. 1). SD among samples representing the variability over the total dataset (AMOPsummer+AMOPwinter–spring) or a given subset of data (e.g. corresponding to high, intermediate or low Teff ranges) has also been indicated in Tables 1, 2, 3, S1, S2, S3, S4 and S5). The different present relative SD values are higher than the total uncertainties () for all considered parameters.
Data are available at different time resolutions: 15 min (O2, density from temperature and salinity), 30 min (fluorescence), 1 day (satellite ASCAT wind), 7 or 11 days for AMOPsummer and AMOPwinter–spring datasets, respectively. The sediment trap fluxes include the percentage of Polychaetes relative to all other collected swimmers, denoted as %Poly. All fluxes (for the total mass of particles, POC, PON, POP, BSi, CaCO3, δ13C and δ15N, as well as %Poly), corresponding to a collection period of 7 and 11 days for the AMOPsummer and AMOPwinter–spring periods, respectively, have been normalised and expressed per day. Hereafter, we will use 7 days as the nominal weekly period. Different averages have been performed to compare with different temporal resolution of other data: from 15 min resolution for O2, density, and MLD and from 30 min resolution for the fluorescence to 1-day resolution (Fig. 4), and from 15 min to 7-day (for AMOPsummer) or 11-day (for AMOPwinter–spring) resolution for O2 (Table 2). We verified that different ways to time-average did not modify the main findings of this study. Note however that daily-average MLD (Fig. 4c–d) presents a magnitude ∼9 times smaller than with the 15 min-frequency MLD. This is mainly due to biases induced by the vertical resolution according to the mooring sensor depths. For oxygen, the 1, 7 and 11 day averages have been denoted , and , respectively. and also allow the definition of the ratio of POC flux ∕ [O2], POC flux and [O2] to be at the same temporal resolution (Table 2). This ratio corresponds to an availability index in terms of POC flux to be degraded according to the oxygen concentration availability. When the ratio POC flux ∕ [O2] reaches extreme values far from the mean range (POC flux ∕ [O2] > average + SD or POC flux ∕ [O2] < average − SD), we define a severe limitation by oxygen only or by OM only. When this ratio POC flux ∕ [O2] is within the interval [average −SD, average +SD], we define a co-limitation with either O2 or OM as the main factor limiting OM degradation.
Sediment trap fluxes, O2 concentrations and other quantities considered in this study (e.g. the ratio of POC flux ∕ [O2]) have been averaged on the different Teff ranges (Tables 1–3 and S1–S5).
3.1 Particle transfer efficiency through the OMZ
3.1.1 Temporal modulation of particles and POC fluxes and their transfer efficiencies
The transfer of particles through the Peruvian OMZ is studied using data collected at the two fixed sediment traps, one located in the oxycline–upper core (34 m) and the second in the lower core (149 m). Seasonally, at 34 m, the mass fluxes during summer are about 60 % lower than during winter–spring (AMOPwinter–spring: 986 mg m−2 d−1 on average; see Fig. S1, Table S1). At 149 m, the mass fluxes during summer are about 80 % higher than during winter–spring (AMOPwinter–spring: 95 mg m−2 d−1 on average; see Fig. S1, Table S1). Intra-seasonally, during summer (AMOPsummer), the variability in fluxes at 34 and 149 m is 3 times and 40 % lower than during winter–spring (AMOPwinter–spring; see Table S1) with a SD = 144 % (39<4647 mg m−2 d−1) and 138 % (12<488 mg m−2 d−1, respectively.
The POC flux (Table 1) is globally proportional to the total particle flux (R2=0.92) (Fig. S2a). Therefore analysis of the total particle flux and the POC flux will lead to similar results. To investigate the influence of the oxygen-deficient layer between both traps for each season, we use the POC transfer efficiency (Teff) introduced by Buesseler et al. (2007), defined as
The transfer efficiency allows the determination of the ability of the system to preserve OM quantity and to foster the export of carbon from the productive layer. The higher the transfer efficiency, the higher the proportion of particles reaching the deeper trap. Therefore, Teff is an index of the relative amount of carbon that reaches the deeper trap.
The mean transfer efficiency appears to be relatively similar for both datasets (Teff∼45 %). However, Teff values present a strong temporal variability, with Teff being more than 3 times more variable for AMOPwinter–spring than for AMOPsummer (Fig. 2; Table 1).
Teff can be higher than 100 %, referring to particle accumulation between both traps. Teff>100 % is potentially attributable to advection of particles or to primary or secondary production between traps. Teff is never higher than 100 % during AMOPsummer but it is 3 times higher during AMOPwinter–spring (AMOPwinter–spring-S1, AMOPwinter–spring-S3, AMOPwinter–spring-S6; Teff=135 %, 106 % and 149 %, respectively). Due to the potential bias affecting these values without considering the OMZ influence, values of Teff>100 % were discarded. Excluding these very high Teff results, transfer efficiency varies between 1 % and 71 %. Three ranges of variation can be defined: high, intermediate and low. The high range with relatively efficient transfer (Teff>50 %) corresponds to a predominance of OM preservation. This preservation is observed for a third of the total samples, namely the first three samples of AMOPsummer (AMOPsummer-S1, AMOPsummer-S2 and AMOPsummer-S3), the sample between 17 and 24 March (AMOPsummer-S11), and two samples in winter (AMOPwinter–spring-S2 and AMOPwinter–spring-S5). Conversely, the other samples correspond to a predominance of potential OM degradation or remineralisation. In late winter–early spring, the proportion of particles reaching the deeper trap is very low (low range of Teff<6 %). This period represents half of the AMOPwinter–spring period (from 2 September to 6 November) and seems to correspond to the main period of OM degradation. Between these extreme high and low values, Teff presents an intermediate range between 20 % and 50 %. Intermediate Teff occurs mainly in summer from 27 January to 31 March (AMOPsummer-S4, AMOPsummer-S5, AMOPsummer-S6, AMOPsummer-S7, AMOPsummer-S8, AMOPsummer-S9, AMOPsummer-S10 and AMOPsummer-S12). Within the 20 < 50 % Teff range, the six samples in summer (AMOPsummer-S4, AMOPsummer-S6, AMOPsummer-S8, AMOPsummer-S9, AMOPsummer-S10 and AMOPsummer-S12), and one sample in winter (AMOPwinter–spring-S4) present a low intermediate Teff range of 20 < 38 %.
Note that the vertical profile of POC flux is assumed to follow a power law (Suess, 1980; Martin et al., 1987).
The b coefficient represents the attenuation of the curve and therefore an index for OM respiration during sinking. Fitting b on the AMOP dataset reveals temporally varying b values (between 0.23 and 2.97, Table 1). Small and large b values indicate a slow or rapid OM decay, respectively. Even if this transfer layer (between both traps) is relatively shallow and covers a short distance (115 m) compared to other studies (e.g. between 200 and 1000 m; Devol and Hartnett, 2001; Miquel et al., 2011; Heimburger et al., 2013), b values are in the same range as previous estimates. The largest b values are estimated from 2 September (AMOPwinter–spring-S7) to 6 November (AMOPwinter–spring-S12) with a maximum of 2.97 on 13 September (AMOPwinter–spring-S8). These high values correspond to the minimal transfer efficiency (low range of Teff<6 %) and are consistent with Martin's values observed for the oxygenated North Pacific (0.90±0.06). The lower b values (between 0.23 and 0.98, Table 1) are in line with those generally observed in the equatorial Pacific OMZ (between 0.63 and 0.9, Berelson, 2001), in the Mexican OMZ (about 0.36, Devol and Hartnett, 2001), in the Peruvian OMZ (0.66±0.24, Martin et al., 1987) and in the Arabian Sea OMZ (0.22, Roullier et al., 2014; 0.59±0.24: Keil et al., 2016). The temporal modulation of b is comparable to that associated with the spatial switch from the coast to the open ocean off Peru (Packard et al., 2015) as well as from high- to low-latitude regions (Marsay et al., 2015). Globally, and in line with the transfer efficiency, the strongest attenuation was observed in spring ( %) and the weakest in winter ( %). One can notice that the attenuation is also 4 times stronger and 2.5 times more variable in spring than in summer, where b is on average 0.62±39 %. Considering the ranges previously defined, for low Teff (<6 %), for intermediate Teff (20 < 50 %) and for high Teff (>50 %).
3.1.2 Significance of transfer efficiency
While the transfer efficiency (Teff) between the upper (34 m) and lower (149 m) sediment traps allows a mathematical distinction among ranges of POC export efficiency, it is crucial to investigate the physical significance of this Teff. Particles sampled at 149 m are not necessarily associated with the same vertical flux as those previously sampled at 34 m over the 7- or 11-day period. This is due to the following three main processes: (a) horizontal transport, (b) vertical sinking speed defining the finite time between both traps and (c) particle production between both traps involving different trophic levels.
Teff may be affected by horizontal advection of particles as well as by sediment trap line inclination, in response to the coastal current system (e.g. shear due to the northward flow at the surface and southward flow in the subsurface layers). These typical methodological biases in sediment trap studies are known to potentially affect the collection of particles and their efficiency. Here, the mean alongshore (poleward) current reaches ∼12 cm s−1 (slower than 15 cm s−1) over the duration of the experiment in the vicinity of the sediment traps. This is based on in situ data (AMOP cruise), climatology (Chaigneau et al., 2013) and estimates from climatological regional model simulations (Montes et al., 2010; Dewitte et al., 2012). Therefore, the collection of particles is considered to be marginally affected by currents in this transfer layer (Baker et al., 1988). This is confirmed by a small inclination of the mooring line (<5∘). However, the only three samples presenting values of Teff>100 % (AMOPwinter–spring-S1, AMOPwinter–spring-S3 and AMOPwinter–spring-S6) are characterised by a relatively high inclination anomaly (related to the mean inclination) of the mooring line. This high inclination anomaly can be assigned to a significant modification of the horizontal currents' mean state. Zonal advection of particles from a more productive region in the lower trap could explain anomalous high transfer.
Vertically, we assume that upwelling or downwelling events (velocity below 0.5 m d−1) do not significantly impact particle sinking speed (ranging from 1 to 2700 m d−1; Siegel et al., 1990; Waniek et al., 2000). In addition, the quantity of matter collected by the sediment trap in each cup at 149 m may be different from that collected in the corresponding cup at 34 m. This depends on the vertical velocity of specific particles. Particle velocity also determines exposure time to degradation activity in the water column. Therefore, the probability of particle degradation may increase for slower (generally smaller) particles. They spend a longer time in the subsurface active remineralisation layer between 34 and 149 m, which could be the case for samples with Teff<50 %. Conversely, the large amount of matter collected at 149 m for the high Teff range (>50 %) might be explained by the presence of potentially less degraded particles, resulting from a faster sinking velocity (McDonnell et al., 2015). In theory, the sinking velocities of biogenic particles depend on the three-dimensional properties of the flow field as well as on various intrinsic factors (such as their sizes, shapes, densities and porosities; Stemmann and Boss, 2012). These intrinsic factors can be modified along their fall by complex biophysical processes (e.g. aggregation, ballasting and trimming by remineralisation). Note that processes like aggregation (e.g. flocculation) or disaggregation may affect the vertical transfer, as they modulate the sinking rate. Indeed, while disaggregation transforms fast-sinking large particles into small suspended particles, aggregation of small particles will induce their sinking. However, the samples from the present study are mainly composed of faecal pellets, and in a relatively equal proportion for both traps. Therefore, biophysical processes do not appear to be the main factor that modulates transfer efficiency.
Finally, subsurface particle production between 34 and 149 m can affect Teff. For instance, Teff can be affected by the presence of a deep or secondary chlorophyll maximum (SCM), which can sometimes be more intense than the primary maximum in OMZ areas (Garcia-Robledo et al., 2017). The fluorometer data at 31 m suggest an intermittent increase in fluorescence around this depth (Fig. 4e–f). However, the high fluorescence values could be attributable to the detection of a SCM or to deepening of the surface mixed layer, mixing the surface chlorophyll with the subsurface layer. To complement fluorescence data, δ13C values (Table S4) provide some information about particle production and typical processes linked to surface productivity. Here, the transfer efficiency of δ13C is roughly constant (between 88 % and 105 %, Table S4). This suggests no significant primary production below the top trap and therefore no significant contribution of an SCM. In addition, the water column between 34 and 149 m is mostly below the euphotic layer in which primary producers are mainly active. Thus, particle production is considered to be related to higher trophic levels only, in particular zooplankton (e.g. detritus due to excretion and mortality). Zooplankton can also induce active vertical transport of particles not directly considered here. However, zooplankton production should be pointed out for AMOPsummer-S1. AMOPsummer-S1 is characterised by an oxygen event (>10 µmol kg−1, Fig. 4a) but with an unexpectedly high Teff (71 %) suggesting preferential OM preservation. This sample is different from the others previously mentioned, the number of swimmers collected being 3 times higher than the average of the AMOPsummer dataset, especially in the lower trap. This AMOPsummer-S1 specificity is raising the influence of the active transfer between both traps and potentially secondary production.
In this study, we assume that (a) similar particles are collected in the upper and lower traps for each sampling period; (b) all particles collected in the deep trap are, for each sampling period, subject to a comparable time in the OMZ layer. Note that all the AMOPsummer samples in summer and the first six AMOPwinter–spring samples (from AMOPwinter–spring-S1 to AMOPwinter–spring-S6) in winter appear to be subject to a comparable trophic level effect. Indeed, samples are composed of around 60 %–70 % faecal pellets, therefore spending a similar amount of time in the OMZ. However, for the last six AMOPwinter–spring samples (from AMOPwinter–spring-S7 to from AMOPwinter–spring-S12) in late winter–early spring, the proportion of faecal pellets and marine snow inverts. For the AMOPwinter–spring dataset, low Teff (from AMOPwinter–spring-S7 to AMOPwinter–spring-S12) can be explained by the higher proportion of small particles (as marine snow), which is potentially easily degradable.
Transfer efficiency (Teff) is controlled by the degradation of particles occurring below the productive layer. OM degradation can be due to macro-organisms feeding (Lampitt et al., 1990) or to microbial activity (e.g. Devol, 1978; Lam et al., 2009; Stewart et al., 2012; Roullier et al., 2014). This degradation implies a dependence on oxygen availability. Low oxygen availability could constrain zooplankton in a specific layer, therefore limiting feeding. Low oxygen availability could also reduce the microbial activity. Aerobe remineralisation is considered to be 10 times more efficient than anaerobe remineralisation (Sun et al., 2002; Taylor et al., 2009). However, in addition to the main requirement of catabolic energy fuelled by O2 availability, OM bioavailability should feed the substrate anabolic requirement of the heterotrophic microbial community controlling remineralisation activity. This argument is in line with previous studies showing microbial nitrogen cycling regulated by OM export (Kalvelage et al., 2013). Therefore, for intermediate (20 % < Teff<50 %) and high Teff (>50 %) values, OM degradation is considered limited, whereas for low Teff (<6 %) it is not. The role of oxygenation and OM availability in OM degradation was explored. This was to provide a better estimation of whether the quantity of carbon remains available for surface production and air–sea exchange, or whether it is preserved and exported toward the sediment.
3.2 Key parameters modulating particle transfer efficiency
The respective roles of oxygen and OM in modulating transfer efficiency will be evaluated.
3.2.1 The role of oxygen
Transfer efficiency (Teff) shows a variation among seasons, as well as at an intraseasonal level. The role of oxygen is investigated by considering temporal changes in oxygenation and whether they could be a potential factor associated with changes in remineralisation activity. Could this explain the Teff modulation?
Vertical and temporal [O2] changes mainly occur near the oxycline and upper OMZ core (upper trap) rather than in the lower OMZ (lower trap). In the lower OMZ, O2 concentration remains stable, reaching the lowest detection limit (Fig. 3). Close to the upper trap, oxygen concentration can then be a key factor triggering limitation of remineralisation.
Seasonally, mean oxygen concentration appears to be ∼10 times lower for AMOPsummer (∼5 µmol kg−1) than for AMOPwinter–spring (∼60 µmol kg−1; Fig. 4a–b). The daily-averaged oxygen concentration at 34 m highlights the existence of two steady states regarding oxygenation: (i) the suboxic conditions occurring in summer, in which [O2] stays below 25 µmol kg−1, and/or with a shallower oxycline; (ii) the hypoxic–oxic conditions occurring in winter and early spring, in which [O2] is always above 15 µmol kg−1, and/or with a deeper oxycline (Fig. 4a–b). Suboxia corresponds to limiting conditions for both aerobe micro- and macro-biological (e.g. bacteria and zooplankton) OM degradation, thereby impacting the vertical transfer efficiency (Teff). This is confirmed by the fact that the abundance of swimmers during AMOPsummer is half the amount as during AMOPwinter–spring. This is also confirmed by the relative abundance of polychaetes, known to better tolerate suboxic conditions than copepods. The number of reported polychaetes is 22 times higher at the oxycline during AMOPsummer than during AMOPwinter–spring (Table 2). Oxygen concentration may also indirectly impact Teff. More oxygenated conditions (e.g. during AMOPwinter–spring) allow micro-organisms such as copepods to colonise depths between both traps, and therefore potentially produce particles within this layer through sloppy feeding, faecal pellets and carcasses sinking. The latter mechanism may explain the Teff higher than 100 %.
In addition to concentration considerations, [O2] for AMOPsummer is 10 times less variable (SD=2.6 µmol kg−1 for ) than for AMOPwinter–spring (SD=28 µmol kg−1 for ; Table 2). This difference regarding variability highlights less intense and 2 times less frequent oxygenation events during AMOPsummer than during AMOPwinter–spring (Fig. 4a–b). The more elevated O2 conditions observed during AMOPwinter–spring are favourable to OM degradation through both micro- and macro-organisms. This is therefore consistent with a lower Teff (<6 %), at which no limitation of the degradation mechanisms is considered.
Intra-seasonally, for AMOPsummer associated with an O2 limitation period, specific relative and significant oxygenation conditions (5.5≤12.5 µmol kg−1) can be identified according to the weekly averages. These oxygenation conditions, 30 % higher than the seasonal mean O2 steady state, occur between 6 and 13 January (AMOPsummer-S1), 27 January and 3 February (AMOPsummer-S4), 10 and 17 February (AMOPsummer-S6), and 24 February and 17 March (AMOPsummer-S8, AMOPsummer-S9, AMOPsummer-S10; Table 2, Fig. 4a). In such cases, aerobe remineralisation could still be active and potentially coupled with underlying anaerobe remineralisation. This coupling could lead to relatively more efficient OM degradation (Sun et al., 2002), consistent with relatively low Teff (24 ≤ 38 %; Table 1), except for AMOPsummer-S1 (considered apart; see Sect. 3.1.2). In contrast, less oxygenated conditions (3.5≤4.9 µmol kg−1) inducing potential O2 limitation are consistent with relatively higher intermediate Teff (38 ≤ 57 % for AMOPsummer-S2, AMOPsummer-S3, AMOPsummer-S5, AMOPsummer-S7, AMOPsummer-S11, AMOPsummer-S12). In these cases, a severe O2 limitation can be considered, as the oxygen concentration appears to be about 25 % lower than the seasonal mean O2 steady state. This severe O2 limitation covered situations considered limited by O2 only (POC flux ∕ [O2] > average + SD, meaning > 17+10: AMOPsummer-S2 and AMOPsummer-S3) but also by OM only (POC flux ∕ [O2] < average SD, meaning < 17−10: AMOPsummer-S11).
At higher frequency, within the weekly period, the oxygenated conditions present oxygenation episodic events with (i) a higher daily occurrence (≥ two per week; up to six events for AMOPsummer-S8) and (ii) often relatively intense ( reaching 24.2 µmol kg−1 for AMOPsummer-S9; Fig. 4a). In contrast, the less oxygenated conditions present only less frequently occurring oxygenation events (≤ two per week), which are generally less intense.
The oxygenation events, reported for both AMOPsummer and AMOPwinter–spring, are linked with density minima (<26.1 kg m−3) and are relatively consistent with a deepening of the MLD. This suggests vertical diapycnal mixing with surface water (Fig. 4a–d). Induced vertical mixing appears to be driven by an increase in wind intensity, frequency (more than one wind pulse per week) and duration (∼10 days). Globally, the averaged density for AMOPwinter–spring is lighter than AMOPsummer by ∼0.07 kg m−3. Short wind-driven mixing events are followed by a longer re-stratification period associated with an [O2] decrease (of ∼5 µmol kg−1 for AMOPsummer and >20 µmol kg−1 up to 100 µmol kg−1 for AMOPwinter–spring) and density increase (of >0.1 kg m−3, up to 0.4 kg m−3 for AMOP 2), then stabilisation. The sequences of mixing–stratification and oxygenation–deoxygenation could have been induced by sequences of stirring (or downwelling–upwelling). These sequences are typically observed during upward transportation of deeper, denser and lower [O2] water, in response to a modulation in alongshore winds favourable to Ekman transport. A propagation of coastal trapped waves, with in-phase vertical fluctuations in the density and oxygen isopleths, can also take place (Sobarzo et al., 2007; Dewitte et al., 2011; Illig et al., 2014). These wind-driven oxygenation events during the lowest seasonal steady-state oxygenation as in AMOPsummer potentially modulate the intensity of remineralisation at an intra-monthly frequency. In fact, during summer, transfer efficiency varies up to a factor of 2 (24<57 %) associated with oxygenation events. These oxygenation events allowing less O2 limitation are consistent with a relatively lower intermediate Teff between 20 % and 40 % (e.g. for AMOPsummer-S4, AMOPsummer-S6, AMOPsummer-S8, AMOPsummer-S9 and AMOPsummer-S10).
The transfer efficiency (Teff) decreases from high (>50 %) to low intermediate (20 < 38 %) when [O2] at the oxycline, or in the upper OMZ, increases during oxygenation events. This Teff decrease occurs at (i) a seasonal scale from the limit of detection of higher than ∼5 up to ∼25 µmol kg−1 in summer, and (ii) an intraseasonal scale from less (∼5 µmol kg−1 in summer) to more (∼60 µmol kg−1 in winter–spring) oxygenated mean states. However, for the similar winter–spring hypoxic–oxic conditions at the oxycline, the modulation of Teff (between 1 % and 68 %) suggests that a factor other than oxygen is restricting the mechanism of OM degradation and remineralisation.
3.2.2 The role of OM
In addition to oxygen, transport mechanisms, sinking time and trophic transfer having an effect, other processes that depend on the nature of particles may explain the contrast in transfer efficiency (Teff). Collected particles are marine and organic. Collected particles can mainly be considered to be OM, based on the similar modulation of Teff for POC and the transfer efficiency for the total particles (Figs. S1, S2 and S4). Indeed C : N ratios at 34 m (between 5.7 and 10.1, Tables 3b and S3a) are always below 20, which is characteristic of a marine origin (Mayers, 1993), although approximately 13 % higher than the canonical Redfield values (Redfield et al., 1963). Carbon isotopic signatures (δ13C) are between −22.7 ‰ and −17.4 ‰ and δ15N between 3.5 ‰ and 13.1 ‰ (Tables 3c and S4). These δ13C values are consistent with marine organic compounds and inconsistent with terrigenous influence (Degens et al., 1968; Ohkouchi et al., 2015; Bardhan et al., 2015).
Variability in the exported OM acts as anabolic biogeochemical forcing, supplying the OMZ with particles to be degraded and remineralised. OM variability thereby potentially mitigates the transfer efficiency (Teff). The variability in the particle flux collected in the upper trap is thus considered in order to understand the role of OM quantity and quality on transfer efficiency (Teff).
Quantitatively, the POC flux at 34 m presents a seasonal variability. POC flux values are 40 % higher during AMOPwinter–spring than AMOPsummer (on average 131 and 93 mgC m−2 d−1, respectively). POC flux also presents a stronger intra-seasonal variability during AMOPwinter–spring, being more than 1.5 times more variable than during AMOPsummer. This is confirmed by the fluorescence measurement at 31 m, higher for AMOPwinter–spring than for AMOPsummer (Fig. 4e–f). In fact, a deepening of the MLD as a response to the wind strengthening can increase the fluorescence values at 31 m by stronger vertical mixing of the chlorophyll produced at the surface. Thus, mixing of the surface productivity with the subsurface layers could contribute to an increase in fluorescence in the subsurface.
During the AMOPwinter–spring winter period, low light availability and high mixing (Fig. 4d) induce low surface productivity according to lower fluorescence values at 31 m. The lower fluorescence contributes to the low POC flux recorded by the upper trap (Fig. 4f). Conversely, in spring, the water column stratifies (MLD decrease; Fig. 4d). The surface productivity increases in line with higher fluorescence values (globally higher than 1 µg L−1). This productivity increase leads to a higher concentration of particles and a POC flux about 10 times stronger than in winter (239.58<24.79 mgC m−2 d−1; Figs. 2b and 4f). The Teff decrease from winter to early spring, characterised by high and intermediate (>20 %) and low (<6 %) values, respectively, follows a power tendency line (Fig. 5). An increase in remineralisation activity as a consequence of a primary productivity increases could be suspected, as previously reported for the anoxic basin of Cariaco (Thunell et al., 2000).

Figure 5Vertical transfer efficiency for POC (Teff) versus POC flux at the upper trap. Teff versus POC flux in mgC m−2 d−1 at 34 m for the AMOPwinter–spring (denoted AMOP2) dataset filtering samples with Teff>100 % (thus excluding AMOP2-S1, AMOP2-S3 and AMOP2-S6; see Sect. 3.1.2), with a power tendency line (R2=0.88).
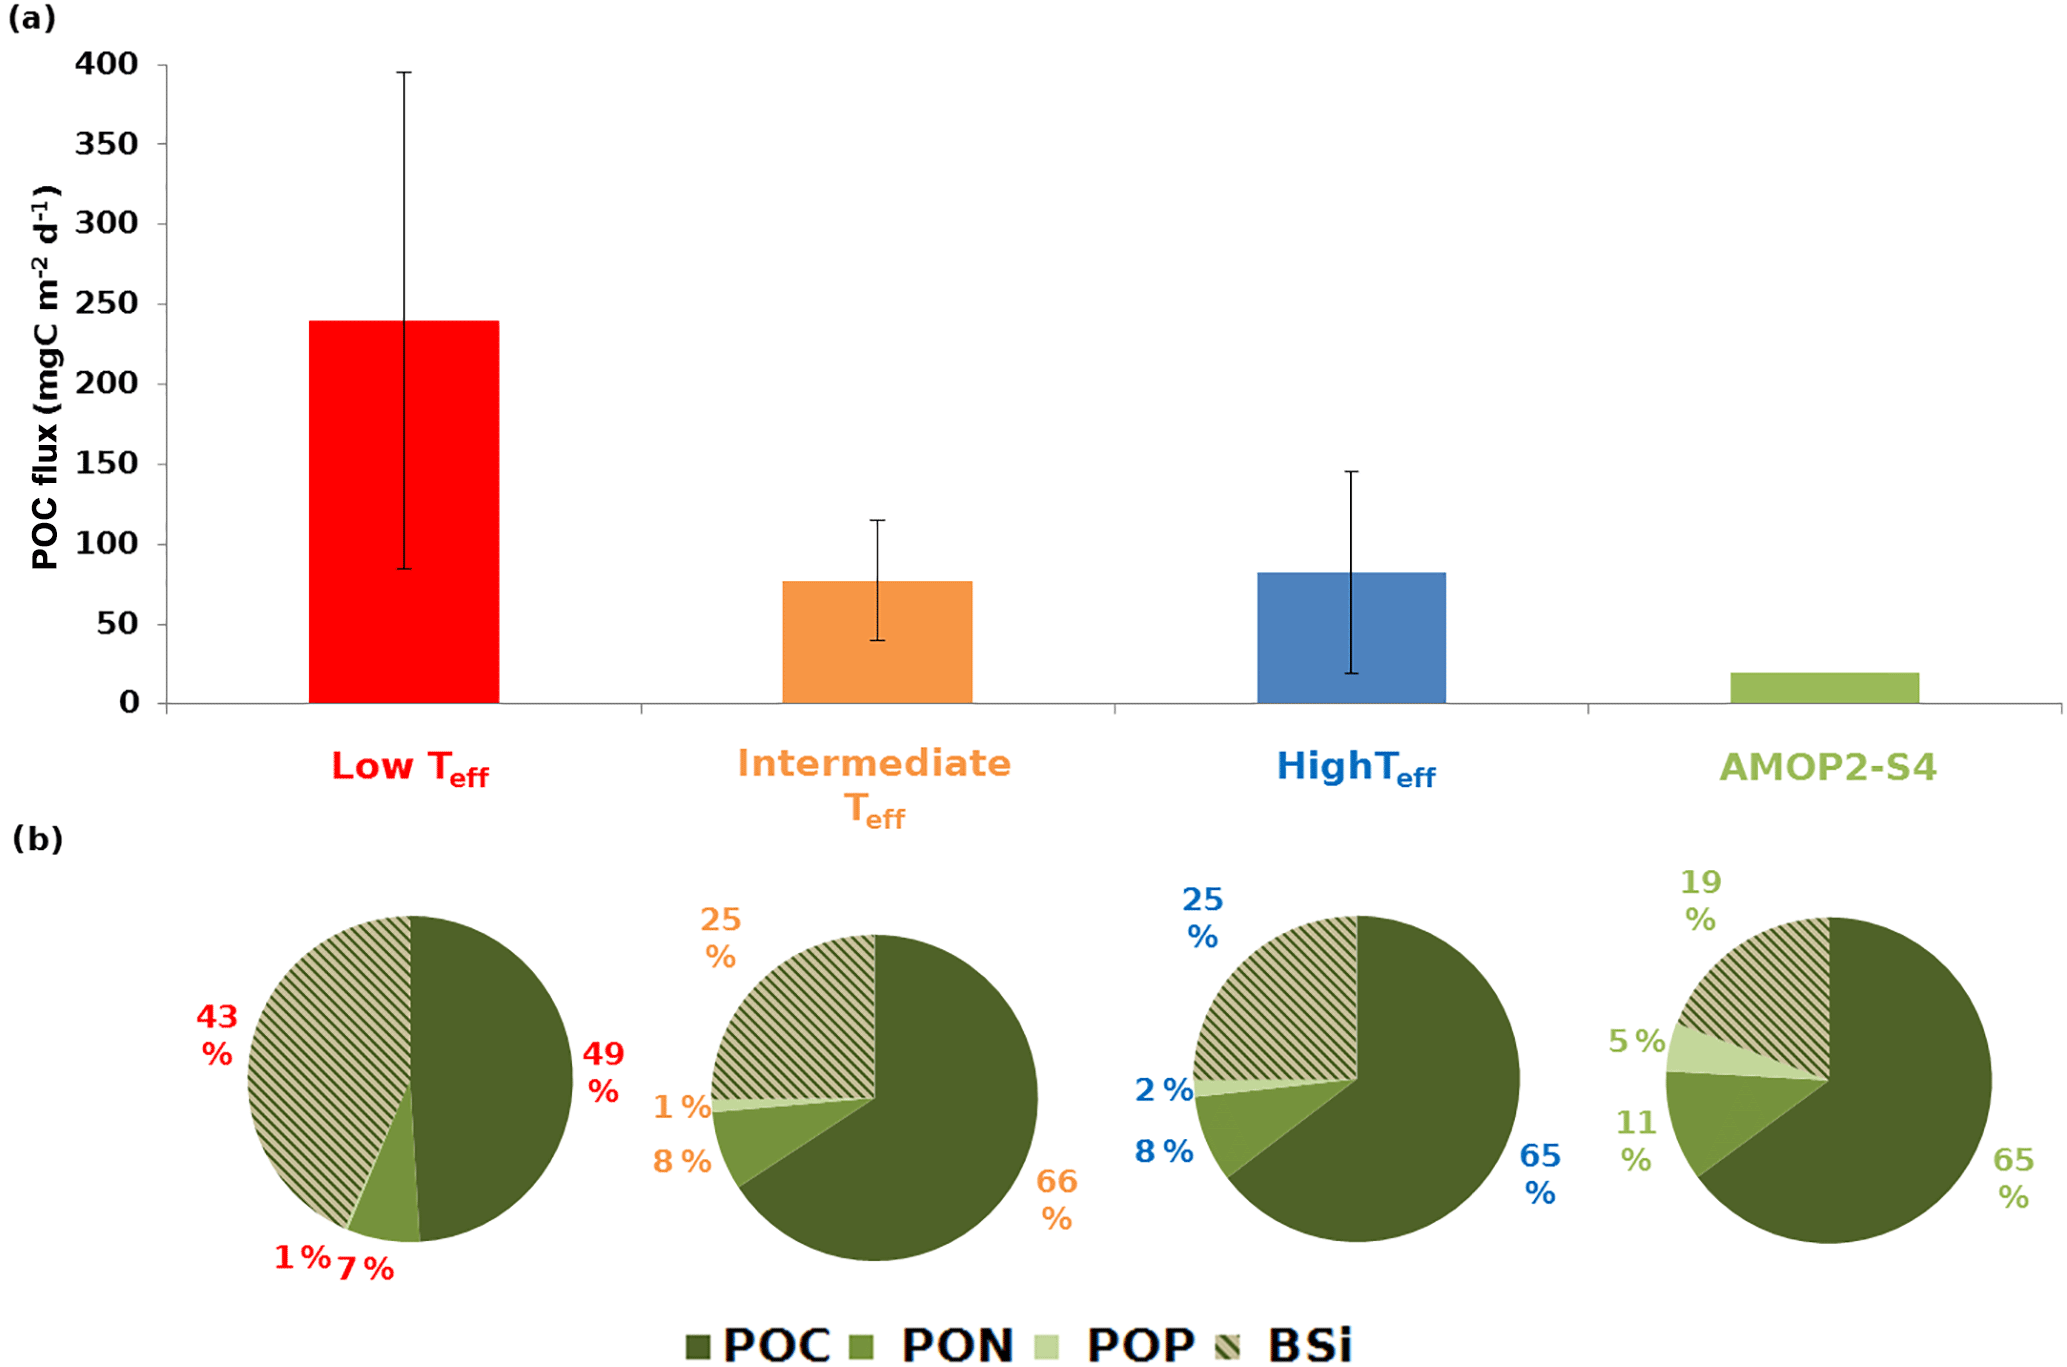
Figure 6Average mass flux and particle composition at the upper sediment trap (34 m) averaged by the main Teff ranges. (a) Histograms of POC fluxes in mgC m−2 d−1 (see Fig. 2) with error bars corresponding to the standard deviation. (b) Sector diagrams of particle composition (mol%) in terms of particulate organic carbon (POC), particulate organic nitrogen (PON), particulate organic phosphorus (POP) and biogenic silica (BSi). The values indicated as a percentage correspond to the abundance of one element relative to the sum of the four other elements analysed here for the OM. For more details, see Tables S1 and S2. Note that due to its specific OM quality at 34 m, the AMOP2-S4 sample has been extracted from the intermediate Teff range and represented separately.
During AMOPsummer in suboxic conditions at the oxycline and O2 limitation of OM degradation, the events of slight oxygenation have supported the modulation of Teff from high (>40 %; AMOPsummer-S2, AMOPsummer-S3, AMOPsummer-S5, AMOPsummer-S7, AMOPsummer-S11) to low (<40 %; AMOPsummer-S6, AMOPsummer-S8, AMOPsummer-S9, AMOPsummer-S10) intermediate values, except for AMOPsummer-S1 (considered apart; see Sect. 3.1.2). Now, the variability in OM quantity together with O2 availability is analysed to identify conditions potentially leading to remineralisation-like and preservation-like configurations (Teff below or above 50 %). The highest POC fluxes (>85 mgC m−2 d−1) at 34 m occur from AMOPsummer-S1 to AMOPsummer-S6 and AMOPsummer-S8 to AMOPsummer-S9 (Figs. 2a and 4e). For AMOPsummer-S7 and from AMOPsummer-S10 to AMOPsummer-S12, POC fluxes are ∼30 % lower than the seasonal average. The low OM quantity could therefore explain a weaker remineralisation and thus a slightly higher Teff (up to 57 %). However, limitation of both O2 and OM, simultaneously (co-limitation) or not, should be considered. When the ratio POC flux ∕ [O2] is far from the mean range, POC flux ∕ [O2] values define a severe limitation in OM only (<7 for AMOPsummer-S11) or O2 only (>27 for AMOPsummer-S2 and AMOPsummer-S3). In these cases, Teff becomes high. Conversely, the ratio POC flux ∕ [O2] remains closer to the mean range (7<27) for AMOPsummer-S4, AMOPsummer-S5, AMOPsummer-S6, AMOPsummer-S7, AMOPsummer-S8, AMOPsummer-S9, AMOPsummer-S10 and AMOPsummer-S12, except for AMOPsummer-S1 (considered apart; see Sect. 3.1.2). In these cases, Teff remains intermediate (20 < 50 %), associated with a potentially balanced co-limitation in O2 and OM on OM degradation.
Qualitatively, the evolution of elemental fluxes at 34 m should be considered in investigating whether the composition of a more or less labile OM can affect transfer efficiency (Teff) in addition to the OM availability. For both datasets, POC and PON fluxes show a strong linear correlation with the total particle mass fluxes at the upper trap as well as for the lower trap (R2=0.98 for both traps; Fig. S2a, b).
To study the influence of particle quality on transfer efficiency, the composition was averaged for the three main ranges of Teff. Also, as the matter collected in the trap is mainly organic, only the four main components (POC, PON, POP and BSi) were considered here. Whatever the range of Teff, the particle flux is dominated by POC. Then, BSi, PON and POP contribute in different proportions to the particle flux (Fig. 6b; Tables 3a and S2). For low Teff, POC dominates with only 49 %. For intermediate (including AMOPwinter–spring-S4) and high Teff ranges, POC remains relatively constant reaching 65 %–66 % of the total . Conversely, BSi reaches 43 % for low Teff. For the relatively constant intermediate and high Teff ranges, BSi only reaches 25 %. Whatever the Teff range, PON and POP have a relatively stable contribution of 7 %–8 % and 1 %–2 %, respectively. Between intermediate and high Teff ranges, the relative constancy in the composition of the particles does not allow the investigation of the influence of the quality on transfer efficiency.
Nevertheless, for the remineralisation event observed in AMOPwinter–spring-S4, while OM quantity was expected to limit remineralisation, the influence of quality should be pointed out as another factor acting on its low intermediate Teff (32 %; Fig. 6, Table 1). Indeed, this sample is specifically characterised by a relatively low BSi content (∼19 %, 50 % lower than the winter average) and the highest PON and POP proportions (35 % and 5 times higher than the winter average, respectively; Fig. 6b; Table S2). For this sample, the relative proportion of BSi decreases and that of PON increases compared to the other intermediate, low and high Teff samples, leading to less refractory and more labile matter, preferentially degraded. The difference in composition for this sample could also be seen in terms of calcium carbonate. The AMOPwinter–spring-S4 CaCO3 upper flux exhibits a maximum at this date compared to other intermediate and high Teff (Table 3c) and about 5 times higher (20 % of the total mass flux) than the average for the entire dataset (Table S5). A difference in the phytoplankton community could be at the origin of this distinction. Indeed, at the beginning of the AMOPwinter–spring dataset and up to this sample, the MLD is relatively stable. No strong MLD deepening is observed as a consequence of wind intensification. As the surface productivity is mainly due to diatoms, this long period with no strong mixing events can induce silica depletion at the surface, limiting diatom growth. This hypothesis is supported by the analysis of the phytoplankton functional types around the mooring location using MODIS data and the algorithm developed by Hirata et al. (2011). For AMOPwinter–spring-S4, prymnesiophytes become the most influent phytoplanktonic group. The dominance of prymnesiophytes in this sample could have induced a change in the composition of the sinking particles. In particular, their BSi proportion decreases, leading to a more labile matter.
The composition of the matter at the upper trap can also be observed as a function of the particulate molar ratios to identify the relative elemental excess or deficit. Whatever the considered range of Teff, BSi appears to be in excess. Si : C, Si : N and Si : P are on average 3.9, 4.4 and 3.0 times higher than the classical ones, respectively (Table S3b). The strongest BSi excess can be assessed for low Teff (ratio ∼5 times higher than the classical ones; Table 3b). For the other elemental ratios, low Teff appears to be different from the other Teff ranges. Indeed, low Teff presents a relative POP deficit (C : P and N : P ∼20 % higher than classical ones) with a C : N ratio equal to the classical one (6.67). Conversely, the other Teff ranges present a relative POP excess (C : P and N : P about half the amount of classical ones), with a PON deficit relative to POC (C : N) between 12 and 24 %.
Molar ratios at 34 m for AMOPwinter–spring-S4 confirm the analysis of elemental composition (Fig. 6b). In particular, BSi deficit (e.g. Si : C and Si : N about twice as low and Si : P ∼4 times lower than classical ones) and P excess (C : P and N : P ∼8 times higher than classical ones; Table S3) are reported. However, Si : P, C : N, C : P and N : P present strong intra-seasonal variability. Relative SD reaches 60 % for the intermediate Teff range. In particular, reported Si : P, C : N, C : P and N : P values are below or above standard reference levels, whatever the Teff range.
Therefore, the OM quantity produced above the oxycline appears to have a stronger influence on transfer efficiency than the OM quality of the sinking particles. However, more or less labile materials can also contribute to better preservation and export of particles towards sediment or their remineralisation in the upper layers of the ocean. Together with oxygenation conditions, OM quantity is a major factor in triggering strong remineralisation. It may be strengthened or mitigated by OM quality, which is considered here to be a secondary factor. The significance of cofactors is consistent with the fact that oxic or anoxic conditions have a different effect on OM degradation (faster or slower, respectively) depending on the OM components considered (e.g. Taylor et al., 2009).
3.3 Vertical flux modulation for elemental and isotopic components
The analysis of particle transfer efficiency through the OMZ has been focussed on the carbon element, defining three main Teff ranges. Here we study the transfer efficiencies of other particle components (TeffPON for PON, TeffPOP for POP, TeffBSi for BSi, for CaCO3, and for isotopic signatures) as well as their modulation and distribution.
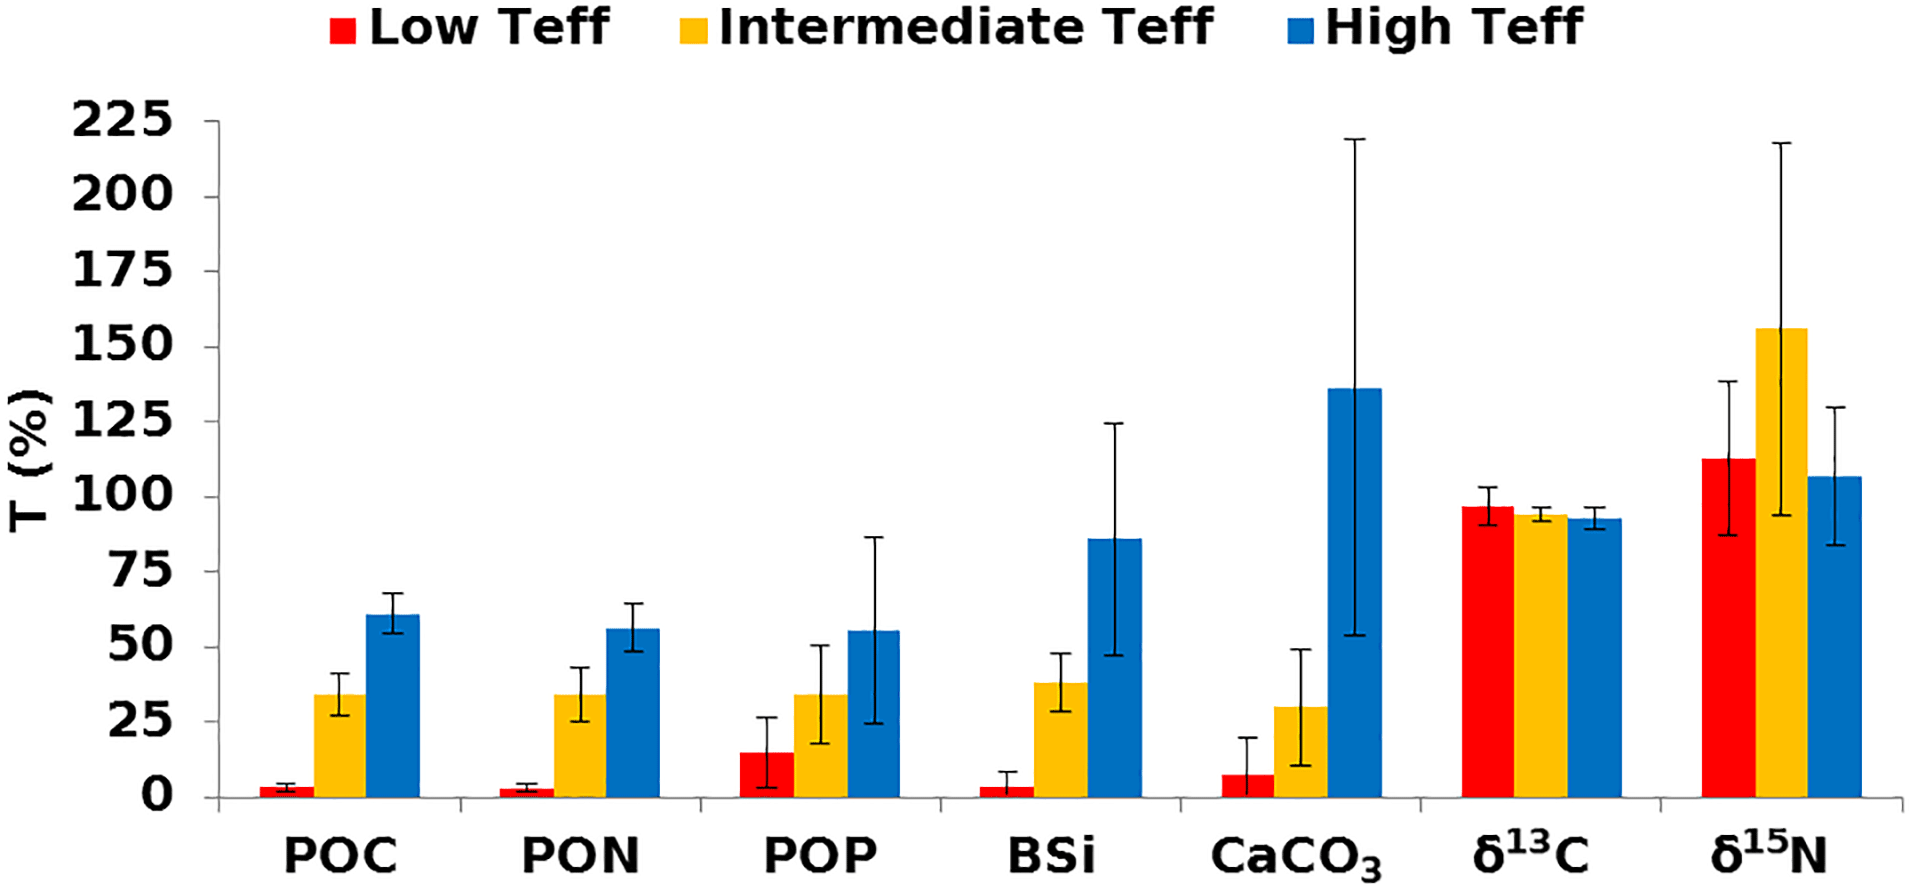
Figure 7Mean transfer efficiency for the main components of the particle fluxes (related to POC, PON, POP, BSi, CaCO3, and particulate δ13C and δ15N), as a function of the three main Teff ranges defined from POC fluxes. The transfer efficiencies for PON (TeffPON), POP (TeffPOP), BSi (TeffBSi), CaCO3 (), δ13C () and 15N () are derived from Eq. (1), as for Teff. Error bars represent the associated standard deviation of the elemental transfer for the considered Teff ranges (more details in Table 3).
All transfer efficiencies for the elemental composition present a low range (<15 %), clearly dissociated from the intermediate (15<55 %) and high (55<80 %) ranges (Table S2). TeffPOP alone shows a more gradual transition between 0 and 55 %. Due to the similar distribution of the transfer efficiency ranges for POC and other elemental components, the three main Teff ranges (low, intermediate, high) defined for Teff are kept (Fig. 7; Table 3). However, at low Teff, TeffPOP remains higher than 6 % (15 %). TeffPOP of 15 % represents a decrease with respect to the intermediate range and is 5 times lower than for the other elements. This could indicate a relative accumulation of phosphorus. In remineralisation-like configuration, potential accumulation suggests that phosphorus material may remain more refractory than nitrogen-rich amino acids, which are preferentially degraded (Van Mooy et al., 2002; Böning et al., 2004; Pantoja et al., 2004; Diaz et al., 2008). Considering the fluxes of one element relative to the other, the study of the vertical transfer efficiency of the elemental ratios (TeffC : N for C : N, TeffC : P for C : P, TeffN : P for N : P, TeffSi : C for Si : C, TeffSi : N for Si : N and TeffSi : P for Si : P; Tables 3b and S3) supports the previous analysis (from Fig. 7). The vertical transfer efficiency TeffC : N remains relatively constant from low to high Teff ranges, in agreement with the covariation of POC and PON fluxes at the upper and lower traps and of Teff and TeffPON (Fig. S2b and d). During the remineralisation-like configuration, the vertical C : P and N : P transfer efficiencies sharply decrease by a factor of 3 from intermediate to low TeffC : P and TeffN : P reaching ∼35 % (Table 3b). These TeffC : P and TeffN : P decreases are in line with a potential relative enrichment of more refractory phosphorous materials. Also, C : P and N : P ratios are higher in the upper trap and become lower in the lower trap than the classical values. Analysis of the transfer efficiency of the molar ratios involving BSi is more complex. TeffSi : C and TeffSi : N remain relatively constant for the three Teff ranges. However, TeffSi : P presents a huge decrease by a factor of 7 from high to low Teff ranges. The antagonist interplay of the refractory BSi properties and the dissolution effect on BSi (e.g. Loucaides et al., 2008) must be considered, in addition to recycling mainly occurring at the sediment–water interface (e.g. Tréguer and De La Rocha, 2013).
The CaCO3 flux collected in the deep trap appears to be about twice as high as the global average in preservation-like configurations (high Teff; Tables 3c and S5). The high Teff range is characterised by higher than 100 % (133 %). A potential accumulation and/or aggregation of calcium carbonate particles, known for their refractory properties (e.g. from coccolithophorids or planktonic foraminifera) with depth could be responsible. The comparison from high to intermediate Teff ranges shows a decrease of twice the amount as for the other components (Teff, TeffPON, TeffPOP and TeffBSi). The decrease could simply be related to changes in the composition of the calcifying plankton community in the surface layer or possibly in the subsurface OMZ. However, the relative constancy, especially in the upper trap, regarding the elemental composition in the reported fluxes, the swimmer communities and the upper CaCO3 flux (see Fig. 6b, Tables 2 and 3) suggests that the decrease could be associated with a stimulation of significant water column dissolution. Since the intermediate Teff range corresponds to a large predominance of ∼90 AMOPsummer samples (∼90 %, Table 1), the explanation is focussed on AMOPsummer only and based on the following consideration.
The CaCO3 transfer efficiency could be modulated partly by pH conditions, and partly as a consequence of ballast. Indeed, OMZs are characterised by low-pH conditions (Paulmier and Ruiz-Pino, 2009; Paulmier et al., 2011; León et al., 2011) and may induce calcite dissolution (e.g. Orr et al., 2005). As low pH was recorded in a cross-shore section during the AMOP cruise (austral summer 2014, Fig. S3), CaCO3 dissolution could potentially be considered as a factor acting on CaCO3 transfer in AMOPsummer samples. Moreover, because of the refractory nature of CaCO3, it could accumulate along the water column. This potential CaCO3 accumulation could explain the high transfer efficiency. Ballasting could therefore explain the transfer efficiency of over 100 % for some samples. Note however that the error bar on is high, and thus does not allow precise differentiation among these invoked processes.
In line with palaeoceanographic studies, it should be interesting to focus on the evolution of particulate δ13C and δ15N as a function of the Teff ranges. and remain around 100 % whatever the Teff ranges (Fig. 7, Table 3c). While δ13C appears to slightly decrease during particle sinking (average of 95 %; Table S4), no significant distinction among low, intermediate and high Teff ranges could be made. For all Teff ranges and all considered seasons, carbon isotope is slightly heavier in the lower trap (Table S4). The enrichment in heavy isotopes with depth potentially indicates an increasing influence of inorganic carbon with depth. The variation appears to be stronger than , varying between 83 % and 267 % (average of 125 % ± 37 %). remains high (∼100 % and higher) with variations of up to 40 %. The highest (156 %) occurs for the intermediate Teff range. But is lower for low and high Teff ranges (107 % and 113 %, respectively). The differences between ranges could be linked to the vertical alteration of particulate δ15N distribution associated with the OMZ oxycline and core structure (Libes and Deuser, 1988). The three Teff range configurations could correspond to different (i) chemical and isotopic PON compositions associated with different metabolic pathways of OM synthesis, or (ii) oxycline depths and/or oxygenations impacting the microbial activities and the OM degradation processes. The alteration to particulate δ15N is potentially due to the microbial activities and chemical and isotopic PON compositions associated with the different metabolic pathways of OM synthesis. In addition, the depth and oxygenation of the oxycline should play an important role in explaining the differences among low, intermediate and high Teff ranges. However, one should be cautious with these results, as the variability in δ15N for the entire dataset does not allow strict differentiation among the ranges.
Therefore, in the OMZ, short-term [O2] fluctuations and particle loading appear to be significant. They should be considered for further studies on OM fate, carbon sequestration, nutrient regeneration, and the production or consumption of greenhouse and toxic dissolved gas. These effects call for the development of variable molar ratio models for OM production mechanisms, and OMZ remineralisation processes, and for the revised interpretation of palaeo-proxies.
The seasonal and intraseasonal analysis of particles collected using sediment traps in the oxycline and the core of the Peruvian EBUS confirms that the OMZ can behave as either a recycling or a preservation system for organic matter (OM). Transfer efficiency (Teff) presents variations that can be classified into three main characteristic ranges: high with 50 < Teff < 75 % associated with preservation capacity, intermediate with 20 < Teff < 50 % or low with Teff < 6 %, associated with remineralisation capacity. These Teff variations represent a more or less efficient carbon export through the OMZ. Seasonally, two different steady states are defined for oxygen conditions. The suboxic regime ([O2] < 25 µmol kg−1) occurs mainly in austral summer. The hypoxic–oxic regime occurs in austral winter and early spring (15 < [O2] < 160 µmol kg−1). Suboxia is expected to foster OM preservation and therefore enhance transfer efficiency. But low-O2 conditions occurring in austral summer can also induce slight remineralisation, as a consequence of episodic wind-driven oxygenation events. In addition to oxygenation conditions, sinking particles from the oxycline play a role in transfer efficiency. Indeed, the high POC flux (>80 mgC m−2 d−1) end of winter–early spring can provide enough substrates to sustain the anabolic requirement of the microbial activity and shut down the vertical transfer (Teff<6 %). In contrast, the extreme deficits in oxygen ([O2] < 5 µmol kg−1 at the oxycline) or OM (<40 mgC m−2 d−1) are considered a limitation for OM degradation activity (e.g. microbial remineralisation and zooplankton feeding on particles). These configurations correspond to the most efficient POC transfer (Teff>50 %) for both summer and winter seasons. Between high and low Teff, higher levels of O2 or OM, even in a co-limitation context, can lead to slightly decreased OMZ transfer efficiency (20<50 %), especially in summer (20<40 %). For all sampling seasons, particle composition could be considered stable, mainly composed of POC and BSi. The stable particle composition thus does not allow a full investigation of the question of the impact of OM quality. In the time and spatial location covered by this study, OM quality does not seem to be the main factor leading to Teff modulation. Only punctually could the occurrence of nitrogen-rich organic compounds in relatively well-oxygenated water strengthen remineralisation activity, with low intermediate Teff (32 %). This study reconciles two opposite views concerning the effects of OMZ behaviour on OM cycling. It supports the existence of both dynamic and static balanced biogeochemical states defined as states with and without significant remineralisation and O2 consumption, respectively. The key microbial feedback on particles including their elemental composition as well as detailing the role of OM quality should be further investigated. This is expected to lead to a better understanding of the vertical OM transfer efficiency of the OMZ and its modulation. Climate projections and paleoceanography studies should therefore consider the intermittence of OMZ preservation or recycling capacity, which is crucial for global biogeochemical budgets.
The data can be obtained by contacting the author (aurelien.paulmier@legos.obs-mip.fr).
The supplement related to this article is available online at: https://doi.org/10.5194/bg-15-5093-2018-supplement.
MB, AP and VG performed the research. AP and VG designed research. MB, AP, VG, BD, SI, FC, JMHA, OV, IM and PM analysed the data and provided complementary analysis. MB and NL analysed the sediment trap samples. AP, VG, BD, NL, LC, FC, FV, CP, HM, EC, JG, OD, AO, JMHA, OV, CM and LS contributed to the sediment trap sampling and analysis as well to the mooring design and implementation. MB, AP, VG, BD, CP, HM, PM and AO wrote the paper.
The authors declare that they have no conflict of interest.
We would like to thank the crew of the German R/V Meteor for the
deployment as part of the DFG-funded SFB754 fieldwork, the crew of the
Peruvian R/V Olaya for the visit and the crew of the French R/V
Atalante for the recovery of the fixed AMOP mooring. We would like
to thank Stefan Sommer and Marcus Dengler for providing the METEOR wind
dataset. We would also like to thank Miriam Soto, Anne Royer and
Emmanuel De Saint Léger for general logistics and administrative support.
We are grateful to Vincent Rossi for discussions regarding the processes
affecting the sinking speed of the particles. We are finally also grateful to
Christophe Lerebourg, from ACRI-ST, for his support during the course of this
study. This work was supported by the AMOP (“Activity of research dedicated
to the Minimum of Oxygen in the eastern Pacific”) project supported by IRD,
CNRS/INSU, DT-INSU and LEGOS, and by a GIS COOC (UPMC, INSU/CNRS, CNES,
ACRI-ST) PhD grant.
Edited by: Caroline P.
Slomp
Reviewed by: two anonymous referees
Azam, F., Steward, G. F., Smith, D. C., and Ducklow, H. W.: Significance of bacteria in carbon fluxes in the Arabian Sea, Earth Planet. Sci., 103, 341–351, 1994.
Baker, E. T., Milburn, H. B., and Tennant, D. A.: Field assessment of sediment trap efficiency under varying flow conditions, J. Mar. Res., 46, 573–592, 1988.
Bardhan, P., Karapurkar, S. G., Shenoy, D. M., Kurian, S., Sarkar, A., Maya, M. V., Naik, H., Varik, S., and Naqvi, S. W. A.: Carbon and nitrogen isotopic composition of suspended particulate organic matter in Zuari Estuary, west coast of India, J. Marine Syst., 141, 90–97, 2015.
Berelson, W. M.: The flux of particulate organic carbon into the ocean interior: A comparison of four U.S. JGOFS regional studies, Oceanography, 14, 59–67, 2001.
Böning, P., Brumsack, H. J., Böttcher, M. E., Schnetger, B., Kriete, C., Kallmeyer, J., and Borchers, S. L.: Geochemistry of Peruvian near-surface sediments, Geochim. Cosmochim. Ac., 68, 4429–4451 2004.
Brzezinski, M. A.: The Si : C : N ratio of marine diatoms: interspecific variability and the effect of some environmental variables, J. Phycol., 21, 347–357, 1985.
Buesseler, K. O., Lamborg, C. H., Boyd, P. W., Lam, P. J., Trull, T. W., Bidigare, R. R., Bishop, J. K. B., Casciotti, K. L., Dehairs, F., Elskens, M., Honda, M., Karl, D. M., Siegel, D. A., Silver, M. W., Steinberg, D. K., Valdes, J., Van Mooy, B., and Wilson, S.: Revisiting carbon flux through the ocean's twilight zone, Science, 316, 567–570, 2007.
Cabré, A., Marinov, I., Bernardello, R., and Bianchi, D.: Oxygen minimum zones in the tropical Pacific across CMIP5 models: mean state differences and climate change trends, Biogeosciences, 12, 5429–5454, https://doi.org/10.5194/bg-12-5429-2015, 2015.
Chaigneau, A., Domingez, N., Eldin, G., Flores, R., Grados, C., and Echevin, V.: Near-Coastal circulation in the Northern Humboldt Current System from shipboard ADCP data, J. Geophys. Res., 118, 5251–5266, 2013.
Chavez, F. P. and Messié, M.: A comparison of Eastern Boundary Upwelling Ecosystems, Prog. Oceanogr., 83, 80–96, 2009.
Chavez, F. P., Bertrand, A., Guevara-Carraso, R., and Csirke, J.: The northern Humboldt Current System: Brief history, present status and a view towards the future, Prog. Oceanogr., 79, 95–105, 2008.
Chi Fru, E., Rodriguez, N. P., Partin, C. A., Lalonde, S. V., Andersson, P., Weis, D. J., El Albani, A., Rodushkin, I., and Konhauser, K. O.: Cu isotopes in marine black shales record the Great Oxidation Event, P. Natl. Acad. Sci. USA, 113, 4941–4946, 2016.
de Boyer Montegut, C., Fischer, A. S., Lazar, A., and Iudicone, D.: Mixed layer depth over the global ocean: An examination of profile data and a profile-based climatology, J. Geophys. Res., 109, C12003, https://doi.org/10.1029/2004JC002378, 2004.
Degens, E. T., Behrendt, M., Gotthard, B., and Reppmann, E.: Metabolic fractionation of carbon isotopes in marine plankton-II, Data on samples collected off the coasts of Peru and Ecuador, Deep-Sea Res., 15, 11–20, 1968.
DeMaster, D. J.: The supply and accumulation of silica in the marine environment, Geochim. Cosmochim. Ac., 45, 1715–1732, 1981.
Devol, A. H.: Bacterial oxygen uptake kinetics as related to biological processes in oxygen deficient zones of the oceans, Deep-Sea Res., 25, 137–146, 1978.
Devol, A. H. and Hartnett, H. E.: Role of the oxygen-deficient zone in transfer of organic carbon to the deep ocean, Limnol. Oceanogr., 46, 1684–1690, 2001.
Dewitte, B., Illig, S., Renault, L., Gourbanova, K., Takahashi, K., and Gushchina, D.: Modes of variability between sea surface temperature and wind stress intraseasonal anomalies along the coast of Peru from satellite observation, J. Geophys. Res., 116, 04028, https://doi.org/10.1029/2010JC006495, 2011.
Dewitte, B., Vazquez-Cuervo, J., Goubanova, K., Illig, S., Takahashi, K., Cambon, G., Purca, S., Correa, D., Gutierrez, D., Sifeddine, A., and Ortlieb, L.: Change in El Niño flavours over 1958–2008: Implications for the long-term trend of the upwelling off Peru, Deep-Sea Res. Pt. II, 77–80, 143–156, 2012.
Diaz, J., Ingall, E., Benitez-Nelson, C., Paterson, D., de Jonge, M. D., McNulty, I., and Brandes, J. A.: Marine polyphosphate: a key player in geologic phosphorus sequestration, Sciences, 320, 652–655, 2008.
Garcia-Robledo, E., Padilla, C. C., Aldunate, M., Stewart, F. J., Ulloa, O., Paulmier, A., Gregori, G., and Revsbech, N. P.: Cryptic Oxygen cycling in Anoxic Marine Zones, P. Natl. Acad. Sci. USA, 114, 8319–8324, https://doi.org/10.1073/pnas.1619844114, 2017.
Heimburger, L. E., Lavigne, E., Migon, C., D'ortenzio, F., Estournel, C., Coppola, L., and Miquel, J. C.: Temporal variability of vertical flux at the DYFAMED time-series station (Northwestern Mediterranean Sea), Prog. Oceanogr., 119, 59–67, 2013.
Helmke, P., Romero, O., and Fischer, G.: Northwest African upwelling and its effect on offshore organic carbon export to the deep sea, Global Biogeochem. Cy., 19, GB4015, https://doi.org/10.1029/2004GB002265, 2005.
Hirata, T., Hardman-Mountford, N. J., Brewin, R. J. W., Aiken, J., Barlow, R., Suzuki, K., Isada, T., Howell, E., Hashioka, T., Noguchi-Aita, M., and Yamanaka, Y.: Synoptic relationships between surface Chlorophyll-a and diagnostic pigments specific to phytoplankton functional types, Biogeosciences, 8, 311–327, https://doi.org/10.5194/bg-8-311-2011, 2011.
Illig, S., Dewitte, B., Goubanova K., Cambon, G., Boucharel, J., Monetti, F., Romero, C., Purca, S., and Flores, R.: Forcing mechanisms of intraseasonal SST variability off central Peru in 2000–2008, J. Geophys. Res.-Oceans, 119, 3548–3573, https://doi.org/10.1002/2013JC009779, 2014.
Kalvelage, T., Lavik, G., Lam, P., Contreras, S., Arteaga, L., Löscher, C. R., and Kuypers, M. M.: Nitrogen cycling driven by organic matter export in the South Pacific oxygen minimum zone, Nat. Geosci., 6, 228–234, 2013.
Keil, R. G., Neibauer, J. A., Biladeau, C., van der Elst, K., and Devol, A. H.: A multiproxy approach to understanding the “enhanced” flux of organic matter through the oxygen-deficient waters of the Arabian Sea, Biogeosciences, 13, 2077–2092, https://doi.org/10.5194/bg-13-2077-2016, 2016.
Lam, P., Lavik, G., Jensen, M. M., Van de Vossenberg, J., Schmidt, M., Woebken, D., Gutierez, D., Amann, M., Jetten, S. M., and Kuypers, M. M.: Revising the nitrogen cycle in the Peruvian oxygen minimum zone, P. Natl. Acad. Sci. USA, 106, 4752–4757, 2009.
Lampitt, R. S., Noji, T., and Von Bodungen, B.: What happens to zooplankton faecal pellets? Implications for material flux, Mar. Biol., 104, 15–23, 1990.
Law, C. S., Brévière, E., De Leeuw, G., Garçon, V., Guieu, C., Kieber, D. J., Kontradowitz, S., Paulmier, A., Quinn, P. K., Saltzman, E. S., Stefels, J., and von Glasow, R.: Evolving research directions in surface ocean–lower atmosphere (SOLAS) science, Environ. Chem., 10, 1–16, https://doi.org/10.1071/EN12159, 2012.
León, V., Paulmier, A., Ledesma, J., Croot, P., Graco, M., Flores, G., Morón, O., and Tenorio, J.: pH como un Trazador de la Variabilidad Biogeoquímica en el Sistema de Humboldt, Boletin del IMARPE, 26, http://biblioimarpe.imarpe.gob.pe:8080/handle/123456789/2156 (last access: 19 August 2018), 2011.
Lewis, E. and Wallace, D. W. R.: Program Developed for CO2 System Calculations, edited by: ORNL/CDIAC-105a, Carbon Dioxide Information Analysis Center, Oak Ridge National Laboratory, U.S. Department of Energy, Oak Ridge, Tennessee, 1998.
Libes, S. M. and Deuser, W. G.: The isotope geochemistry of particulate nitrogen in the Peru upwelling area and the Gulf of Maine, Deep-Sea Res. Pt. A, 35, 517–533, 1988.
Lipschultz, F., Wofsy, S. C., Ward, B. B., Codispoti, L. A., Friedrich, G., and Elkins, J. W.: Bacterial transformations of inorganic nitrogen in the oxygen deficient waters of the Eastern Tropical South Pacific Ocean, Deep-Sea Res., 35, 1513–1541, 1990.
Loucaides, S., Van Capellen, P., and Behrends, T: Dissolution of biogenic silica from land to ocean: Role of salinity and pH, Limnol. Oceanogr., 53, 1614–1621, 2008.
Lueker, T. J., Dickson, A. G., and Keeling, C. D.: Ocean pCO2 calculated from dissolved inorganic carbon, alkalinity, and equations for K1 and K2: validation based on laboratory measurements of CO2 in gas and seawater at equilibrium, Mar. Chem., 70, 105–119, 2000.
Marsay, C. M., Sanders, R. J., Henson, S. A., Pabortsava, K., Achterberg, E. P., and Lampitt, R. S.: Attenuation of sinking particulate organic carbon flux through the mesopelagic ocean, P. Natl. Acad. Sci. USA, 112, 1089–1094, 2015.
Martin J. H., Knauer, G. A., Karl, D. M., and Broenkow, W. W.: VERTEX: carbon cycling in the NE Pacific, Deep-Sea Res., 34, 267–285, 1987.
Mayers, P. A.: Preservation of elemental and isotopic source identification of sedimentary organic matter, Chem. Geol., 114, 239–302, 1993.
McDonnell, A. M. P., Boyd, P. W., and Buesseler, K. O.: Effects of sinking velocities and microbial respiration rates on the attenuation of particulate carbon fluxes through the mesopelagic zone, Global Biogeochem. Cy., 29, 175–193, 2015.
Miquel, J. C., Martin, J., Gasser, B., Rodrigez-y-Baena, A., Toubal, T., and Fowler, S. W.: Dynamics of particles flux and carbon export in the northwestern Mediterranean Sea: A two scale time-series study at the DYFAMED site, Prog. Oceanogr., 91, 451–481, 2011.
Moffitt, S. E., Moffitt, R. A., Sauthoff, W., Davis, C. V., Hewett, K., and Hill, T. M.: Paleoceanographic Insights on Recent Oxygen Minimum Zone Expansion: Lessons for Modern Oceanography, PLoS ONE, 10, e0115246, https://doi.org/10.1371/journal.pone.0115246, 2015.
Montes, I., Colas, F., Capet, X., and Schneider, W.: On the pathways of the equatorial subsurface currents in the eastern equatorial Pacific and their contribution to Peru-Chile Undercurrent, J. Geophys. Res., 115, C09003, https://doi.org/10.1029/2009JC005710, 2010.
Oschlies, A., Duteil, O., Getzlaff, J., Koeve, W., Landolfi, A., and Schmidtko, S.: Patterns of deoxygenation: sensitivity to natural and anthropogenic drivers, Philos. T. Roy. Soc. A, 375, 20160325, https://doi.org/10.1098/rsta.2016.0325, 2017.
Ohkouchi, N., Ogawa, N. O., Chikaraishi, Y., Tanaka, H., and Wada, E.: Biochemical and physiology bases for the use of carbon and nitrogen isotopes in environmental and ecological studies, Prog. Earth Planet. Sci., 2, 1, https://doi.org/10.1186/s40645-015-0032-y, 2015.
Orr, J. C., Fabry, V. J., Aumont O., Bopp, L., Doney, S. C., Feely, R. A., Gnanadesikan, A., Gruber, N., Ishida, A., Joos, F., Key, R. M., Lindsay, K., Maier-Reimer, E., Matear, R., Monfray, P., Mouchet, A., Najjar, R. G., Plattner, G.-K., Rodgers, K. B., Sabine, C. L., Sarmiento, J. L., Schlitzer, R., Slater, R. D., Totterdell, I. J., Weirig, M.-F., Yamanaka, Y., and Yool, A.: Anthropogenic ocean acidification over the twenty-first century and its impact on calcifying organisms, Nature, 437, 681–686, https://doi.org/10.1038/nature04095, 2005.
Packard, T. T., Osma, N., Fernández-Urruzola, I., Codispoti, L. A., Christensen, J. P., and Gómez, M.: Peruvian upwelling plankton respiration: calculations of carbon flux, nutrient retention efficiency, and heterotrophic energy production, Biogeosciences, 12, 2641–2654, https://doi.org/10.5194/bg-12-2641-2015, 2015.
Pantoja, S., Sepulveda, J., and Gonzalez, H. E.: Decomposition of sinking proteinaceous material during fall in the oxygen minimum zone off northern Chile, Deep-Sea Res. Pt. I, 51, 55–70, 2004.
Paulmier, A. and Ruiz-Pino, D.: Oxygen minimum zones (OMZs) in the modern ocean, Prog. Oceanogr., 80, 113–128, 2009.
Paulmier, A., Ruiz-Pino, D., Garçon, V., and Farias, L.: Maintaining of the Eastern South Pacific Oxygen Minimum Zone (OMZ) off Chile, Geophys. Res. Lett., 33, L20601, https://doi.org/10.1029/2006GL026801, 2006.
Paulmier, A., Ruiz-Pino, D., and Garçon, V.: The oxygen minimum zones (OMZ) off Chile as intense source of CO2 and N2O, Cont. Shelf Res., 28, 2746–2756, 2008.
Paulmier, A., Kriest, I., and Oschlies, A.: Stoichiometries of remineralisation and denitrification in global biogeochemical ocean models, Biogeosciences, 6, 923–935, https://doi.org/10.5194/bg-6-923-2009, 2009.
Pennington, J. T., Mahoney, K. L., Kuwahara, V. S., Kolber, D. D., Calnies, R., and Chavez, F. P.: Primary production in the eastern tropical Pacific: A review, Prog. Oceanogr., 66, 285–317, 2006.
Ramaiah, N., Raghukumar, S., and Gauns, M.: Bacterial abundance and production in the central and eastern Arabian Sea, Curr. Sci. India, 71, 878–882, 1996.
Redfield, A. C., Ketchum, B. H., and Richards, F. A.: The influence of organism on the composition of the seawater, The Sea, 2, edited by: Hill, M. N., 26–77, Interscience, New-York, 1963.
Roullier, F., Berline, L., Guidi, L., Durrieu De Madron, X., Picheral, M., Sciandra, A., Pesant, S., and Stemmann, L.: Particle size distribution and estimated carbon flux across the Arabian Sea oxygen minimum zone, Biogeosciences, 11, 4541–4557, https://doi.org/10.5194/bg-11-4541-2014, 2014.
Siegel, D. A., Granata, T. C., Michaelis, A. F., and Dickey, T. D.: Mesoscale eddy diffusion, particle sinking and the interpretation of sediment trap data, J. Geophys. Res., 95, 5305–5311, 1990.
Sobarzo, M., Bravo, L., Donoso, D., Garcès-Vargas, J., and Schneider, W.: Coastal upwelling and seasonal cycles that influence the water column over the continental shelf of central Chile, Prog. Oceanogr., 75, 363–382, 2007.
Stemmann, L. and Boss, E.: Plankton and particle size and packaging: from determining optical properties to driving the biological pump, Annu. Rev. Mar. Sci., 4, 263–290, 2012.
Stemmann, L., Jackson, G. A., and Ianson, D.: A vertical model of particle size distributions and fluxes in the midwater column that includes biological and physical processes-Part I: model formulation, Deep-Sea Res. Pt. I, 51, 865–884, 2004.
Stewart, F. J., Ulloa, O., and DeLong, E. F.: Microbial metatranscriptomics in a permanent marine oxygen minimum zone, Environ. Microbiol., 14, 23–40, 2012.
Strickland, J. D. H. and Parsons, T. R.: A practical handbook of seawater analysis, Fisheries Research Board of Canada, 167, 49–62, 1972.
Suess, E.: Particulate organic carbon flux in the ocean-surface productivity and oxygen utilization, Nature, 288, 206–263, 1980.
Sun, M.-Y., Aller, R. C., Lee, C., and Wakeham, G.: Effect of oxygen and redox oscillation on degradation of cell-associated lipids in superficial marine sediments, Geochim. Cosmochim. Ac., 66, 2003–2012, 2002.
Taylor, G. T., Thunell, R. C., Varela, R., Benitez-Nelson, C. R., and Astor, Y.: Hydrolytic ectoenzyme activity associated with suspended and sinking organic particles within the anoxic Cariaco Basin, Deep-Sea Res. Pt. I, 56, https://doi.org/10.1016/j.dsr.2009.02.006, 2009.
Thunell, R. C., Varela, R., Llano, M., Collister, J., Karger, F. M., and Bohrer, R.: Organic carbon fluxes, degradation, and accumulation in an anoxic basin: sediment trap results from the Cariaco Basin, Limnol. Oceanogr., 45, 300–308, 2000.
Tréguer, P. J. and De La Rocha, C. L.: The world ocean silica cycle, Annu. Rev. Mar. Sci., 5, 477–501, 2013.
Van Mooy, B. A. S., Keil, R. G., and Devol, A. H.: Impact of suboxia on sinking particulate organic carbon: enhanced carbon flux and preferential degradation of amino-acids via denitrification, Geochim. Cosmochim. Ac., 66, 457–465, 2002.
Waniek, J., Koeve, W., and Prien, D.: Trajectories of sinking particles and the catchment areas above sediment traps in the northeast Atlantic, J. Mar. Res., 58, 983–1006, 2000.