the Creative Commons Attribution 4.0 License.
the Creative Commons Attribution 4.0 License.
 | 22 Aug 2018
Dissolved Pb and Pb isotopes in the North Atlantic from the GEOVIDE transect (GEOTRACES GA-01) and their decadal evolution
Cheryl M. Zurbrick
Richard J. Kayser
Matthew K. Reuer
Jingfeng Wu
Hélène Planquette
Rachel Shelley
Julia Boutorh
Marie Cheize
Leonardo Contreira
Jan-Lukas Menzel Barraqueta
François Lacan
Géraldine Sarthou
During the 2014 GEOVIDE transect, seawater samples were collected for dissolved Pb and Pb isotope analysis. These samples provide a high-resolution “snapshot” of the source regions for the present Pb distribution in the North Atlantic Ocean. Some of these stations were previously occupied for Pb from as early as 1981, and we compare the 2014 data with these older data, some of which are reported here for the first time. Lead concentrations were highest in subsurface Mediterranean Water (MW) near the coast of Portugal, which agrees well with other recent observations by the US GEOTRACES program (Noble et al., 2015). The recently formed Labrador Sea Water (LSW) between Greenland and Nova Scotia is much lower in Pb concentration than the older LSW found in the West European Basin due to decreases in Pb emissions into the atmosphere during the past 20 years. Comparison of North Atlantic data from 1989 to 2014 shows decreasing Pb concentrations consistent with decreased anthropogenic inputs, active scavenging, and advection/convection. Although the isotopic composition of northern North Atlantic seawater appears more homogenous compared to previous decades, a clear spatiotemporal trend in isotope ratios is evident over the past 15 years and implies that small changes to atmospheric Pb emissions continue. Emissions data indicate that the relative proportions of US and European Pb sources to the ocean have been relatively uniform during the past 2 decades, while aerosol data may suggest a greater relative proportion of natural mineral Pb. Using our measurements in conjunction with emissions inventories, we support the findings of previous atmospheric analyses that a significant portion of the Pb deposited to the ocean in 2014 was natural, although it is obscured by the much greater solubility of anthropogenic aerosols over natural ones.
- Article
(11082 KB) -
Supplement
(3538 KB) - BibTeX
- EndNote


Humans have greatly perturbed the biogeochemical cycle of Pb, with the most dramatic changes during the 1950s–1990s (Schwikowski et al., 2004). This resulted in large increases in Pb to not only local environments (Harris and Davidson, 2005), but also to remote areas such as Greenland (Bory et al., 2014) and Antarctica (Rosman et al., 1994). Because Pb is a potent neurotoxin (ATSDR, 2007), efforts to reduce anthropogenic Pb emissions were widespread throughout the 1980s–1990s. Since the phasing out of leaded gasoline by most northern European and American countries and the passing of other forms of clean air regulation, atmospheric Pb emissions have declined dramatically in the past 3 decades (EMEP WebDab, 2017). As a result, far less Pb has been mobilized into the atmosphere and less deposited in remote places such as the open ocean.
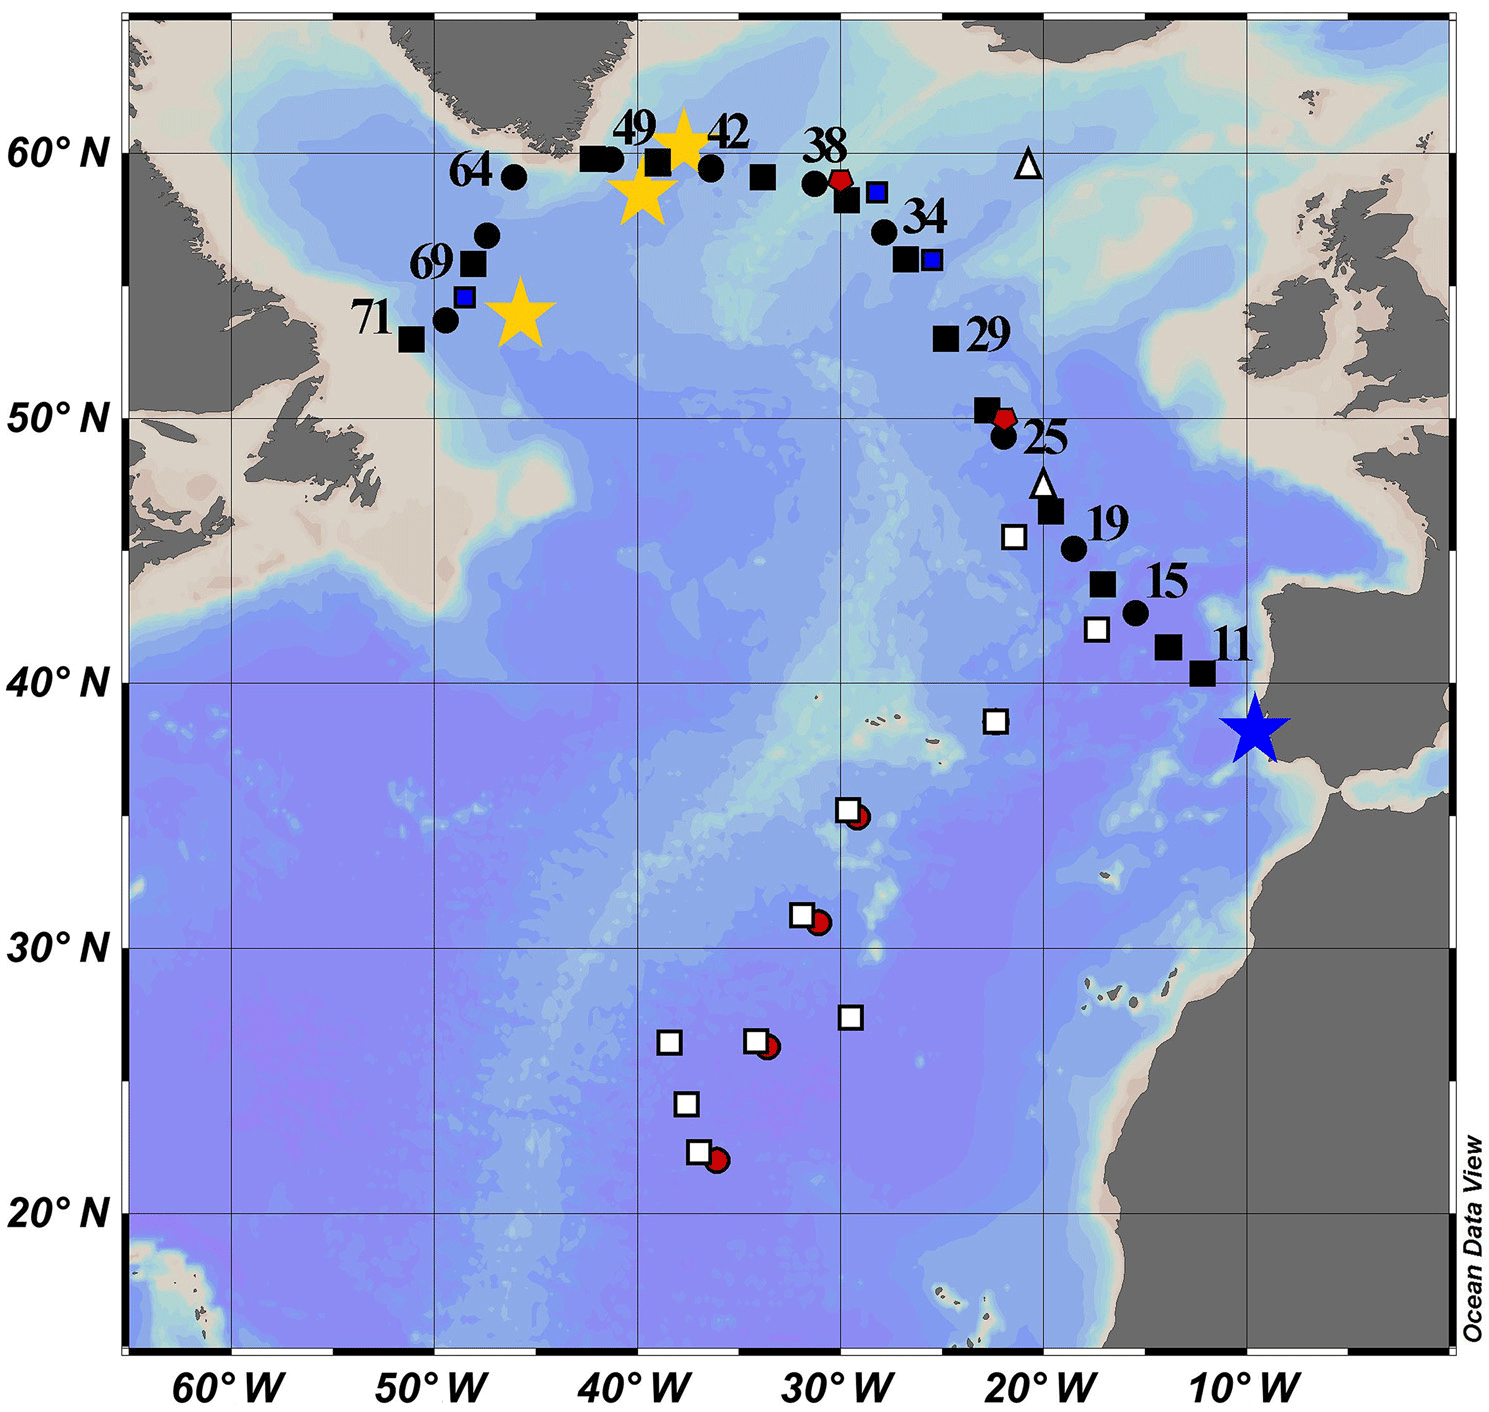
Figure 1Map of the cruise transect. GEOVIDE samples are solid black squares (concentration and isotope data) and circles (concentration data only). The blue star is GA 03 (2010); the red circles are Atlantis II 123 (1989); the white squares are EN328 (1999); the white triangles are JGOFS (1989); the red pentagons are TTO 1981; the blue squares are IOC-2 (1993); the yellow stars are GA 02 (2010).
Lead pollution in the North Atlantic Ocean has been studied more than the other ocean basins. The United States consumed the largest quantity of leaded gasoline of any nation from 1930 to 1980, and carried by the prevailing westerly winds (30–60∘ N), this produced the most visible oceanic contamination in the North Atlantic Ocean. Of relevance to this study (Fig. 1), surface Pb concentrations ([Pb]) were measured in 1981 (TTO, Weiss et al., 2003), 1989 (Atlantis II 123, this work; JGOFS, Martin et al., 1993), 1993 (IOC-2, Veron et al., 1999), and 1999 (Endeavor 328, Noble et al., 2015, and this work). More recent campaigns through the GEOTRACES program occurred in 2010 (GA02, Schlitzer et al., 2018) and 2010/2011 (GA03, Noble et al., 2015).
In the western North Atlantic, repeat sampling of time series locations has documented the reduction in oceanic [Pb] and changes in sources with time. At BATS (Bermuda Atlantic Time Series) in the 1970s and 1980s, concentrations were 80–160 pmol kg−1 near the surface, but 25 pmol kg−1 at depth (Boyle et al., 2014, and references therein). As Pb emissions were reduced and older high-Pb surface waters penetrated the interior, elevated [Pb] could be seen as a subsurface plume in waters at increasingly deeper depths over time. At the latest occupation of BATS in 2011, surface water concentrations were less than 20 pmol kg−1 (Noble et al., 2015) compared to 160 pmol kg−1 observed in 1979 (Schaule and Patterson, 1983) and ∼ 200 pmol kg−1 inferred from coral data from the mid-1970s (Kelly et al., 2009). Despite a dramatic reduction in [Pb], it is still believed that a large fraction of current Pb deposition results from coal and other combustion, and industrial processes, based on positive matrix factorization analysis of aerosols (Shelley et al., 2017, 2018; Noble et al., 2015). In the tropical Atlantic, another 2010–2011 study found that 50 %–70 % of Pb in the surface ocean was anthropogenic in origin (Bridgestock et al., 2016), with the remaining fraction from natural North African dust.
Our aim in this study was to evaluate whether the North Atlantic Ocean was still dominated by anthropogenic sources as in previous expeditions, and if so which ones. This was motivated by the changes in sources documented by Noble et al. (2014) in their study of Pb sources to the mid-North Atlantic, who found a shift from North American to European to industrial sources of Pb over the past couple of decades. The North Atlantic Ocean has been well studied for Pb contamination since the 1970s, enabling us to place this work in the greater context of historical Pb emissions. This study was strongly enhanced by the partnership of the environmental trace metal GEOTRACES program with the OVIDE program's long-term studies of physical oceanographic parameters in the northeastern Atlantic (García-Ibáñez et al., 2015).
2.1 Sample collection
The GEOVIDE cruise track began in Lisbon, Portugal, on 15 May 2014 and followed the OVIDE section from the Iberian upwelling system to the subpolar North Atlantic region up to the Greenland margin before continuing on to the Labrador Sea at the Canadian margin, finishing on 30 June 2014. One liter Nalgene HDPE sample storage bottles were acid cleaned and stored, and double-bagged as previously described (Noble et al., 2015). Trace metal clean seawater samples were collected using the French GEOTRACES clean rosette (General Oceanics Inc. Model 1018 Intelligent Rosette), equipped with new, pre-cleaned 12 L GO-FLO bottles (Cutter and Bruland, 2012). The rosette was deployed on a 6 mm Kevlar cable with a dedicated custom-designed clean winch. Immediately after recovery, GO-FLO bottles were individually covered at each end with plastic bags to minimize contamination. They were then transferred into a clean container (ventilated by class-100 source air) for sampling. For Stations 1, 11, 15, 17, 19, 21, 25, 26, 29, and 32, samples were filtered with 0.2 µm capsule filters (SARTOBRAN® 300, Sartorius). For all other stations (13, 34, 36, 38, 40, 42, 44, 49, 60, 64, 68, 69, 71, 77) seawater was filtered directly through paired filters (Pall Gelman Supor 0.45 µm polystersulfone, and Millipore mixed ester cellulose MF 5 µm) mounted in Swinnex polypropylene filter holders, following the Planquette and Sherrell (2012) method. All samples were acidified back in the MIT laboratory with 2 mL trace metal clean 6 M HCl per liter of seawater (final pH ∼ 2).
Previously unpublished Pb and Pb isotope data from cruises from 1989 (Atlantis II cruise 123) and 1999 (Endeavor cruise EN328) are included here for evaluation of the decadal evolution of Pb in the eastern North Atlantic. We supplement our 1989 data with two published JGOFS stations (Martin et al., 1993). Our 1989 samples were collected using “vane bulb” samplers (Boyle et al., 1986) and the 1999 samples were collected using the MITESS mooring sampler (Bell et al., 2002). Samples were stored in acid-cleaned 250 mL HDPE bottles.
2.2 Pb concentrations
GEOVIDE samples were analyzed for Pb concentrations at least 1 month after acidification during more than 36 analytical sessions using the isotope-dilution ICP-MS method described in Lee et al. (2011), which includes pre-concentration on nitrilotriacetate (NTA) resin and analysis on a quadrupole ICP-MS (Fisons PQ2+). Method details including all cleaning protocols are available in the metadata file, along with the data, in the BCO-DMO repository (see Sect. 2.4).
Briefly, triplicate subsamples (1.3 mL) were spiked with a known 204Pb spike and the pH was raised to 5.3 using a trace metal clean ammonium acetate buffer, prepared at a pH of between 7.95 and 7.98. Approximately 2400 beads of cleaned NTA Superflow resin (Qiagen Inc., Valencia, CA) were added to the mixture and equilibrated. After equilibration, the resin was rinsed with distilled water and then Pb was eluted with a 0.1 M solution of trace metal clean HNO3 before analysis by ICP-MS.
On each day of sample analysis, procedural blanks were determined for 12 replicates of in-house reference seawater with negligible [Pb]. The blanks analyzed concurrently with these samples ranged from 2.2 to 9.9 pmol kg−1, averaging 4.6±1.7 pmol kg−1. Within a day, procedure blanks were very reproducible, with an average standard deviation of 0.7 pmol kg−1, resulting in detection limits (3× the low-level standard deviation) of 2.1 pmol kg−1. Replicate analyses of three different large-volume seawater samples (one with ∼ 11 pmol kg−1, another with ∼ 24 pmol kg−1, and a third with ∼ 38 pmol kg−1) indicated that the precision of the analysis is 4 % or 1.6 pmol kg−1, whichever is larger. Triplicate analyses of an international reference standard, SAFe D2, were 27.2±1.7 pmol kg−1.
Pb concentration analysis for 1989 samples (Atlantis II 123) was achieved by 204Pb isotope dilution with Mg(OH)2 coprecipitation followed by VG PQ2+ quadrupole ICPMS (Wu and Boyle, 1997) (analyzed in 1996) and 1999 (Endeavor 328) Stations 4, 5, 7, 9, 10 and 11 (analyzed between 1999 and 2003). Endeavor 328 Stations 2, 3, 8, and 10 were determined using NTA-extraction ID ICPMS (Lee et al., 2011) (determined in 2010). Long-term quality control seawater samples were included in each run, and overlapped with new QC samples when the previous QC samples were depleted. Endeavor 328 Station 10 was determined twice by two analysts 8 years apart (in 2002 by Mg(OH)2 coprecipitation ID-ICPMS, and in 2010 by NTA-extraction ID ICPMS). A regression of the 2010 vs. 2002 data forced through the origin had a slope of 0.945. We suggest that this small offset provides a reasonable estimate of our inter-decadal analytical reproducibility. It also demonstrates that Pb is not continuously leached from well-cleaned HDPE bottles during decadal-scale storage.
2.3 Stable Pb isotopes
GEOVIDE samples were analyzed for stable Pb isotopes during 11 mass spectrometry sessions by the method of Reuer et al. (2003) as modified by Boyle et al. (2012). In brief, ∼ 500 mL of seawater was pre-concentrated using a low-blank double magnesium hydroxide co-precipitation, induced by minimal addition of high-purity ammonia solution and mixing (typically 8 µL ammonia per 1 mL seawater sample). The precipitate was dissolved in a minimal amount of high-purity 6 M HCl before undergoing another ammonia addition and second Mg(OH)2 coprecipitation. The final precipitate was dissolved in ∼1 mL of high purity 1.1 M HBr the day of purification by anion exchange chromatography (Eichrom AG1x8). Samples were dried and stored in PTFE vials until isotope ratio analysis on a GV ∕ Micromass IsoProbe multicollector ICPMS using an APEX ∕ SPIRO desolvator. Just before analysis, samples were dissolved for several minutes in 10 µL concentrated ultrapure HNO3 followed by addition of 400 µL of ultrapure water and spiked with an appropriate amount of Tl for mass fractionation correction. IsoProbe multicollector ICPMS Faraday cups were used to collect on 202Hg, 203Tl, 205Tl, 206Pb, 207Pb, and 208Pb. An Isotopx Daly detector with a WARP filter was used to collect on 204Pb + 204Hg. Because the deadtime of the Daly detector varied from day to day, we calibrated deadtime on each day by running a standard with known 206Pb ∕ 204Pb at a high 204 count rate. The counter efficiency drifts during the course of a day, so we established that drift by running a standard with known 206Pb ∕ 204Pb (and a 204 count rate comparable to the samples) every five samples. Tailing from one Faraday cup to the next was corrected by the 209Bi half-mass method as described by Thirlwall (2000).
On each analytical date, we calibrated the instrument by running NBS981 and normalized measured sample isotope ratios to our measured raw NBS981 isotope ratios to those established by Baker et al. (2004). Using this method for 22 determinations of an in-house Pb isotope standard solution shows that for samples near the upper range of the Pb signals shown for samples (∼ 1 V), 206Pb ∕ 207Pb and 208Pb ∕ 207Pb were reproduced to ∼ 200 ppm (2 SE). Low-level samples will be worse than that but generally better than 1000 ppm (2 SE) in this data set. Because of the drift uncertainty in the Daly detector, 206Pb ∕ 204Pb for samples in the mid-to-upper range of sample concentrations will be reproducible at best to ∼ 500 ppm (2 SE).
We have intercalibrated Pb isotope analyses with two labs as reported in Boyle et al. (2012). The outcome of that intercalibration suggests that the accuracy of our measurements approaches the internal analytical reproducibility we note above.
Pb isotope precision for the complete analytical procedure can be assessed by duplicate measurements of samples. In most cases, the replicated samples were chosen because they fell off of the trend of adjacent samples. That could be due either to contamination of the subsample used for the analysis or to the contamination of the sample in its primary sample bottle. As shown in Fig. S2 in the Supplement, the replicate analysis usually agreed within better than 1000 ppm for 206Pb ∕ 207Pb and 208Pb ∕ 207Pb, and 5000 ppm for 206Pb ∕ 204Pb. Given a fixed sample size and an order of magnitude range of Pb concentrations in samples, the poorest replicates are at the lower concentrations. Using the pooled 2 sigma standard deviation of duplicates (excluding a few outliers), the formal statistics are shown in Table 1.
Table 12σ pooled standard deviation of duplicate Pb isotope analyses.
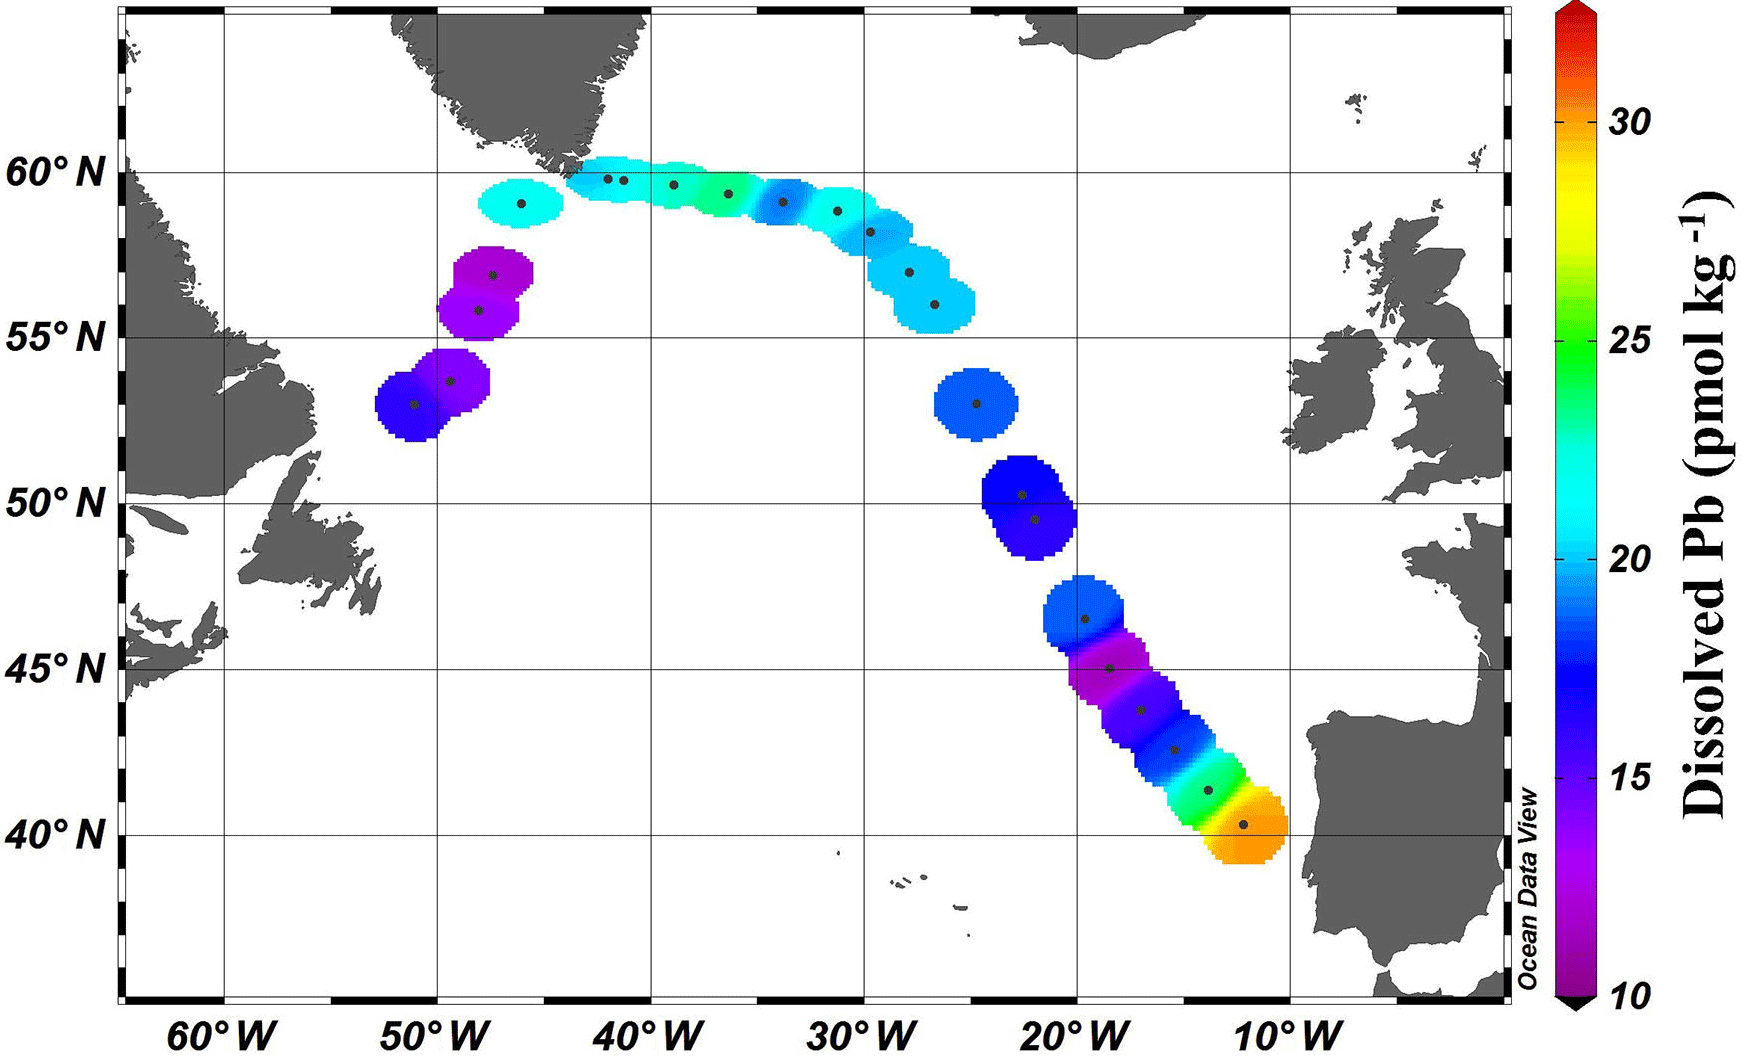
Figure 2Near-surface (11–20 m) concentrations of Pb. Plot created in Ocean Data View (Schlitzer, 2017).
Pb isotope data from the 1999 samples were obtained by IsoProbe Multicollector ICPMS after Mg(OH)2 preconcentration and anion exchange purification as described by Reuer et al. (2003). As for the GEOVIDE samples, the mass spectrometer was calibrated using NBS981.
2.4 Data management
All [Pb] and isotope data related to the GEOVIDE data set in this manuscript have been submitted to BCO-DMO and are available at http://www.bco-dmo.org/dataset/651880/data (last access: 3 August 2018) and http://www.bco-dmo.org/dataset/652127/data (last access: 3 August 2018) (Boyle et al., 2016) and from the 2017 BODC International GEOTRACES Intermediate Data Product v2 (Schlitzer, 2018). All other data are available in Table 2.
3.1 Outliers
In this data set, we did not encounter any samples that did not yield acceptably reproducible results upon repeated analysis, so we believe that the data truly represent the concentration and isotope ratio of Pb in the sample collection bottle. However, there were a few samples with elevated Pb (based on comparison to adjacent samples) and for which no obvious hydrographic argument could be made for the anomaly. We observed that the samples taken from the GOFlo in rosette position 1 (usually the near-bottom sample) were always higher in [Pb] than the samples taken immediately above that, and that the excess decreased as the cruise proceeded (Fig. S1). The Pb isotope ratios of these samples were higher than the comparison bottles as well. At two stations, where our near-bottom sample was taken from rosette position 2 rather than 1, there was no Pb excess over the samples immediately above. We believe that this evidence points to GoFLO bottle-induced contamination that was being slowly washed out during the cruise, but never completely. A similar pattern was observed for the samples taken from rosette positions 5, 20 and 21, when compared to the depth-interpolated [Pb] from the samples immediately above and below. We do not believe that these samples should be trusted as reflecting true ocean [Pb], so all of the samples from these GOFlos are excluded in our discussion of this work, although they are included and flagged as unreliable within the data repositories.

In addition, we observed high [Pb] in most of the samples from Station 1 and very scattered Pb isotope ratios. The majority of these concentrations were far in excess of those values observed at nearby Station 11, and also the nearby USGT10-01 (Noble et al., 2015). Discussion among other cruise participants revealed similarly anomalous data for other trace metals (e.g., Hg species; Lars-Eric Heimburger, personal communication, 2016). After discussion at the 2016 GEOVIDE post-cruise workshop, we came to the conclusion that this is evidence of GoFlo bottles not having sufficient time to “clean up” prior to use, and that most or all bottles from Station 1 were contaminated. Station 1 data are not discussed in this work, but as with the suspicious GOFlos throughout the cruise, the Station 1 data are included and flagged as unreliable in the data repositories.
We include mention of these outlier data to demonstrate the high quality of our other data, and to encourage future expeditions to both clean their GOFlo bottles before the cruise (as was done here) and also test them for contamination-prone elements prior to embarking on their research expeditions or onboard (e.g., Fe as in Measures et al., 1995). As demonstrated after Station 1, although soaking in seawater is often sufficient to “clean” the bottles, gaskets or other bottle components could remain as persistent contamination sources, as seen on 4 of the 24 bottles from this expedition.
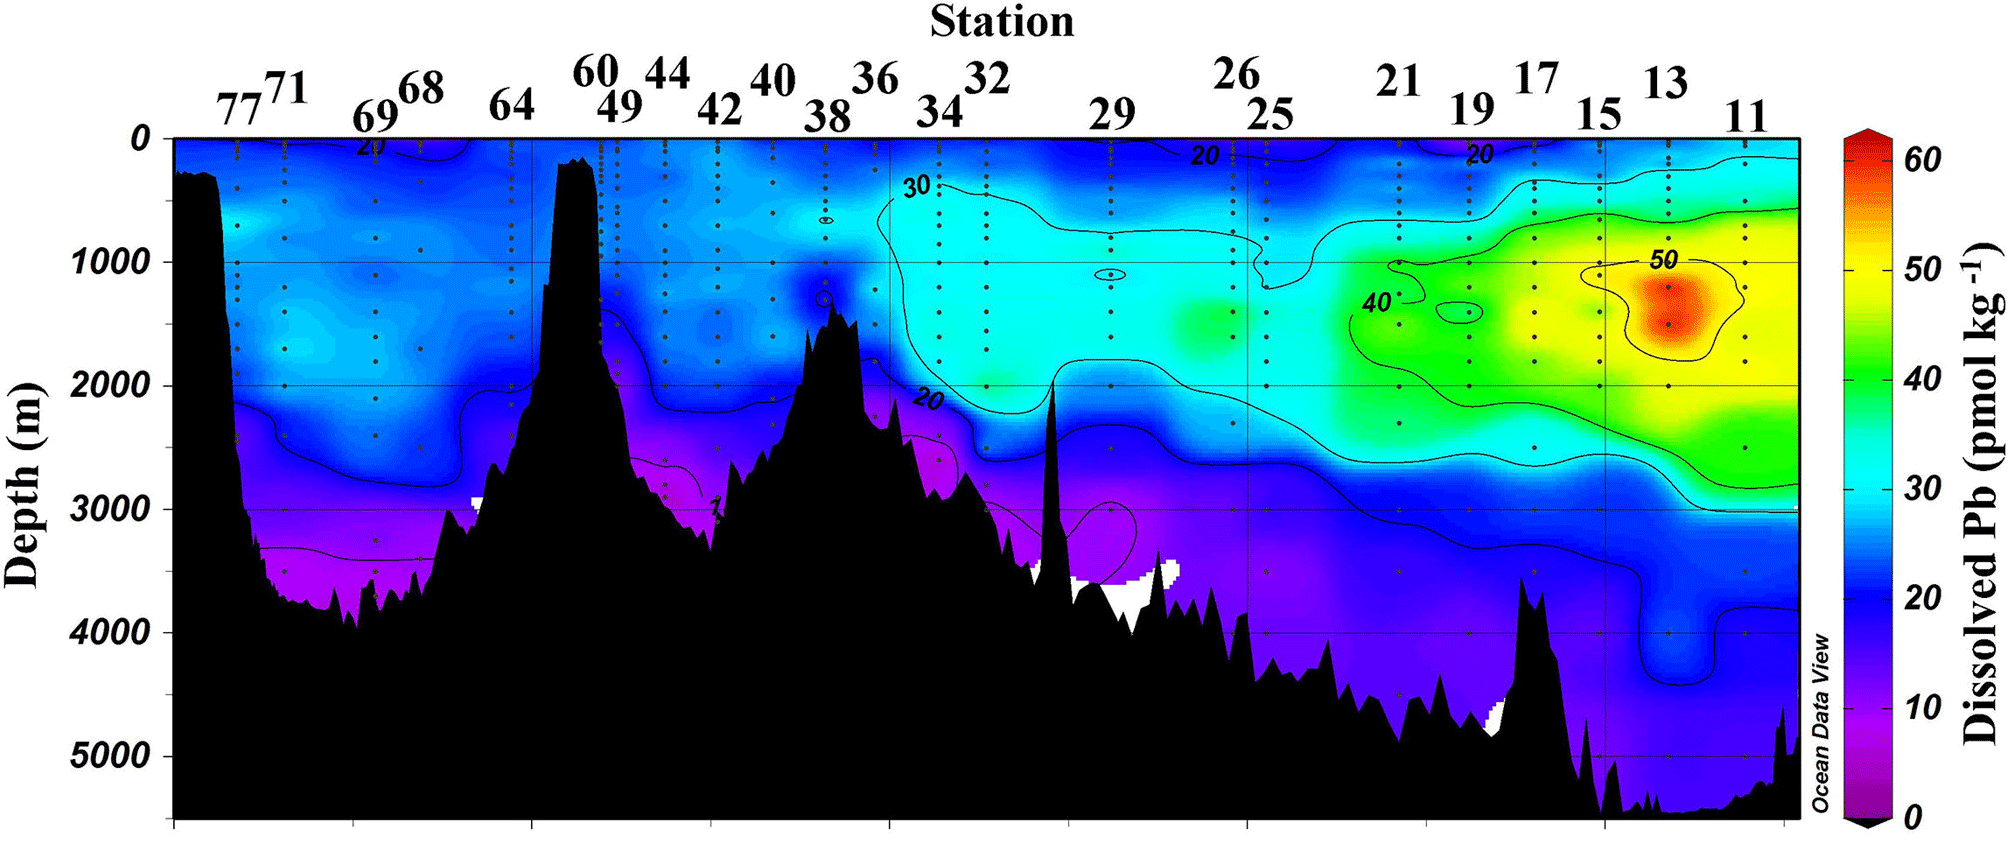
Figure 3Section plot of Pb concentrations in the GEOVIDE section. Plot created in Ocean Data View (Schlitzer, 2017).
3.2 Near-surface ocean
Near-surface waters (11–20 m) displayed a moderate range in [Pb] of 11–30 pmol kg−1 across the transect (Fig. 2). The highest concentration was located near the Portuguese coast (30 pmol kg−1). Lead concentrations decreased 3-fold with distance from the coast, down to 11.5 pmol kg−1, in the core of the far arm of the North Atlantic Current. An excellent pictorial representation of the relevant water masses discussed here can be found in García-Ibáñez et al. (2018). Near-surface concentrations were higher in the Iceland Basin and Irminger Sea (Stations 21–60; 18.8–23.5 pmol kg−1), and in Station 64, just past the tip of Greenland. The remainder of the Labrador Sea (Stations 68–77) had lower [Pb] (12.1–16.2 pmol kg−1).

Figure 4Section plot of 206Pb ∕ 207Pb concentrations in the GEOVIDE section. Plot created in Ocean Data View (Schlitzer, 2017).
The pattern of decreasing [Pb] over the Iberian Abyssal Plain (Stations 11–19) correlates strongly with increasing distance from the shore (Pearson's correlation, , p < 0.001). This finding agrees well with atmospheric deposition models that show higher dust inputs closer to the African continent (Schepanski et al., 2009). Stations located north of 55∘ in the meandering NAC have higher concentrations than those in the West European Basin. Although dust deposition to the North Atlantic Ocean is typically associated with northern African dust from the Sahara, Prospero et al. (2012) and Bullard et al. (2016) found that high-latitude dust emissions, specifically volcanic-based soils from Iceland, could be substantial enough to impact oceanic Fe cycling; therefore we suggest that the elevated Pb in the near-surface waters of the Iceland Basin and Irminger Sea may possibly be dust-derived. In the GEOVIDE shipboard aerosol data (Shelley et al., 2017, 2018), Pb concentrations were high in the Iceland Basin but low in the Irminger Sea. However, as Pb has a residence time of ∼ 1 year in this region, seasonal changes in the flux also could account for this difference. As the North Atlantic Current becomes the Irminger Current near Greenland and joins with the East Greenland Current, they wrap around the southern tip of Greenland and flow toward the Arctic Circle. This entrains Pb into the northeastern part of the Labrador Sea, whereas the remainder of the Labrador Sea is influenced by the Labrador Current, returning from the Arctic, which has low [Pb].
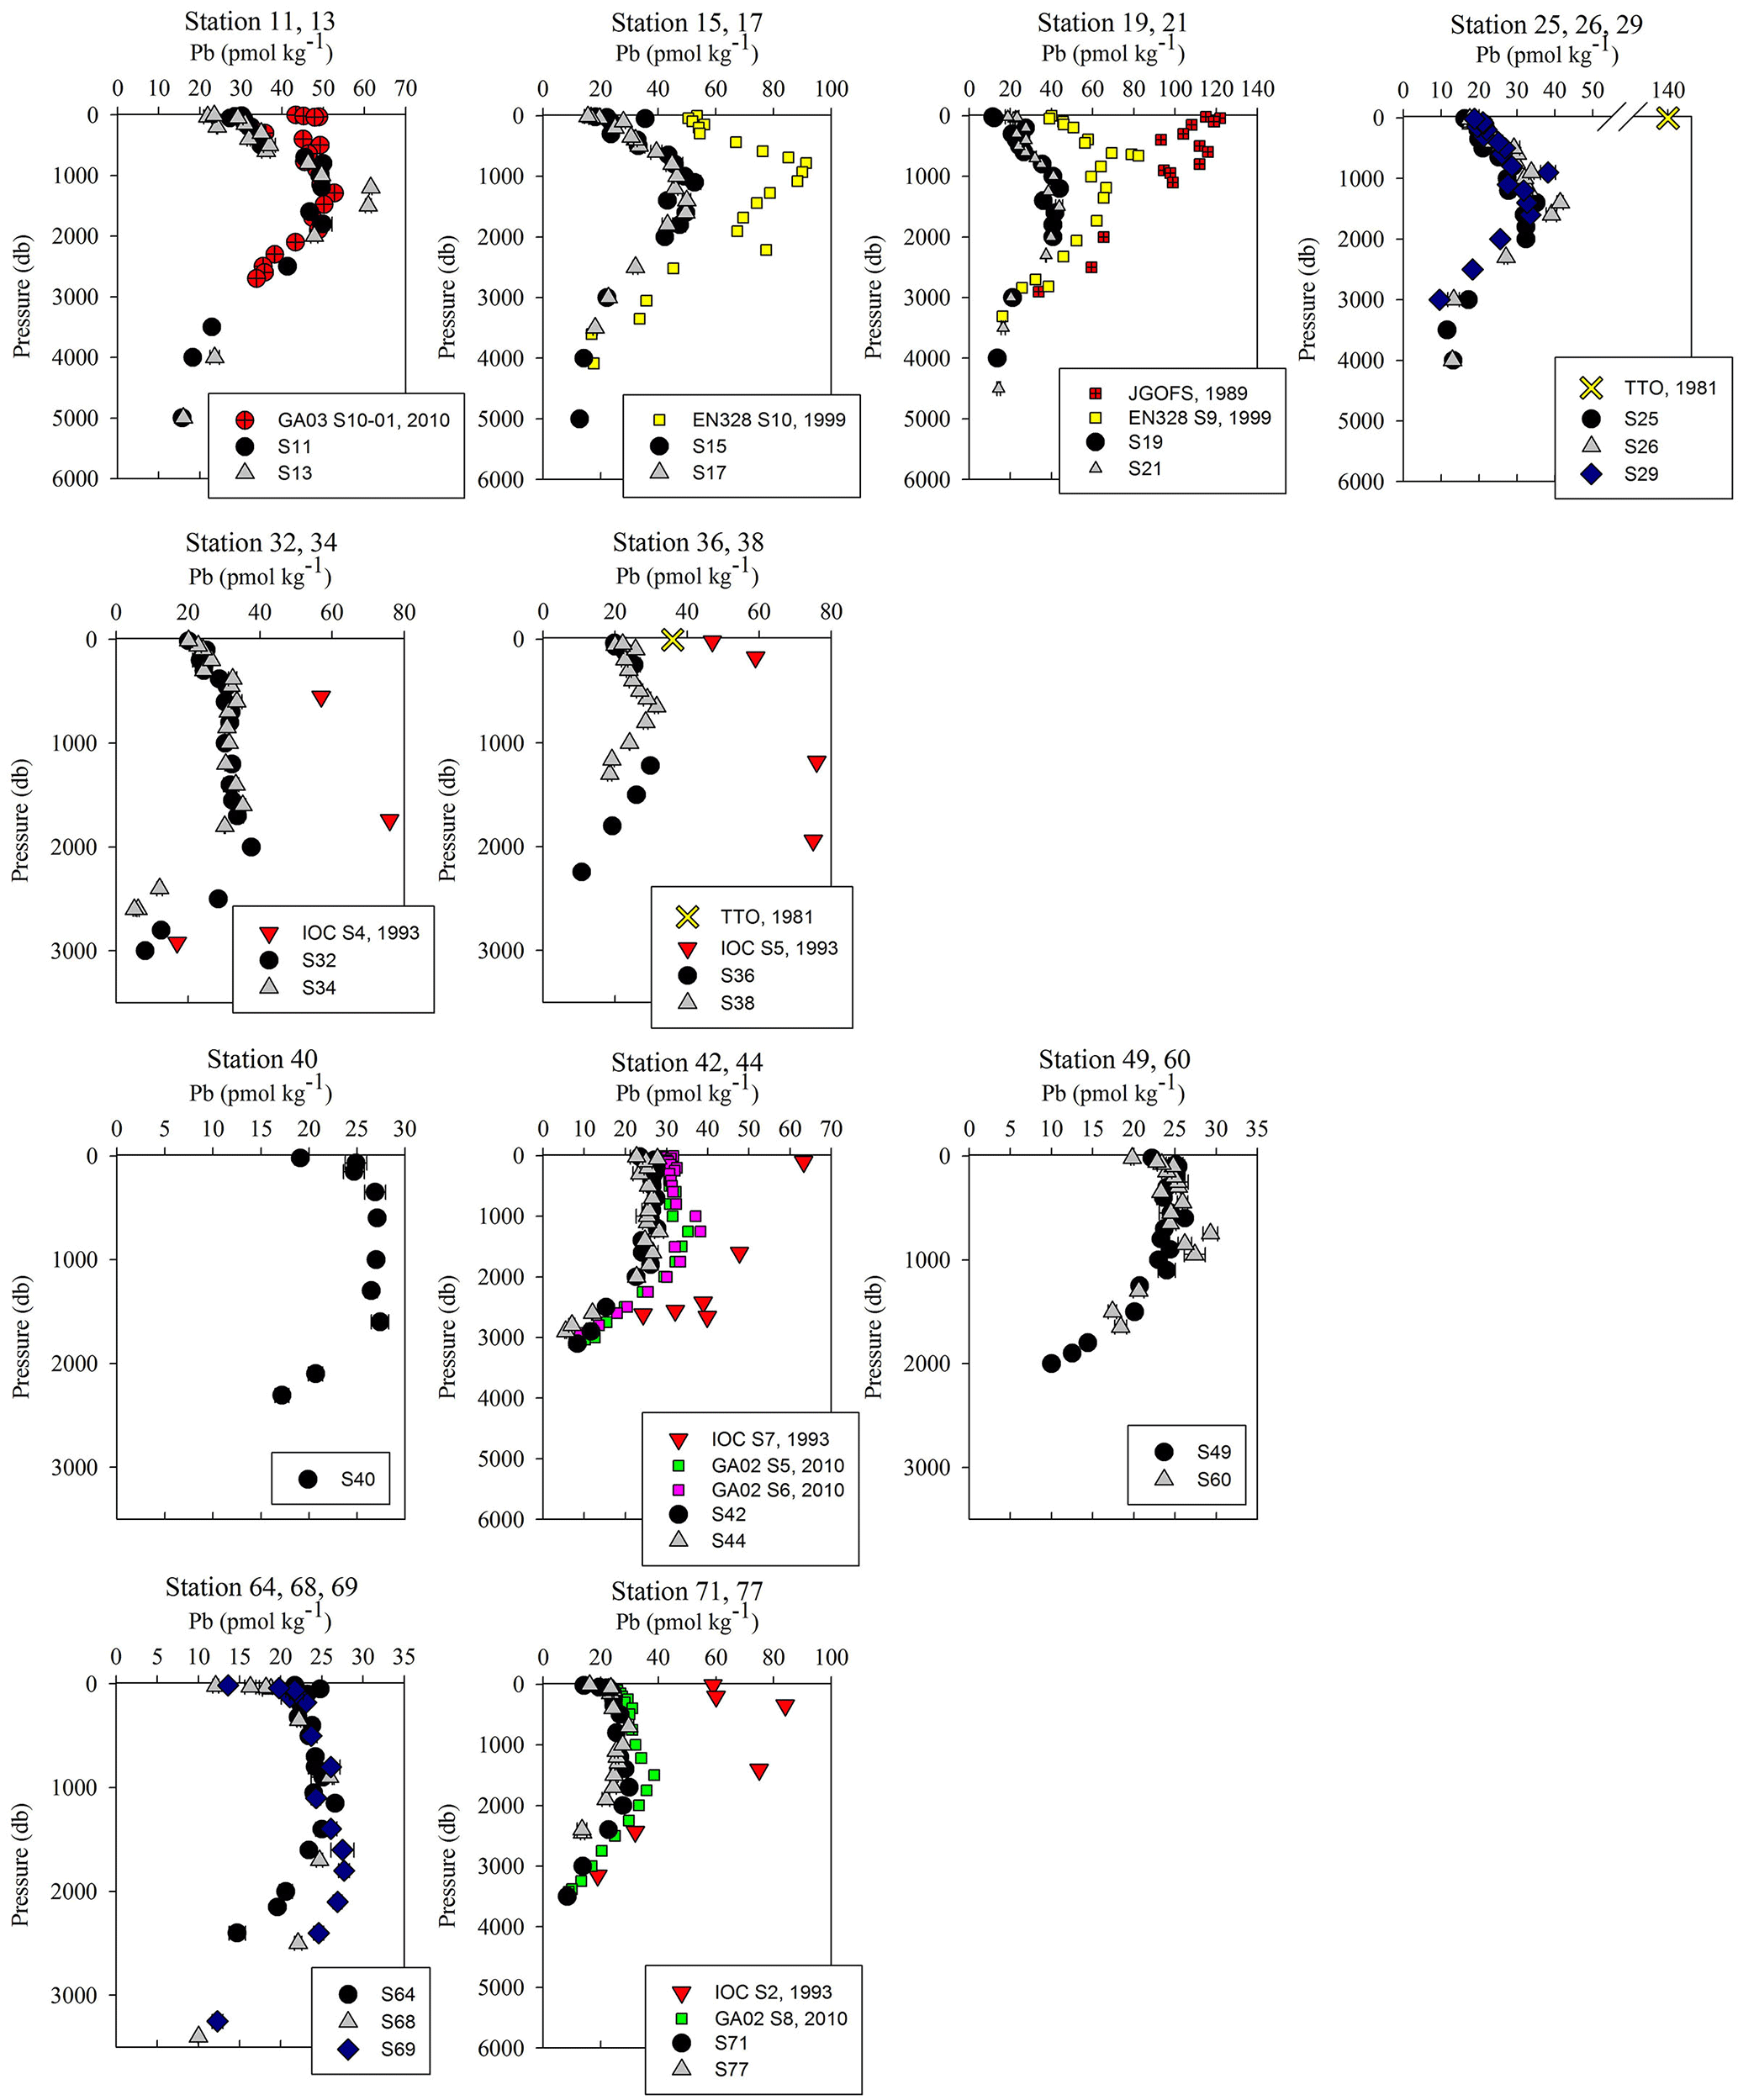
Figure 5Pb concentration depth profiles. References: GA03 (Noble et al., 2015); EN328 (this work); JGOFS (Martin et al., 1993); TTO (Weiss et al., 2003); IOC-2 (Veron et al., 1999); GA02 (The GEOTRACES Group, 2015).
Despite the variations in [Pb] across the Atlantic Ocean, Pb isotope ratios were relatively homogenous throughout the section, and largely decoupled from the [Pb] patterns (Figs. 3 and 4). 206Pb ∕ 207Pb isotope ratios varied from 1.178 to 1.186, with the majority of samples analyzed being 1.180–1.183. 208Pb ∕ 206Pb and 206Pb ∕ 204Pb isotope ratios showed similar minimal variability. No trend in isotope ratios was observed in the Iberian Abyssal Plain extending away from the coast. The low variability of isotope ratios indicates that the majority of Pb in the North Atlantic Ocean is well mixed in the atmosphere prior to deposition. The relatively low [Pb] and similar isotope ratios contrast sharply with surface water measurements from the previous century (Figs. 5 and 6). During the 1970s to early 1990s, the predominant source of Pb to the North Atlantic was US leaded gasoline (Weiss et al., 2003; Martin et al., 1993; Veron et al., 1999), which was reflected in the high 206Pb ∕ 207Pb isotope ratios (∼ 1.20).
The mixed layer [Pb] nearest the Iberian Peninsula (30 pmol kg−1) is lower than that measured by the 2010 US GEOTRACES expedition (42 pmol kg−1), which we attribute to the much closer proximity of the US GEOTRACES station to the coastline (50 km) than GEOVIDE Station 11 (280 km). As mentioned previously, [Pb] at GEOVIDE Stations 11–19 has a strong inverse correlation with distance from the shore, and adding USGT10-01 (GA-03) maintains this high correlation (Pearson correlation, , p < 0.001). Isotopically, the USGT10-01 near-surface waters are similar to GEOVIDE Station 11, indicating similar Pb sources in recent years.
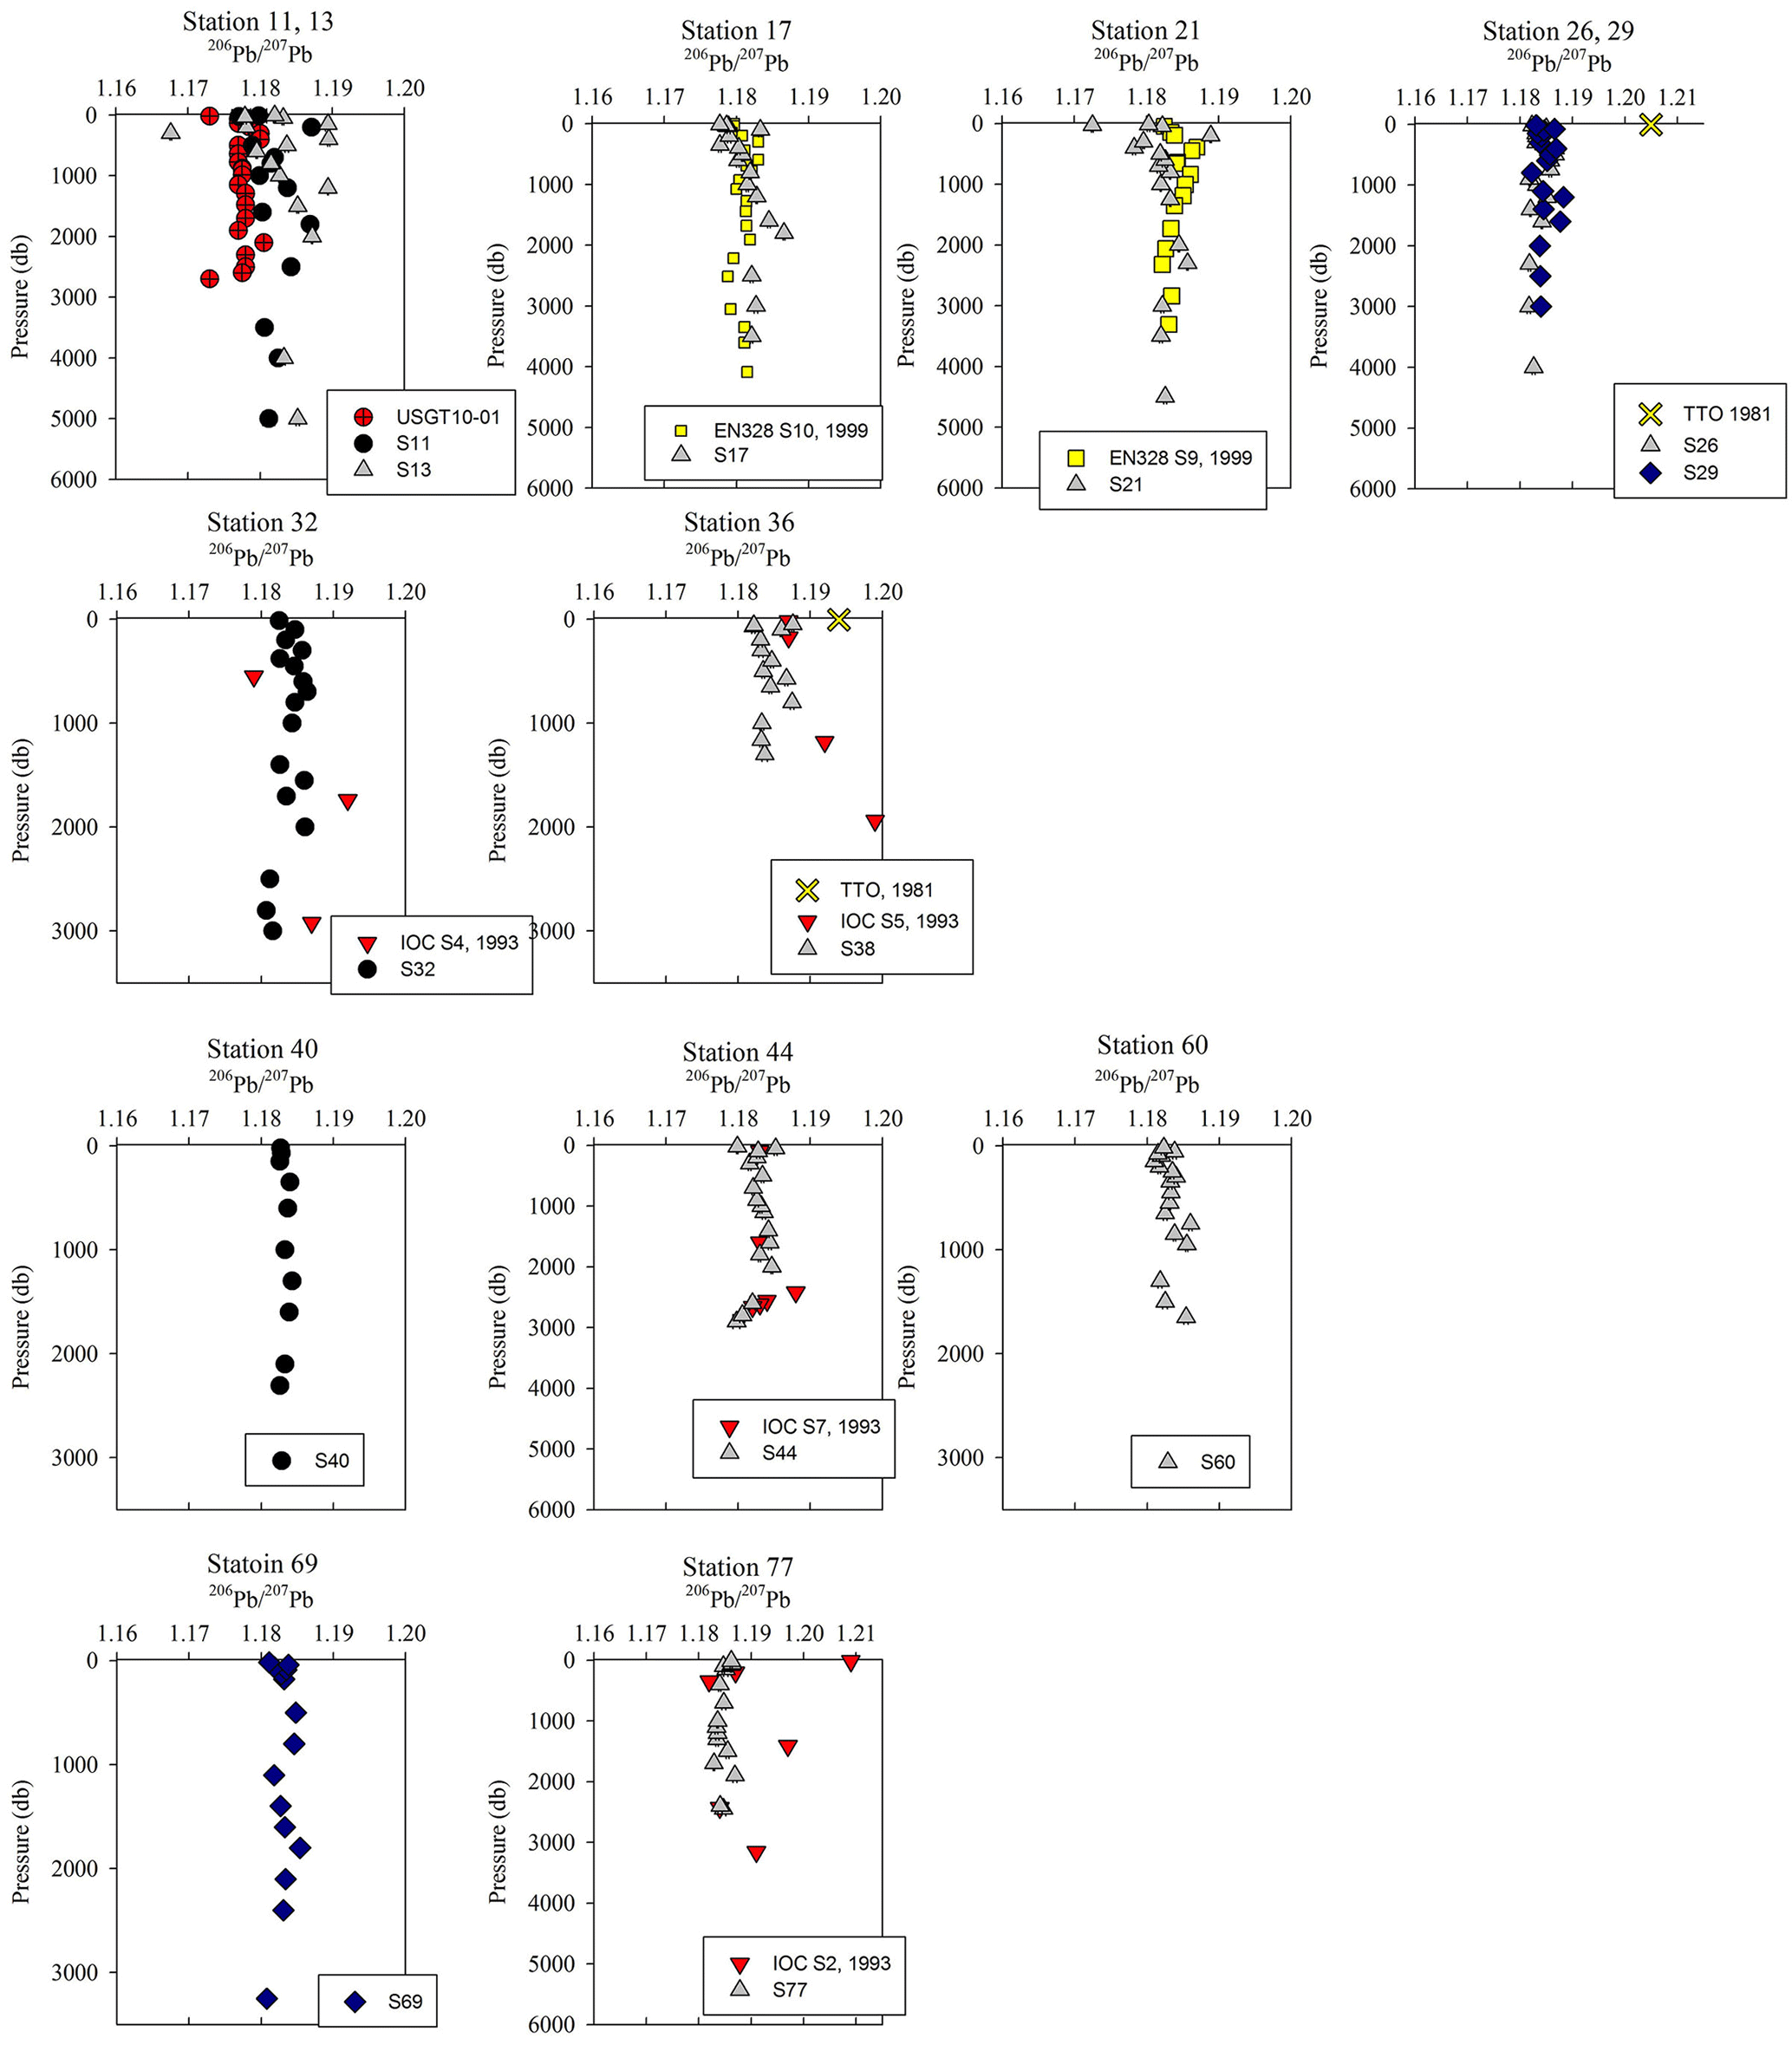
Figure 6206Pb ∕ 207Pb isotope ratio depth profiles. References: GA03 (Noble et al., 2015); EN328 (this work); TTO (Weiss et al., 2003); IOC-2 (Veron et al., 1999).
3.3 Iberian Abyssal Plain (S11–S19) and West European Basin (S21–S29)
Overall, [Pb] measured from this cruise was highest in the subsurface waters of the Iberian Abyssal Plain (Station 13). The core of the elevated concentrations (∼ 61 pmol kg−1, Station 13) was ∼ 1200 m deep and several hundred kilometers from the coast. This subsurface plume of Pb (concentrations of 40–50 pmol kg−1) was dispersed throughout the Iberian Abyssal Plain at depths of 700–2000 m. The Pb plume was less pronounced in the rest of the West European Basin, with concentrations of 30–40 pmol kg−1. Extended Optimum MultiParameter (eOMP) water mass analysis shows that this elevated [Pb] coincides with Mediterranean Water (MW) from 700 to 1500 m and Labrador Sea Water (LSW) from 1500 to 2000 m (García-Ibáñez et al., 2018). Our finding is in good agreement with [Pb] in MW measured in 2010–2011 by Noble et al. (2015) and highlights the high [Pb] previously found in the Mediterranean Sea (Moos and Boyle, 2018). In the lower portion of the plume, the LSW in the Iberian Abyssal Plain and West European Basin is among the oldest water sampled during this expedition. According to CFC-11 data, LSW in this region has a combined age (subduction plus admixed relic age) of ∼ 25 years (Fine, 2011). That age and the elevated [Pb] observed are consistent with the atmospheric Pb emissions by North America and Europe in the 1980s. The isotope ratios further support this finding, as the ocean interior has similar isotope ratios throughout (206Pb ∕ 207Pb = 1.1832±0.0025, 1σ; 208Pb ∕ 206Pb = 2.4525±0.0024, 1σ), but these are distinguishably more like US aerosols from the early 1990s (Bollhöfer and Rosman, 2001) at the core of the Pb maximum (Station 13, 206Pb ∕ 207Pb = 1.1894; 208Pb ∕ 206Pb = 2.4544; Fig. 5).
The offshore profiles (Stations 13–29) showed consistent decreases in [Pb] in the MW and LSW from 1989 (JGOFS S19) and 1999 (Endeavor 328 S15, 17, 21) to 2014 (Martin et al., 1993; this work). In the 10–15 years between sampling events the Pb maxima advected into the ocean interior as the more shallow waters were ventilated with lower-Pb surface waters, a trend also seen in the western North Atlantic near Bermuda (Boyle et al., 2012).
Below the broad subsurface plume, water mass analysis indicates depths greater than 2500 m are predominantly Northeast Atlantic Deep Water (NEADW) that contains a major component of Antarctic Bottom Water (AABW), as evidenced by high silica concentrations (García-Ibáñez et al., 2018). In the NEADW, [Pb] were 10–20 pmol kg−1 and similar to previous sampling campaigns nearby in 1989 and 1999 (Fig. 5). Isotope ratios (206Pb ∕ 207Pb = 1.1827±0.0013; 208Pb ∕ 206Pb = 2.4511±0.0013) were also similar across the 25 years in the West European Basin (Fig. 6). This makes sense because the estimated age of NEADW is several hundreds of years (Matsumoto, 2007).
Below 1000 m, the [Pb] at Stations 11 and 13 was very similar to the 2010 [Pb] measured on GA03 (USGT10-01; Fig. 5), but the isotope ratios are dissimilar (Fig. 6). Conversely, the upper 1000 m of the water column had different [Pb] but similar isotope ratios. In the upper ocean, this discrepancy can be related to the distance of the stations from the shore, as calculated in Sect. 3.2, with greater Pb inputs and therefore greater concentrations at stations closer to the shore. In the deep ocean, the contrast in isotope ratios between the more coastal GA03 station and offshore GEOVIDE station, only 4 years apart, supports the eOMP findings that slightly different mixes of water masses were sampled in the two cruises. Despite the close proximity of the two stations (∼ 250 km), the GEOVIDE cruise sampled waters > 1000 m that had relatively more LSW and less MW (or MOW per Jenkins) compared to the 2010 GA03 station (Jenkins et al., 2015; García-Ibáñez et al., 2017).
3.4 Iceland Basin (S32–S36) and Reykjanes Ridge (S38)
In the Iceland Basin and above the Reykjanes Ridge, [Pb] throughout the water column is similar to that found in the West European Basin, with a subsurface [Pb] maximum (∼ 30 pmol kg−1) in the core of LSW. In the deepest samples (2500–3000 m), [Pb] (5–10 pmol kg−1) is lower than the NEADW observed in the Iberian Abyssal Plain and West European Basin, and the 206Pb ∕ 207Pb isotope ratios are slightly lower (206Pb ∕ 207Pb = 1.1812±0.0005) than the overlying water at 800–2000 m (206Pb ∕ 207Pb = 1.1845 ± 0.0014). Water mass analysis indicates very little NEADW was present in the Iceland Basin, and the deeper samples were strongly influenced by Iceland–Scotland Overflow Water (ISOW), particularly at Stations 32–36 (García-Ibáñez et al., 2017). The 1993 IOC-2 survey by Veron et al. (1999) found that ISOW (206Pb ∕ 207Pb = 1.173–1.176) was isotopically distinct from LSW (206Pb ∕ 207Pb = 1.190–1.20) and that ISOW reflected atmospheric emissions from Europe at that time. The differences in Pb isotopes (and 2- to 3-fold reduction in concentrations) between sampling campaigns highlight the young age of ISOW, which reflected large source changes over a 21-year time period (Figs. 5 and 6).
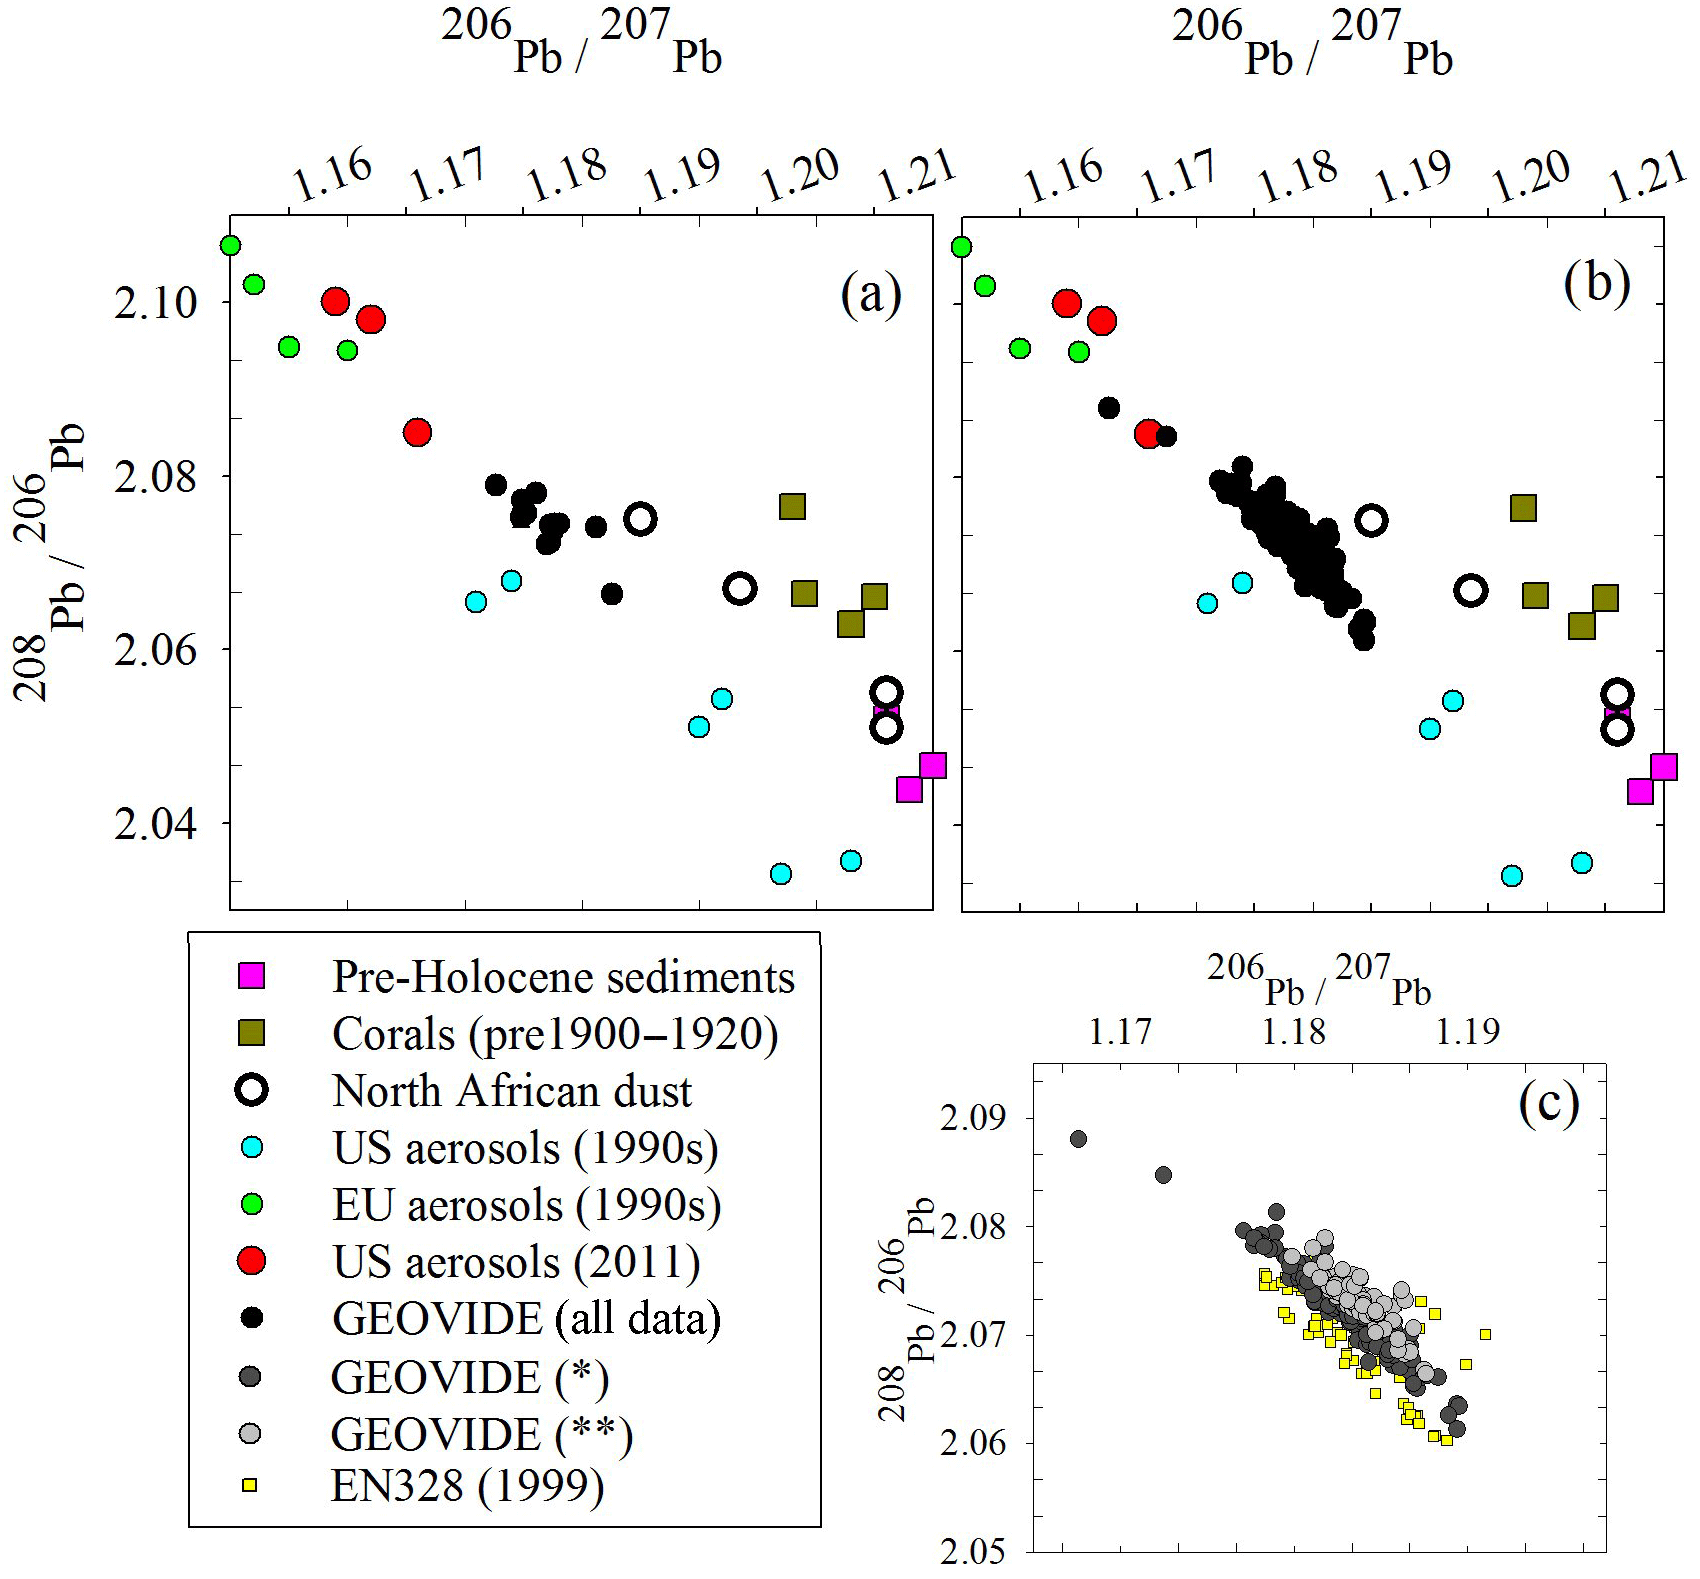
Figure 7Triple isotope plot of (a) the surface GEOVIDE samples compared to possible sources, (b) all GEOVIDE data and (c) spatiotemporal trends from 1999 (EN328) and 2014* (dark grey circles, GEOVIDE samples at all depths from Stations 11 to 26 and depths > 800 m from Stations 29 to 77) and 2014 (light grey circles, GEOVIDE samples at depths < 800 m from Stations 29 to 77). References: pre-Holocene sediments (Hamelin et al., 1990); corals (Kelly et al., 2009); North African dust (Bridgestock et al., 2016); US and EU aerosols, 1990s (Bollhöfer and Rosman, 2001); US aerosols, 2011 (Noble et al., 2015); 1981 seawater (Weiss et al., 2003); EN328 and GEOVIDE seawater (this work).
In addition, we note that the present-day Norwegian Sea waters must have low [Pb], and that their Pb isotope ratios reflect a greater contribution from European sources than North American sources. ISOW is formed as a mixture of LSW and Norwegian Sea water that overflows the Iceland–Scotland sills. Because LSW has higher [Pb] and higher 206Pb ∕ 207Pb isotope ratios than ISOW, we hypothesize that Norwegian Sea water must have a lower 206Pb ∕ 207Pb isotope ratio and much lower [Pb] because Pb is scavenged only on a decadal–century scale in deep water and retains it source signatures during decadal penetration into the deep ocean. By this, we mean that in the open ocean with relatively low particulate concentrations and minimal sediment interactions we expect Pb to behave in a quasi-conservative manner over short mixing timescales. Although other work has demonstrated that isotopic exchange with particles can influence the dissolved Pb isotope composition (Wu et al., 2010; Chen et al., 2016), this occurs over much longer timescales than the mixing of Norwegian Sea water and LSW to form ISOW. Using our Pb data for Station 32 and the eOMP analysis that the deepest samples are 100 % ISOW and ∼ 20 % LSW (García-Ibáñez et al., 2017), we back-calculate a Norwegian Sea water that is ∼ 7 pmol kg−1 and 206Pb ∕ 207Pb ∼ 1.180. The relatively lower 206Pb ∕ 207Pb isotope ratios of the Norwegian Sea are consistent with what Veron et al. (1999) observed in 1993 (1.169), and are indicative of atmospheric Pb from a more European provenance than a North American one (Fig. 7).
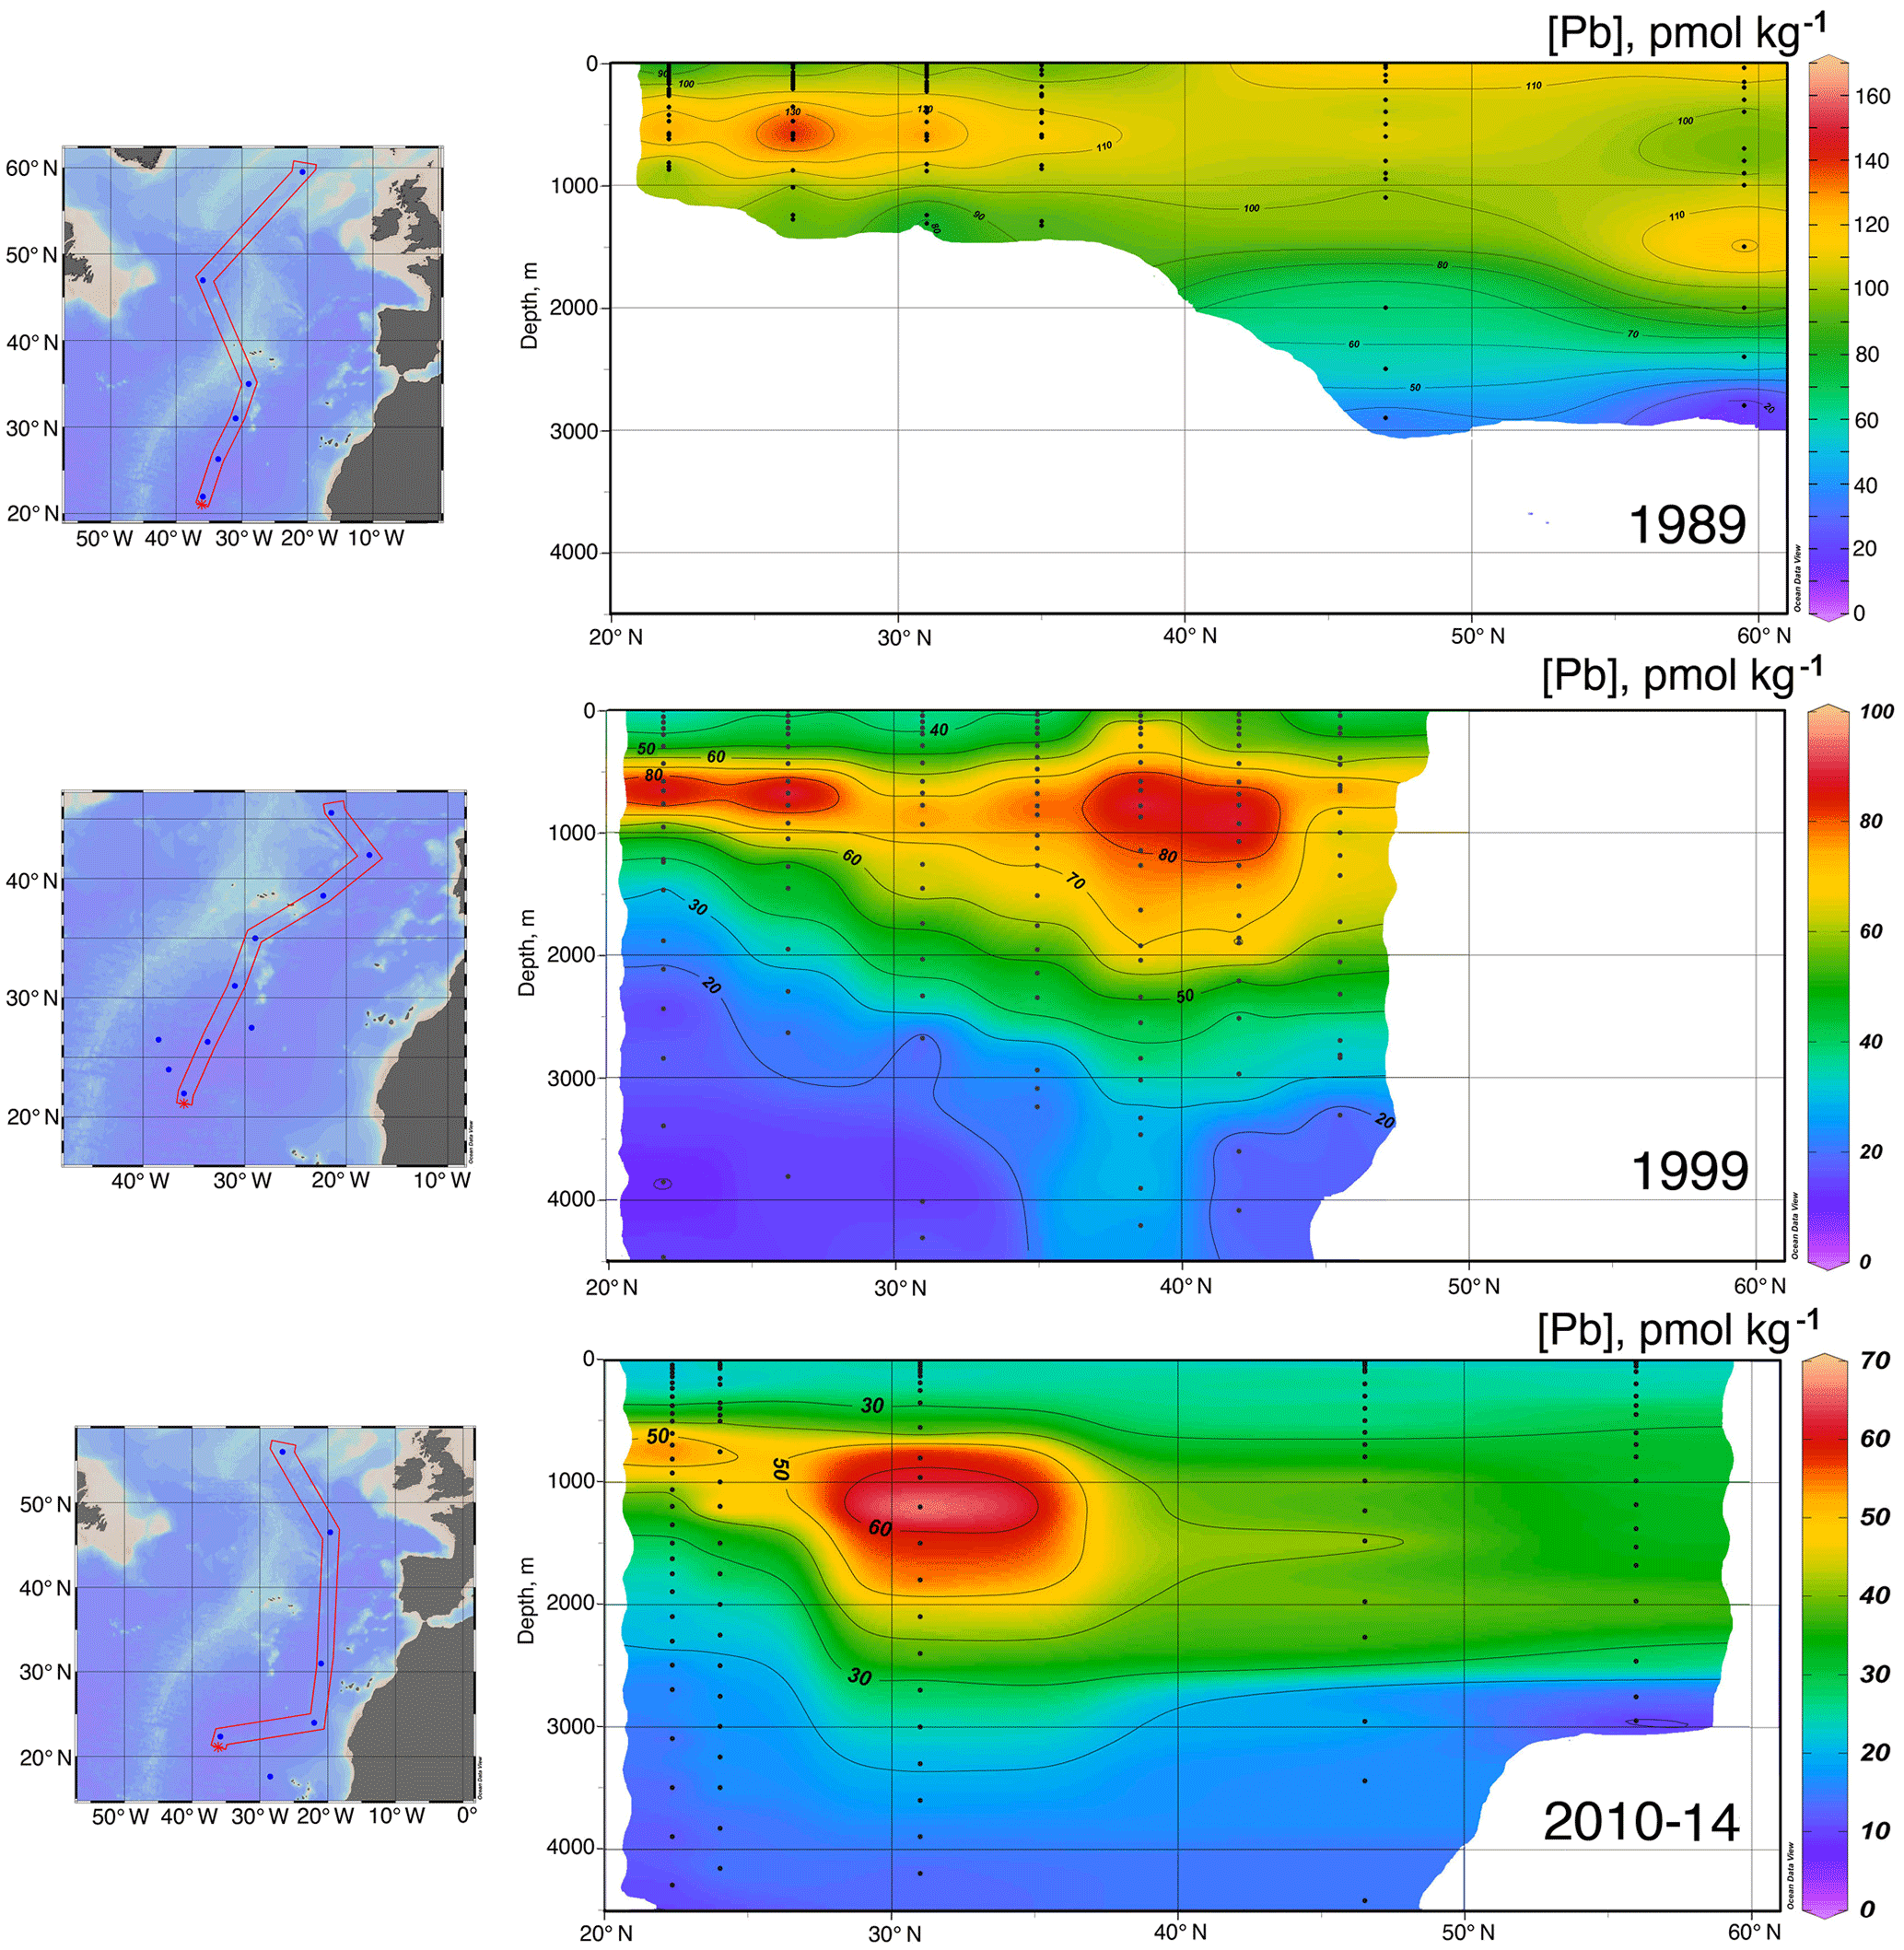
Figure 8North–south [Pb] sections in the eastern Atlantic Ocean, 1989–2014. Plot created in Ocean Data View (Schlitzer, 2017).
3.5 Irminger Sea (S40–S60)
In the Irminger Sea, a broad Pb maximum with little concentration variability was observed between the near surface and 1800 m (Fig. 3). The diffuse elevation in [Pb] throughout the upper 1800 m is attributed to both Irminger Subpolar Mode Water (0–1000 m) and LSW (500–2500 m) (García-Ibáñez et al., 2017). As in the Iceland Basin, ISOW is observed in the Irminger Sea deep water, but in a lower proportion (40 %–60 %) than in the Iceland Basin (80 %–100 %). At Stations 42 and 44 ISOW is distinguished by its low [Pb] (5–8 pmol kg−1) and a low 206Pb ∕ 207Pb ratio (1.1798). Further north in the Irminger Sea along the Greenland continental slope, the near-bottom samples at Stations 49 and 60 are Denmark Straight Overflow Water (DSOW). The DSOW has a slightly higher [Pb] (10–18 pmol kg−1) and a higher 206Pb ∕ 207Pb ratio (1.1854) than ISOW, consistent with the 1993 data of Veron et al. (1999; 206Pb ∕ 207Pb = 1.179–1.182). DSOW is a mix of the Nordic Sea waters overflowing the Greenland–Iceland sill and mixing with LSW; DSOW is also reported to have inputs from dense Greenland shelf water and cascading Polar Intermediate Water (García-Ibáñez et al., 2015; this study). The resulting DSOW isotope composition is very similar to LSW, which could indicate shelf water has very little Pb, and so its signal is dominated by the LSW signal, although we cannot rule out the possibility that the shelf water entrained Pb with a similar isotope composition to LSW.
The Irminger Sea was previously sampled for Pb during the 1993 IOC-2 expedition (Veron et al., 1999) and the 2010 GA02 expedition near GEOVIDE Stations 42 and 44 (analyses by Middag and Bruland as reported by The GEOTRACES Group, 2015) (Fig. 5). There is a large decrease in [Pb] at all depths from 1993 to 2010, and a surprisingly large decrease between 2010 and 2014. We suspect that the difference between 2010 and 2014 could also be a result of the 2012 deep winter convection event (∼ 1200 m) as reported by Fröb et al. (2016). The 206Pb ∕ 207Pb values between 1993 and 2014 do not appear to have changed significantly (perhaps in view of limited 1993 water column coverage) (Fig. 6).
3.6 Labrador Sea (S64–S77)
In the Labrador Sea, the [Pb] maximum coincides with LSW (0–2500 m) and is very broad (Fig. 3). Similar concentrations (∼ 25 pmol kg−1) are found from 100 m to nearly 2000 m. At depths greater than 2000 m, the [Pb] decreases to ∼ 8 pmol kg−1 and water mass analysis indicates this is primarily ISOW. Throughout the entire Labrador Sea water column Pb isotope ratios are homogenous, in contrast to the Icelandic and Irminger basins, which are isotopically distinctive from overlying LSW. The similarity of the Pb throughout the Labrador Sea can be attributed to deep winter convection that annually varies from 1000 to 2000 m deep (Lazier et al., 2002; Lilly et al., 1999; Vage et al., 2009). Hydrographic observations and Argo floats indicate winter 2014 convection was ∼ 1700 m deep (Kieke and Yashayaev, 2015). Fine (2011) assigns a combined age of 17–19 years to these waters. The similar Pb profiles throughout the entire water column indicate there were minimal changes in magnitude of Pb sources to the LSW over the 2 decades preceding sampling, and the isotopically indistinguishable ISOW suggests it is also relatively well mixed with LSW in this basin (Figs. 4 and 6).
The Labrador Sea also confirms the continued changes to oceanic Pb since the phase-out of leaded gasoline usage by North America and Europe. Lead concentrations in the upper 2000 m of the water column were 3 to 4 times lower in 2014 and in 2010 than those measured in 1993 (2010 analyses by Middag and Bruland as reported by the GEOTRACES Group, 2015; Veron et al., 1999) (Fig. 5). Surface water Pb isotope ratios in 2014 were also much lower (206Pb ∕ 207Pb = 1.186) than during the early 1990s (206Pb ∕ 207Pb = 1.209) (Fig. 6), in agreement with the rest of the North Atlantic Ocean surface Pb changes.
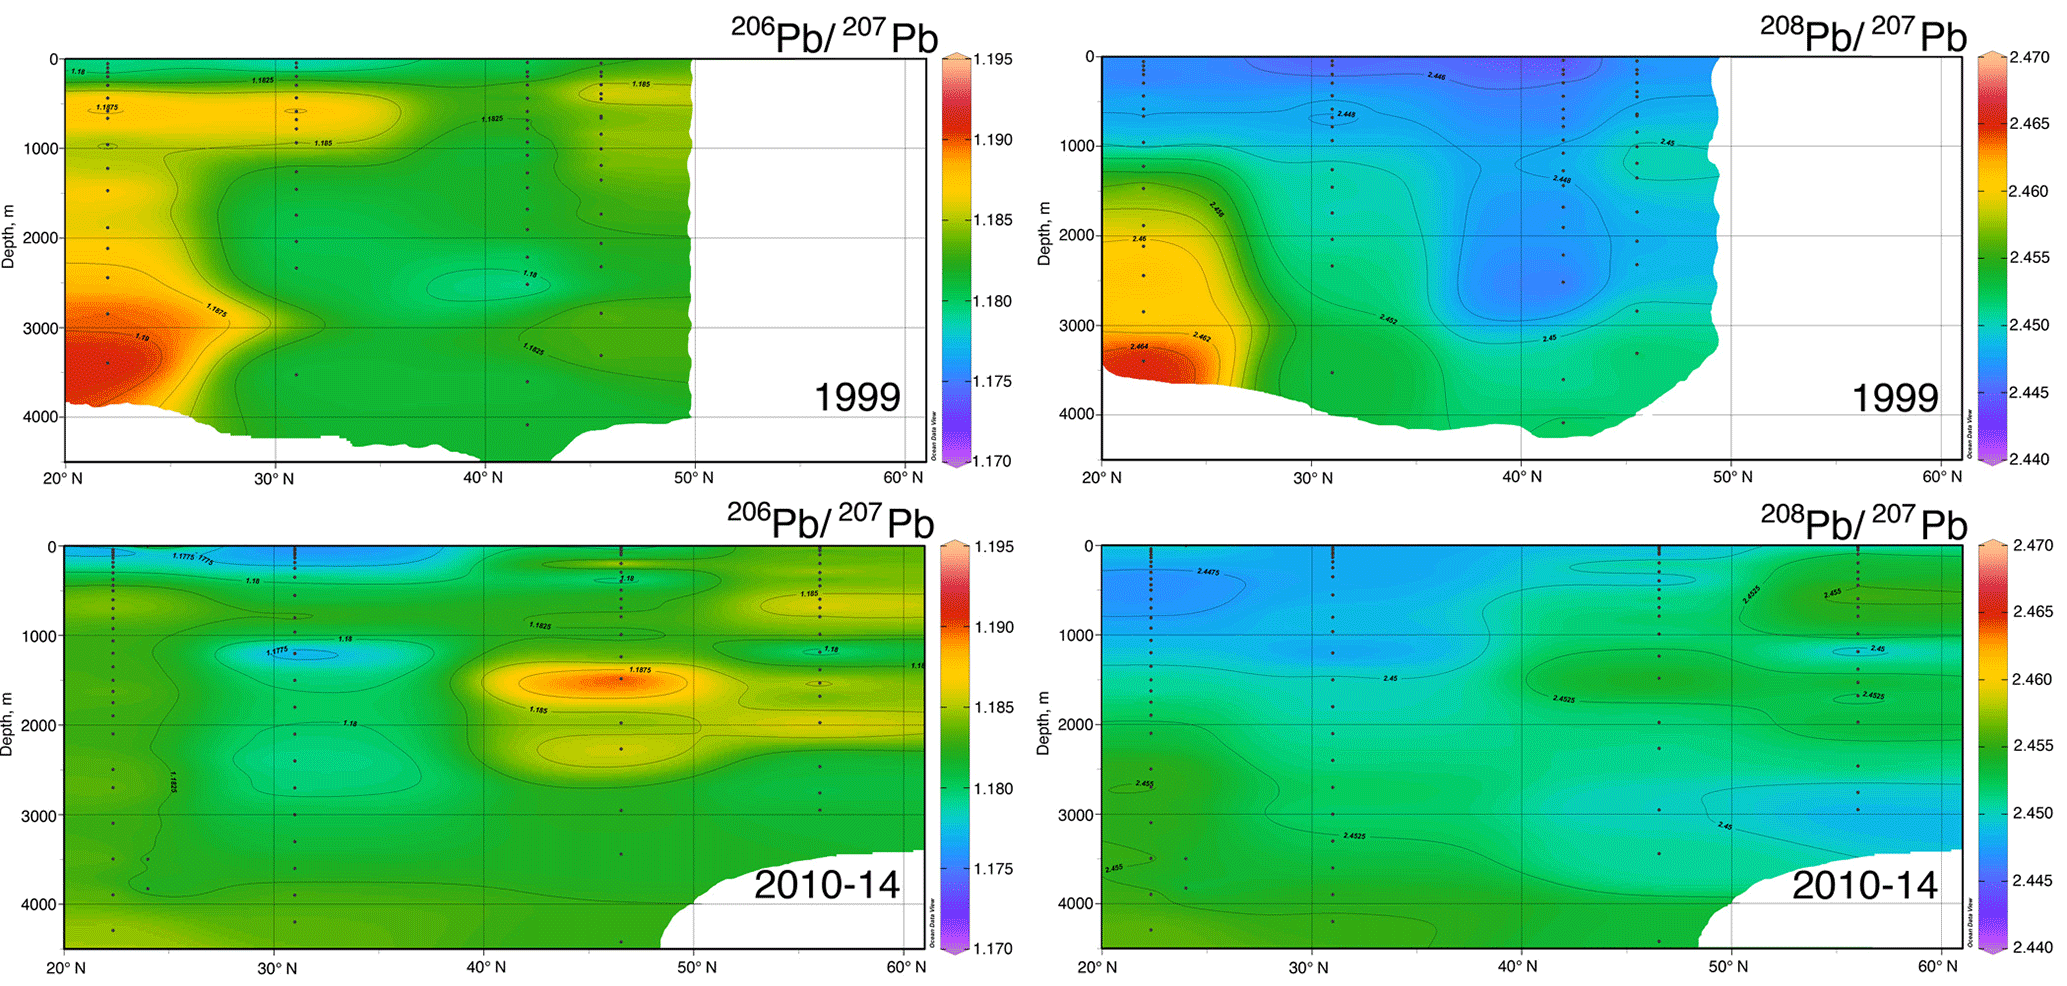
Figure 9North–south Pb isotope sections in the eastern Atlantic Ocean, 1999 and 2010–2014. Plot created in Ocean Data View (Schlitzer, 2017).
3.7 Sources of Pb in 1999 and 2014
Overall, Pb isotope ratios throughout the GEOVIDE expedition were relatively uniform, in both the upper and deep ocean, and in the eastern and western basins. This finding is similar to that of Noble et al. (2015) from the US GEOTRACES expeditions in the mid-Atlantic in 2010 and 2011, but differs from the expeditions of the 1980s and 1990s when Pb isotope ratios ranged much more broadly (206Pb ∕ 207Pb = 1.165–1.201) (Veron et al., 1999). Compared to the dramatic differences in isotope ratios of 25+ years before, it would appear there is a decoupling of variable Pb concentrations vs. uniform Pb isotopic composition in the North Atlantic. However, examining the Pb isotope ratios using a triple isotope plot (208Pb ∕ 206Pb vs. 206Pb ∕ 207Pb), it is clear that there have been small spatiotemporal Pb source changes between the 1999 EN328 cruise and regions of the 2014 GEOVIDE cruise that have the most recent atmospheric Pb inputs (Fig. 7c). Most of the 1999 data (except for the oldest deep waters) fall on the lower branch of the European–US mixing trend (yellow squares). The GEOVIDE data from Stations 11 to 26 at all depths and the > 800 m samples from Stations 29 to 77 fall on an intermediate trend, while the < 800 m samples from GEOVIDE Stations 29 to 77 (most recent Pb inputs) fall on the high side of the trend. We do not have enough source isotope information to explain these changes, but they clearly indicate spatiotemporal evolution of the evolving anthropogenic Pb transient in the northern North Atlantic Ocean. This trend is likely not as dramatic as the changes in both concentration and isotope ratios of previous decades because the magnitude of the total atmospheric flux of Pb into the North Atlantic has changed far more than the proportions of Pb emitted between the various sources.
In the industrial sector, emissions by European and Canadian/US sources have been relatively constant over the last 15 years. Pb emissions estimates were evaluated using the EMEP (European Monitoring Evaluation Program) database. Atmospheric Pb emissions for European countries along with the USA and Canada were evaluated from 1990 to 2014 (Fig. S3). Cumulative atmospheric Pb emissions have reduced by a factor of 10 in Europe and by a factor of 5 in North America over that time period. The ratio of Pb emissions from US and Canadian vs. European sources was 1:7 in 1990, but that ratio steadily increased to 1:3 by 1999 and has remained about the same since then, due to the much larger reductions in emissions by Europe (following upon earlier US emission reductions). The similarity of emissions for ∼ 15 years contrasted with the spatiotemporal trend in the isotope ratios could be a result of several phenomena. First, despite maintaining similar overall emissions, the sources of atmospheric Pb from each nation could have changed in characteristic but not quantity. Second, the evolution of Pb isotope ratios could be a result of uncounted emissions from non-point sources. Finally, natural mineral dust could be playing an influential role in seawater Pb isotope composition.
Atmospheric deposition is the main source of Pb to the ocean, with trace metals in anthropogenic-sourced carbonaceous aerosols known to be far more seawater soluble than silicate-bound metals in naturally derived aerosols (Desboeufs et al., 2005). Trace metal enrichment factors of dry aerosols and wet deposition were collected during the GEOVIDE cruise (Shelley et al., 2017, 2018). Results for Pb enrichment indicated atmospheric Pb was predominantly anthropogenic in origin (20–120, median 30). Using positive matrix factorization of the aerosol concentration data, Shelley et al. (2017, 2018) estimated that ∼ 60 % of the Pb was from a mineral dust source and only 40 % was of anthropogenic origin. This finding parallels the 2010 study of Pb in the tropical North Atlantic by Bridgestock et al. (2016) that found 30 %–50 % of total dissolvable Pb in seawater was from natural mineral dust from the North African dust plume. Despite a large fraction of the total atmospheric flux of Pb being natural in origin, the seawater isotope ratios are skewed towards the anthropogenic ratios due to the higher solubilization of anthropogenic Pb compared to mineral Pb. In the North Atlantic GEOVIDE, a larger contribution of mineral dust Pb could be obscured in the dissolved Pb signal because of the differing solubility.
Lead isotope ratios are a useful tool in resolving possible sources because they are not fractionated significantly by scavenging or other natural processes (compared to the large differences due to radiogenic sources). In the open ocean water column there is minimal opportunity for exchange of Pb between particles and water (unlike the sediment–water interface), so we would expect dissolved Pb isotopes to be representative of atmospheric inputs. Triple isotope plots of the waters from this cruise (Fig. 7a, b) compare the possible sources of Pb to the North Atlantic. Pre-Holocene sediments and corals from the North Atlantic (Hamelin et al., 1990; Kelly et al., 2009) are representative of the pre-industrial Pb background ratio we would expect to find in seawater if there were no anthropogenic inputs; unfortunately the Icelandic dust end-member is not known, but we suspect it is similar to North African dust. Because there is significant overlap in historic USA Pb emissions and modern North African dust with these isotope ratios, it is difficult to fully resolve the different sources. The aerosol signatures of anthropogenic sources in the USA and Europe fall along a linear mixing line, while the more natural Pb sources deviate from this line. The spatiotemporal trend (Fig. 7c) supports the hypothesis that an increasing amount of the most recent Pb inputs to the ocean is increasingly natural in origin. However, the seawater Pb isotope ratios will lag in reflecting the atmospheric Pb changes due to the preferential solubility of anthropogenic Pb, so the ocean will never fully reflect natural atmospheric Pb sources until all anthropogenic Pb sources are eliminated.
3.8 Evolution of Pb and Pb isotopes in the Eastern Atlantic Water Column, 1989–2014
Data for [Pb] from the 1989 (Atlantis II 123), 1999 (Endeavor 328), and 2010–2014 (GA03, and GA01 GEOVIDE) cruises, and Pb isotopes from 1999 and 2010–2014, are plotted as north–south sections in Figs. 8 and 9. It is evident that Pb is strongly decreasing in the upper ocean during this period, a fact that can be attributed to the phasing out of tetraethyl Pb gasoline in North America and Europe. All three periods show a Pb maximum in the deep thermocline, and this maximum deepens from decade to decade, as it has also done in the western North Atlantic water column near Bermuda (Boyle et al., 2014; Noble et al., 2015). As Noble et al. (2015) demonstrated for the 2010/2011 GA-03 trans-North Atlantic section, this maximum is located in waters with SF6 ventilation dates from the 1970s, when leaded gasoline Pb utilization was at its maximum. A similar result can be seen in the 1989 data based on 3He–3H dating (Jenkins, 1987). Hence the location of the maximum is dominantly a reflection of Pb emissions at the ventilation age of the water rather than an association with a particular water mass. When considered in this light – as a snapshot of an evolving three-dimensional transient tracer experiment – some of the features in these sections require an interpretation that differs substantially from that usually placed on quasi-steady-state tracers such as salinity, oxygen, and nutrients. For example, the [Pb] maximum seen at ∼ 25∘ N is not the source of a northward-spreading plume, it is the southern extent of high-[Pb] waters that were subducted into the thermocline in the 1970s and advected southwestwards by the dynamics of the ventilated thermocline (Luyten et al., 1983). In addition to the general ventilation of the North Atlantic water column, some [Pb] features are due to specific hydrographic features. The 1999 [Pb] maximum near 1000 m was enhanced by a strong “meddy”, a coherent mesoscale feature created by pulses of dense salty water from out of the Mediterranean Sea (Armi et al., 1989), as demonstrated by the salinity data from that profile (Fig. 10). It is also evident that the ∼ 1800 m Labrador Sea water has had consistently higher Pb than the denser Greenland–Scotland overflow water.

Figure 10CTD data from EN328 Station 10 (42∘ N, 17∘45′ W) showing a strong salinity maximum due to the Mediterranean outflow eddy.
It is likely that the evident decline in the Pb inventory of the eastern North Atlantic is decreasing not only because of advective–diffusive spreading of the water out of the basin, but also because of scavenging. Radiochemical studies (Bacon et al., 1976) have shown that deep water column 210Pb activities are lower than 226Ra activities, signifying removal of 210Pb from the deep water column. Some of this scavenging is due to sinking particles, but in near-bottom waters, “boundary scavenging” accounts for a higher fraction (Bacon, 1988).
The evolution of the Pb isotope data between 1999 and 2010–2014 is striking in that the deepest waters in the tropical eastern Atlantic are significantly changed between these periods. Near the surface, recent changes are mainly due to a greater reduction of the relative North American high 206Pb ∕ 207Pb sources relative to the European low 206Pb ∕ 207Pb sources, and possibly some influence of natural dust. But in the deep water, this change probably represents the “conveyor belt” motion of deep high 206Pb ∕ 207Pb introduced from the surface in the early 1900s being replaced by lower 206Pb ∕ 207Pb from the 1920s and later (as seen in historical Pb isotope ratios in Bermuda corals – Kelly et al., 2009).
In the past 30 years, massive reductions in Pb emissions to the environment have been evidenced by sampling campaigns in the North Atlantic Ocean. Evolution of [Pb] and Pb isotope ratios will continue as human-derived emissions continually decline, Pb is naturally scavenged from the water column, and the oceanic “conveyor belt” continues to mix deep waters. Like Bridgestock et al. (2016) found in the tropical Atlantic, we see evidence of a natural Pb source to the northern North Atlantic which was previously obscured in the 1980s and 1990s by enormous anthropogenic inputs, and which is still obscured in magnitude by the relatively greater solubility of anthropogenic-derived atmospheric Pb. Aerosol samples collected concurrently with our seawater samples support our determination that Pb in the surface waters is partially of natural origin (Shelley et al., 2017, 2018), and work by Prospero et al. (2012) introduces the possibility that much of the dust in the Irminger Sea and Iceland Basin is actually from high-latitude sources such as Icelandic dust. Future work to better constrain end-members could validate this hypothesis.
All GEOVIDE Pb and Pb isotope data are deposited in the BCO-DMO repository at http://lod.bco-dmo.org/id/dataset/651880 and http://lod.bco-dmo.org/id/dataset/652127 (Boyle et al., 2016). They are also included in GEOTRACES IDP2017 at https://doi.org/10.1016/j.chemgeo.2018.05.040 (Schlitzer, 2017).
The supplement related to this article is available online at: https://doi.org/10.5194/bg-15-4995-2018-supplement.
CZ analyzed the samples and prepared figures and the first draft of the manuscript. EB helped with Pb isotope analysis, revised the manuscript, and acted as correspondence author. RK prepared sample bottles, maintained ICPMS instrumentation, and performed Pb analysis on 1989 and 1999 samples. JW analyzed some 1989 samples. MR analyzed Pb isotopes on 1999 samples. RS analyzed trace metals on atmospheric aerosols on the GOEVIDE cruise and offered comments on the discussion. GS was the chief scientist of the GEOVIDE cruise. HP supervised the trace metal sampling on the GEOVIDE cruise. All other co-authors helped in the trace metal sampling during the GEOVIDE cruise.
The authors declare that they have no conflict of interest.
This article is part of the special issue “GEOVIDE, an international GEOTRACES study along the OVIDE section in the North Atlantic and in the Labrador Sea (GA01)”. It is not associated with a conference.
The GEOVIDE project was funded by the French National Research Agency
(ANR-13-BS06-0014, ANR-12-PDOC-0025-01), the French National Center for
Scientific Research (CNRS-LEFE-CYBER), the LabexMER (ANR-10-LABX-19), and
Ifremer. We also thank the shipboard technical team: Pierre Branellec,
Floriane Desprez de Gésincourt, Michel Hamon, Catherine Kermabon,
Philippe Le Bot, Stéphane Leizour, Olivier Ménage,
Fabien Pérault, and Emmanuel de Saint-Léger. GEOVIDE nutrient data
were obtained by Manon Le Goff, Emilie Grossteffan, Morgane Gallinari, and
Paul Tréguer. We thank Greg Cutter for assistance in setting up the clean
GOFlo rosette. We also thank the officers and crews of R/V Atlantis II (1989) and R/V Endeavor (1999) for their efforts on our behalf.
Our GEOVIDE sample analyses were funded by the US National Science Foundation
by grant OCE-1357224. We thank Dominik Weiss and two anonymous reviewers for
their constructive comments.
Edited by:
Catherine Jeandel
Reviewed by: Dominik Weiss and two
anonymous referees
Armi, L., Hebert, D., and Oakey, N.: Two years in the life of a Mediterranean salt lens, J. Phys. Oceanogr., 19, 354–370, 1989.
ATSDR (Agency for Toxic Substances and Disease Registry): Report: Toxicological profile for lead, U.S. Department of Health and Human Services, available at: https://www.atsdr.cdc.gov/toxprofiles/tp13.pdf (last access: 24 November 2017), 2007.
Bacon, M. P.: Tracers of chemical scavenging in the ocean: boundary effects and large-scale chemical fractionation, Philos. T. R. Soc. Lond., 325, 147–160, 1988.
Bacon, M. P., Spencer, D. W., and Brewer, P. G.: 210Pb ∕ 226Ra and 210Po ∕ 210Pb disequilibria in seawater and suspended particulate matter, Earth Planet. Sc. Lett., 32, 277–296, 1976.
Baker, J., Peate, D., Waight, T., and Meyzena, C.: Pb isotopic analysis of standards and samples using a 207Pb–204Pb double spike and thallium to correct for mass bias with a double-focusing MC-ICP-MS, Chem. Geol., 211, 275–303, https://doi.org/10.1016/j.jchemgeo.2004.06.030, 2004.
Bell, J., Betts, J., and Boyle, E. A.: MITESS: a moored in situe trace element serial sampler for deep-sea moorings, Deep-Sea Res. Pt. I, 49, 2103–2118, https://doi.org/10.1016/S0967-0637(02)00126-7, 2002.
Bollhöfer, A. and Rosman, K. J.: Isotopic source signatures for atmospheric lead: The Northern Hemisphere, Geochim. Cosmochim. Ac., 65, 1727–1740, https://doi.org/10.1016/S0016-7037(00)00630-X, 2001.
Bory, A. J. M., Abouchami, W., Galer, S. J. G., Svensson, A., Christensen, J. N., and Biscaye, P. E.: A Chinese imprint in insoluble pollutants recently deposited in central Greenland as indicated by lead isotopes, Environ. Sci. Technol., 48, 1451–1457, https://doi.org/10.1021/ew4035655, 2014.
Boyle, E. A., Chapnick, S. D., Shen, G. T., and Bacon, M. P.: Temporal Variability of Lead in the Western North Atlantic Ocean, J. Geophys. Res., 91, 8573–8593, 1986.
Boyle, E. A., John, S. Abouchami, W., Adkins, J. F., Echegoyen-Sanz, Y., Ellwood, M., Flegal, R. Fornace, K., Gallon, C., Galer, S., Gault-Ringold, M., Lacan, F., Radic, A., Rehkamper, M., Rouxel, O., Sohrin, Y., Stirling, C., Thompson, Cl., Vance, D., Xue, Z., and Zhao, Y.: GEOTRACES IC1 (BATS) Contamination-Prone Trace Element Isotopes Cd, Fe, Pb, Zn, (and Mo) Intercalibration, Limnol. Oceanogr. Method., 10, 653–665, https://doi.org/10.4319/lom.2012.10.653, 2012.
Boyle, E. A., Lee, J.-M., Echegoyen, Y., Noble, A., Moos, S., Carrasco, G., Zhao, N., Kayser, R., Zhang, J., Gamo, T., Obata, H., and Norisuye, K.: Anthropogenic lead emissions in the ocean – the evolving global experiment, Oceanography, 27, 69–74, 2014.
Boyle, E. A., Zurbrick, C., and Kayser, R.: Dissolved lead data collected from the R/V Pourquoi pas (GEOVIDE) in the North Atlantic, Labrador Sea (section GA01) during 2014, Biological and Chemical Oceanography Data Management Office (BCO-DMO), Dataset version 2016-08-01, available at: http://lod.bco-dmo.org/id/dataset/651880 (last access: 10 September 2017), 2016.
Bullard, J. E., Baddock, M., Bradwell, T., Crusius, J., Darlington, E., Gaiero, D., Gassoì, S., Gisladottir, G., Hodgkins, R., McCulloch, R., McKenna-Neuman, C., Mockford, T., Stewart, H., and Thorsteinss, T.: High latitude dust in the earth system, Rev. Geophys. 54, 447–485, https://doi.org/10.1002/2016RG000518, 2016.
Bridgestock, L., van der Flierdt, T., Rehkamper, M., Paul, M., Middag, R., Milne, A., Lohan, M. C., Baker, A. R., Chance, R., Khondoker, R., Strekopytov, S., Humphreys-Williams, E., Achterberg, E. P., Rijkenberg, M. J. A., Gerringa, L. J. A., and de Baar, H. J. W.: Return of naturally sourced Pb to Atlantic surface waters, Nat. Commun., 7, 12921, https://doi.org/10.1038/ncomms12921, 2016.
Chen, M., Boyle, E. A., Lee, J.-M., Nurhati, I., Zurbrick, C., Switzer, A. D., and Carrasco, G.: Lead isotope exchange between dissolved and fluvial particulate matter: a laboratory study from the Johor River estuary, Philos. T. R. Soc. Lond., 374, 20160054, https://doi.org/10.1098/rsta.2016.0054, 2016.
Cutter, G. A. and Bruland, E. B.: Rapid and noncontaminating sampling system for trace elements in global ocean surveys, Limnol. Oceanogr. Method., 10, 425–436, https://doi.org/10.4319/lom.2012.10.425, 2012.
Desboeufs, K. V., Sofikitis, A, Losno, R., Colin, J. L., and Ausset, P.: Dissolution and solubility of trace metals from natural and anthropogenic aerosol particulate matter, Chemosphere, 58, 195–203, 2005.
EMEP (European Monitoring Evaluation Program) WebDab: Convention on Long-range Transboundary Air Pollution, available at: http://Webdab1.umweltbundesamt.at/official_country_trend.html, last access: 24 November 2017.
Fine, R. A.: Observations of CFCs and SF6 as Ocean Tracers, Annu. Rev. Mar. Sci., 3, 173–95, https://doi.org/10.1146/annurev.marine.010908.163933, 2011.
Fröb, F., Olsen, A., Vage, K., Moore, G. W. K., Yashayaev, I., Jeansson, E., and Rajasakaren, B.: Irminger Sea deep convection injects oxygen and anthropogenic carbon to the ocean interior, Nat. Commun., 7, 13244, https://doi.org/10.1038/ncomms13244, 2016.
García-Ibáñez, M. I., Pardo, P. C., Carracedo, L. I., Mercier, H., Lherminier, P., Ríos, A. F., and Pérez, F. F.: Structure, transports, and transformations of the water masses in the Atlantic Subpolar Gyre, Prog. Oceanogr., 135, 18–36, https://doi.org/10.1016/j.pocean.2015.03.009, 2015.
García-Ibáñez, M. I., Pérez, F. F., Lherminier, P., Zunino, P., Mercier, H., and Tréguer, P.: Water mass distributions and transports for the 2014 GEOVIDE cruise in the North Atlantic, Biogeosciences, 15, 2075–2090, https://doi.org/10.5194/bg-15-2075-2018, 2018.
Hamelin, B., Grousset, F., and Sholkovitz, E. R.: Pb isotopes in surficial pelagic sediments from the North Atlantic, Geochim. Cosmochim. Ac., 54, 37–47, https://doi.org/10.1016/0016-7037(90)90193-O, 1990.
Harris, A. R. and Davidson, C. I.: The role of resuspended soil in lead flows in the California South Coast Air Basin, Environ. Sci. Technol., 39, 7410–7415, https://doi.org/10.1021/es050642s, 2005.
Jenkins, W. J.: 3H and 3He in the Beta Triangle: observations of gyre ventilation and oxygen utilization rates, J. Phys. Oceanogr., 17, 763–783, 1987.
Jenkins, W. J., Smethie Jr., W. M., Boyle, E. A., and Cutter, G. A.: Water mass analysis for the U.S. GEOTRACES (GA03) North Atlantic secions, Deep-Sea Res. Pt. II, 116, 6–20, https://doi.org/10.1016/j.dsr2.2014.11.018, 2015.
Kelly, A. E., Reuer, M. K., Goodkin, N. F., and Boyle, E. A.: Lead concentrations and isotopes in corals and water near Bermuda, 1780–2000, Earth Planet. Sc. Lett., 283, 93–100, https://doi.org/10.1016/j.epsl.2009.03.045, 2009.
Kieke, D. and Yashayaev, I.: Studies of Labrador Sea Water formation and variability in the subpolar North Atlantic in the light of international partnership and collaboration, Prog. Oceanogr., 132, 220–232, https://doi.org/10.1016/j.pocean.2014.12.010, 2015.
Lazier, J., Hendry, R., Clarke, A., Yashayaev, I., and Rhines, P.: Convection and restratification in the Labrador Sea, 1990–2000, Dee-Sea Res. Pt. I, 49, 1819–1835, https://doi.org/10.1016/S0967-0637(02)00064-X, 2002.
Lee, J.-M., Boyle, E. A., Echegoyen-Sanz, Y., Fitzsimmons, J. N., Zhang, R., and Kayser, R.: Analysis of trace metals (Cu, Cd, Pb, and Fe) in seawater using single batch nitrilotriacetate resin and isotope dilution inductively coupled plasma mass spectrometry, Anal. Chim. Acta, 686, 93–101, https://doi.org/10.1016/j.aca.2010.11.052, 2011.
Lilly, J. M., Rhines, P. B., Visbeck, M., Davis, R., Lazier, J. R. N., Schott, F., and Farmer, D.: Observing deep convection in the Labrador Sea during Winter 1994/95, J. Phys. Oceanogr., 29, 2065–2098, https://doi.org/10.1175/1520-0485(1999)029<2065:ODCITL>2.0.CO;2, 1999.
Luyten, J. R., Pedlosky, J., and Stommel, H.: The ventilated thermocline, J. Phys. Oceanogr., 13, 292–309, 1983.
Martin, J. H., Fitzwater, S. E., Gordon, R. M., Hunter, C. N., and Tanner, S. J.: Iron, primary production and carbon-nitrogen flux studies during the JGOFS North Atlantic Bloom experiment, Deep-Sea Res. Pt. II, 40, 115–134, https://doi.org/10.1016/0967-0645(93)90009-C, 1993.
Matsumoto, K.: Radiocarbon-based circulation age of the worlds oceans, J. Geophys. Res., 112, C09004, https://doi.org/10.1029/2007JC004095, 2007.
Measures, C. I., Yuan, J., and Resing, J. A.: Determination of iron in seawater by flow injection analysis using in-line preconcentration and spectrophotometric detection, Mar. Chem., 50, 3–12, https://doi.org/10.1016/0304-4203(95)00022-J, 1995.
Moos, S. B. and Boyle, E. A.: Trace metal concentrations (Ba, Cd, Cu, Ni, Pb, Zn) and Pb isotopic signatures throughout the 1980s surface Mediterranean Sea and the deep Alboran Sea, Mar. Chem., in preparation, 2018.
Noble, A. E., Echegoyen-Sanz, Y., Boyle, E. A., Ohnemus, D. C., Lam, P. J., Kayser, R., Reuer, M., and Wu, J.: Dynamic variability of dissolved Pb and Pb isotope composition from the U.S. North Atlantic GEOTRACES Transect, Deep-Sea Res. Pt. II, 116, 208–225, https://doi.org/10.1016/j.dsr2.2014.11.011 2015.
Planquette, H. and Sherrell, R. M.: Sampling for particulate trace element determination using water sampling bottles: methodology and comparison to in situ pumps, Limnol. Oceanogr. Method., 10, 5, 367–388, https://doi.org/10.4319/lom.2012.10.367, 2012.
Prospero, J. M., Bullard, J. E., and Hodgkins, R.: High-latitude dust over the North Atlantic: Inputs from Icelandic proglacial dust storms, Science, 335, 6072, 1078–1082, https://doi.org/10.1126/science.1217447, 2012.
Reuer, M. K., Boyle, E. A., and Grant, B. C.: Lead isotope analysis of marine carbonates and seawater by multiple collector ICP-MS, Chem. Geol., 200, 137–153, https://doi.org/10.1016/S0009-2541(03)00186-4, 2003.
Rosman, K. J. R., Chisholm, W., Boutron, C. F., Candelone, J. P., and Patterson, C. C.: Anthropogenic lead isotopes in Antarctica, Geophys. Res. Lett., 21, 2669–2672, https://doi.org/10.1029/94GL02603, 1994.
Schaule, B. K. and Patterson, C. C.: Perturbations of the natural Pb depth profile in the Sargasso Sea by industrial Pb, in: Trace Elements in Seawater, edited by: Wong, C. S., Boyle, E. A., Bruland, K., Burton, D., and Goldberg, E. D., New York, Plenum, 487–504, 1983.
Schepanski, K., Tegen, I., and Macke, A.: Saharan dust transport and deposition towards the tropical northern Atlantic, Atmos. Chem. Phys., 9, 1173–1189, https://doi.org/10.5194/acp-9-1173-2009, 2009.
Schlitzer, R.: Ocean Data View, available at: https://odv.awi.de, last access: 24 November 2017. Schlitzer, R. et al.: The GEOTRACES Intermediate Data Product 2017: Chemical Geology, in press, https://doi.org/10.1016/j.chemgeo.2018.05.040, 2018.
Schwikowski, M., Barbante, C., Doering, T., Gaeggeler, H. W., Boutron, C., Schotterer, U., Tobler, L., Van de Velde, K., Ferrari, C., Cozzi, G., Rosman, K., and Cescon, P.: Post-17th-Century changes of European lead emissions recorded in high-altitutde alpine snow and ice, Environ. Sci. Technol., 38, 4, 957–964, https://doi.org/10.1021/es034715o, 2004.
Shelley, R. U., Roca-Marti, M., Castrillejo, M., Sanial, V., Masque, P., Landing, W. M., van Beek, P., Planquette, H., and Sarthou, G.: Quantification of trace element atmospheric deposition fluxes to the Atlantic Ocean (> 40∘ N; GEOVIDE, GEOTRACES GA01) during spring 2014, Deep-Sea Res. Pt. I, 119, 34–49, https://doi.org/10.1016/j.dsr.2016.11.010, 2017.
Shelley, R. U., Landing, W. M., Ussher, S. J., Planquette, H., and Sarthou, G.: Regional trends in the fractional solubility of Fe and other metals from North Atlantic aerosols (GEOTRACES cruises GA01 and GA03) following a two-stage leach, Biogeosciences, 15, 2271–2288, https://doi.org/10.5194/bg-15-2271-2018, 2018.
The GEOTRACES Group: The GEOTRACES Intermediate Data Product 2014, Mar. Chem., 177, 1–8, https://doi.org/10.1016/j.marchem.2015.04.005, 2015.
Thirlwall, M. F.: Multicollector ICP-MS analysis of Pb isotopes using a 207Pb–204Pb double spike demonstrates up to 400 ppm/amu systematic errors in Tl-normalization, Chem. Geol., 284, 255–279, https://doi.org/10.1016/S0009-2541(01)00365-5, 2002.
Vage, K., Pickart, R. S., Thierry, V., Reverdin, G., Lee, C. M., Petrie, B., Agnew, T. A., Wong, A., and Ribergaard, M. H.: Surprising return of deep convection to the subpolar North Atlantic Ocean in winter 2007–2008, Nat. Geosci., 2, 67–72, https://doi.org/10.1038/ngeo382, 2009.
Veron, A. J., Church, T. M., Rivera-Duarte, I., and Flegal, A. R.: Stable lead isotope ratios trace thermohaline circulation in the subarctic North Atlantic, Deep-Sea Res. Pt. II, 46, 919–935, https://doi.org/10.1016/S0967-0645(99)00009-0, 1999.
Weiss, D., Boyle, E. A., Wu, J., Chavagnac, V., Michel, A., and Reuer, M. K.: Spatial and temporal evolution of lead isotope ratios in the North Atlantic Ocean between 1981 and 1989, J. Geophys. Res., 108, C103306, https://doi.org/10.1029/2000JC000762, 2003.
Wu, J. and Boyle, E. A.: Low blank preconcentration technique for the determination of lead, copper and cadmium in small-volume samples by isotope dilution ICPMS, Anal. Chem., 69, 2464–2470, https://doi.org/10.1021/ac961204u, 1997.
Wu, J., Rember, R., Jin, M., Boyle, E. A., and Flegal, A. R.: Isotopic evidence for the source of lead in the North Pacific abyssal water, Geochim. Cosmochim. Ac., 74, 4629–4638, https://doi.org/10.1016/j.gca.2010.05.017, 2010.