the Creative Commons Attribution 4.0 License.
the Creative Commons Attribution 4.0 License.
 | 22 Aug 2018
Modeling rhizosphere carbon and nitrogen cycling in Eucalyptus plantation soil
Rafael Vasconcelos Valadares
Júlio César Lima Neves
Maurício Dutra Costa
Philip James Smethurst
Luiz Alexandre Peternelli
Guilherme Luiz Jesus
Reinaldo Bertola Cantarutti
Ivo Ribeiro Silva
Vigorous Eucalyptus plantations produce 105 to 106 km ha−1 of fine roots that probably increase carbon (C) and nitrogen (N) cycling in rhizosphere soil. However, the quantitative importance of rhizosphere priming is still unknown for most ecosystems, including these plantations. Therefore, the objective of this work was to propose and evaluate a mechanistic model for the prediction of rhizosphere C and N cycling in Eucalyptus plantations. The potential importance of the priming effect was estimated for a typical Eucalyptus plantation in Brazil. The process-based model (ForPRAN – Forest Plantation Rhizosphere Available Nitrogen) predicts the change in rhizosphere C and N cycling resulting from root growth and consists of two modules: (1) fine-root growth and (2) C and N rhizosphere cycling. The model describes a series of soil biological processes: root growth, rhizodeposition, microbial uptake, enzymatic synthesis, depolymerization of soil organic matter, microbial respiration, N mineralization, N immobilization, microbial death, microbial emigration and immigration, and soil organic matter (SOM) formation. Model performance was quantitatively and qualitatively satisfactory when compared to observed data in the literature. Input variables with the most influence on rhizosphere N mineralization were (in order of decreasing importance) root diameter > rhizosphere thickness > soil temperature > clay concentration. The priming effect in a typical Eucalyptus plantation producing 42 m3 ha−1 yr−1 of shoot biomass, with assumed losses of 40 % of total N mineralized, was estimated to be 24.6 % of plantation N demand (shoot + roots + litter). The rhizosphere cycling model should be considered for adaptation to other forestry and agricultural production models where the inclusion of such processes offers the potential for improved model performance.
- Article
(3637 KB) -
Supplement
(343 KB) - BibTeX
- EndNote


Nitrogen is a nutrient essential for plant growth and sustainability of natural and managed ecosystems, including Eucalyptus plantations (Barros and Novais, 1990; Jesus et al., 2012; Pulito et al., 2015; Smethurst et al., 2015). Low N availability commonly limits plantation growth, and plantations on soils with low organic matter concentrations are most severely affected (Barros and Novais, 1990; Pulito et al., 2015; Smethurst et al., 2015) as most N taken up by trees comes from the decomposition of soil organic matter (i.e., N mineralization) (Barros and Novais, 1990; Pulito et al., 2015; Smethurst et al., 2015).
Measurements of in situ net N mineralization are laborious but can be predicted to some degree using models. Smethurst et al. (2015) evaluated a process-based model (SNAP) for estimating net N mineralization in Eucalyptus plantations in southeastern Brazil. The authors estimated annual rates of net N mineralization ranging from 148 to 340 kg ha−1 yr−1 of N in the 0–20 cm soil depth, with additional available N expected in deeper soil layers. These rates of N supply were similar to or higher than the N demand of young plantations in the region and therefore consistent with the observation that growth responses to N fertilization were minor or absent. An extension of the in situ core measurement used can estimate N uptake by plantations and has been independently validated (Smethurst and Nambiar, 1989). However, spatial and other methodological errors in this core technique are high. One source of error relates to the severing of roots at the start of in situ field incubations, which may lead to a disturbance of rhizosphere processes (i.e., N turnover) associated with root exudation and decomposition. Therefore, understanding and quantifying rhizosphere processes could lead to reduced errors in estimates of N supply.
There is speculation that rhizosphere processes might be a significant source of N supply for some trees (Grayston et al., 1997), as the roots and litter from trees create environments more favorable to microbial activity than occur in bulk soil. This effect is mainly due to the release of C to soil in the form of dead roots or rhizodepositions (secretions, lysates, gases, mucilages, etc.). Therefore, the effect of the plant on biological activity in the rhizosphere may be important for the prediction and measurement of biological phenomena like net N mineralization in a range of ecosystems. Finzi et al. (2015) estimated that mineralization in rhizosphere soil of temperate forests can represent 1∕4 of all mineralized N in the ecosystem. This high rate of N supply from rhizosphere processes is explained by exudates released by tree roots that include carbohydrates, amino acids, organic acids, fatty acids, phenolic acids, vitamins, volatile compounds, and growth factors (Grayston et al., 1997), which serve as substrates for the growth of soil microbes and their production of enzymes (Drake et al., 2013). This effect of C addition on microbial behavior and, consequently, on soil organic matter (SOM) mineralization, is popularly known in the scientific literature as the priming effect, which is described in detail for soil under Eucalyptus by Derrien et al. (2014).
Hurtarte (2017), in a study under greenhouse conditions, observed that rhizosphere of Eucalyptus seedlings contains significant amounts of citric, malic, and oxalic acids, as well as sucrose, allose, fructose, glutamine, inositol, and asparagine. The author found that the release of these organic compounds was associated with decreased total N concentration in rhizosphere, suggesting a nutritional benefit for Eucalyptus seedlings. Also, in a native Eucalyptus forest after fire, Eucalyptus roots enhanced microbial activity and N mineralization (Dijkstra et al., 2017). Despite these advances, there are no quantitative studies examining the importance of the priming effect in Eucalyptus plantations.
In relation to plant systems in general and based on Schimel and Weintraub (2003) and Allison et al. (2010), Drake et al. (2013) developed the Microbial C and N Physiology general model (abbreviated MCNiP by Davidson et al., 2014) to estimate C and N rhizosphere cycling. In this model, mineralization rates depend on system stoichiometry and soil temperature. However, to improve the application of this model, it needed to be linked to plant growth and root development, as well as microbial population dynamics as affected by water, nutrients, and other soil properties.
The objectives of this work were to (1) propose a model for estimating rhizosphere C and N cycling in Eucalyptus plantation soil, (2) evaluate model performance and input sensitivity, and (3) estimate the potential importance of rhizosphere priming on N supply in a typical Eucalyptus plantation in Brazil.
2.1 ForPRAN theoretical model
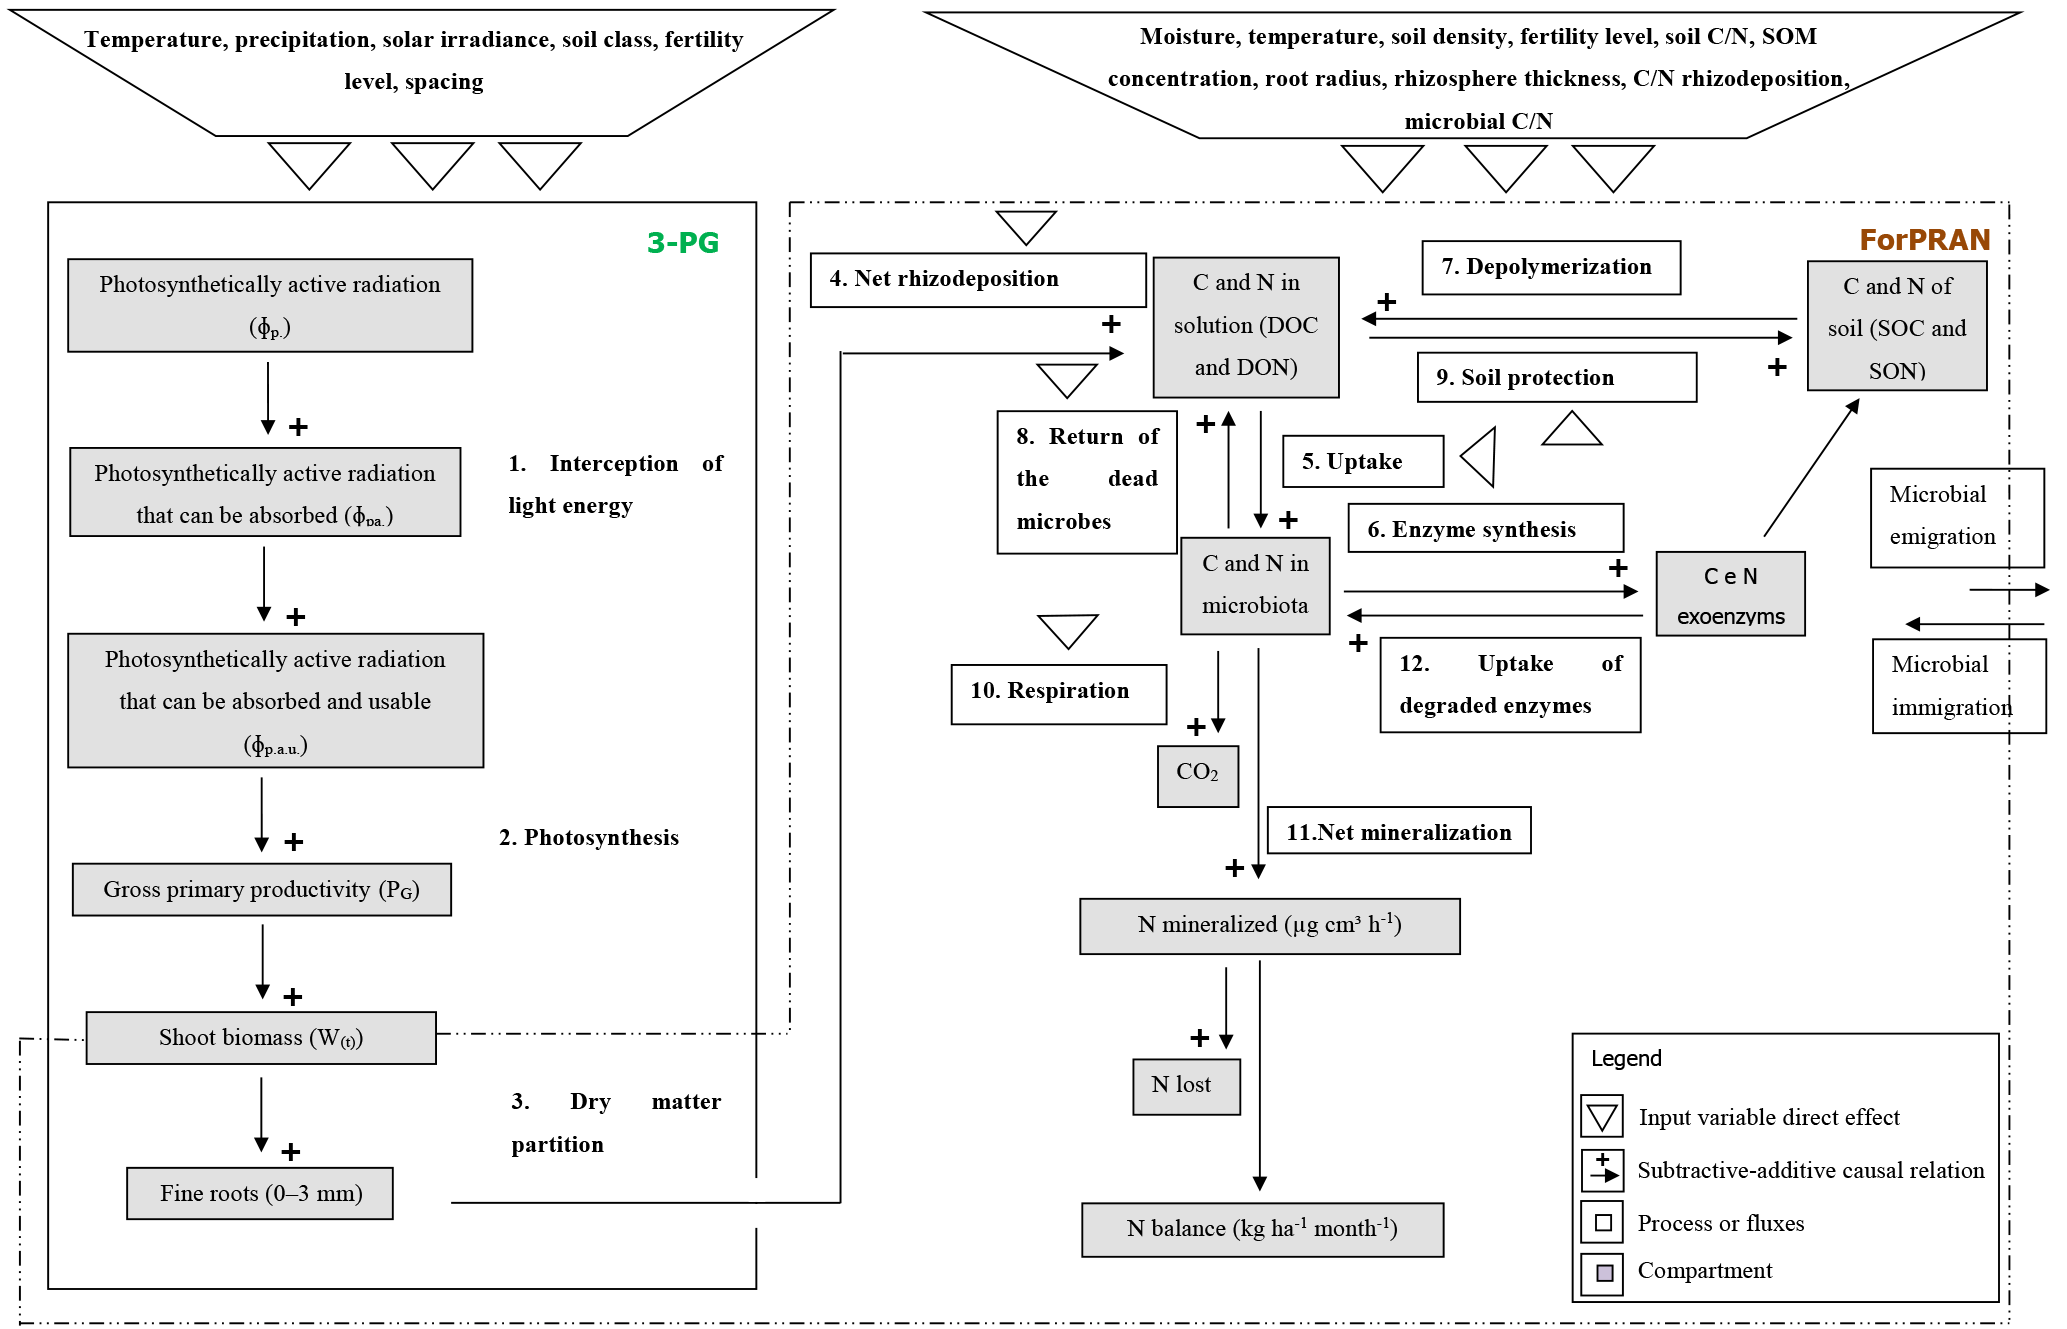
The Forest Plantation Rhizosphere Available N model (ForPRAN) is based on the laws of the conservation of matter and energy and on the principle that systems seek self-organization as a strategy of self-preservation. One of these strategies is cooperation between organisms for mutual benefit (mutualism). In this case, trees release organic compounds that modulate the rhizosphere microbial processes. The release of organic compounds into the rhizosphere provides energy and labile nutrients – factors in greater abundance for it and scarce for microbiota – and receives in return a higher supply of N and other nutrients mineralized from soil organic matter. This symbiosis involves shoots, roots, soil microbes, and other soil properties, the biological components of which may have coevolved to sustain N and energy fluxes in the forest ecosystem. The application presented is for Eucalyptus, but the principles and model could be adapted to other plant–soil systems where data are available to guide parameterization. The process is schematically summarized in Fig. 1.
Rhizosphere N supply is described as a function of key variables that reflect the complexity of the N cycle in the rhizosphere. These variables can be grouped into three categories, which are related to
-
rhizosphere dimensions (root diameter; rhizosphere thickness; clay concentration; soil layer considered; shoot dry matter);
-
C and N availability and microbial demand and metabolism (C radicular efflux rate; soil organic matter concentration; rhizodeposition C ∕ N ratio; soil C ∕ N ratio; enzymes C ∕ N ratio; microbiota C ∕ N ratio; soil protection capacity);
-
conditions that affect microbial turnover (total porosity; moisture; temperature).
2.1.1 Rhizosphere dimensions
Rhizosphere volume is one of the most important factors influencing the priming effect. In the logic of ForPRAN, rhizosphere volume is related to the length of fine roots and their diameter and also to the thickness of the rhizosphere. Root length is strongly related to shoot biomass as the source of stored and newly fixed C (Mello et al., 1998; Neves, 2000; Leles et al., 2001; Teixeira et al., 2002; Gatto et al., 2003; Maquere, 2008). Root length is also related to soil clay concentration in association with its effects on available water and nutrients. Rooting depth also affects N priming, as roots are usually concentrated in the top 30 cm of soil (Mello et al., 1998). The thickness of the rhizosphere depends on the nature and amount of rhizodeposited compounds (Finzi et al., 2015) and soil properties, but for simplicity ForPRAN uses a constant user-specified value of thickness based on observations by Jones (1998), Barber (1995), Sauer et al. (2006), and Hurtarte (2017).

2.1.2 C and N availability and microbial demand
The model follows the logic of stoichiometric balance between substrate supply and microbial demand and the “Law of the Minimum” applied to the microbial processes, as presented by Schimel and Weintraub (2003), Allison et al. (2010), Drake et al. (2013), and Finzi et al. (2015). In general, the model assumes that an increase in the availability of organic substrates increases microbial biomass and enzyme production and therefore the processes related to soil organic matter mineralization. Microbial processes are affected in different ways according to the availability of organic C and N. For instance, when the availability of N exceeds microbial demand, C becomes a limiting factor leading to an increase in net N mineralization. On the other hand, when C availability exceeds microbial demand, N becomes the limiting factor leading to an increase in respiration and net N immobilization. Substrate availability for these processes is modulated by soil protection that in turn depends mainly on the amount of clay, mineralogy, and soil C content (degree of saturation of clays by organic C). Protection of C by the soil matrix prevents microbes accessing such C to satisfy nutritional demands and thereby limits microbial growth (Silva et al., 2011). On the other hand, if soil has minimal C and N protection, these resources are more readily available to microbial attack (Silva et al., 2011).
2.1.3 Factors affecting microbial turnover
Soil moisture affects microbial metabolism because of its role as a universal solvent (i.e., all microbial reactions depend on water) (Brock and Madigan, 1991; Abramoff et al., 2017). The positive effect of moisture increase on microbial processes is very important in tropical environments where it varies greatly. In conditions of low water availability, microorganisms expend more energy adapting to their electrochemical environment, often by synthesizing proline and glutamine or by taking up K+ (Brock and Madigan, 1991). However, such mechanisms do not always compensate for water deficit, leading to reduced microbial biomass under dry conditions (Sato et al., 2000). This effect is presented in the ForPRAN model by means of a modifier (Ku) in the microbial death rate (Kmf), the value of which is inversely proportional to water availability.
Temperature is another important factor affecting microbial metabolism, which operates in two opposing ways. Rising temperatures are responsible for elevated rates of chemical and enzymatic reactions (Brock and Madigan, 1991). Such increases have a positive impact on microbial biomass and therefore are related to increases in CO2 evolution and N mineralization rates (Brock and Madigan, 1991). On the other hand, above a certain temperature, microbial cellular components are denatured (like exoenzymes), causing microbial process rates to fall sharply (Brock and Madigan, 1991). We assumed that temperature influences enzymatic kinetics by being optimal in the range of 25 to 40 ∘C and decreasing rapidly at higher and lower values. This effect was implemented in the ForPRAN model through the KappaD variable that influences the rate of SOM enzymatic depolymerization and, consequently, the rate of microbial growth.
In ForPRAN, soil physical conditions affect microbial communities via porosity. Extremes of porosity reduce microbial biomass and consequently C and N mineralization (Silva et al., 2011). This change occurs because soil porosity affects the concentration and transport of O2 (Torbert and Wood, 1992), as well as liquid and solute movement, and C and N protection by the soil matrix (Kpr) (Silva et al., 2011). This effect is presented in ForPRAN by means of a modifier (Kpt) of the microbial death rate (Kmf), for which extreme values raise the Kmf rate in accordance with data presented by Silva et al. (2011).
2.2 Mathematical model overview
ForPRAN model processes are based on previously developed functions and also on functions developed in the present work. We used data from the literature to parameterize the model. The model has two sequential parts: (1) a module of fine-root growth and rhizodeposition and (2) a module of C and N turnover in the rhizosphere (Fig. 2).
In the first part we used the 3-PG model (Landsberg and Waring, 1997) to represent the conversion of light energy to dry vegetable matter. The 3-PG model is used widely for this purpose by researchers and managers in the forest plantation industry (Almeida and Sands, 2016). Root biomass and depth are estimated in 3-PG but not root length density of fine roots. To represent the growth of fine roots (including root length density), we used a nonlinear model fitted to the data of Mello et al. (1998), Neves (2000), Leles et al. (2001), Teixeira et al. (2002), Gatto et al. (2003), and Maquere (2008). Then the rate of C and N release processes from roots are calculated according to Personeni et al. (2007) and Farrar et al. (2003).
In the second part of the model, we described the rhizosphere C and N cycling system. To do so, we modified the MCNiP model (Drake et al., 2013; Davidson et al., 2014) to include the effects on microbes of soil moisture, physical conditions, temperature (effect on exoenzymes kinetics), and microbial immigration and emigration (Fig. 2).
The model simulates the effect of Eucalyptus roots on C and N cycling in rhizosphere soil, with a particular focus on N availability and C balance. The model does not simulate N availability or C balance in bulk soil, and changes in rhizosphere C and N do not feedback to affect plant growth. For the latter, a more complex plantation production model than 3-PG is required as 3-PG does not explicitly consider N cycling. Further details of the model are presented in the Supplement.
2.3 Parameter estimation
Most of the parameters present in ForPRAN were based on values observed in previous studies. For instance, parameters used for modeling fine-root growth and rhizodeposition were based on several studies: Mello et al. (1998), Neves (2000), Leles et al. (2001), Teixeira et al. (2002), Gatto et al. (2003), Maquere (2008), and Personeni et al. (2007). Other parameters used for simulating C and N cycling in rhizosphere soil were based mainly on the studies of Schimel and Weintraub (2003), Allison et al. (2010), and Drake et al. (2013). In addition, data were used from Sato et al. (2000), De Neergaard and Magid (2001), and Silva et al. (2011) to estimate the modifying coefficients of population dynamics in relation to the effects of water, soil organic matter, and soil physical conditions. A detailed presentation of the parameters used and their respective data sources is presented in the Supplement.
2.4 Evaluation of the rhizosphere model
During model development, substrate use efficiency was assumed to be 0.3 µg µg−1 (SUE; Table S2 of the Supplement) for conditions of low availability of C and N. For higher N availability, we assumed more efficient use of C (SUE = 0.35 µg µg−1). We also assumed a low rate of enzyme production of 0.0075 µg C µg−1 h−1 (Kep) in the absence of C and N, while in the presence of both C and N this value was assumed to be intermediate (0.0125 µg C µg−1 h−1) and 0.02 µg C µg−1 h−1 in the presence of C only (in the absence of N). This range was used to reflect more investment in enzymes to try to meet the microbial demand for N when C is not the most limiting nutrient.
The following are the main statistics used to describe the performance of the model in predicting microbial behavior under different treatments presented in Drake et al. (2013). The experiment of Drake et al. (2013) measured microbial biomass included after a daily pulse of water, water + C, and water + C + N during early summer.
-
A linear model of the type was fitted, where P is the value predicted by the model and O is the value observed in field experiments. Model performance was evaluated through the coefficient of determination (R2). In addition, coefficient β1 was tested for significant difference from 1 and coefficient β0 for significant difference from 0 using t tests.
-
The Nash–Sutcliffe efficiency (NSE), which describes the relative magnitude of the residual variance compared to the measured data variance (Moriasi et al., 2007):
-
The mean error (ME), which indicates any bias in the predictions:
-
The mean absolute error (MAE), which provides a simple description of the magnitude of estimation errors:
-
The root mean square error to standard deviation ratio (RSR), which provides a standardized value of the root mean square error:
-
A qualitative evaluation was presented considering the relationship between the increase in root exudation effect on microbial biomass vs. exoenzyme production, respiration, and total N of soil.
2.5 Sensitivity analysis
In the sensitivity analysis, each variable was increased and decreased in comparison to a base value while keeping other inputs constant. In this way, the effect of each input variable on the response variable (e.g., N availability) was estimated. The ranges of values tested for each variable were based on natural variability. The sensitivity analysis was standardized using Eq. (5) (Allison et al., 2010).
3.1 Statistical parameterization and evaluation of the model
3.1.1 Fine-root biomass
Predicted fine-root biomass had a satisfactory fit with observations (R2=0.75; Fig. 3). The intercept was not significantly different from 0, and the slope of 1.01 was not significantly different from 1. These results are satisfactory considering the difficulty in obtaining root data and the simplicity of the equation (MSfr = a Clayb TSLc MDAPd). In the equation, Clay represents soil clay concentration, TSL represents thickness of the soil layer considered and MDAP represents the mass of dry matter of the aerial part.
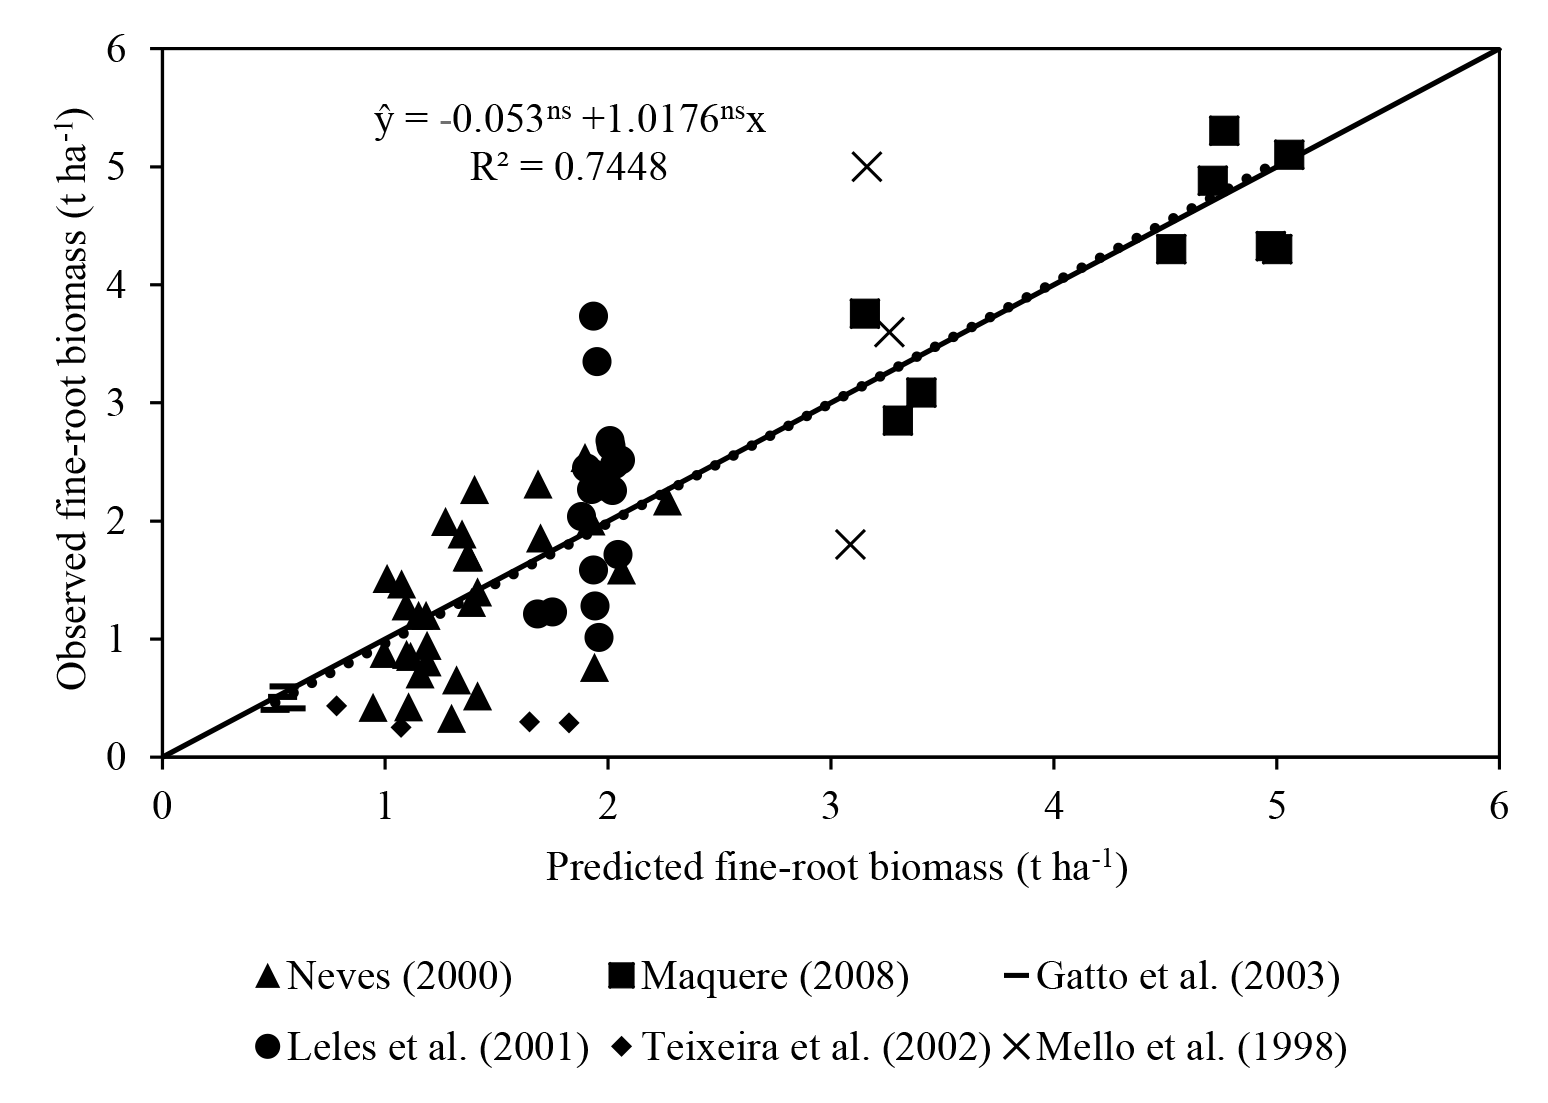
Figure 3Regression of fine-root biomass reported in the literature against values predicted using the ForPRAN model. The dotted line is the mean regression, with neither intercept nor slope significantly different from 0 or 1, respectively. Solid line: 1 : 1 relationship.
3.1.2 Rhizosphere processes
The model satisfactorily simulated microbial biomass across the range of observed data (Fig. 4); the intercept was not significantly different from 0, and the slope of 0.89 was not significantly different to 1, with R2=0.91 and NSE=0.90. The ME (0.02) and the MAE (1.77) indicate that the error associated with predictions was low considering the range of the observed values (19.7–38.2 µg C g−1). The value of RSR was 0.32, which is low according to Moriasi et al. (2007). Simulation of the experiment performed by Drake et al. (2013) showed daily fluctuations in microbial biomass, in which the maximum microbial biomass was observed in the treatments with pulses of C and N, intermediate microbial biomass with only C, and lower with only water (Fig. 5).
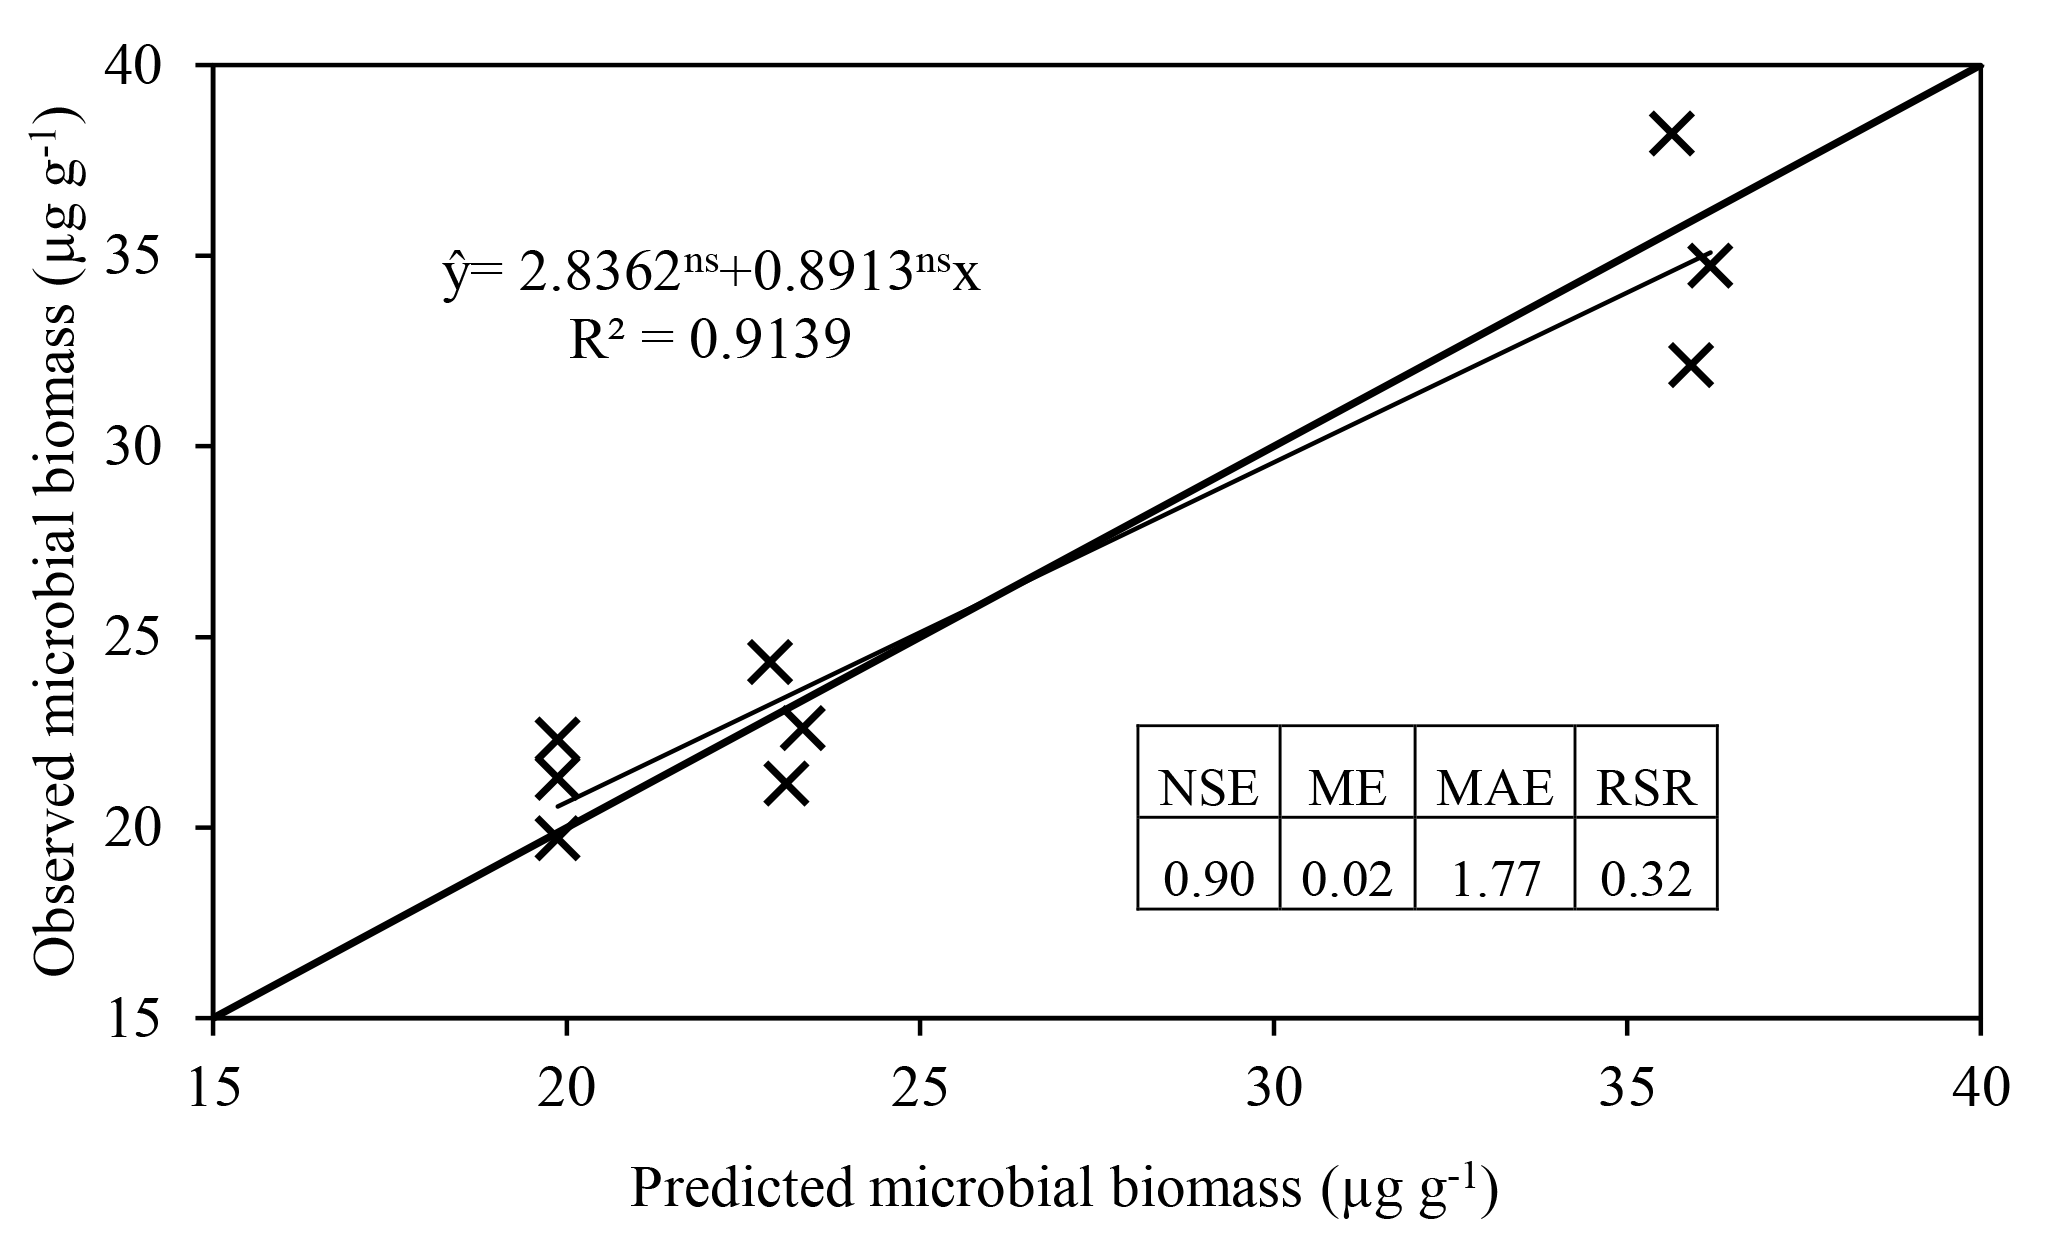
Figure 4Regression of microbial biomass observed by Drake et al. (2013) against ForPRAN results. Regression parameters were not significantly different from 1 (slope) and 0 (intercept), respectively. The Nash–Sutcliffe efficiency (NSE), mean error (ME), mean absolute error (MAE), and root mean square error to standard deviation ratio (RSR) are indicators of model efficiency and bias.
Qualitatively, microbial behavior predicted by ForPRAN when microorganisms received C were as expected (Fig. 6). As C availability increased, biomass increased, which is in response to increased exoenzyme production and respiration. Conversely, when microbial biomass increased there was a tendency for reduced total organic N – a condition in which the decomposition of native soil organic matter can surpass the formation of new SOM in the rhizosphere.
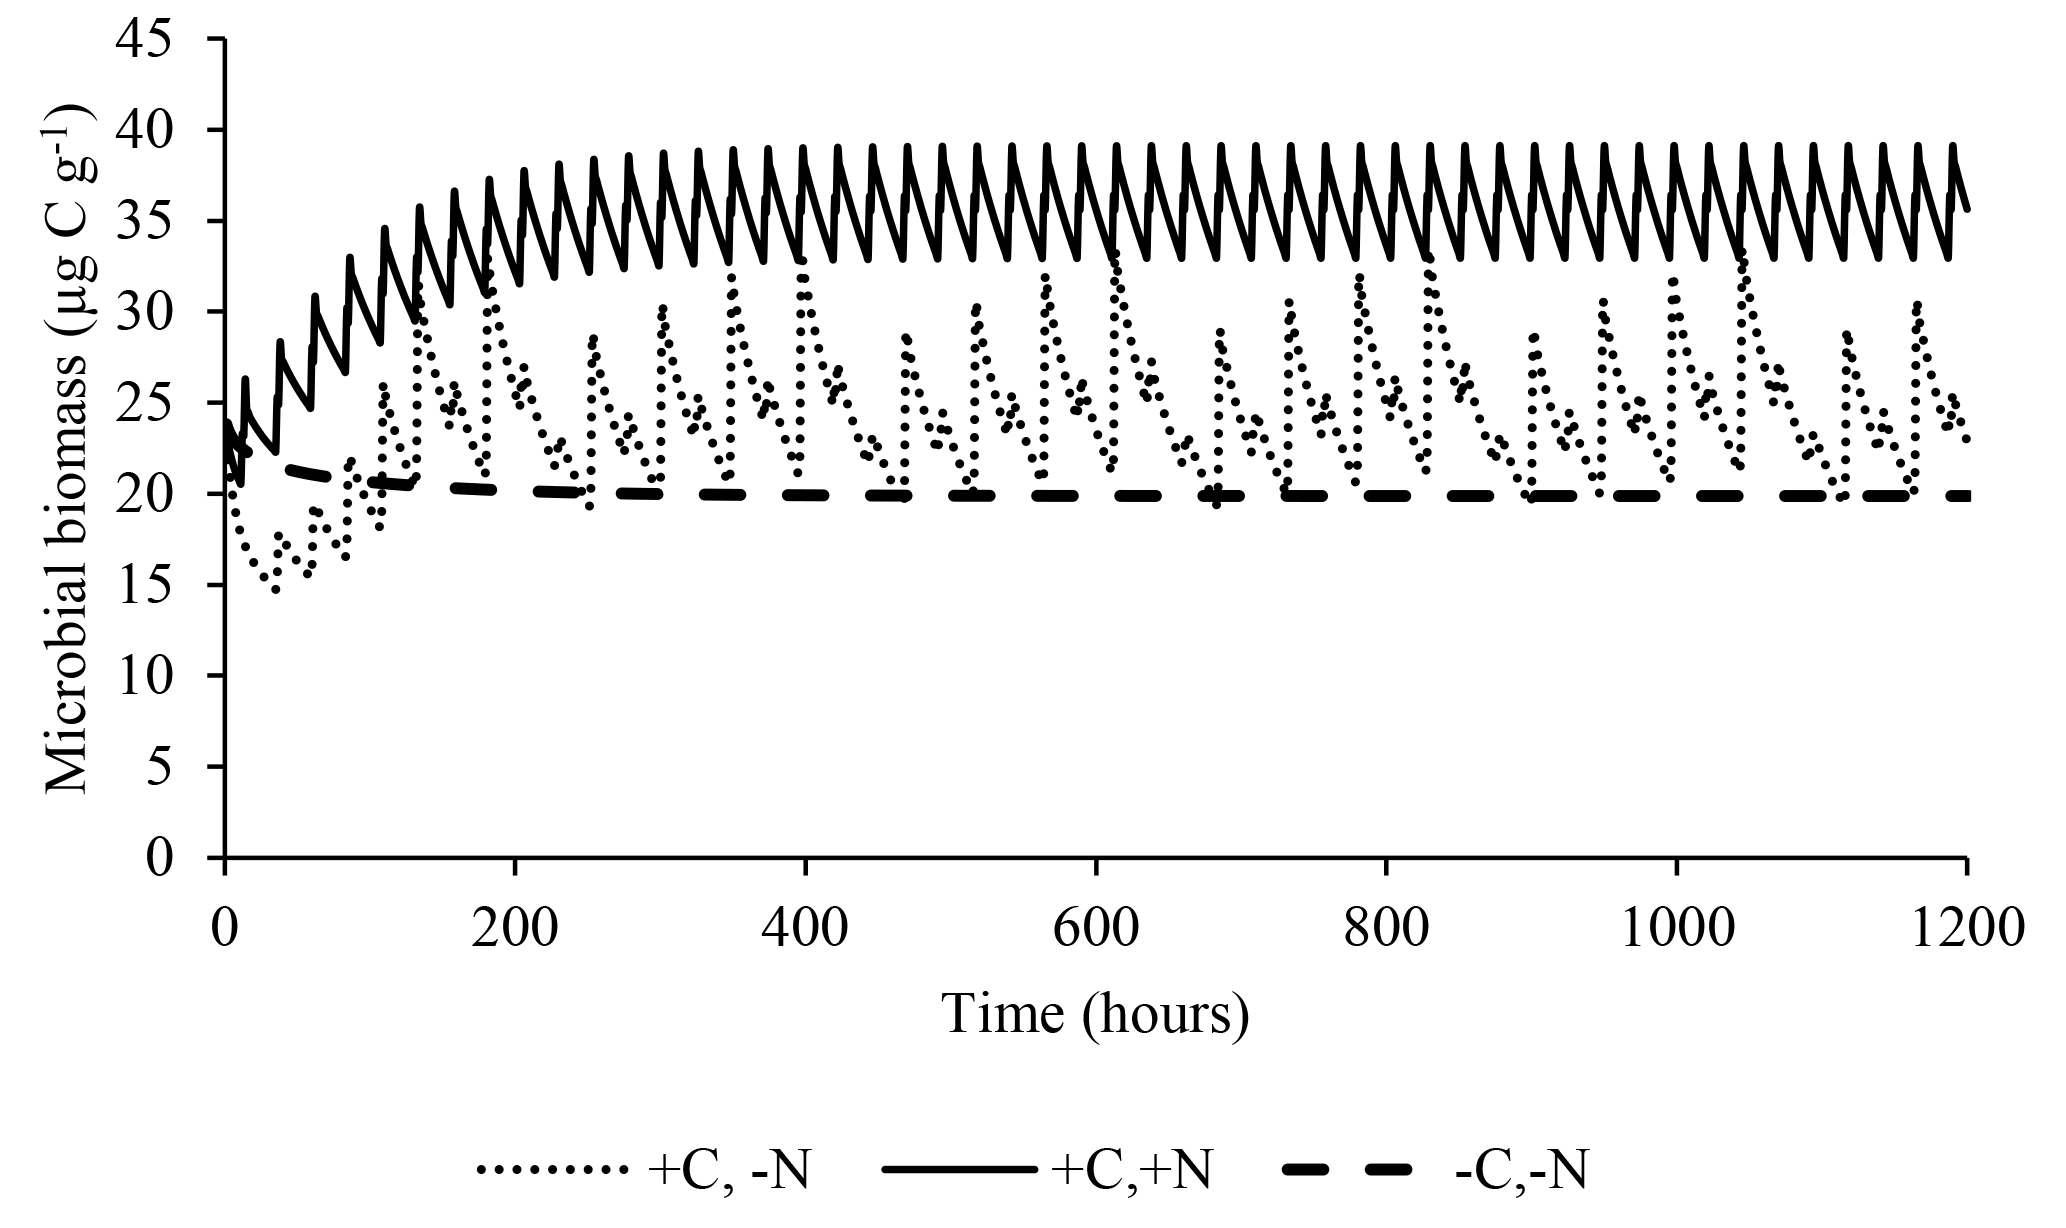
Figure 5Predicted effect of daily pulses of substrates containing water, water+C, or (as occurred in Drake et al., 2013) on microbial biomass during 50 days of treatment.
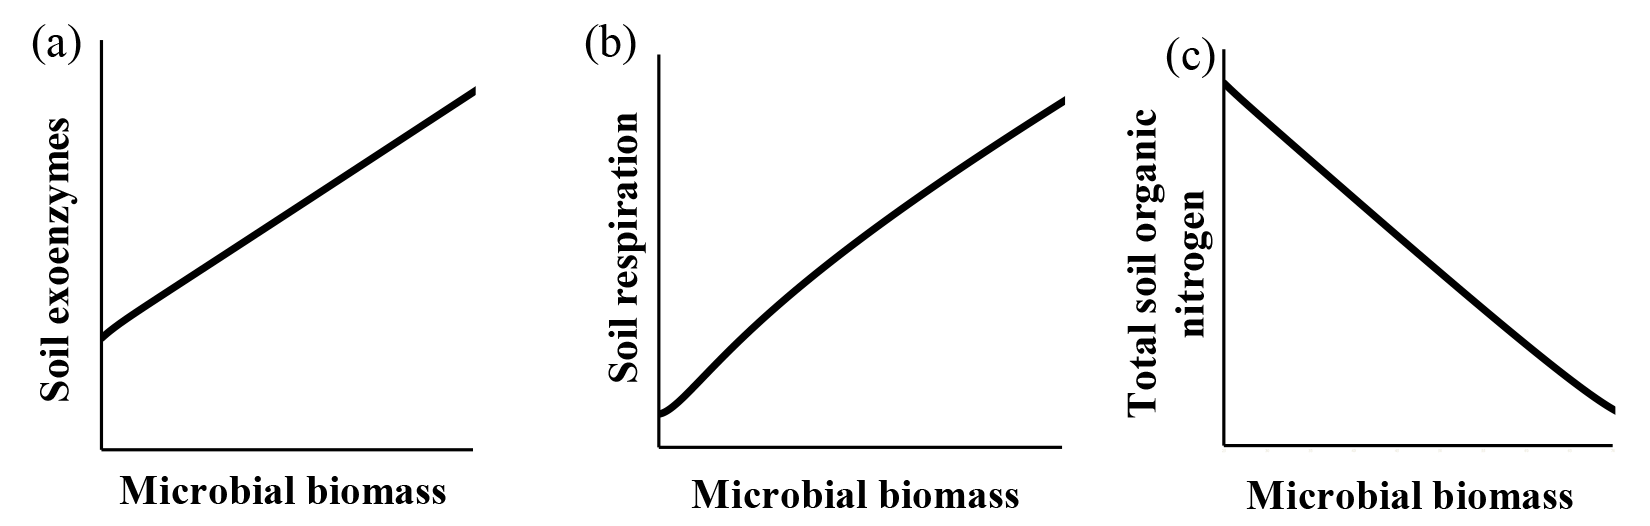
Figure 6General trends predicted by the ForPRAN model of (a) soil exoenzymes, (b) soil respiration, and (c) total soil organic N as a function of microbial biomass under conditions of increasing availability of C and N.
Table 1Values of input variables used in the model in relation to estimates of fine-root length, rhizosphere volume, and C rhizodeposition.
* Sensitivity index.
3.2 Sensitivity analysis
3.2.1 Modeling fine-root growth and rhizodeposition
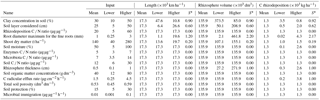
The length of fine roots is of high importance for rhizosphere processes because it partially defines the volume of the rhizosphere, and root length is an output of the model, not an input. Hence, for a given amount of C allocation to fine roots and an assumed constant carbon concentration in roots, an increase in the upper limit of root diameter classes considered as fine roots leads to a commensurate increase in root length, and it is one of the parameters to which the model is most sensitive (Table 1). Comparatively, model outputs were less sensitive to soil clay concentrations, layer depth, and shoot mass (Table 1). The volume of the rhizosphere had a similar sensitivity to the root diameter, and the thickness of the rhizosphere was the second variable that most influenced total volume (Table 1).
For a given root system, the larger the diameter considered to have a rhizosphere effect in the range 0–3 mm, the greater the estimated total root length and the larger the rhizosphere volume. On the other hand, when clay concentration was varied, an inverse relationship was observed with root length. For soils with lower clay concentrations, the model estimated higher values of fine-root length and, consequently, rhizosphere volume, and vice versa (Table 1). According to Reis et al. (1985), E. grandis sites in soils of poorer quality (chemical and water characteristics) tend to present higher investment in roots compared to those of better quality, which explains the lower shoot-to-fine-root ratio at sites with higher clay concentration (soils which have greater capacity to retain water and nutrients). In the case of the input variable thickness of the soil layer within a given soil profile, there is a direct relation such that increasing soil layer thickness also increases the total length of fine roots and the volume of the rhizosphere. In such a case though, there would be less soil depth (and rhizosphere volume) remaining in the rest of the profile. Finally, when shoot mass was varied, there was also a direct relation with root length and rhizosphere volume. Although these qualitative changes to rhizosphere volume in the sensitivity analysis were therefore logical, this analysis provides an indication of the relative quantitative importance of each of the inputs analyzed.
Root length in the base condition was 17 308 km ha−1, for a stand with 140 t ha−1 of aboveground biomass, soil with 30 % clay, soil depth of 0–25 cm, and roots up to 1 mm in diameter (Table 1). Minimum root length observed in the sensitivity analysis was associated with a root diameter of 0.25 mm (1069 km ha−1), and maximum length occurred with clay of 10 % (47 555 km ha−1). Mello et al. (1998) found values ranging from 40 880 to 497 844 km ha−1 for the 0–30 cm soil depth, which varied with genetic material and the type of propagation. In the case of rhizosphere volume, for our base condition of a rhizosphere thickness of 0.5 mm, the volume of soil was 135 937.5 dm3, which was approximately 5.4 % of total soil volume. Similarly, the lowest value of rhizosphere volume occurred when root diameter was less than 0.25 mm (<1 % of soil volume). The highest value observed was at the upper limit of the diameter for fine roots (3 mm), with a value of 461 767 dm3 (18.5 % of soil volume).
Table 2Values of the input variables used in the model in relation to estimates of fine-root length, rhizosphere volume, and C rhizodeposition.
a Sensitivity index. b ΔN = (Inorganic-N Vrhizo) – (N rhizodeposited Vrhizodeposition), in
which the variables mean the following: inorganic nitrogen concentration
(Inorganic-N);
rhizosphere volume (Vrhizo); nitrogen
concentration in the rhizosphere (Nrhizodeposited); and rhizodeposition
volume (Vrhizodepositions). c When in the presence of
negative
values (N balance), we sum the module of the negative
value (y) plus in the lowest output () and in the higher
output (z) (), being the equation represented
in the following way: .
The value of the rhizosphere soil volume simulated by ForPRAN does not deviate from the estimates of Finzi et al. (2015), according to which the volume occupied by the rhizosphere of temperate forests is between 5 % and 25 % of the total soil volume. The volume of rhizosphere soil is determined by root length and rhizosphere thickness (Finzi et al., 2015). As root length here was based on field measurements (Mello et al., 1998; Neves, 2000; Leles et al., 2001; Teixeira et al., 2002; Gatto et al., 2003; Maquere, 2008), greater remaining uncertainty about the volume of the rhizosphere would be related to its thickness. This, in turn, depends on the amount and nature of rhizosphere deposits and on the physical, chemical, and biological properties of the soil that limit the distribution of those deposits beyond the root surface (Finzi et al., 2015). Default rhizosphere thickness in ForPRAN was 5 mm, which is somewhat conservative as literature values are 0.2–1 mm (Jones, 1998), 2–12 mm (Sauer et al., 2006), and up to 20 mm (Barber, 1995). A better understanding of this aspect might be important for future improvements in ForPRAN, whereby C transport models from the root surface towards bulk soil could be based on soil properties.
During the release of rhizodeposits, using the model of Personeni et al. (2007), it was noted that there were certain simplifications of the process. After 8 h of C and N rhizodeposition, it was assumed that the model reaches maximum values of 7.5 and 0.75 µg cm−3 h−1, respectively, with no change thereafter. In nature, this value can be altered as a function of the source–sink relations in the plant, root development (Finzi et al., 2015), and of physical and chemical soil properties such as P availability and the presence of Al (Farrar et al., 2003).
In order of decreasing importance, the variables that most influenced the total amount of C rhizodeposition were root diameter > rhizosphere thickness = root efflux rate > clay concentration > soil layer thickness considered > aboveground biomass (Table 2). After 10 000 h for a stand of 140 t ha−1 of shoot (70.42 t ha−1 of C), about 1274.4 kg ha−1 of C in rhizodeposits was estimated to have been produced, which was 1.8 % of shoot net primary production. The minimum value of rhizodeposition observed in the sensitivity analysis occurred when roots with a diameter equal to or less than 0.25 mm were assumed (19.7 kg ha−1 of C or 0.02 % of the net primary productivity). The highest value observed was when all roots with a diameter up to 3 mm (4329 kg ha−1 of C or 6.15 % of the net primary productivity of the shoot) were considered, which demonstrates the influence of root length on the calculation of the rhizodeposition.
As far as a typical Eucalyptus plantation is concerned, the only approximation we have at an ecosystem scale is the study of Aoki et al. (2012), who studied soils with low levels of P supporting several species of the Myrtaceae family to which Eucalyptus belongs. The estimates above are in general agreement with Aoki et al. (2012), who showed that species of Myrtaceae, represented by the genera Syzygium and Tristaniopsis had exuded large amounts of C in the form of organic acids. The above authors attributed this remarkable exudation capacity to a high specific root surface, a high number of root apices, and also to the ability of the plant to upregulate exudation in soils with low P availability.
3.2.2 Modeling C and N cycling in rhizosphere soil
According to our model, the variables that most influenced the population dynamics of rhizosphere microbiota were the following (in order of decreasing importance): soil porosity > soil temperature > soil organic matter > radicular efflux rate (Table 2). The maximum observed value was 142 µg g−1, when soil temperature was 35 ∘C. The main effect of temperature was on exoenzymes kinetics, as described by the KappaD variable in Fig. 7, which is based on Brock and Madigan (1991). Enzymatic activity in ForPRAN is maximized between 25 and 40 ∘C (Fig. 7).
We used data presented by Silva et al. (2011) for Oxisol soils to establish a relationship between porosity and ideal conditions for microbial growth (Fig. 8). This empirical relationship led us to conclude that porosity values close to 0.53 cm3 cm−3 were most favorable for the survival of microorganisms (using a soil particle density of 2.60 g cm−3). The effect of soil moisture on microbial biomass was based on the work of Sato et al. (2000), where more pronounced limitations on microbial biomass were observed under soil moisture conditions below 40 % of field capacity (Fig. 9).
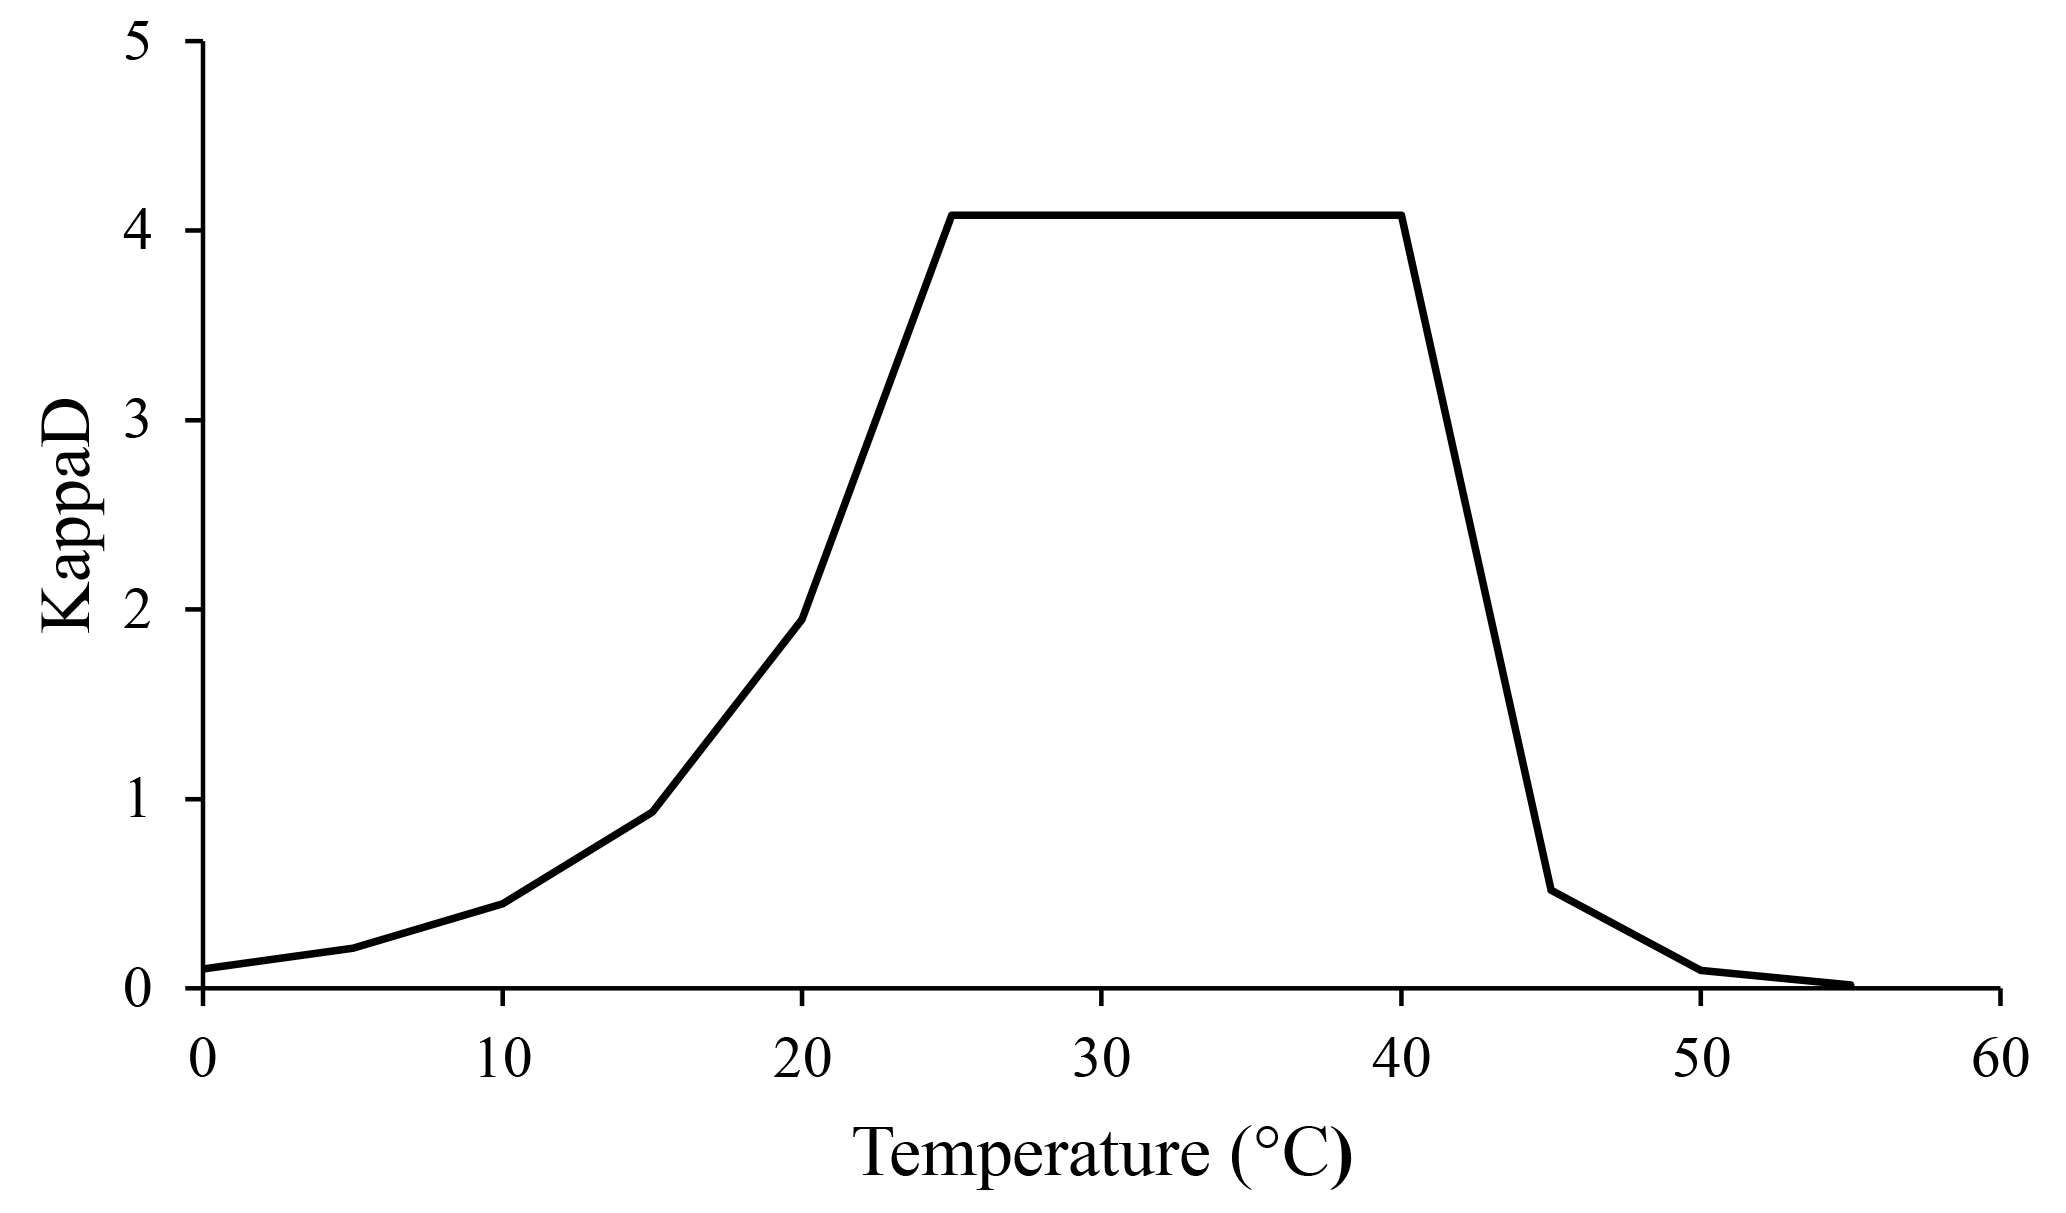
Figure 7Temperature dependence of the kinetic enzyme variable KappaD used in ForPRAN model simulations (based on theoretical representation of Brock and Madigan, 1991).

Figure 8Soil porosity dependence of the modifier of microbial death rate due to limitations of physical conditions (Kpt) used in ForPRAN model simulations (source: the equation used in the Kpt modifier was parameterized with data presented in Silva et al., 2011).

Figure 9Soil moisture dependence of the modifier of microbial death rate due to water limitation (Ku) used in ForPRAN model simulations (source: the equation used in the Ku modifier was parameterized with data presented in Sato et al., 2000).
Increasing the supply of C and N in the rhizosphere led to the growth of the rhizosphere microbial population in ForPRAN simulations. The model simulated values with a mean of 53 µg g−1 (or µg cm−3 for 1 g cm−3 soil bulk density), which corresponds to the values presented in the second quartile of 206 field observations of Eucalyptus plantations of southeastern Brazil (Fig. 10). When temperature and the amount of rhizodeposited C was reduced, the population decreased (Table 2) and became more similar to the populations represented by the first and second quartiles of Fig. 10. Silva et al. (2010) reported mean values of 358 µg of microbial biomass per gram of soil for the 0–20 cm depth of a soil planted with Eucalyptus in Minas Gerais State, Brazil, which was higher than the maximum values observed under the sensitivity analysis conditions (153 µg g−1). Gama-Rodrigues et al. (2008) observed microbial biomass (C) of 80.6 µg g−1 (Aracruz/Espirito Santo State), 310.2 µg g−1 (Guanhães/Minas Gerais State), 95.3 µg g−1 (Luís Antônio/São Paulo State), and 62.4 µg g−1 (Lençóis Paulista/São Paulo State). Therefore, values of microbial biomass vary significantly with forest site, some of the complexity of which may be represented in the ForPRAN model.
Figure 10Box plot of 206 observations of microbial biomass of soils under Eucalyptus growing in southeast Brazil (0–10 cm depth) (Marcos Rogério Tótola, personal communication, 2016).
As a result of biological activity in the rhizosphere, average values of mineralized N (accumulated for the 10 000 h period) of about 87.8 kg ha−1 were simulated (Table 2) and there was a maximum of 300 kg ha−1 summing the contribution referring to mineralization influenced by roots with diameters between 0 and 3 mm. A minimum value of 1.4 kg occurred with a root diameter up to 0.25 mm. The variables that most influenced this process were (in descending order of importance) the following: root diameter > rhizosphere thickness > soil temperature > clay concentration (Table 2). Finzi et al. (2015) estimated that N mineralization in rhizosphere soil of temperate forests can represent one-quarter of all mineralized N in the ecosystem. Our work supports the hypothesis that rhizosphere processes are quantitatively important, which might also explain why in some soils supporting Eucalyptus plantations there is a trend towards a decrease in organic matter content (Pulito et al., 2015). However, the mobilization of C and N through the rhizosphere can be counterbalanced by other processes related to the cycle of these nutrients in the forest soil, leading to conditions of greater stability of SOM stocks in well-managed forests and in better-quality sites. In complex systems, changes in factors could act individually or in combination, e.g., soil or climatic factors, and result in changes in soil organic matter. Such changes could potentially be simulated through further improvements to the ForPRAN model, e.g., by combining it with a more complex plant production and soil model such as APSIM (Holzworth et al., 2014).
The balance of inorganic N in the system expresses potential N gain by the plant as a result of interaction with soil microbes (Table 2). The actual gain of N by the plant (assimilated) is lower than the mineralized values presented previously because the plant has to release some N to induce the priming effect. The balance for standard conditions for a 10 000 h simulation was 24.15 kg N ha−1, and the maximum value was reached in the sensitivity analysis at a temperature of 35 ∘C (228.15 kg ha−1) (Table 2). The minimum value observed was when rhizodeposition occurred at a C ∕ N ratio of 5, which led to a negative balance of about −26 kg ha−1 for the Eucalyptus plant (Table 2). In this case, the plant released more N than it took up as a result of the rhizosphere priming effect. Input variables that most influenced N balance were (in descending order of importance) soil temperature > soil C ∕ N ratio > soil protection capacity > rhizodeposition C ∕ N ratio.
3.2.3 Rhizosphere priming in a typical Eucalyptus plantation
ForPRAN considers that only a proportion (1-Kpr) of the dissolved organic carbon (DOC) and dissolved organic nitrogen (DON) compartments can be absorbed by microbes, so that the product of soil protection capacity (Kpr) and C and N in solution (DOC and DON) are protected by soil from microbial attack returning to the compartment C and N of the soil (SOC and SON) (Supplement: Eqs. S41–S44). Considering this model aspect, a typical Eucalyptus plantation was simulated for scenarios with soils of two C protection capacities (Kpr = 15 or 30 %) (Table 3), and otherwise standard conditions of the sensitivity analysis were assumed (Table 1 and 2): a rhizosphere thickness of 3 mm (Hurtarte, 2017) and root of 0 to 3 mm in diameter. With high soil C and N protection, there was a low or negative potential for rhizosphere N supply (or N gain to the plant) (Table 3). Under these conditions, Eucalyptus plants would be expected to be more responsive to N fertilization. However, under conditions of lower C and N protection (15 %) and 4 % SOM, the rhizosphere supply was estimated to contribute significantly to the N balance. For these conditions, which are speculative, the process had a positive balance for the plant equal to 24.6 % of N demand by the ecosystem (root + shoot + litter) or 38.4 % of tree (root + shoot) demand, which also assumed losses of 40 % due to leaching, denitrification, and volatilization. This is a Eucalyptus plantation situation in which it is probably important to consider rhizosphere priming when simulating plant production. Likewise, the model should be considered for adaptation to other forestry and agricultural production models where the inclusion of such processes offers the potential for improved model performance.
Table 3Simulation of N balance (kg N ha−1) due to the priming effect in Eucalyptus plantations with two levels of soil protection (Kpr of 15 or 30) of C and N.a
a The fractions (1-Kpr) of the DOC and DON
compartments are absorbed by micro-
bes, and the fractions
(Kpr DOC and Kpr DON) remain protected by soil from micro-
bial attack. These last fractions return to the soil C and N compartments
(SOC and
SON). b Based on the equation of
nutritional efficiency coefficient (CUB) proposed
by
Valadares (2015) and plant biomass.
This result supports the understanding of how Eucalyptus trees are able to take up high amounts of N, even under conditions of reduced nitrogen fertilization (Melo et al., 2016; Pulito et al., 2015; Smethurst et al., 2015). This effect may be related to the observation that many woody species have a higher positive priming effect compared with grasses and crops (Huo et al., 2017). Eucalyptus regnans forests can take up adequate amounts of N even in nutrient-poor soils (Dijkstra et al., 2017). According to these authors, the roots of these trees stimulate soil microbiological activity, respiration, and N mineralization (Dijkstra et al., 2017). In greenhouse experiments, the growth of seedlings of a hybrid clone of E. grandis × E. urophylla on an Oxisol were observed to reduce C stocks associated with mineral fractions in the rhizosphere, especially when the plants were under nutritional stress by N (Hurtarte, 2017).
This research is the first to demonstrate how a previously described model operating at the root scale for calculating C–N dynamics in rhizosphere soil could be linked with an ecosystem-scale model. In this case, a commonly used forest plantation production model was used to predict the effects of rhizosphere priming on N supply for wood production. Simulation of a Eucalyptus plantation suggested that rhizosphere processes could be an important supplement to N supplied from bulk soil. This result therefore provides a template for including rhizosphere C–N dynamics in other plant production models where that might be needed, e.g., in the APSIM or DSSAT suite of crop models (Holzworth et al., 2014) or models of native ecosystems.
All the used datasets and previous model equations used in the ForPRAN model parametrization and evaluation are present in published articles, dissertations, and thesis appropriately referred to through the text and identified in the reference list.
The supplement related to this article is available online at: https://doi.org/10.5194/bg-15-4943-2018-supplement.
RVV, JCLN, and MDC conceived the theoretical and mathematical model and the working hypothesis. RVV, PJS, LAP, GLJ, RBC, and IRS worked on the model improvements. RVV, JCLN, MDC, and PJS worked on the collection of literature data, data processing, and article writing.
The authors declare that they have no conflict of interest.
The authors thank the Conselho Nacional de Desenvolvimento Científico e
Tecnológico (CNPq) and the Coordenação de Aperfeiçoamento de
Pessoal de Nível Superior (Capes) for granting study and research
scholarships. We thank the Universidade Federal de Viçosa (UFV) and the
Commonwealth Scientific and Industrial Research Organisation (CSIRO) for
allowing their researchers to collaborate on this project. We are also
grateful to Marcos Rogério Tótola (UFV), Samuel Vasconcelos Valadares
(UFV), and Fernando Palha Leite (Celulose Nipo-Brasileira S/A, CENIBRA
company) for assisting with datasets, literature, and ideas. This research
was also conducted as part of the Trees for Food Security project
(http://www.worldagroforestry.org/project/trees-food-security-2-developing-integrated-options-and-accelerating-scaling-agroforestry,
last access: 18 August 2018). We are also grateful for comments on earlier
versions of the paper by Keryn Paul (CSIRO), Stephen Roxburgh (CSIRO),
Jens-Arne Subke (associate editor, Biogeosciences), Alam Khairul (reviewer),
and anonymous reviewers and for the support of the journal editorial
team.
Edited by: Jens-Arne
Subke
Reviewed by: Alam Md Khairul and three anonymous
referees
Abramoff, R. Z., Davidson, E. A., and Finzi, A. C.: A parsimonious modular approach to building a mechanistic belowground carbon and nitrogen model, J. Geophys. Res.-Biogeo., 122, 2418–2434, https://doi.org/10.1002/2017JG003796, 2017.
Allison, S. D., Wallenstein, M. D., and Bradford, M. A.: Soil-carbon response to warming dependent on microbial physiology, Nat. Geosci., 3, 336–340, https://doi.org/10.1038/ngeo846, 2010.
Almeida, A. C. and Sands, P. J.: Improving the ability of 3-PG to model the water balance of forest plantations in contrasting environments, Ecohydrology, 9, 610–630, https://doi.org/10.1002/eco.1661, 2016.
Aoki, M., Fujii, K., and Kitayama, K.: Environmental control of root exudation of low-molecular weight organic acids in tropical rainforests, Ecosystems, 15, 1194–1203, https://doi.org/10.1007/s10021-012-9575-6, 2012.
Barber, S. A.: Soil Nutrient Bioavailability: A Mechanistic Approach, 2nd Edn., p. 414, Wiley, New York, 1995.
Barros, N. F. and Novais, R. F.: Relação solo-eucalipto, 1st Edn., Folha de Viçosa, Viçosa, 1990.
Brock, T. D. and Madigan, M. T.: Biology of microorganisms, 6th Edn., Englewood Cliffs, New Jersey, 1991.
Davidson, E. A., Savage, K. E., and Finzi, A. C.: A big-microsite framework for soil carbon modeling, Glob. Change Biol., 20, 3610–3620, https://doi.org/10.1111/gcb.12718, 2014.
De Neergaarda, A. and Magid, J.: Influence of the rhizosphere on microbial biomass and recently formed organic matter, Eur. J. Soil Sci., 52, 377–384, https://doi.org/10.1046/j.1365-2389.2001.00393.x, 2001.
Derrien, D., Plain, C., Courty, P., Gelhaye, L., Moerdijk-Poortvliet, T. C. W., Thomas, F., Versini, A., and Zeller, B.: Does the addition of labile substrate destabilise old soil organic matter?, Soil Biol. Biochem., 76, 149–160, https://doi.org/10.1016/j.soilbio.2014.04.030, 2014.
Dijkstra, F. A., Jenkins, M., de Courcelles, V. de R., Keitel, C., Barbour, M. M., Kayler, Z. E., and Adams, M. A.: Enhanced decomposition and nitrogen mineralization sustain rapid growth of Eucalyptus regnans after wildfire, J. Ecol., 105, 229–236, https://doi.org/10.1111/1365-2745.12663, 2017.
Drake, J. E., Darby, B. A., Giasson, M.-A., Kramer, M. A., Phillips, R. P., and Finzi, A. C.: Stoichiometry constrains microbial response to root exudation-insights from a model and a field experiment in a temperate forest, Biogeosciences, 10, 821–838, https://doi.org/10.5194/bg-10-821-2013, 2013.
Farrar, J., Hawes, M., Jones, D., and Lindow, S.: How roots control the flux of carbon to the rhizosphere, Ecology, 84, 827–837, https://doi.org/10.1890/0012-9658(2003)084[0827:HRCTFO]2.0.CO;2, 2003.
Finzi, A. C., Abramoff, R. Z., Spiller, K. S., Brzostek, E. R., Darby, B. A., Kramer, M. A., and Philips, R. P.: Rhizosphere processes are quantitatively important components of terrestrial carbon and nutrient cycles, Glob. Change Biol., 21, 2082–2094, https://doi.org/10.1111/gcb.12816, 2015.
Gama-Rodrigues, E. F. da, Barros, N. F., Viana, A. P., and Santos, G. de A.: Alterações na biomassa e na atividade microbiana da serrapilheira e do solo, em decorrência da substituição de cobertura florestal nativa por plantações de eucalipto, em diferentes sítios da região sudeste do Brasil, Rev. Bras. Cienc. Solo, 32, 1489–1499, https://doi.org/10.1590/S0100-06832008000400013, 2008.
Gatto, A., de Barros, N. F., de Novais, R. F., da Costa, L. M., and Neves, J. C. de L.: Efeito do método de preparo do solo, em área de reforma, nas suas características, na composição mineral e na produtividade de plantações de Eucalyptus grandis, Rev. Árvore, 27, 635–646, https://doi.org/10.1590/S0100-67622003000500006, 2003.
Grayston, S. J., Vaughan, D., and Jones, D.: Rhizosphere carbon flow in trees, in: comparison with annual plants: the importance of root exudation and its impact on microbial activity and nutrient availability, Appl. Soil Ecol., 5, 29–56, https://doi.org/10.1016/S0929-1393(96)00126-6, 1997.
Holzworth, D. P., Huth, N. I., Voil, P. G. de, et al.: APSIM – Evolution towards a new generation of agricultural systems simulation, Environ. Modell. Softw., 62, 327–350, https://doi.org/10.1016/j.envsoft.2014.07.009, 2014.
Huo, C., Luo, Y., and Cheng, W.: Rhizosphere priming effect: A meta-analysis, Soil Biol. Biochem., 111, 78–84, https://doi.org/10.1016/j.soilbio.2017.04.003, 2017.
Hurtarte, L. C.: Carbon mineralization in the rhizosphere of Eucalyptus spp. depends on its nitrogen status, Federal University of Viçosa, Viçosa, 2017.
Jesus, G. L. de, de Barros, N. F., da Silva, I. R. , Neves, J. C. L., Heriques, E. P., Lima, V. C., Fernandes, L. V., and Soares, E. M. B.: Doses e fontes de nitrogênio na produtividade do eucalipto e nas frações da matéria orgânica em solo da região do cerrado de Minas Gerais, Rev. Bras. Cienc. Solo, 36, 201–214, https://doi.org/10.1590/S0100-06832012000100021, 2012.
Jones, D. L.: Organic acids in the rhizosphere – A critical review, Plant Soil, 205, 25–44, https://doi.org/10.1023/A:1004356007312, 1998.
Landsberg, J. J. and Waring, R. H.: A generalised model of forest productivity using simplified concepts of radiation-use efficiency, carbon balance and partitioning, Forest Ecol. Manage., 95, 209–228, https://doi.org/10.1016/S0378-1127(97)00026-1, 1997.
Leles, P. S. dos S., Reis, G. G., Reis, M. das G. F., and Morais, E. J.: Crescimento, produção e alocação de matéria seca de Eucalyptus camaldulensis e E. pellita sob diferentes espaçamentos na região de cerrado, MG, Sci. For., 77–87, available at: http://www.ipef.br/publicacoes/scientia/nr59/cap06.pdf (last access: 18 August 2018), 2001.
Maquere, V.: Dynamics of mineral elements under a fast-growing Eucalyptus plantation in Brazil, Implications for soil to cite this version, AgroParisTech, available at: https://pastel.archives-ouvertes.fr/pastel-00610330/document (last access: 18 August 2018), 2008.
Mello, S. L. de M., Gonçalves, J. L. de M., and Oliveira, L. E. G.: Característica do sistema radicular em povoamentos de eucaliptos propagados por sementes e estacas, Sci. For., 54, 17–28, available at: http://www.ipef.br/publicacoes/scientia/nr54/cap02.pdf> (last access: 18 August 2018), 1998.
Melo, E. A. S. C. de, Gonçalves, J. L. de M., Rocha, J. H. T., Hakamada, R. E., Bazani, J. H., Wenzel, A. V. A., Arthur Jr., J. C., Borges, J. S., Malheiros, R., Lemos , C. C. Z. de, Ferreira, E. V. de O., and Ferraz, A. de V.: Responses of clonal eucalypt plantations to N, P and K fertilizer application in different edaphoclimatic conditions, Forests, 7, 1–15, https://doi.org/10.3390/f7010002, 2016.
Moriasi, D. N., Arnold, J. G., Van Liew, M. W., and Bingner, R. L.: Model evaluation guidelines for systematic quantification of accuracy in watershed simulations, T. ASABE, 50, 885–900, https://doi.org/10.13031/2013.23153, 2007.
Neves, J. C. L.: Produção e partição de biomassa, aspectos nutricionais e hídricos em plantios clonais de eucalipto na região litorânea do Espírito Santo, available at: http://www.ipef.br/servicos/teses/arquivos/neves,jcl.pdf (last access: 18 August 2018) 2000.
Personeni, E., Nguyen, C., Marchal, P., and Pagès, L.: Experimental evaluation of an efflux-influx model of C exudation by individual apical root segments, J. Exp. Bot., 58, 2091–2099, https://doi.org/10.1093/jxb/erm065, 2007.
Pulito, A. P., Gonçalves, J. L. de M., Smethurst, P. J., Arthur Jr., J. C., Alvares, C. A., Tertulino Rocha, J. H., Hübner, A., Moraes, L. F. de, Miranda, A. C., Kamogawa, M. Y., Gava, J. L., Chaves, R., and Silva, C. R.: Available nitrogen and responses to nitrogen fertilizer in brazilian eucalypt plantations on soils of contrasting texture, Forests, 6, 973–991, https://doi.org/10.3390/f6040973, 2015.
Reis, M. das G. F., Barros, N. F., and Kimmins, J. P.: Acúmulo de biomassa em uma seqüência de idade de Eucalyptus grandis plantado no cerrado em duas áreas com diferentes produtividades, Rev. Árvore, 9, 149–162, 1985.
Sato, A., Tsuyuzaki, T., and Seto, M.: Effect of soil agitation, temperature or moisture on microbial biomass carbon of a forest and an arable soil, Microb. Environ., 15, 23–30, https://doi.org/10.1264/jsme2.2000.23, 2000.
Sauer, D., Kuzyakov, Y., and Stahr, K.: Spatial distribution of root exudates of five plant species as assessed by 14C labeling, J. Plant Nutr. Soil Sc., 169, 360–362, https://doi.org/10.1002/jpln.200621974, 2006.
Schimel, J. P. and Weintraub, M. N.: The implications of exoenzyme activity on microbial carbon and nitrogen limitation in soil: A theoretical model, Soil Biol. Biochem., 35, 549–563, https://doi.org/10.1016/S0038-0717(03)00015-4, 2003.
Silva, R. R., Silva, M. L. L. N., Cardoso, E. L., Moreira, F. M. S., Curi, N., and Alovisi, A. M. T.: Biomassa e atividade microbiana em solo sob diferentes sistemas de manejo na região fisiográfica de campos das vertentes – MG, Rev. Bras. Cienc. Solo, 34, 1585–1592, available at: http://www.redalyc.org/articulo.oa?id=180215650011 (last access: 18 August 2018), 2010.
Silva, S. R., da Silva, I. R., de Barros, N. F., and de Sá Mendonça, E.: Effect of compaction on microbial activity and carbon and nitrogen transformations in two oxisols with different mineralogy, Rev. Bras. Cienc. Solo, 35, 1141–1149, https://doi.org/10.1590/S0100-06832011000400007, 2011.
Smethurst, P. J. and Nambiar, E. K. S.: An appraisal of the in situ soil core technique for measuring nitrogen uptake by a young Pinus radiata plantation, Soil Biol. Biochem., 7, 939–942, https://doi.org/10.1016/0038-0717(89)90084-9, 1989.
Smethurst, P. J., Gonçalves, J. L. de M., Pulito, A. P., Gomes, S. Paul, K., and Alvares, C. A.: Appraisal of the snap model for predicting nitrogen mineralization in tropical soils under Eucalyptus, Rev. Bras. Cienc. Solo, 39, 523–532, https://doi.org/10.1590/01000683rbcs20140379, 2015.
Teixeira, P. C., Novais, R. F., Barros, N. F., Neves, J. C. L., and Teixeira, J. L.: Eucalyptus urophylla root growth, stem sprouting and nutrient supply from the roots and soil, Forest Ecol. Manag., 160, 263–271, https://doi.org/10.1016/S0378-1127(01)00469-8, 2002.
Torbert, H. A. and Wood, C. W.: Efffects of soil compactation and water-filled pore space on soil microbial activity and N losses, Commun. Soil Sci. Plan., 23, 1321–1331, https://doi.org/10.1080/00103629209368668, 1992.
Valadares, S. V.: Modelagem da aquisição de fósforo e da eficiência nutricional de eucalipto, Universidade Federal de Viçosa, Viçosa, available at: http://www.locus.ufv.br/handle/123456789/10340 (last access: 18 August 2018), 2015.