the Creative Commons Attribution 4.0 License.
the Creative Commons Attribution 4.0 License.
 | 17 Aug 2018
Experimental assessment of the sensitivity of an estuarine phytoplankton fall bloom to acidification and warming
Maurice Levasseur
Michael Scarratt
Marie-Amélie Blais
Alfonso Mucci
Gustavo Ferreyra
Michel Starr
Michel Gosselin
Jean-Éric Tremblay
Martine Lizotte
We investigated the combined effect of ocean acidification and warming on the dynamics of the phytoplankton fall bloom in the Lower St. Lawrence Estuary (LSLE), Canada. Twelve 2600 L mesocosms were set to initially cover a wide range of pHT (pH on the total proton scale) from 8.0 to 7.2 corresponding to a range of pCO2 from 440 to 2900 µatm, and two temperatures (in situ and +5 ∘C). The 13-day experiment captured the development and decline of a nanophytoplankton bloom dominated by the chain-forming diatom Skeletonema costatum. During the development phase of the bloom, increasing pCO2 influenced neither the magnitude nor the net growth rate of the nanophytoplankton bloom, whereas increasing the temperature by 5 ∘C stimulated the chlorophyll a (Chl a) growth rate and maximal particulate primary production (PP) by 76 % and 63 %, respectively. During the declining phase of the bloom, warming accelerated the loss of diatom cells, paralleled by a gradual decrease in the abundance of photosynthetic picoeukaryotes and a bloom of picocyanobacteria. Increasing pCO2 and warming did not influence the abundance of picoeukaryotes, while picocyanobacteria abundance was reduced by the increase in pCO2 when combined with warming in the latter phase of the experiment. Over the full duration of the experiment, the time-integrated net primary production was not significantly affected by the pCO2 treatments or warming. Overall, our results suggest that warming, rather than acidification, is more likely to alter phytoplankton autumnal bloom development in the LSLE in the decades to come. Future studies examining a broader gradient of temperatures should be conducted over a larger seasonal window in order to better constrain the potential effect of warming on the development of blooms in the LSLE and its impact on the fate of primary production.
- Article
(1446 KB) - Companion paper
- BibTeX
- EndNote


Anthropogenic emissions have increased atmospheric carbon dioxide (CO2) concentrations from their pre-industrial value of 280 ppm to 412 ppm in 2017, and concentrations of 850–1370 ppm are expected by the end of the century under business-as-usual scenario RCP 8.5 (IPCC, 2013). The global ocean has already absorbed about 28 % of these anthropogenic CO2 emissions (Le Quéré et al., 2015), leading to a global pH decrease of 0.11 units (Gattuso et al., 2015), a phenomenon known as ocean acidification (OA). The surface ocean pH is expected to decrease by an additional 0.3–0.4 units under the RCP 8.5 scenario by 2100, and as much as 0.8 units by 2300 (Caldeira and Wickett, 2005; Doney et al., 2009; Feely et al., 2009). The accumulation of anthropogenic CO2 in the atmosphere also results in an increase in the Earth's heat content that is primarily absorbed by the ocean (Wijffels et al., 2016), leading to an expected rise of sea surface temperatures of 3 to 5 ∘C by 2100 (IPCC, 2013). Whereas the effect of increasing atmospheric CO2 partial pressures (pCO2) on ocean chemistry is relatively well documented, the potential impacts of OA on marine organisms and how their response to OA will be modulated by the concurrent warming of the ocean surface waters are still the subject of much debate (Boyd and Hutchins, 2012; Gattuso et al., 2013).
Over the last decade, there has been increasing interest in the potential effects of OA on marine organisms (Kroeker et al., 2013). The first experiments were primarily conducted on single phytoplankton species (reviewed in Riebesell and Tortell, 2011), but subsequent mesocosm experiments highlighted the impact of OA on the structure and productivity of complex plankton assemblages (Riebesell et al., 2007, 2013). Due to their widely different initial and experimental conditions, these ecosystem-level experiments generated contrasting results (Schulz et al., 2017), but some general patterns nevertheless emerged. For example, diatoms generally benefit from higher pCO2 through stimulated photosynthesis and growth rates since the increase in CO2 concentrations compensates for the low affinity of RuBisCO towards CO2 (Giordano et al., 2005; Gao and Campbell, 2014). Although most phytoplankton species have developed carbon concentration mechanisms (CCMs) to compensate for the low affinity of RuBisCO towards CO2, CCM efficiencies differ between taxa, rendering predictions of the impact of a CO2 rise on the downregulation of CCM rather difficult (Raven et al., 2014). For example, some studies unexpectedly reported no significant or very modest stimulation of primary production under elevated CO2 concentrations (Engel et al., 2005; Eberlein et al., 2017). OA can ultimately affect the structure of phytoplankton assemblages. Small cells such as photosynthetic picoeukaryotes can benefit directly from an increase in pCO2 as CO2 can passively diffuse through their boundary layer (Beardall et al., 2014), and the smallest organisms within this group could benefit most from the increase (Brussaard et al., 2013). Accordingly, OA experiments have typically favoured smaller phytoplankton cells (Yoshimura et al., 2010; Brussaard et al., 2013; Morán et al., 2015), although the proliferation of larger cells has also been reported (Tortell et al., 2002). Hence, generic predictions of phytoplankton community responses to OA are challenging.
Few recent studies have investigated the combined effects of OA and warming on natural phytoplankton assemblages (Hare et al., 2007; Feng et al., 2009; Maugendre et al., 2015; Paul et al., 2015, 2016). Laboratory experiments have shown that OA and warming could together increase photosynthetic rates, but at the expense of species richness, the reduction of diversity predominantly imputable to warming (Tatters et al., 2013). Results of an experiment conducted with a natural planktonic community from the Mediterranean Sea showed no effect of a combined warming and decrease in pH on primary production, but higher picocyanobacteria abundances were observed in the warmer treatment (Maugendre et al., 2015). Shipboard microcosm incubations conducted in the northern South China Sea displayed higher phytoplankton biomass, daytime primary productivity, and dark community respiration under warmer conditions, but these positive responses were cancelled at low pH (Gao et al., 2017). In contrast, a mesocosm experiment carried out with a fall planktonic community from the western Baltic Sea led to a decrease in phytoplankton biomass under warming, but combined warming and increased pCO2 led to an increase in biomass (Sommer et al., 2015). Results from experiments where the impacts of pCO2 and temperature are investigated individually may be misleading as multiple stressors can interact antagonistically or synergistically, sometimes in a nonlinear, unpredictable fashion (Todgham and Stillman, 2013; Boyd et al., 2015; Riebesell and Gattuso, 2015; Gunderson et al., 2016).
The Lower St. Lawrence Estuary (LSLE) is a large (9350 km2) segment of the greater St. Lawrence Estuary (d'Anglejan, 1990). From June to September, the LSLE is characterized by a dynamic succession in the phytoplankton community, mostly driven by changes in light and nutrient availability through variations in the intensity of vertical mixing (Levasseur et al., 1984). The spring and fall blooms are mostly comprised of diatoms, with simultaneous nitrate and silicic acid exhaustion ultimately limiting primary production (Levasseur and Therriault, 1987; Roy et al., 1996). How OA and warming may affect these blooms and primary production has never been investigated in the LSLE. The OA problem is complex in estuarine and coastal waters where freshwater runoff, tidal mixing, and high biological activity contribute to variations in pCO2 and pH on different timescales (Duarte et al., 2013). The surface mixed-layer pCO2 in the LSLE varies spatially from 139 to 548 µatm and is strongly modulated by biological productivity (Dinauer and Mucci, 2017). Surface pHT has been shown to vary from 7.85 to 7.93 in a single tidal cycle in the LSLE, nearly as much as the world's oceans have experienced in response to anthropogenic CO2 uptake over the last century (Caldeira and Wickett, 2005; Mucci et al., 2018).
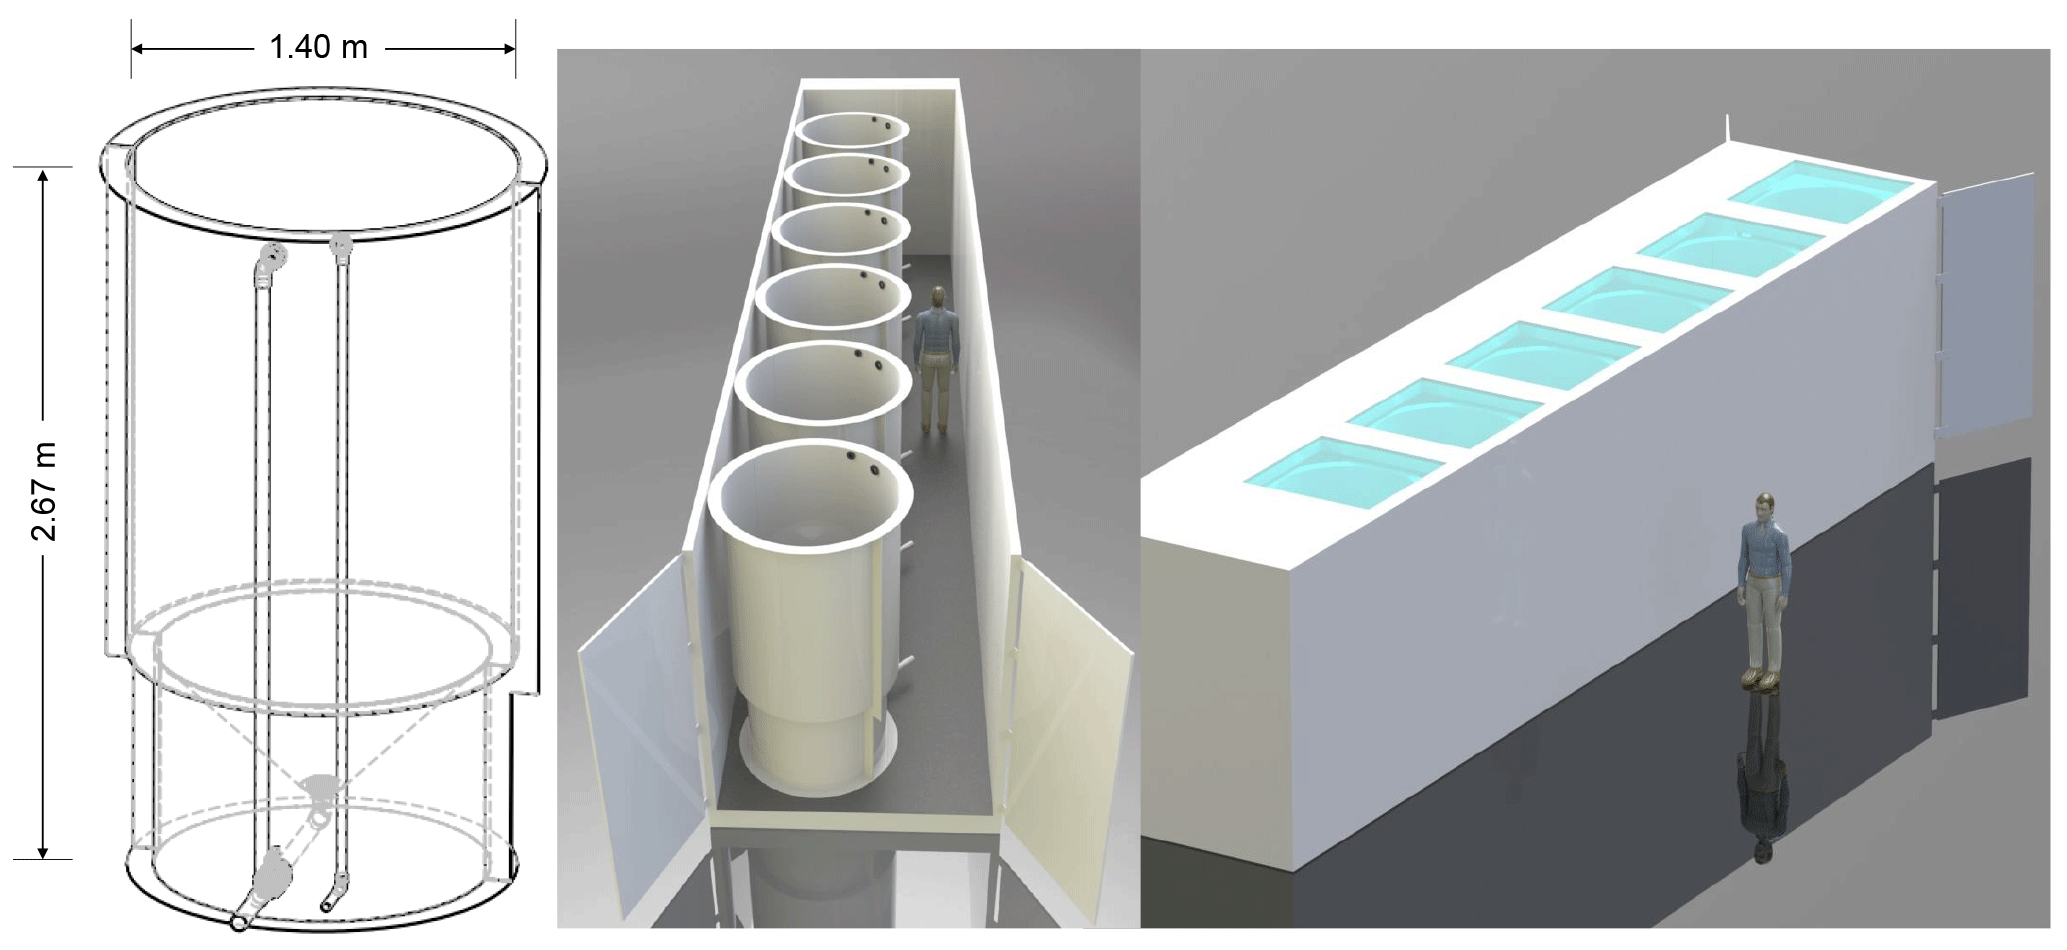
Figure 1Schematic drawing including mesocosm dimensions and placement within the containers (Aquabiotech Inc., Québec, Canada). The whole setup includes a second container holding six more mesocosms not depicted here.
The main objective of this study was to experimentally assess the sensitivity of the LSLE phytoplankton fall assemblage to a large pCO2 gradient at two temperatures (in situ and +5 ∘C). Whether lower trophic-level microorganisms thriving in a highly variable environment will show higher resistance or resilience to future anthropogenic forcings is still a matter of speculation.
2.1 Mesocosm setup
The mesocosm system consists of two thermostated full-size ship containers each holding six 2600 L mesocosms (Aquabiotech Inc., Québec, Canada). The mesocosms are cylindrical (2.67 m × 1.40 m) with a cone-shaped bottom within which mixing is achieved using a propeller fixed near the top (Fig. 1). The mesocosms exhibit opaque walls and all lie on the same plane level so as not to shade each other. Light penetrates the mesocosms only through a sealed Plexiglas circular cover at their uppermost part. The cover allows the transmission of 90 % of photosynthetically active radiation (PAR; 400–700 nm), 85–90 % of UVA (315–400 nm), and 50–85 % of solar UVB (280–315 nm). The mesocosms are equipped with individual, independent temperature probes (AQBT-Temperature sensor, accuracy ±0.2 ∘C). Temperature in the mesocosms was measured every 15 min during the experiment, and the control system triggered either a resistance heater (Process Technology TTA1.8215) located near the middle of the mesocosm or a pump-activated glycol refrigeration system to maintain the set temperature. The pH in each mesocosm was monitored every 15 min using Hach® PD1P1 probes (±0.02 pH units) connected to Hach® SC200 controllers, and positive deviations from the target values activated peristaltic pumps linked to a reservoir of artificial seawater equilibrated with pure CO2 prior to the onset of the experiment. This system maintained the pH of the seawater in the mesocosms within ±0.02 pH units of the targeted values by lowering the pH during autotrophic growth, but could not increase the pH during bloom senescence when the pCO2 rose and pH decreased.
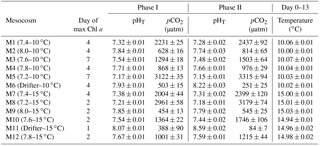
Figure 2Changes in incident photosynthetic active radiation (PAR) at the top of the mesocosm level during the experiment as measured by a Satlantic HyperOCR hyperspectral radiometer and integrated into the 400–700 nm range. Local sunrise and sunset times (EDT) are indicated with the corresponding days of the experiment.
2.2 Setting
The water was collected at 5 m depth near Rimouski harbour (48∘28′39.9 N, 68∘31′03.0 W) on 27 September 2014 (indicated as day −5 hereafter), and the experiment lasted until 15 October 2014 (day 13). In situ conditions were salinity = 26.52, temperature = 10 ∘C, nitrate () = 12.8±0.6 µmol L−1, silicic acid (Si(OH)4) = 16±2 µmol L−1, and soluble reactive phosphate (SRP) = 1.4±0.3 µmol L−1. On day −5, the water was filtered through a 250 µm mesh while simultaneously filling the 12 mesocosm tanks by gravity with a custom-made “octopus” tubing system. The initial pCO2 was 623±7 µatm and the in situ temperature of 10 ∘C was maintained in the 12 mesocosms for the first 24 h (day −4). After that period, the six mesocosms in one container were maintained at 10 ∘C, while temperature was gradually increased to 15 ∘C over day −3 in the six mesocosms of the other container. To avoid subjecting the planktonic communities to excessive stress due to sudden changes in temperature and pH while setting the experiment, the mesocosms were left to acclimatize on day −2 before acidification was carried out over day −1. One mesocosm from each temperature-controlled container was not pH-controlled to assess the community response to the freely fluctuating pH. These two mesocosms were labelled “Drifters” as the initial in situ pH was allowed to fluctuate over time with the development of the phytoplankton bloom. The other mesocosms were set to cover a range of pHT of ∼8.0 to ∼7.2 corresponding to a pCO2 gradient of ∼440 to ∼2900 µatm after acidification was carried out. To attain initial targeted pH, CO2-saturated artificial seawater was added to the mesocosms that needed a pH lowering, while mesocosms M2 (8.0), M4 (7.8), M6 (Drifter), M9 (8.0), M11 (Drifter), and M12 (7.8) were openly mixed to allow the degassing of the supersaturated CO2. Once the mesocosms had reached their target pH, the automatic system controlled the sporadic addition of CO2-saturated water to stop the pH from rising. Only the Drifters were not controlled throughout the experiment. Incident light was variable during our experiment, with only a few sunny days (Fig. 2).
2.3 Seawater analysis
The mesocosms were sampled between 05:00 and 08:00 Eastern Daylight Time (EDT) every day. Seawater for carbonate chemistry, nutrients, and primary production was collected directly from the mesocosms as close to sunrise as possible. Seawater was also collected in 20 L carboys for the determination of chlorophyll a (Chl a), taxonomy, and other variables. The total amount of volume sampled every day was 24 L or less. Samples for salinity were taken from the artificial seawater tanks and in the mesocosms on days −3, 3, and 13. The samples were collected in 250 mL plastic bottles and stored in the dark until analysis was performed using a Guildline Autosal 8400B Salinometer during the following months.
2.3.1 Carbonate chemistry
Carbonate chemistry parameters were determined using methods described in Mucci et al. (2018). Briefly, water samples for pH (every day) and total alkalinity (TA, every 3–4 days) measurements were, respectively, transferred from the mesocosms to 125 mL plastic bottles without headspace and 250 mL glass bottles. A few crystals of HgCl2 were added to the glass bottles before sealing them with a ground-glass stopper and Apiezon® Type-M high-vacuum grease. The pH was determined within hours of collection, after thermal equilibration at 25.0±0.1 ∘C, using a Hewlett-Packard UV-Visible diode array spectrophotometer (HP-8453A) and a 5 cm quartz cell with phenol red (PR; Robert-Baldo et al., 1985) and m-cresol purple (mCP; Clayton and Byrne, 1993) as indicators. Measurements were carried out at the wavelength of maximum absorbance of the protonated (HL) and deprotonated (L) indicators. Comparable measurements were carried out using a TRIS buffer prepared at a practical salinity of 25 before and after each set of daily measurements (Millero, 1986).
The pH on the total proton concentration scale (pHT) of the buffer solutions and samples at 25 ∘C was calculated according to the equation of Byrne (1987), using the salinity of each sample and the association constants given by Dickson (1990). The TA was determined on site within 1 day of sampling by open-cell automated potentiometric titration (Titrilab 865, Radiometer®) with a pH combination electrode (pHC2001, Red Rod®) and a dilute (0.025 N) HCl titrant solution. The titrant was calibrated using Certified Reference Materials (CRM Batch#94, provided by Andrew Dickson, Scripps Institute of Oceanography, La Jolla, USA). The average relative error, based on the average relative standard deviation on replicate standard and sample analyses, was better than 0.15 %. The carbonate chemistry parameters at in situ temperature were then calculated using the computed pHT at 25 ∘C in combination with the measured TA using CO2SYS (Pierrot et al., 2006) and the carbonic acid dissociation constants of Cai and Wang (1998).
2.3.2 Nutrients
Samples for , Si(OH)4, and SRP analyses were collected directly from the mesocosms every day, filtered through Whatman GF/F filters and stored at −20 ∘C in acid washed polyethylene tubes until analysis by a Bran and Luebbe Autoanalyzer III using the colorimetric methods described by Hansen and Koroleff (2007). The analytical detection limit was 0.03 µmol L−1 for plus nitrite (), 0.02 µmol L−1 for , 0.1 µmol L−1 for Si(OH)4, and 0.05 µmol L−1 for SRP.
2.3.3 Plankton biomass, composition, and enumeration
Duplicate subsamples (100 mL) for Chl a determination were filtered onto Whatman GF/F filters. Chl a concentrations were measured using a 10-AU Turner Designs fluorometer, following a 24 h extraction in 90 % acetone at 4 ∘C in the dark without grinding (acidification method: Parsons et al., 1984). The analytical detection limit for Chl a was 0.05 µg L−1.
Pico- (0.2–2 µm) and nano-phytoplankton (2–20 µm) cell abundances were determined daily by flow cytometry. Sterile cryogenic polypropylene vials were filled with 4.95 mL of seawater to which 50 µL of glutaraldehyde Grade I (final concentration = 0.1 %, Sigma Aldrich; Marie et al., 2005) were added. Duplicate samples were flash frozen in liquid nitrogen after standing 15 min at room temperature in the dark. These samples were then stored at −80 ∘C until analysis. After thawing to ambient temperature, samples were analyzed using a FACS Calibur flow cytometer (Becton Dickinson) equipped with a 488 nm argon laser. The abundances of nanophytoplankton and picophytoplankton, which include photosynthetic picoeukaryotes and picocyanobacteria, were determined by their autofluorescence characteristics and size (Marie et al., 2005). The biomass accumulation and nanophytoplankton growth rates were calculated by the following equation:
where N1 and N2 are the biomass or cell concentrations at given times t1 and t2, respectively.
Microscopic identification and enumeration for eukaryotic cells larger than 2 µm were conducted on samples taken from each mesocosm on three days: day −4, the day when maximum Chl a was attained in each mesocosm, and day 13. Samples of 250 mL were collected and preserved with acidic Lugol solution (Parsons et al., 1984), and then stored in the dark until analysis. Cell identification was carried out at the lowest possible taxonomic rank using an inverted microscope (Zeiss Axiovert 10) in accordance with Lund et al. (1958). The main taxonomic references used to identify the phytoplankton were Tomas (1997) and Bérard-Therriault et al. (1999).
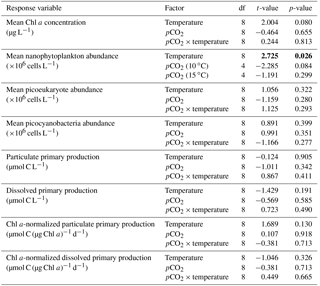
Table 1Day of maximum Chl a concentration, the associated average pHT (total hydrogen ion scale), and average pCO2 over each individually defined phase. Phase I is defined from day 0 until the day of maximum Chl a for each mesocosm, while Phase II is defined from the day after maximum Chl a until day 13. Average temperature over day 0 to day 13 is also presented for each mesocosm. Average values are presented with ±standard errors.
2.3.4 Primary production
Primary production was determined daily using the 14C-fixation incubation method (Knap et al., 1996; Ferland et al., 2011). One clear and one dark 250 mL polycarbonate bottle were filled from each mesocosm at dawn and spiked with 250 µL of NaH14CO3 (80 µCi mL−1). One hundred µL of 3-(3,4-dichlorophenyl)-1,1-dimethylurea (DCMU; 0.02 mol L−1) was added to the dark bottles to prevent active fixation of 14C by phytoplankton (Legendre et al., 1983). The total amount of radioisotope in each bottle was determined by immediately pipetting 50 µL subsamples into a 20 mL scintillation vial containing 10 mL of scintillation cocktail (Ecolume™) and 50 µL of ethanolamine (Sigma). Bottles were placed in separate incubators, at either 10 ∘C or 15 ∘C, under reduced (30 %) natural light for 24 h, which corresponds to the light transmittance at mid-mesocosm depth.
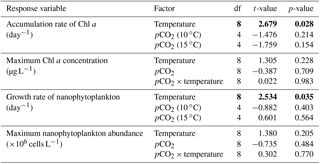
Table 2Results of the generalized least squares models (gls) tests for the effects of temperature. pCO2 and their interaction during Phase I (day 0 to the day of maximum Chl a concentration). Separate analyses with pCO2 as a continuous factor were performed when temperature had a significant effect. Chl a concentration, nanophytoplankton abundance, picoeukaryote abundance, picocyanobacteria abundance, particulate and dissolved primary production, and Chl a-normalized particulate and dissolved primary production. Significant results are in bold.
At the end of the incubation periods, 3 mL was transferred to a scintillation vial for determination of the total primary production (PT), and 3 mL was filtered through a syringe filter (GD/X 0.7 µm) to estimate daily photosynthetic carbon fixation released in the dissolved organic carbon pool (PD). The remaining volume was filtered onto a Whatman GF/F filter to measure the particulate primary production (PP). Vials containing the PT and PD samples were acidified with 500 µL of HCl 6 N, allowed to sit for 3 h under a fume hood, and then neutralized with 500 µL of NaOH 6 N. The vials containing the filters were acidified with 100 µL of 0.05 N HCl and left to fume for 12 h. Fifteen mL of a scintillation cocktail was added to the vials and was stored pending analysis using a Tri-Carb 4910TR liquid scintillation counter (PerkinElmer). Rates of carbon fixation into particulate and dissolved organic matter were calculated according to Knap et al. (1996) using the dissolved inorganic carbon concentration computed for each mesocosm at the beginning of the daily incubations and multiplied by a factor of 1.05 to correct for the lower uptake of 14C compared to 12C.
2.4 Statistical analysis
All statistical analyses were performed using R (nlme package). A general least squares (gls) model approach was used to test the linear effects of the two treatments (temperature, pCO2), and of their interactions on the measured variables (Paul et al., 2016; Hussherr et al., 2017). The analysis was conducted independently on two different time periods: Phase I (day 0 to day of maximum Chl a concentration) was calculated individually for each mesocosm, whereas Phase II (day after maximum Chl a concentrations) corresponded to the declining phase of the bloom (Table 1). Averages (or time integration in the case of primary production) of the response variables were calculated separately over the two phases and were plotted against pCO2. Separate regressions were performed with pCO2 as the continuous factor for each temperature when a temperature effect or interaction with pCO2 was detected in the gls model. Otherwise, the model included data from both temperatures and the interaction with pCO2. Normality of the residuals was determined using a Shapiro–Wilk test (p>0.05) and data were transformed (natural logarithm or square root) if required. As explained by Havenhand et al. (2010), the gradient approach, instead of treatment replication, is particularly suitable when few experimental units are available such as in large-volume mesocosm experiments. In addition, squared Pearson's correlation coefficients (r2) with a significance level of 0.05 were used to evaluate correlations between key variables.
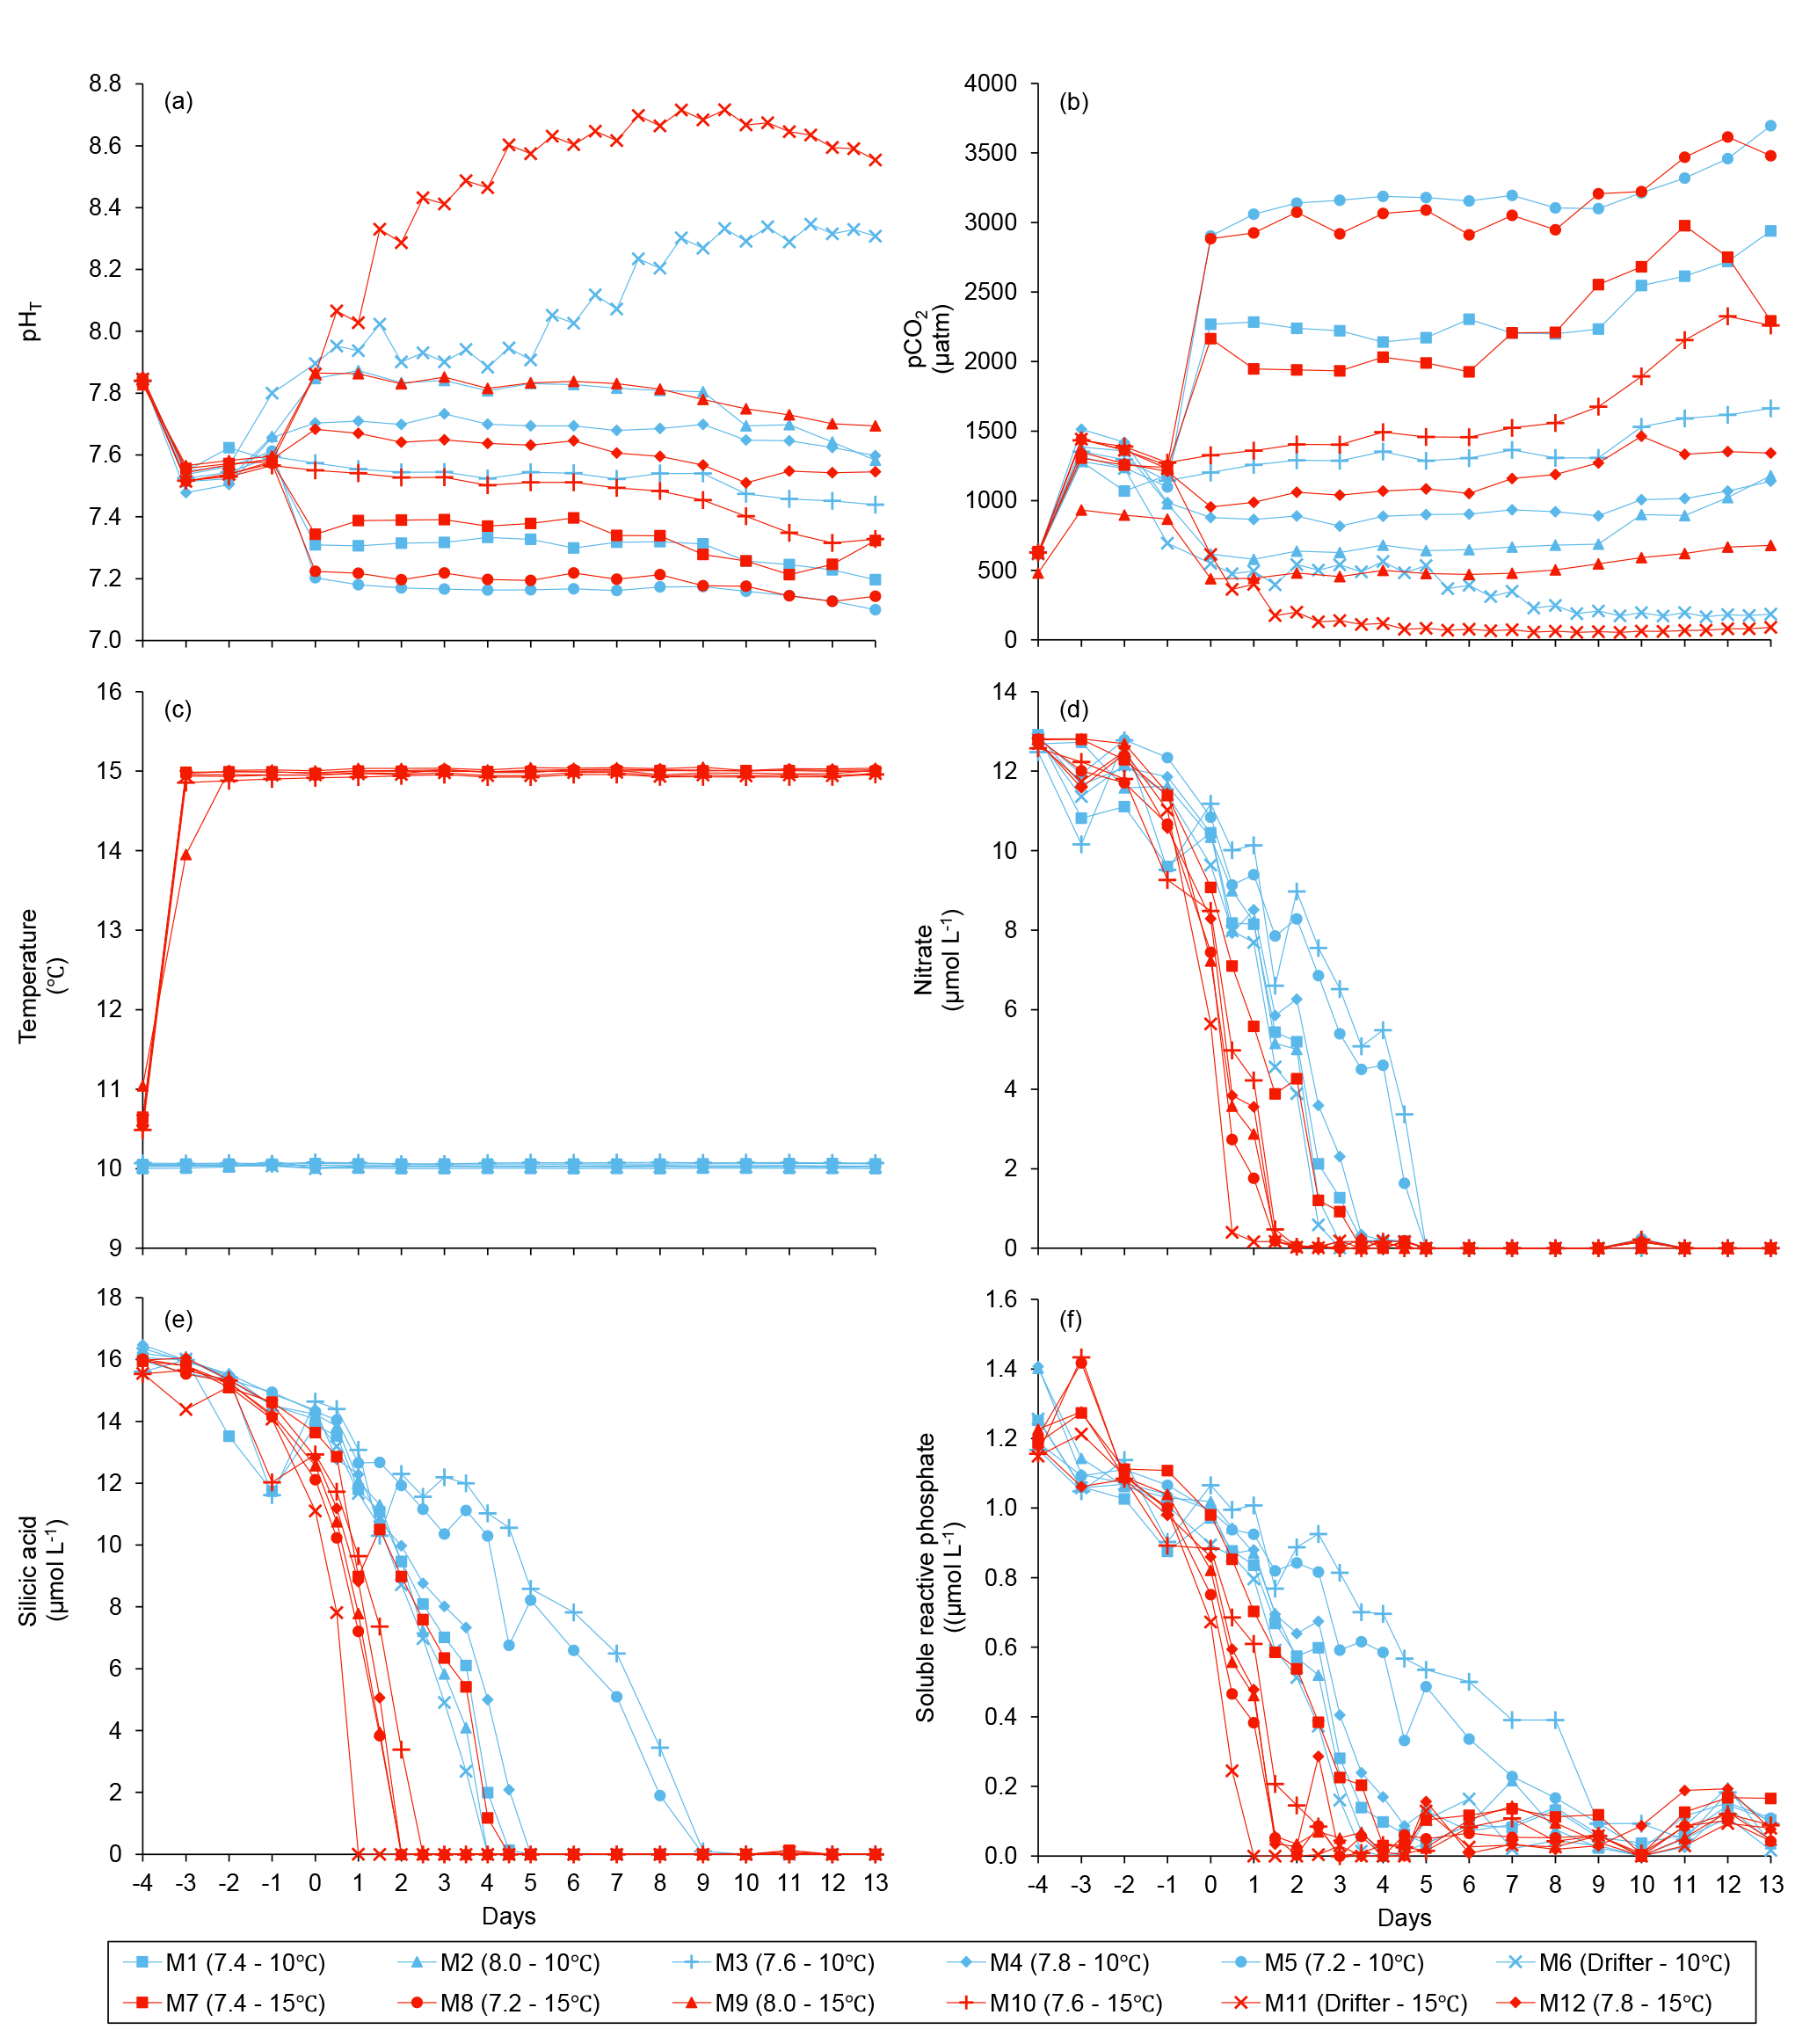
Figure 3Temporal variations over the course of the experiment for (a) pHT, (b) pCO2, (c) temperature, (d) nitrate, (e) silicic acid, and (f) soluble reactive phosphate. For symbol attribution to treatments, see legend.
3.1 Seawater chemistry
Water salinity was 26.52±0.03 on day −4 in all mesocosms and remained constant throughout the experiment, averaging 26.54±0.02 on day 13. The TA was practically invariant in the mesocosms, averaging 2057±2 µmol kg on day −4 and 2058±2 µmol kg on day 13. Following the filling of the mesocosms, the pHT in all mesocosms decreased from an average of 7.84 to 7.53. Throughout the rest of the experiment after treatments were applied, the pH remained relatively stable in the pH-controlled treatments, but decreased slightly during Phase II by an average of units relative to the target pHT (Fig. 3a). Given a constant TA, pH variations were accompanied by variations in pCO2, from an average of 1340±150 µatm on day −3, and ranging from 564 to 2902 µatm at 10 ∘C, and from 363 to 2884 µatm at 15 ∘C on day 0 following the acidification (Fig. 3b; Table 1). The pHT in the Drifters (M6 and M11) increased from 7.896 and 7.862 on day 0 at 10 and 15 ∘C, respectively, to 8.307 and 8.554 on day 13, reflecting the balance between CO2 uptake and metabolic CO2 production over the duration of the experiment. On the last day, pCO2 in all mesocosms ranged from 186 to 3695 µatm at 10 ∘C, and from 90 to 3480 µatm at 15 ∘C. The temperature of the mesocosms in each container remained within ±0.1 ∘C of the target temperature throughout the experiment and averaged 10.04±0.02 ∘C for mesocosms M1 through M6, and 15.0±0.1 ∘C for mesocosms M7 through M12 (Fig. 3c; Table 1).
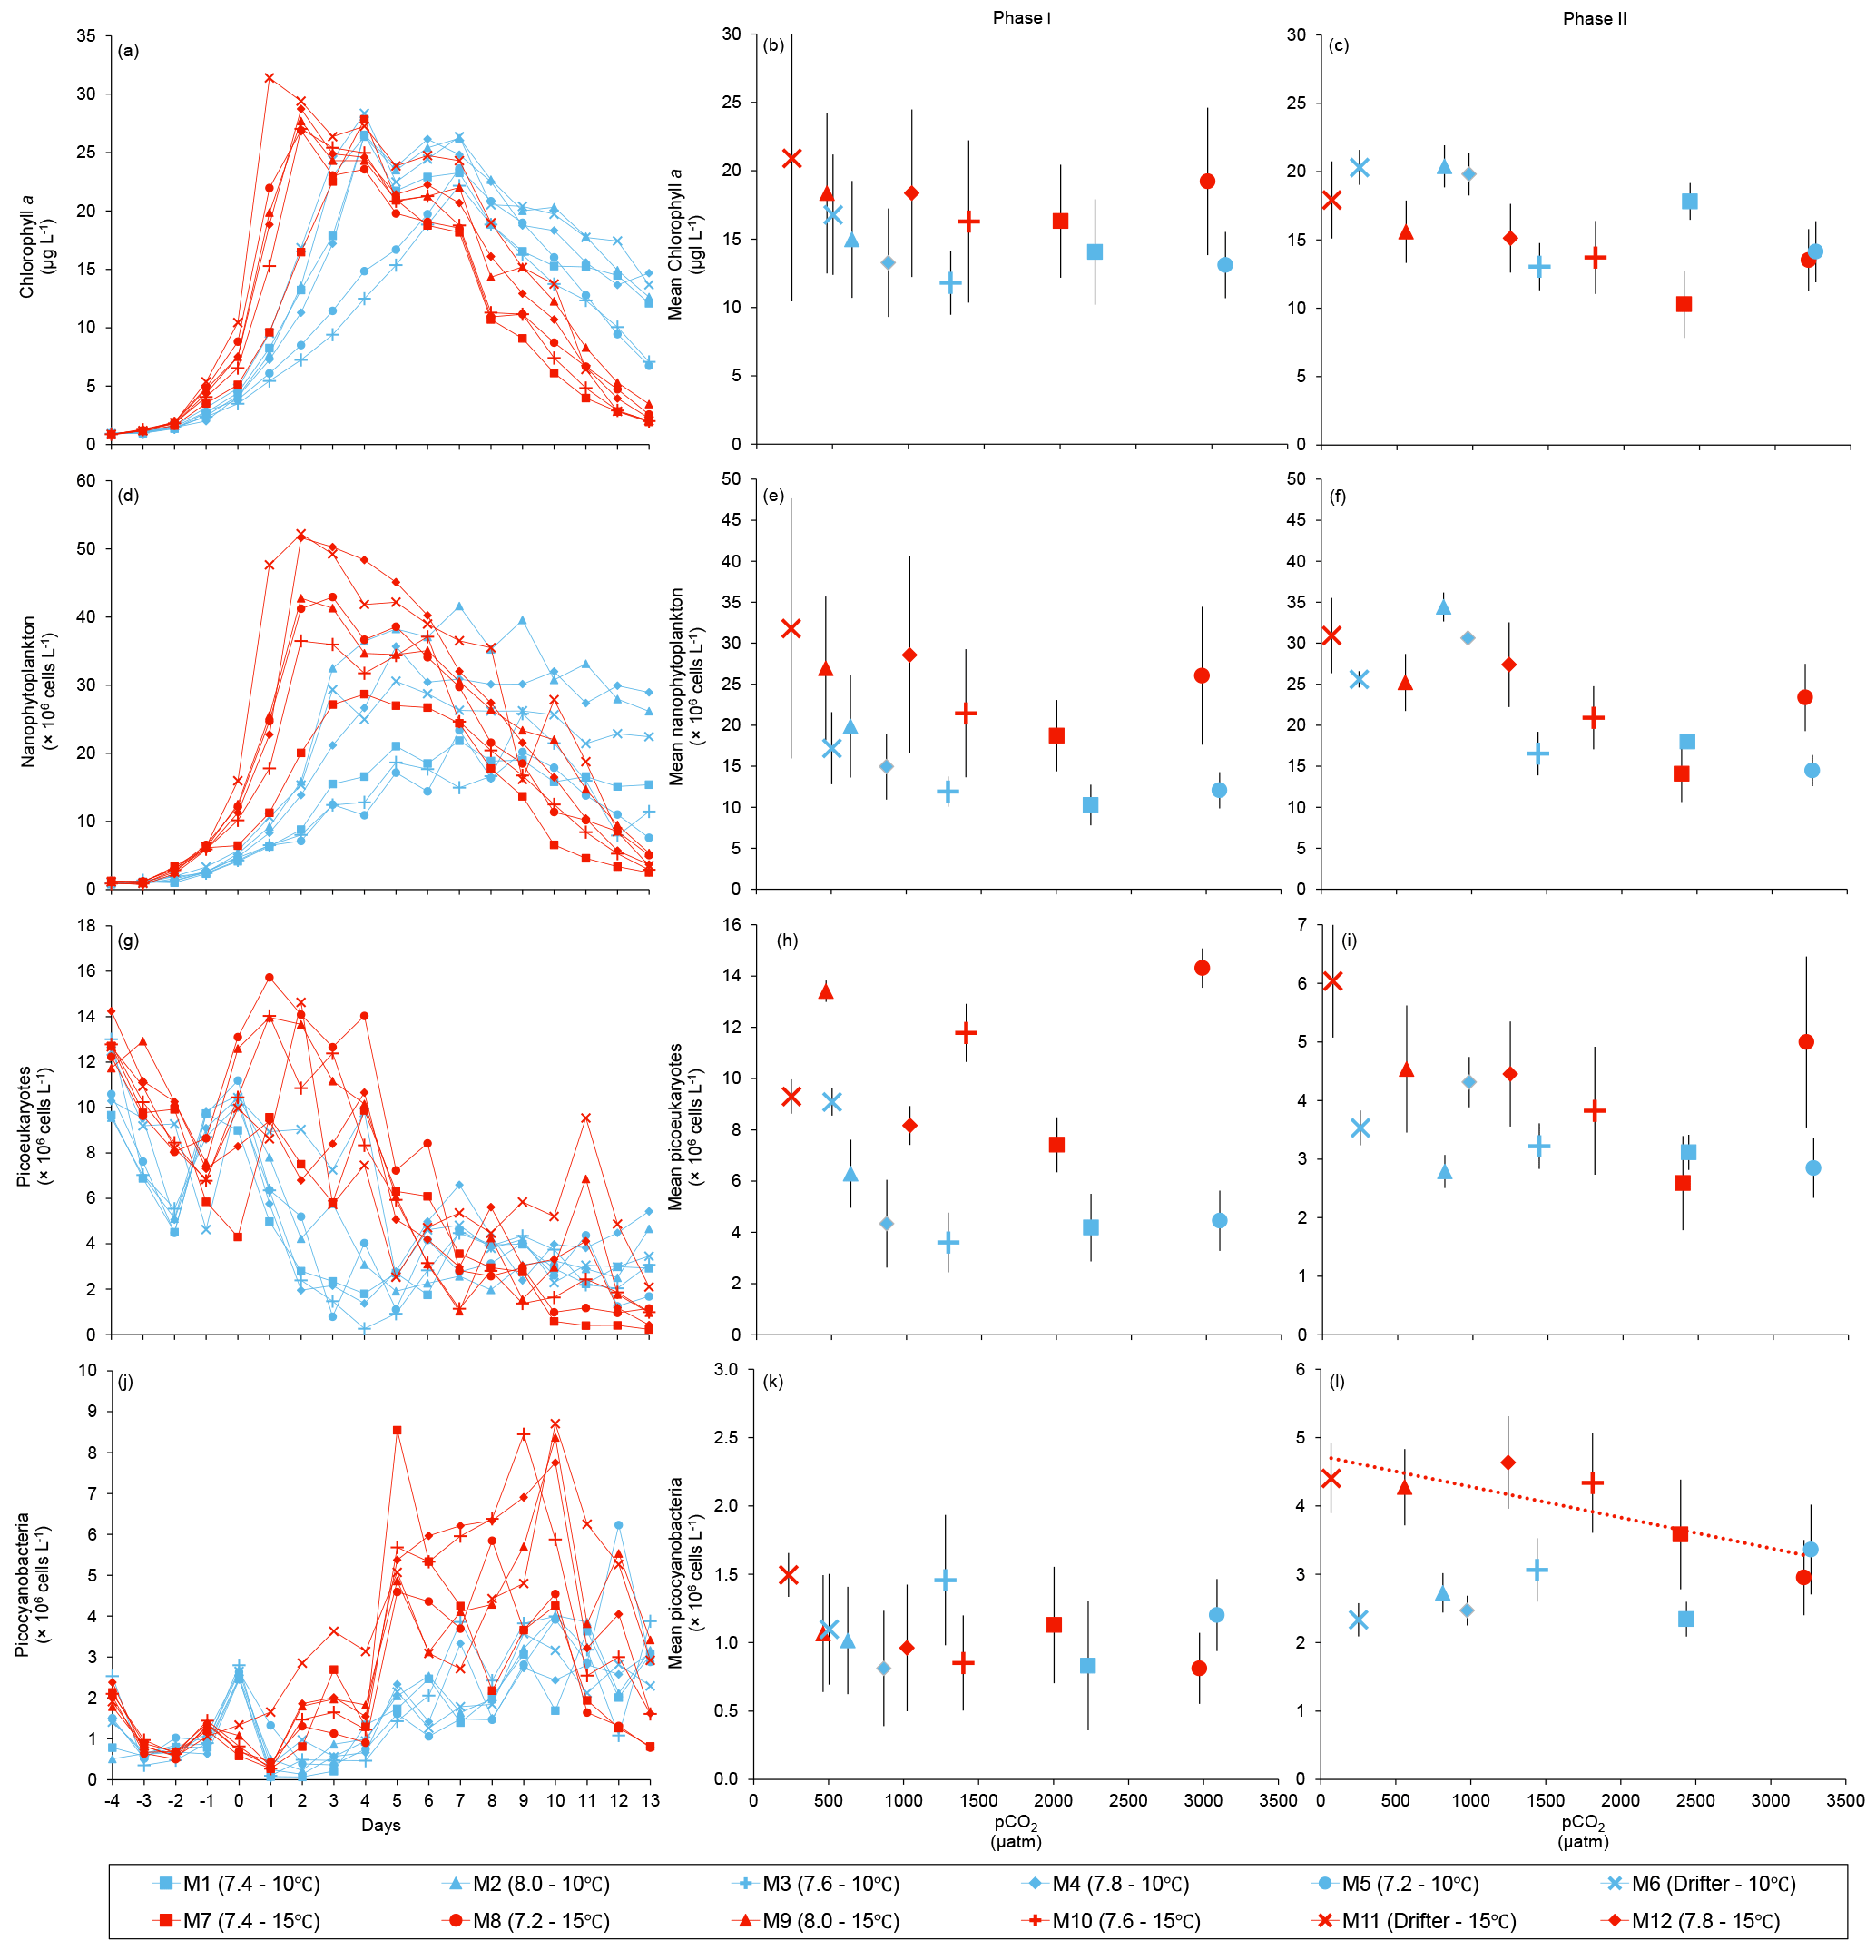
Figure 4Temporal variations and averages±SE during Phase I (day 0 to day of maximum Chl a concentration) and Phase II (day after maximum Chl a concentration to day 13) for (a–c) chlorophyll a, (d–f) nanophytoplankton, (g–i) picoeukaryotes, and (j–l) picocyanobacteria. For symbol attribution to treatments, see legend.
3.2 Dissolved inorganic nutrient concentrations
Nutrient concentrations averaged 9.1±0.5 µmol L−1 for , 13.4±0.3 µmol L−1 for Si(OH)4, and 0.91±0.03 µmol L−1 for SRP on day 0 (Fig. 3d, e, f). Within individual mesocosms, concentrations of nitrate, silicic acid, and soluble reactive phosphate displayed similar temporal patterns following the development of the phytoplankton bloom. Overall, depletion was reached within 5 days in all mesocosms at 10 ∘C, except for the Drifter, which became nutrient-depleted by day 3. Nutrient depletion was reached slightly earlier within the 15 ∘C mesocosms, all of them displaying exhaustion within 3 days of the experiment. Accordingly, bloom development and primary production within each mesocosm were eventually limited by the supply in nutrients, irrespective of the temperature or pH treatment. Likewise, Si(OH)4 fell below the detection limit between days 1 and 5 in all mesocosms except for those whose pHT was set at 7.2 and 7.6 at 10 ∘C (M5 and M3) and in which Si(OH)4 depletion occurred on day 9. Variations in SRP concentrations followed closely those of in all mesocosms, except again for those set at pH 7.2 and 7.6, in which undetectable values were reached on day 9.
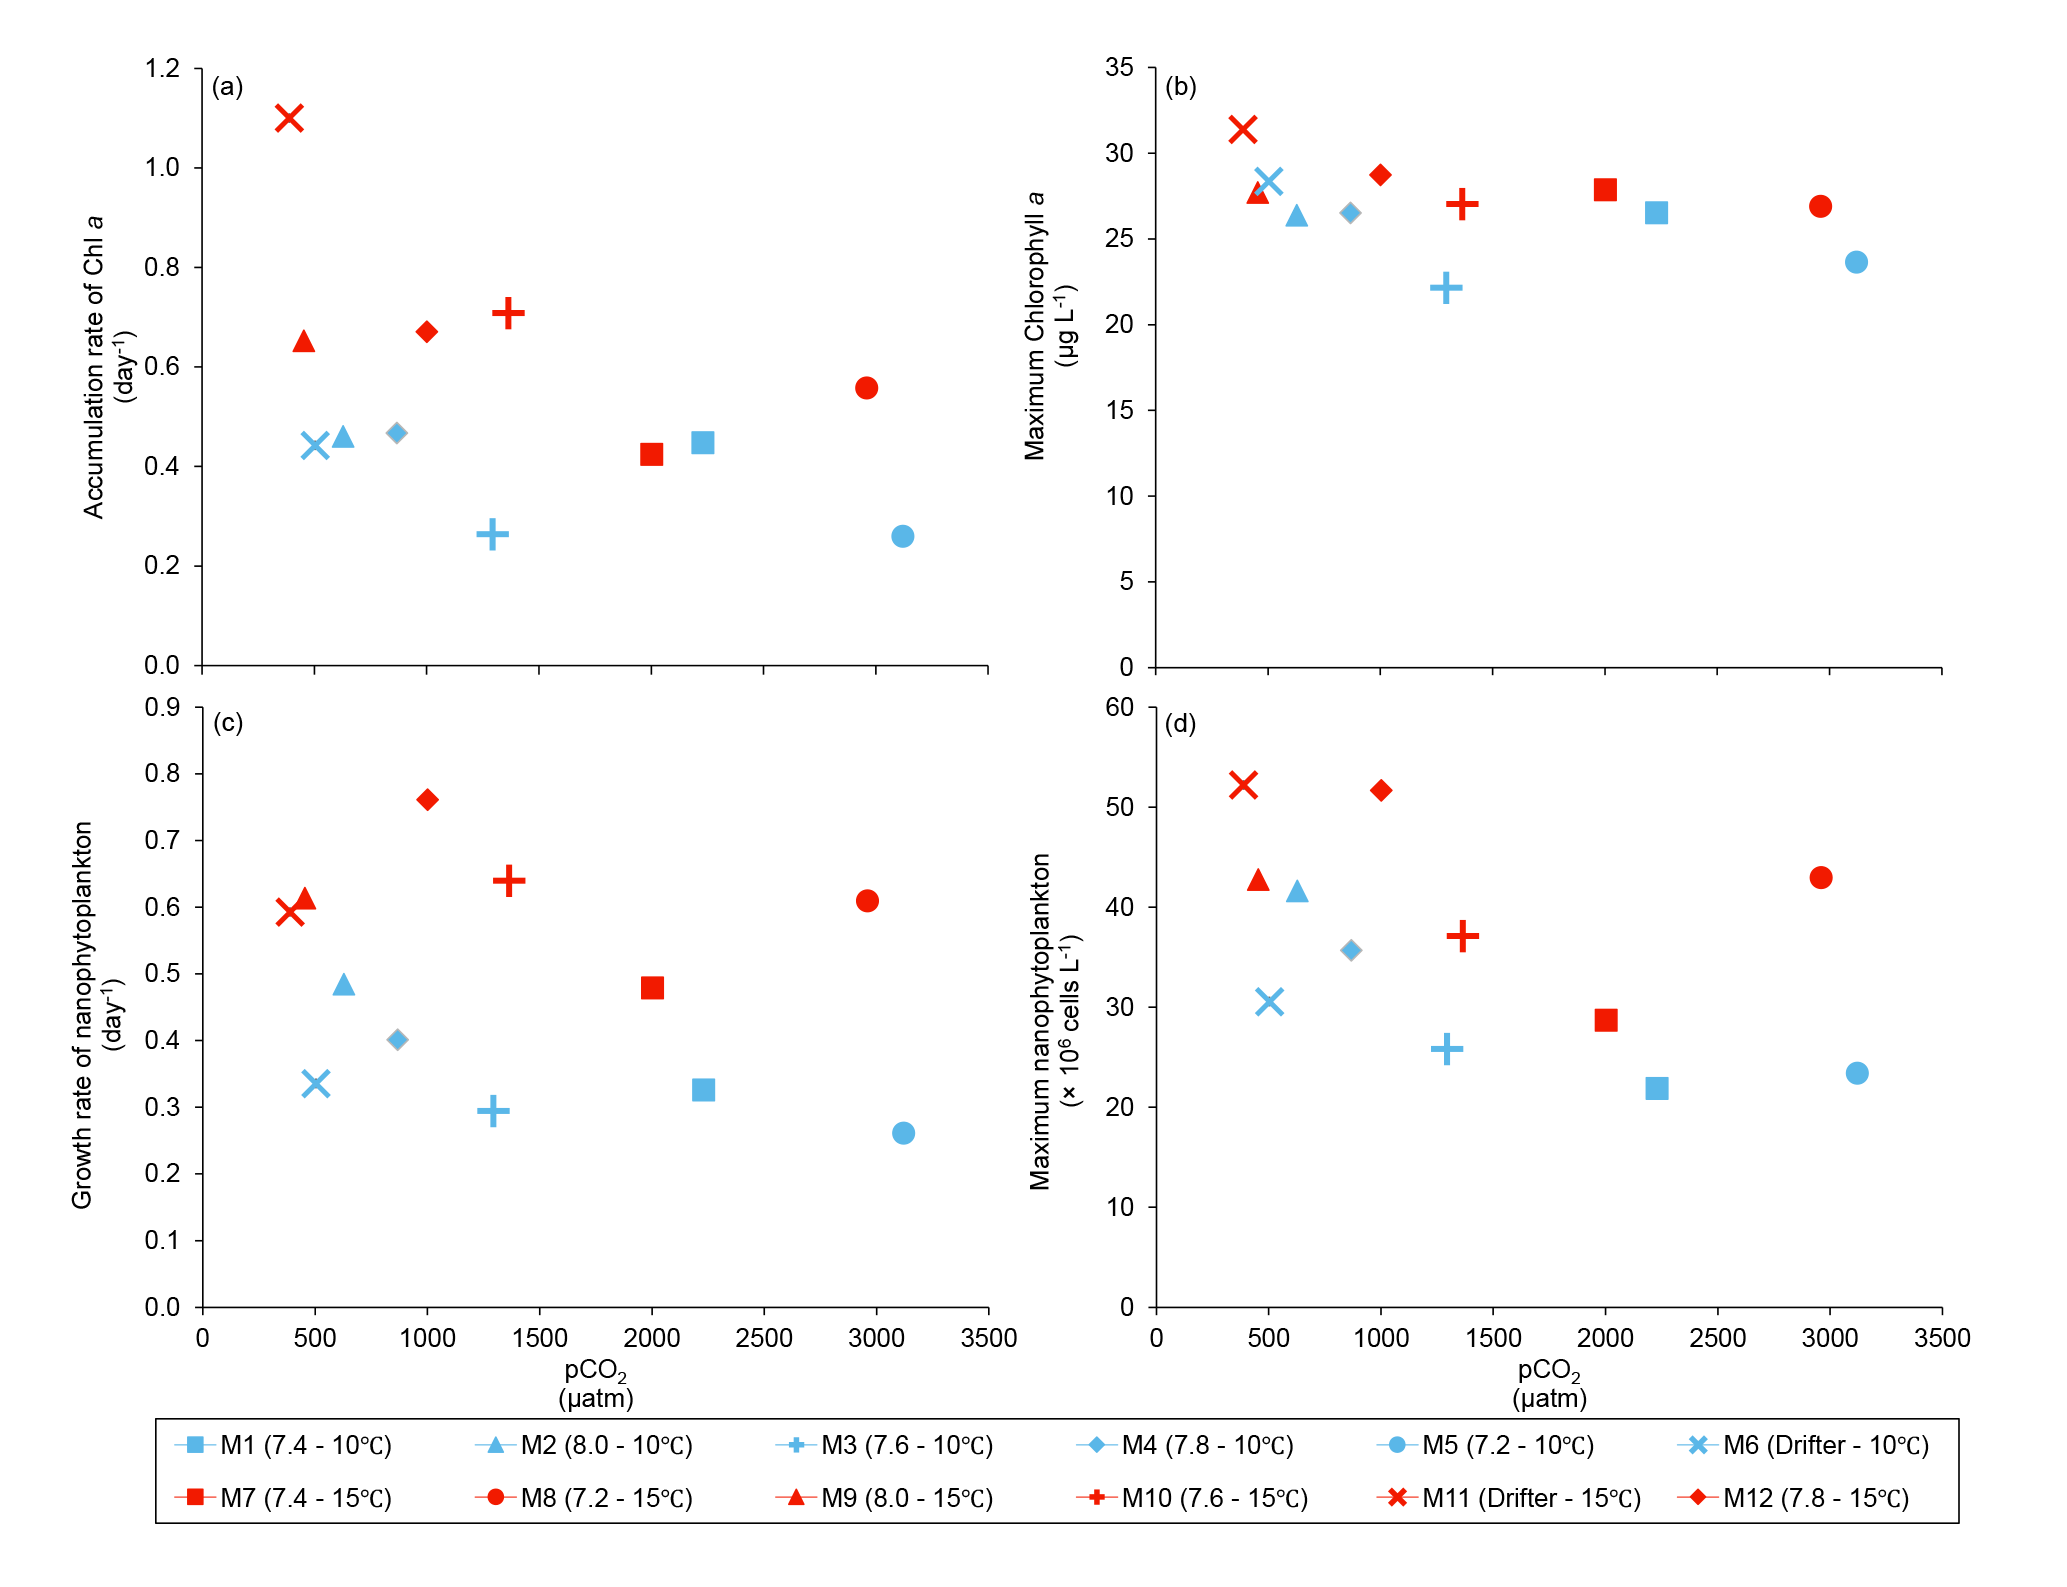
Figure 5(a) Accumulation rate of Chl a (day 0 to maximum Chl a concentration), (b) maximum Chl a concentrations, (c) growth rate of nanophytoplankton (day 0 to maximum nanophytoplankton abundance), and (d) maximum nanophytoplankton abundance during the experiment. For symbol attribution to treatments, see legends.
Table 3Results of the generalized least squares models (gls) tests for the effects of temperature, pCO2, and their interaction. Separate analyses with pCO2 as a continuous factor were performed when temperature had a significant effect. Accumulation rate of Chl a (day 0 to maximum Chl a concentration), maximum Chl a concentration, growth rate of nanophytoplankton (day 0 to maximum nanophytoplankton abundance), and maximum nanophytoplankton abundance. Significant results are in bold.
3.3 Phytoplankton biomass
Chl a concentrations were below 1 µg L−1 just after the filling of the mesocosms, and averaged 5.9±0.6 µg L−1 on day 0 (Fig. 4a). They then quickly increased to reach maximum concentrations around 27±2 µg L−1 on day 3±2, and decreased progressively until the end of the experiment, reaching 11±1 and 2.4±0.2 µg L−1 at 10 and 15 ∘C on day 13. During Phase I, results from the gls model show no significant relationships between the mean Chl a concentrations and pCO2, temperature, and the interaction of the two factors (Fig. 4b; Table 2). During this phase, the accumulation rate of Chl a was positively affected by temperature, increasing by ∼76 %, but was not affected by the pCO2 gradient at either temperature (Fig. 5a; Table 3). The maximum Chl a concentrations reached during the bloom were not affected by the two treatments (Fig. 5b; Table 3). During Phase II, we observed no significant effect of pCO2, temperature, and the interaction of those factors on the mean Chl a concentrations following the depletion of (Fig. 4c; Table 4).
3.4 Phytoplankton size class
Nanophytoplankton abundance varied from cells L−1 on day 0 to an average maximum of cells L−1 at the peak of the bloom (Fig. 4d). At both temperatures, nanophytoplankton abundance increased until at least days 2 or 4 and decreased or remained stable thereafter. The correlation between the nanophytoplankton abundance and Chl a (r2=0.75, p<0.001, df=166) suggests that this phytoplankton size class was responsible for most of the biomass build-up throughout the experiment. As observed for the mean Chl a concentration, the mean abundance of nanophytoplankton was not significantly affected by the pCO2 gradient at the two temperatures investigated during Phase I, but showed higher values at 15 ∘C ( cells L−1) than at 10 ∘C ( cells L−1) (Fig. 4e; Table 2). Likewise, the growth rate of nanophytoplankton during Phase I was not influenced by the pCO2 gradient at the two temperatures, but was significantly higher in the warm treatment (Fig. 5c; Table 3). During Phase II, no relationship was found between the mean nanophytoplankton abundance and the pCO2 gradient, the temperature, and the pCO2 × temperature interaction (Fig. 4f; Table 4).
Table 4Results of the generalized least squares models (gls) tests for the effects of temperature, pCO2, and their interaction during Phase II (day after maximum Chl a to day 13). Separate analyses with pCO2 as a continuous factor were performed when temperature had a significant effect. Chl a concentration, nanophytoplankton abundance, picoeukaryote abundance, picocyanobacteria abundance, particulate and dissolved primary production, and Chl a-normalized particulate and dissolved primary production. Significant results are in bold.
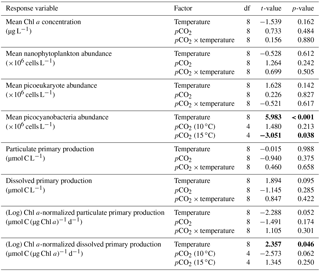
Initial abundance of photosynthetic picoeukaryotes was cells L−1, accounting for more than 80 % of total plankton cells in the 0.2–20 µm size fraction. The abundance of this plankton size fraction decreased slightly through Phase I and their number remained relatively stable at cells L−1 throughout Phase II (Fig. 4g). We found no relationship between the abundance of picoeukaryotes and the pCO2 gradient at the two temperatures investigated during both Phases I and II, and no temperature effect was observed either (Fig. 4h, i; Tables 2 and 4).
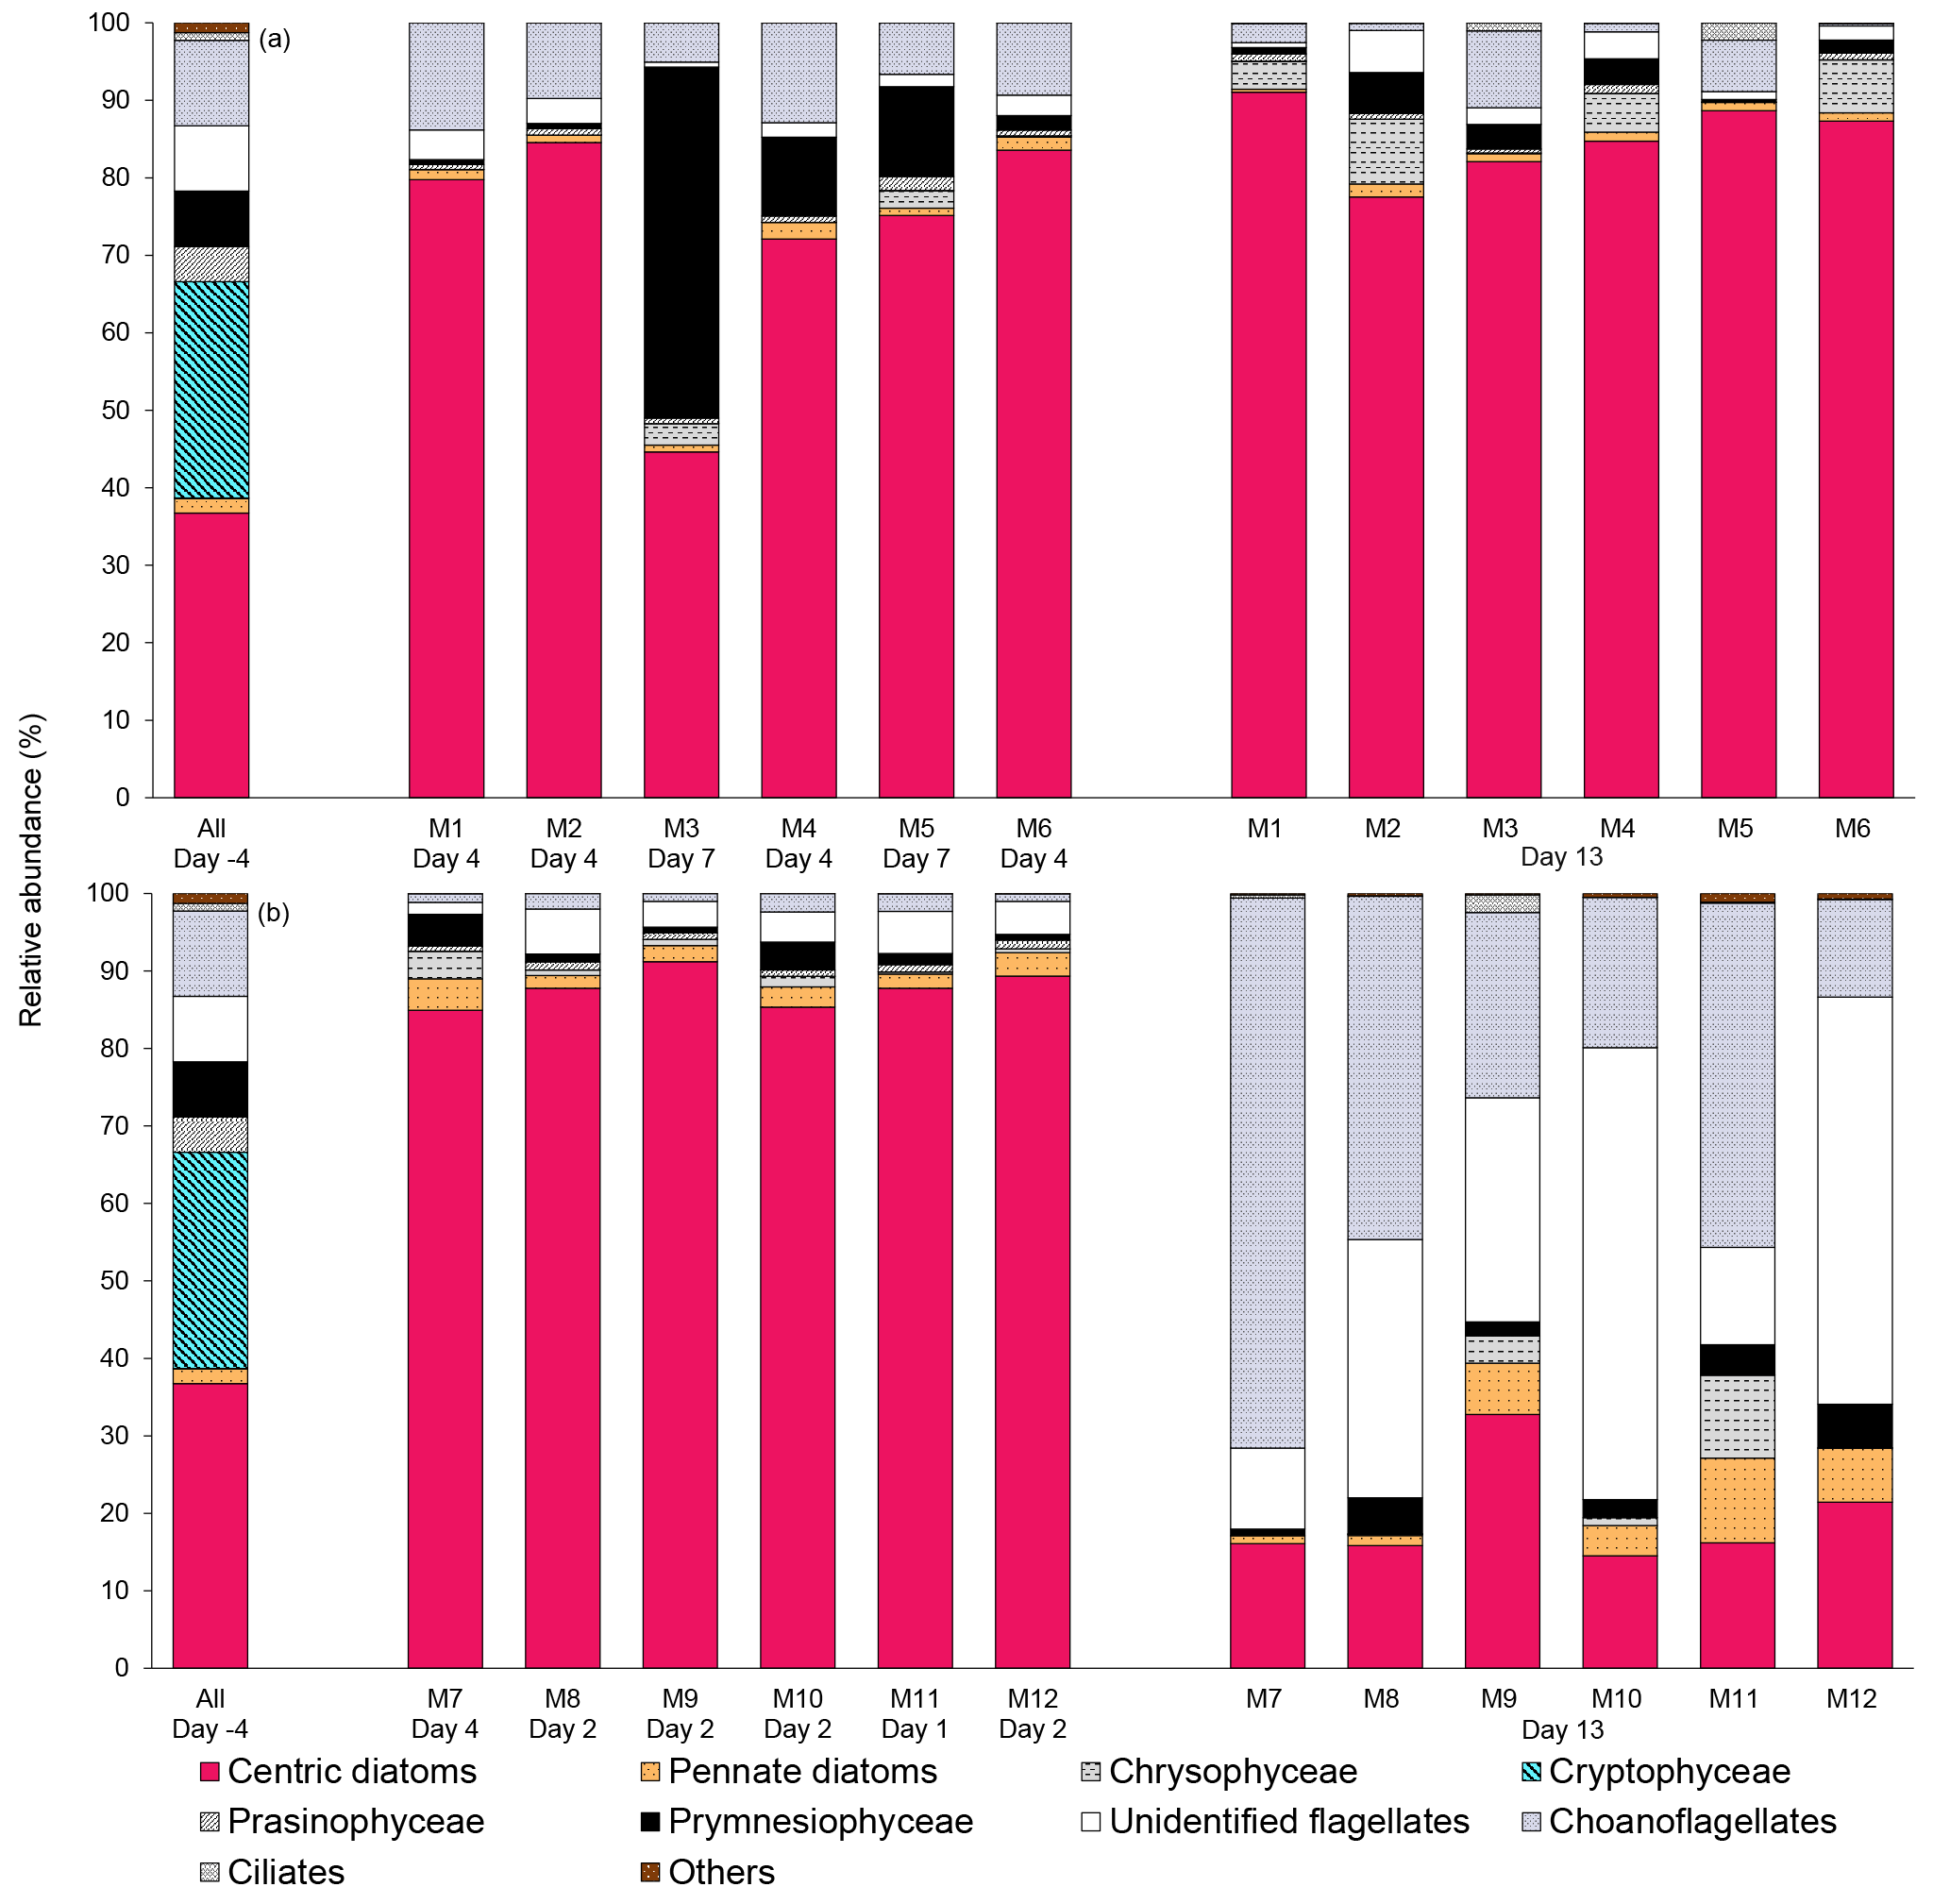
Figure 6Relative abundance of 10 groups of protists at the beginning of the experiment (day −4), on the day of maximum Chl a concentrations in each mesocosm, and at the end of the experiment (day 13) for (a) 10 ∘C and (b) 15 ∘C mesocosms. The group “others” includes dinoflagellates, Chlorophyceae, Dictyochophyecae, Euglenophyceae, heterotrophic groups, and unidentified cells. Each bar plot represents a mesocosm at a given time. The bar plot on day −4 represents the initial community assemblage before temperature manipulation and acidification, and is therefore the same for each temperature treatment. For symbol attribution to treatments, see legend.
Picocyanobacteria exhibited a different pattern than the nanophytoplankton and picoeukaryotes (Fig. 4j). Their abundance was initially low ( cells L−1 on day 0), remained relatively stable during Phase I, and increased rapidly during Phase II, accounting for ∼50 % of the total picophytoplankton cell counts toward the end of the experiment. During Phase I, the mean picocyanobacteria abundance was not influenced by the pCO2 gradient or temperature (Fig. 4k; Table 2). During Phase II, the mean picocyanobacteria abundance was not significantly affected by pCO2 at in situ temperature. However, mean picocyanobacteria were higher at 15 ∘C, with the pCO2 gradient responsible for a ∼33 % reduction of picocyanobacteria abundance from the Drifter to the more acidified treatment ( cells L−1 vs. cells L−1) (Fig. 4l; Table 4).
3.5 Phytoplankton taxonomy
The taxonomic composition of the planktonic assemblage larger than 2 µm was identical in all treatments at the beginning of the experiment, and was mainly composed of the cosmopolitan chain-forming centric diatom Skeletonema costatum (S. costatum) and the cryptophyte Plagioselmis prolonga var. nordica (Fig. 6). At the peak of the blooms (maximum Chl a concentrations), the species composition did not vary between the pCO2 treatments and between the two temperatures tested. S. costatum was the dominant species in all mesocosms (70–90 % of the total number of eukaryotic cells), except for one mesocosm (M3, pH 7.6 at 10 ∘C) where a mixed dominance of Chrysochromulina spp. (a prymnesiophyte of 2–5 µm) and S. costatum was observed (Fig. 6a). S. costatum accounted for 80–90 % of the total eukaryotic cell counts in all mesocosms at the end of the experiment carried out at 10 ∘C. At 15 ∘C, the composition of the assemblage had shifted toward a dominance of unidentified flagellates and choanoflagellates (2–20 µm) in all mesocosms, with these two groups accounting for 55–80 % of the total cell counts, while diatoms showed signs of loss of viability as indicated by the presence of empty frustules (Fig. 6b).
Table 5Results of the generalized least squares models (gls) tests for the effects of temperature, pCO2, and their interaction. Separate analyses with pCO2 as a continuous factor were performed when temperature had a significant effect. Maximum particulate and dissolved primary production, and time integration over the full duration of the experiment (day 0 to day 13). Natural logarithm transformation is indicated in parentheses when necessary; significant results are in bold.
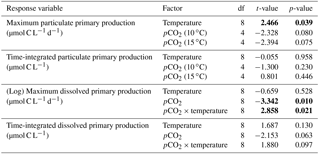
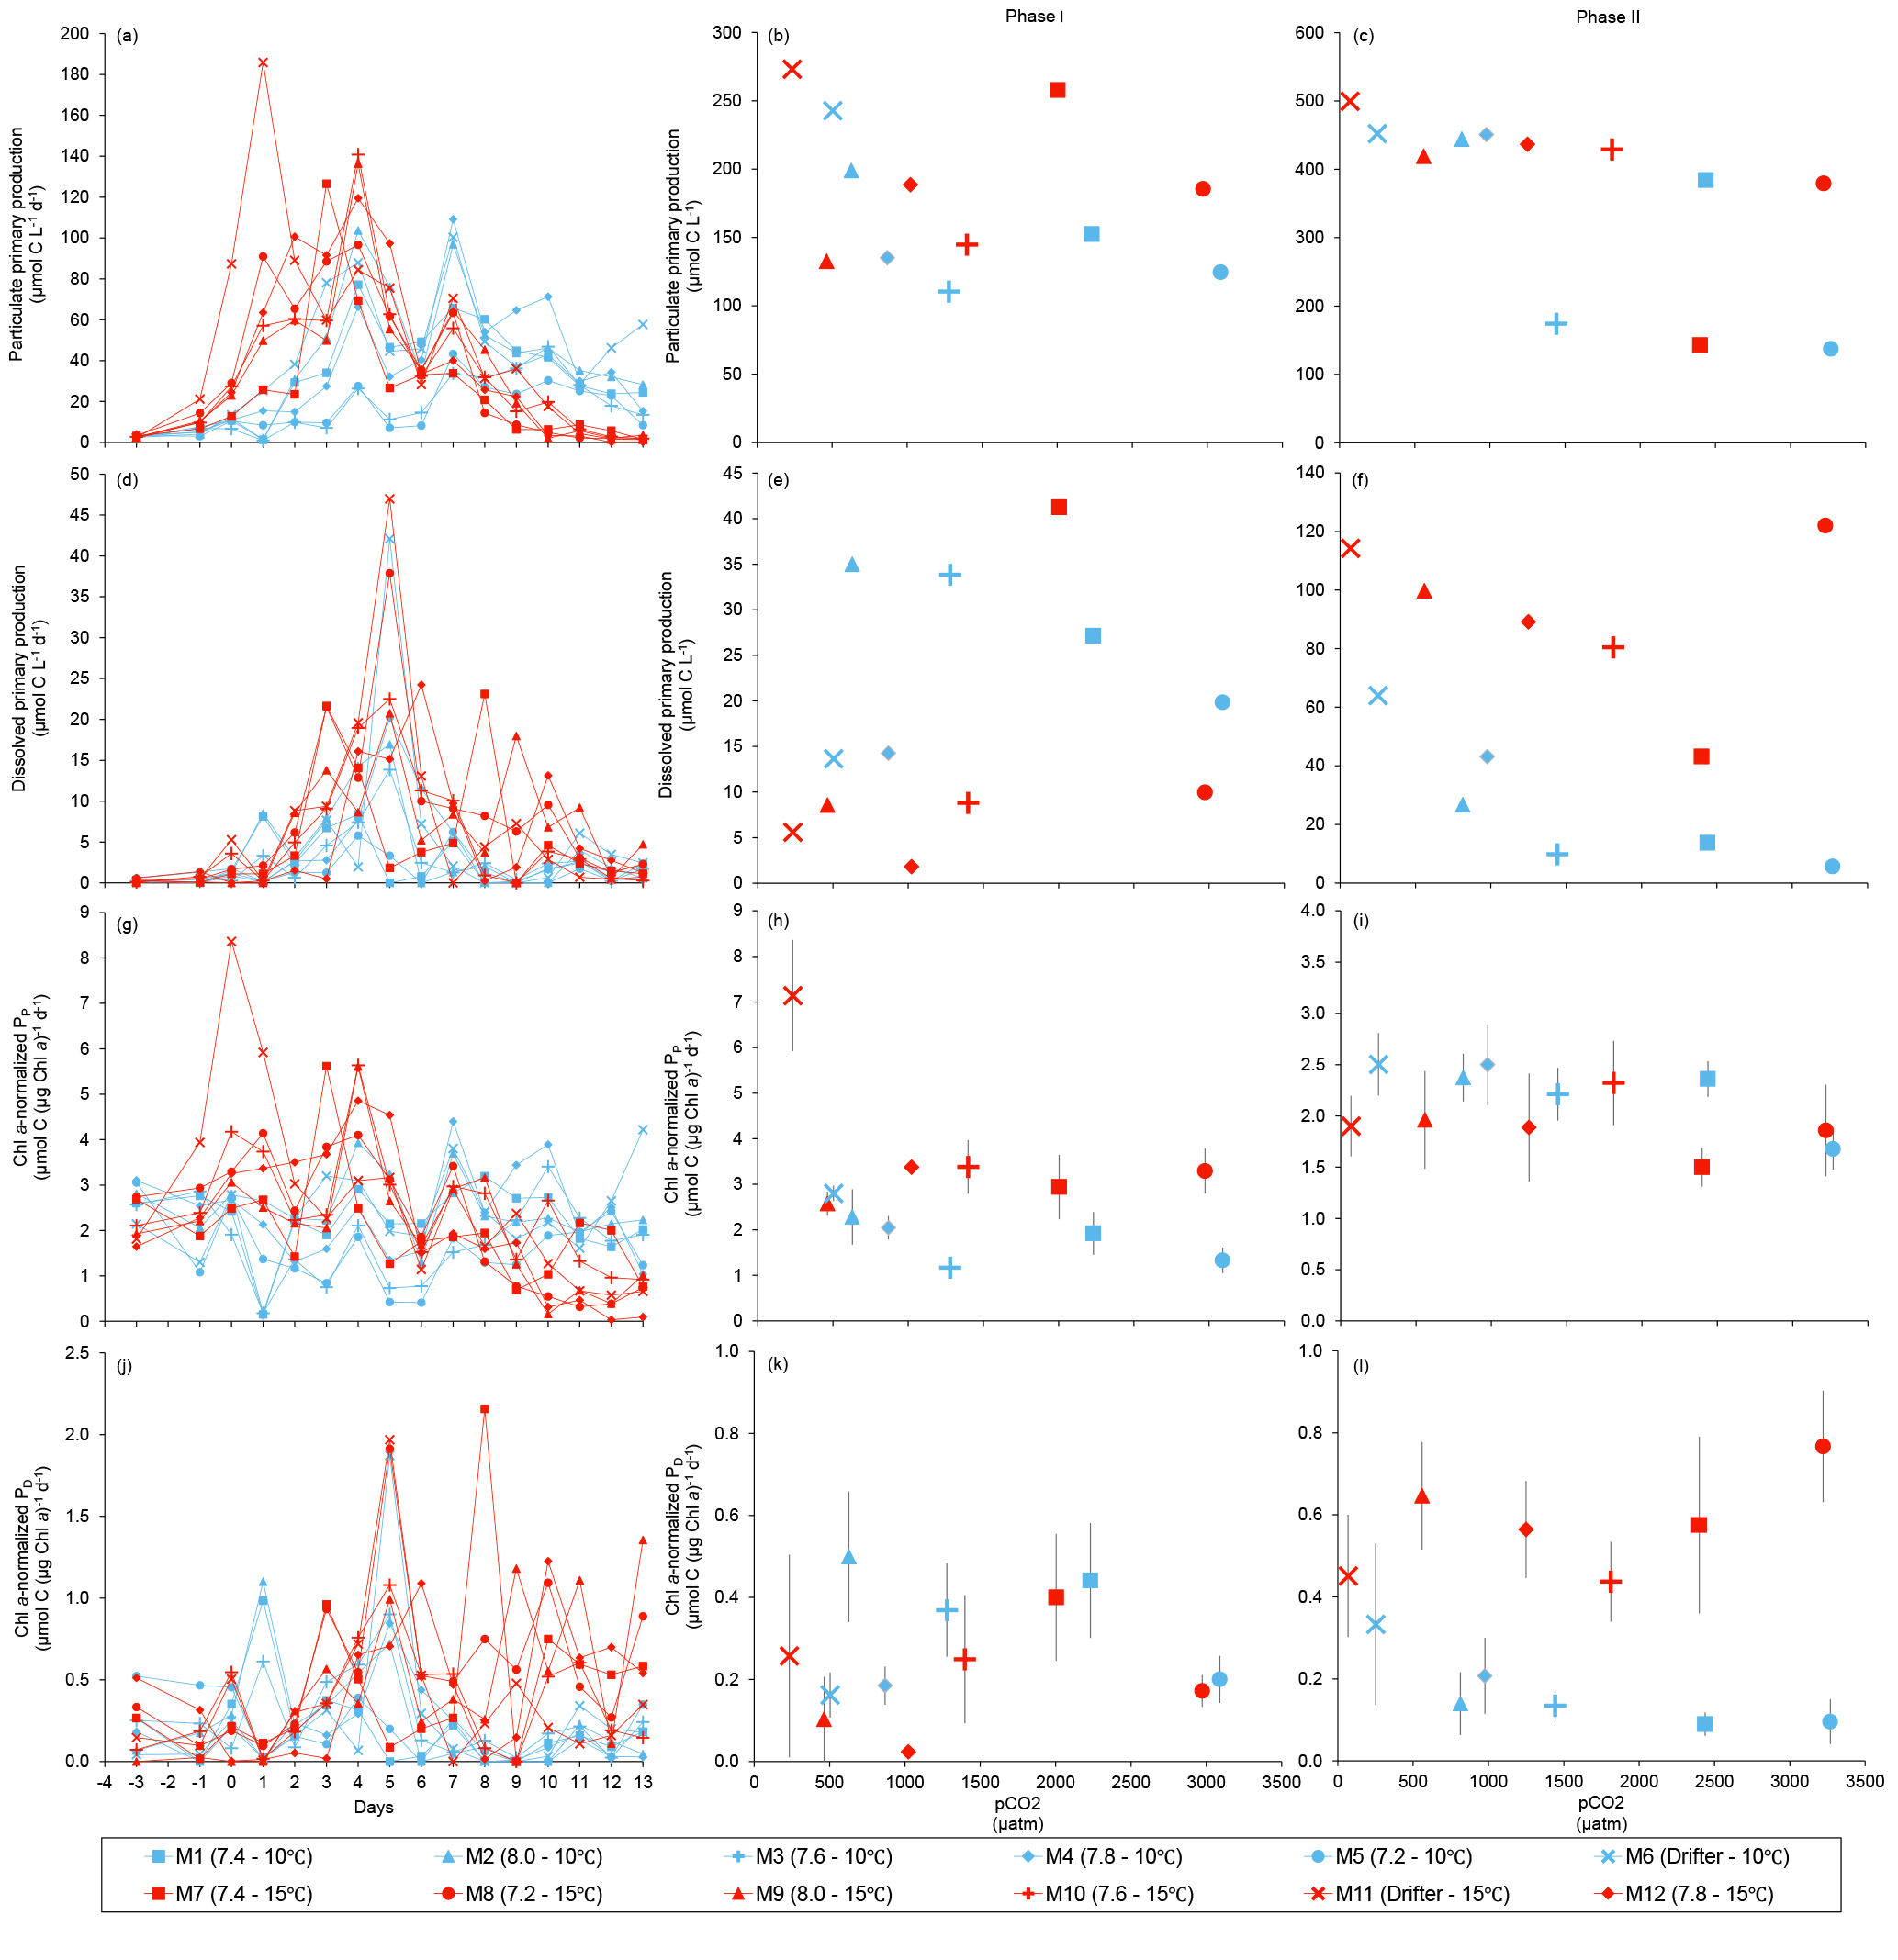
Figure 7Temporal variations and time-integrated or averaged±SE during Phase I (day 0 to day of maximum Chl a concentration) and Phase II (day after maximum Chl a concentration to day 13) for (a–c) particulate primary production, (d–f) dissolved primary production, (g–i) Chl a-normalized particulate primary production, and (j–l) Chl a-normalized dissolved primary production. For symbol attribution to treatments, see legend.
3.6 Primary production
PP increased in all mesocosms during Phase I of the experiment, in parallel with the increase in Chl a (Fig. 7a). PP maxima were attained on days 3–4, except for the 15 ∘C Drifter (M11) where PP peaked on day 1. We found no significant effect of the pCO2 gradient, temperature, and pCO2 × temperature interaction on the time-integrated PP during both Phases I and II (Fig. 7b, c; Tables 2 and 4). Similarly, the absence of significant treatment effects remained when normalizing PP per unit of Chl a (Fig. 7g, h, i). Initial Chl a-normalized PP values were 3.3±0.5 µmol C (µg Chl a)−1 d−1 and reached maxima between 3.7±0.3 µmol C (µg Chl a)−1 d−1 and 5.7±0.6 µmol C (µg Chl a)−1 d−1 at 10 and 15 ∘C, respectively. These values then decreased to 2.2±0.6 µmol C (µg Chl a)−1 d−1 and 0.9±0.2 µmol C (µg Chl a)−1 d−1 on the last day of the experiment. During Phase I, the mean Chl a-normalized PP was not significantly affected by the pCO2 gradient or warming, as observed for the mean Chl a concentrations and time-integrated PP over that phase (Fig. 7h; Table 2). During Phase II, the log of the mean Chl a-normalized PP was not significantly affected by the pCO2 gradient, the temperature, or the interaction of these factors (Fig. 7i; Table 4).
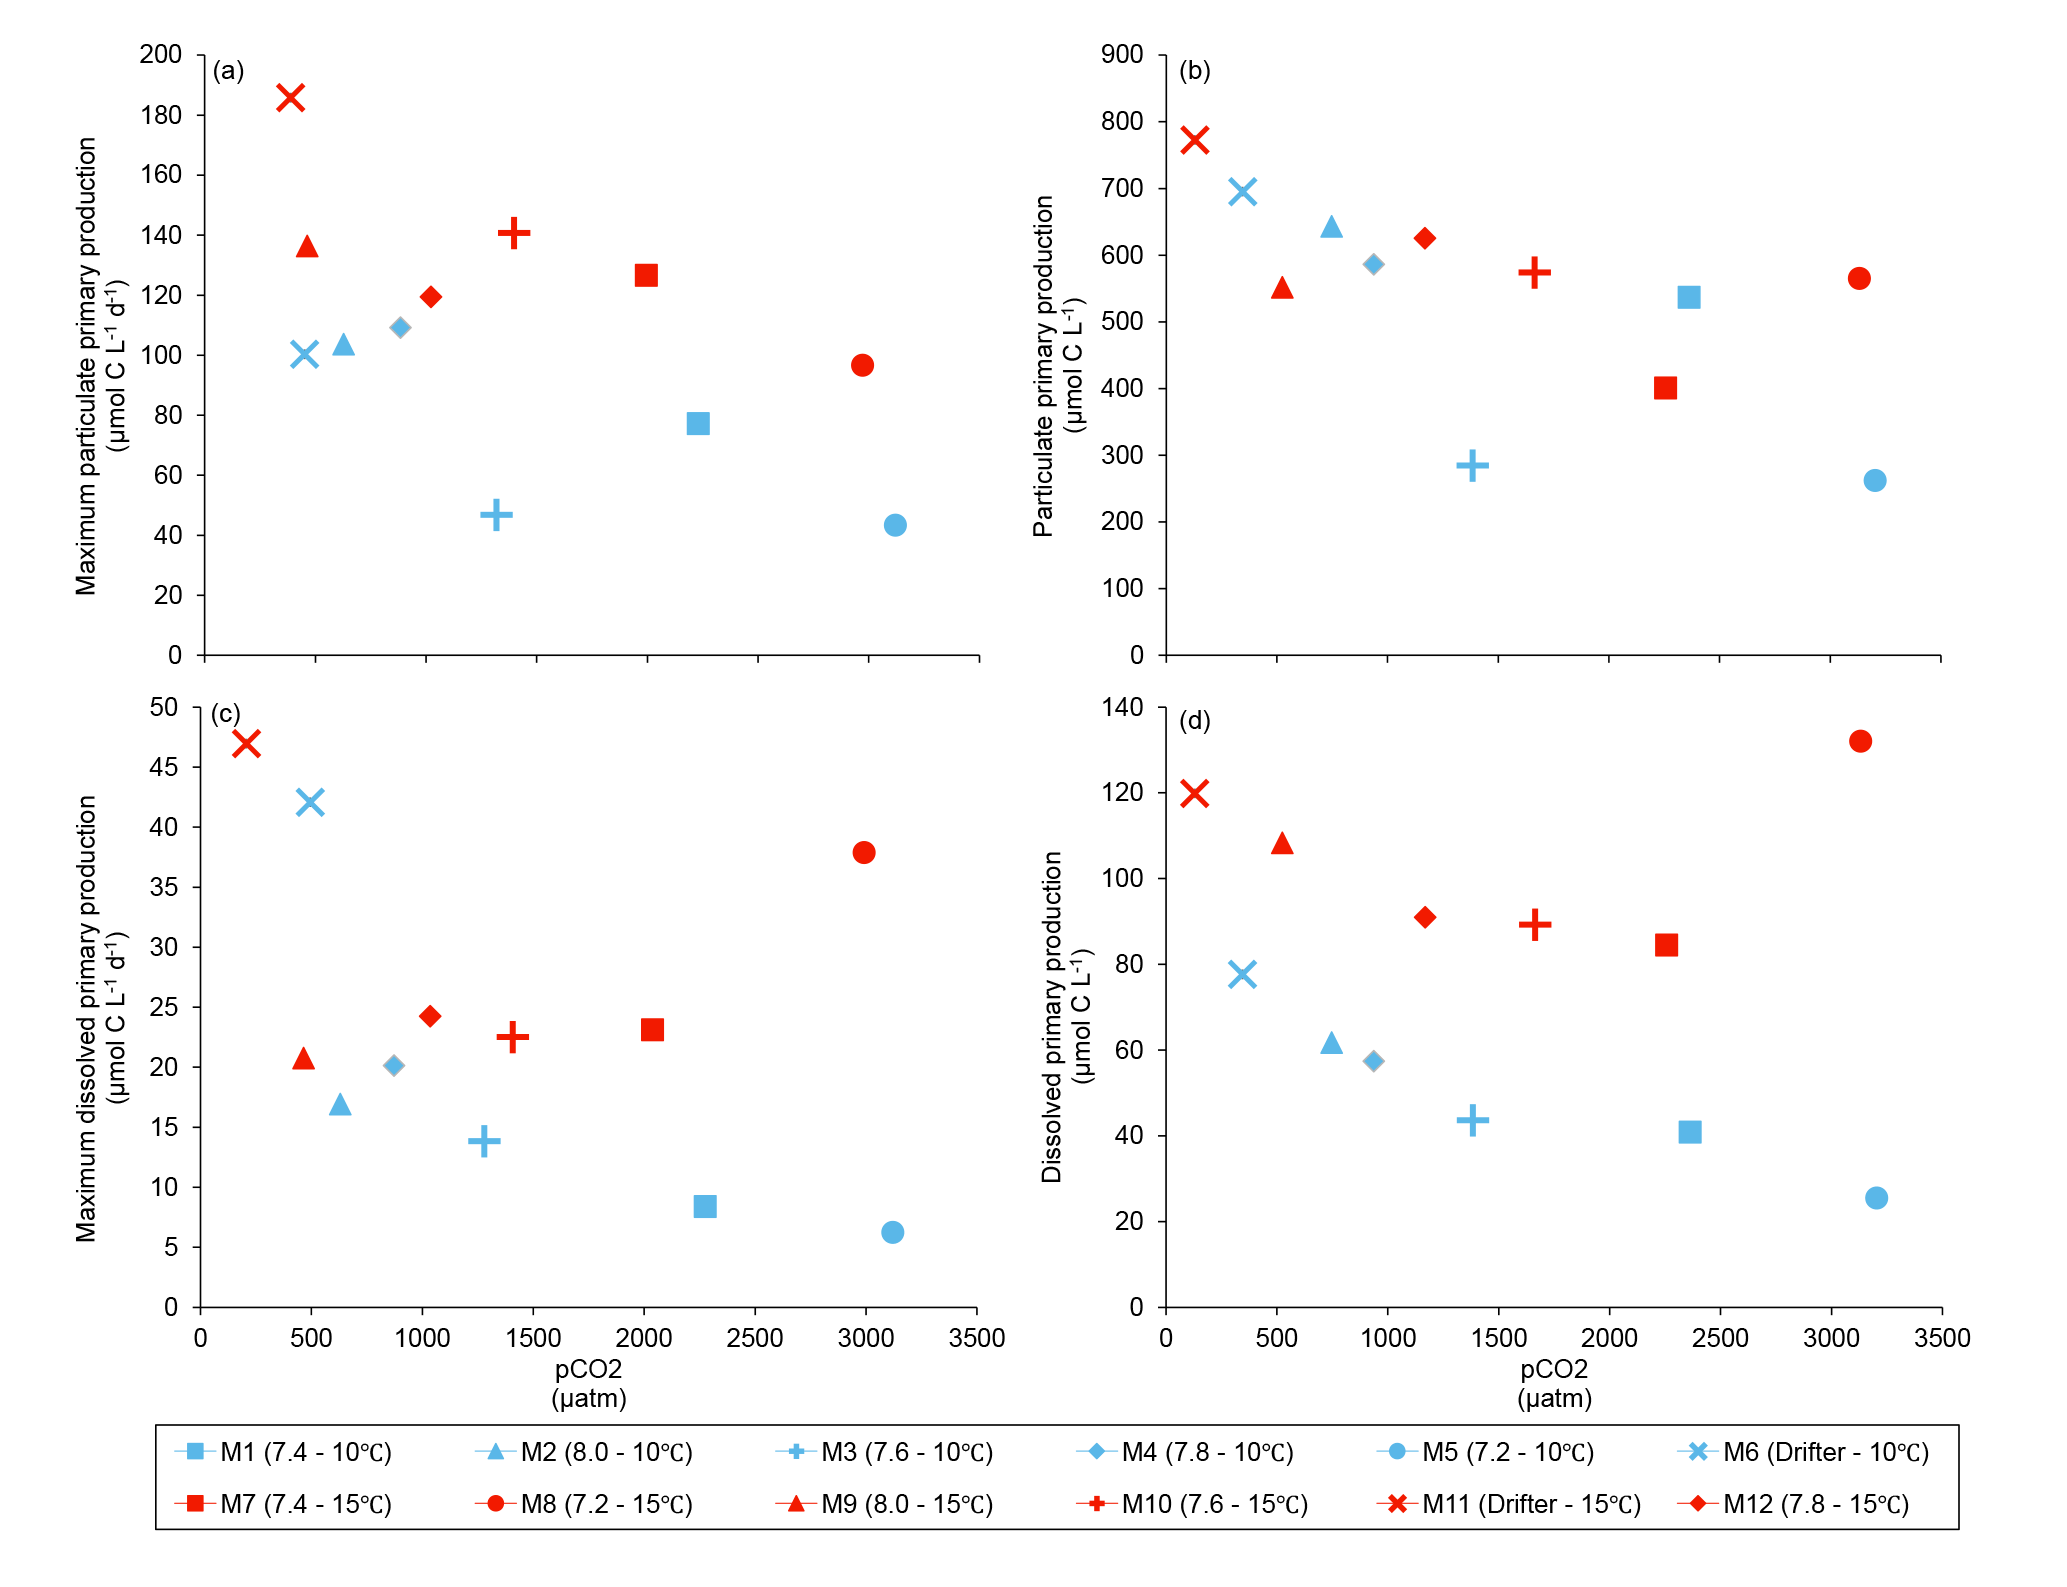
Figure 8(a) Maximum particulate primary production, (b) time-integrated particulate primary production, (c) maximum dissolved primary production, and (d) time-integrated dissolved primary production over the full course of the experiment (day 0 to day 13). For symbol attribution to treatments, see legend.
PD was low at the beginning of the experiment, averaging 1.5±0.4 µmol C L−1 d−1, increased progressively during Phase I to reach maximum values of 6–48 µmol C L−1 d−1 between days 4 and 8, and decreased thereafter (Fig. 7d). Time-integrated PD was not significantly affected by the pCO2 gradient, the temperature, and the pCO2 × temperature interaction during the two phases (Fig. 7e, f; Tables 2 and 4). Chl a-normalized PD was low on day 0, averaging 0.3±0.1 µmol C (µg Chl a)−1 d−1, reached maximum values of 1.0±0.2 µmol C (µg Chl a)−1 d−1 and 1.6±0.2 µmol C (µg Chl a)−1 d−1 at 10 and 15 ∘C, and then, respectively, decreased to 0.17±0.05 µmol C (µg Chl a)−1 d−1 and 0.6±0.2 µmol C (µg Chl a)−1 d−1 by the end of the experiment (Fig. 7j). During Phase I, the mean Chl a-normalized PD was affected by neither the pCO2 gradient, nor the temperature, nor the interaction between those factors (Fig. 7k; Table 2). During Phase II, the log of the mean Chl a-normalized PD was not affected by pCO2 at either temperature tested, but significantly increased with warming (Fig. 7l; Table 4).
Figure 6 shows the influence of the treatments on maximum PP and PD as well as on the time-integrated PP and PD over the full length of the experiment. We found no effect of the pCO2 gradient on the maximum PP values at the two temperatures tested, but warming increased the maximum PP values from 66±13 µmol C L−1 d−1 to 126±8 µmol C L−1 d−1 (Fig. 8a; Table 5). The time-integrated PP over the full duration of the experiment was not affected by the pCO2 gradient or the increase in temperature (Fig. 8b; Table 5). The maximum PD values were significantly affected by the treatments (Fig. 8c; Table 5). Maximum PD decreased with increasing pCO2 at in situ temperature, but warming cancelled this effect (antagonistic effect). Nevertheless, the time-integrated PD over the whole experiment did not vary significantly between treatments, although a decreasing tendency with increasing pCO2 at 10 ∘C and an increasing tendency with warming can be seen in Fig. 8d (Table 5).
4.1 General characteristics of the bloom
The onset of the experiment was marked by an increase in pCO2 on the day following the filling of the mesocosms. This phenomenon often takes place at the beginning of such experiments when pumping tends to break phytoplankton cells and larger debris into smaller ones. We attribute the rapid fluctuations in pCO2 to the release of organic matter following the filling of the mesocosms with a stimulating effect on heterotrophic respiration, and hence CO2 production. Then, a phytoplankton bloom, numerically dominated by the centric diatom S. costatum, took place in all mesocosms, regardless of treatments (Fig. 6). S. costatum is a common phytoplankton species in the St. Lawrence Estuary and in coastal waters (Kim et al., 2004; Starr et al., 2004; Annane et al., 2015). The length of the experiment (13 days) allowed us to capture both the development and declining phases of the bloom. The exponential growth phases lasted 1–4 days depending on the treatments, but maximal Chl a concentrations were reached only after 7 days in 2 of the 12 mesocosms (Fig. 4a; Table 1). The suite of measurements and statistical tests conducted did not provide any clues as to the underlying causes of the lower rates of biomass accumulation measured in these two mesocosms. Since statistical analyses conducted with or without these two apparent outliers gave similar results, they were not excluded from the analyses.
In situ nutrient conditions prior to the water collection were favourable for a bloom development. Based on previous studies, in situ phytoplankton growth was probably limited by light due to water turbidity and vertical mixing at the time of water collection (Levasseur et al., 1984). Grazing may also have played a role in keeping the in situ biomass of flagellates low prior to our sampling. However, a natural diatom fall bloom was observed in the days following the water collection in the adjacent region (Gustavo Ferreyra, personal communication, 2014). The increased stability within the mesocosms, combined with the reduction of the grazing pressure (filtration on 250 µm), likely contributed to the fast accumulation of phytoplankton biomass. During the development phase of the bloom, the concentration of all three monitored nutrients decreased, with and Si(OH)4 reaching undetectable values. This nutrient co-depletion is consistent with results from previous studies suggesting a co-limitation of diatom blooms by these two nutrients in the St. Lawrence Estuary (Levasseur et al., 1987, 1990). Variations in PP roughly followed changes in Chl a, and, as expected, the maximum Chl a-normalized PP (5±2 µmol C (µg Chl a)−1 d−1) was reached during the exponential growth phase in all mesocosms. Decreases in total phytoplankton abundances and PP followed the bloom peaks and the timing of the and Si(OH)4 depletions. A clear succession in phytoplankton size classes characterized the experiment. Nanophytoplankton cells were initially present in low abundance and became more numerous as the S. costatum diatom bloom developed. The correlation (r2=0.83, p<0.001, df=34) between the abundance of nanophytoplankton and S. costatum enumeration suggests that this cell size class can be used as a proxy of S. costatum counts in all mesocosms throughout the experiment. Nanophytoplankton cells accounted for 79±7 % of total counts of cells <20 µm on the day of the maximum Chl a concentration. Accordingly, nanophytoplankton exhibited the same temporal trend as Chl a concentrations. During Phase II, nanophytoplankton abundances remained roughly stable at in situ temperature, but decreased at 15 ∘C towards the end of the experiment. Photosynthetic picoeukaryotes were originally abundant and decreased throughout the experiment, whereas picocyanobacteria abundances increased during Phase II. This is a typical phytoplankton succession pattern for temperate systems where an initial diatom bloom growing essentially on allochthonous nitrate gives way to smaller species growing on regenerated forms of nitrogen (Taylor et al., 1993).
4.2 Phase I (diatom bloom development)
Our results show no significant effect of increasing pCO2/decreasing pH on the mean abundance and net accumulation rate of the diatom-dominated nanophytoplankton assemblage during the development of the bloom (Figs. 4e and 5c). These results suggest that S. costatum, the species accounting for most of the biomass accumulation during the bloom, neither benefited from the higher pCO2 nor was negatively impacted by the lowering of pH. Assuming that S. costatum was also responsible for most of the carbon fixation during the bloom development phase, the absence of effect on PP and Chl a-normalized PP following increases in pCO2 brings additional support to our conclusion. S. costatum operates a highly efficient CCM, minimizing the potential benefits of thriving in high CO2 waters (Trimborn et al., 2009). This may explain why the strain present in the LSLE did not benefit from the higher pCO2 conditions. Likewise, a mesocosm experiment conducted in the coastal North Sea showed no significant effect of increasing pCO2 on carbon fixation during the development of the spring diatom bloom (Eberlein et al., 2017).
In addition to the aforementioned insensitivity to increasing pCO2, our results point towards a strong resistance of S. costatum to severe pH decline. During our study, surprisingly constant rates of Chl a accumulation and nanophytoplankton growth (Fig. 5a, c), as well as maximum PP (Fig. 8a), were measured during the development phase of the bloom over a range of pHT extending from 8.6 to 7.2 (Fig. 3a). In a recent effort to estimate the causes and amplitudes of short-term variations in pHT in the LSLE, Mucci et al. (2018) showed that pHT in surface waters was constrained within a range of 7.85 to 7.93 during a 50 h survey over two tidal cycles at the head of the Laurentian Channel. It is notable that even the upwelling of water from 100 m depth or of low-oxygen LSLE bottom water would not decrease pHT beyond ∼ 7.75 and ∼ 7.62, respectively (Mucci et al., 2018, and references therein). Our results show that the phytoplankton assemblage responsible for the fall bloom may tolerate even greater pHT excursions. In the LSLE, such conditions may arise when the contribution of the low pHT (7.12) freshwaters of the Saguenay River to the LSLE surface waters is amplified during the spring freshet. However, considering that comparable studies conducted in different environments have reported negative effects of decreasing pH on diatom biomass accumulation (Hare et al., 2007; Hopkins et al., 2010; Schulz et al., 2013), it cannot be concluded that all diatom species thriving in the LSLE are insensitive to acidification.
In contrast to the pCO2 treatment, warming affected the development of the bloom in several ways. Increasing temperature by 5 ∘C significantly increased the accumulation rate of Chl a and the nanophytoplankton growth rate during Phase I of the bloom. The positive effects of warming on maximum PP during the development phase of the bloom most likely reflect the sensitivity of photosynthesis to temperature (Sommer and Lengfellner, 2008; Kim et al., 2013). It could also be related to optimal growth temperatures, which are often higher than in situ temperatures in marine phytoplankton (Thomas et al., 2012; Boyd et al., 2013). In support of this hypothesis, previous studies have reported optimal growth temperatures of 20–25 ∘C for S. costatum, which is 5–10 ∘C higher than the warmer treatment investigated in our study (Suzuki and Takahashi, 1995; Montagnes and Franklin, 2001). Extrapolating results from a mesocosm experiment to the field is not straightforward, as little is known of the projected warming of the upper waters of the LSLE in the next decades. In the Gulf of St. Lawrence, positive temperature anomalies in surface waters have varied from 0.25 to 0.75 ∘C per decade between 1985 and 2013 (Larouche and Galbraith, 2016). In the LSLE, warming of surface waters will likely result from a complex interplay between heat transfer at the air–water interface and variations in vertical mixing and upwelling of the cold intermediate layer at the head of the estuary (Galbraith et al., 2014). Considering current uncertainties regarding future warming of the LSLE, studies should be conducted over a wider range of temperatures in order to better constrain the potential effect of warming on the development of the blooms in the LSLE.
Picoeukaryotes showed a more or less gradual decrease in abundance during Phase I, and our results show that this decline was not influenced by the increases in pCO2 (Fig. 4g, h; Table 2). Picoeukaryotes are expected to benefit from high pCO2 conditions even more so than diatoms as CO2 can passively diffuse through their relatively thin boundary layer, precluding the necessity of a costly uptake mechanism such as a CCM (Schulz et al., 2013). This hypothesis has been supported by several studies showing a stimulating effect of pCO2 on picoeukaryote growth (Bach et al., 2016; Hama et al., 2016; Schulz et al., 2017, and references therein). On the other hand, in nature, the abundance of picoeukaryotes generally results from a delicate balance between cell division rates and cell losses through microzooplankton grazing and viral attacks. The few experiments, including the current study, reporting the absence or a modest effect of increasing pCO2 on the abundance of eukaryotic picoplankton attribute their observations to an increase in nano- and micro-zooplankton grazing (Rose et al., 2009; Neale et al., 2014). During our experiment, the biomass of microzooplankton increased with increasing pCO2 by ca. 200–300 % at the two temperatures tested (Gustavo Ferreyra and Mohamed Lemlih, unpublished data). Thus, it is possible that a positive effect of increasing pCO2 and warming on picoeukaryote abundances might have been masked by higher picoeukaryote losses due to increased microzooplankton grazing.
4.3 Phase II (declining phase of the bloom)
The gradual decrease in nanophytoplankton abundances coincided with an increase in the abundance of picocyanobacteria (Fig. 4j). At in situ temperature, the picocyanobacteria abundance during Phase II was unaffected by the increase in pCO2 over the full range investigated (Fig. 4l; Table 4). The lack of a positive response of picocyanobacteria to elevated pCO2 was somewhat surprising considering that they have less efficient CCMs than diatoms (Schulz et al., 2013). Accordingly, several studies have reported a stimulation of the net growth rate of picocyanobacteria under elevated pCO2 in different environments (coastal Japan, Mediterranean Sea, and Raunejforden in Norway) and under different nutrient regimes, i.e. bloom and post-bloom conditions (Hama et al., 2016; Sala et al., 2016; Schulz et al., 2017). However, studies have also shown no direct effect of elevated pCO2 on the net growth of picocyanobacteria during studies conducted in the subtropical North Atlantic and the South Pacific (Law et al., 2012; Lomas et al., 2012). In our study, picocyanobacteria abundance was even reduced when high CO2 was combined with warming. Similar negative effects of CO2 on picocyanobacteria (particularly Synechococcus) have also been observed under later stages of bloom development, i.e. nutrient depletion, caused by either competition or grazing (Paulino et al., 2008; Hopkins et al., 2010). A potential increase in grazing pressure, following the rise in heterotrophic nanoflagellate abundance (e.g. choanoflagellates; Fig. 6b) measured under high pCO2 and warmer conditions, could explain the ostensible negative effect of increasing pCO2 on picocyanobacteria abundance in our experiment. Despite the absence of grazing measurements during our study, our results support the hypothesis that the potential for increased picocyanobacteria population growth under elevated pCO2 and temperature is partially dependent on different grazing pressures (Fu et al., 2007).
Neither warming nor acidification affected the net particulate carbon fixation during the declining phase of the bloom. In our study, the time-integrated PP and Chl a-normalized PP were not significantly affected by the increase in pCO2 during Phase II at the two temperatures tested (Fig. 7; Table 4). This result is surprising since nitrogen-limited cells have been shown to be more sensitive to acidification, resulting in a reduction in carbon fixation rates due to higher respiration (Wu et al., 2010; Gao and Campbell, 2014; Raven et al., 2014). Although our measurements do not allow us to discriminate between the contributions of the different phytoplankton size classes to carbon fixation, we can speculate that diatoms, which were still abundant during Phase II, contributed a significant fraction of the primary production. If so, these results suggest that S. costatum remained insensitive to OA even under nutrient stress. However, in contrast to Phase I, increasing the temperature by 5 ∘C during Phase II significantly increased the Chl a-normalized PD. The warming-induced increase in fixed carbon being released in the dissolved fraction likely stems from increased exudation by phytoplankton, or sloppy feeding/excretion following ingestion by grazers (Kim et al., 2011). The increase in fixed carbon released as dissolved organic carbon (DOC) measured during Phase II may also result from greater respiration by the nitrogen-limited diatoms during periods of darkness of the incubations, as dark phytoplankton respiration rates generally increase with temperature (Butrón et al., 2009; Robarts and Zohary, 1987). Moreover, the enclosures do not permit the sinking and export of particulate organic carbon (POC), allowing a further transformation into DOC by heterotrophic bacteria, a process that could be exacerbated under warming (Wohlers et al., 2009).
4.4 Effect of the treatments on primary production over the full experiment
As mentioned above, increasing pCO2 had no effect on time-integrated PP during the two phases of the bloom, and warming only affected the maximum PP. As a result, primary production rates integrated over the whole duration of the experiment were not significantly different between the two temperatures tested. Although not statistically significant, the time-integrated PD over the full experiment displays a slight decrease with increasing pCO2 at 10 ∘C and overall higher values in the warmer treatment (Fig. 8d; Table 5). Previous studies have reported increases in DOC exudation (Engel et al., 2013), but also decreasing DOC concentrations at elevated pCO2 under nitrate limitation (Yoshimura et al., 2014). The increase in DOC exudation is attributed to a stimulation of photosynthesis resulting from its sensitivity to higher pCO2 (Engel et al., 2013), but the causes of a decrease in DOC concentrations at high pCO2 are less clear and potentially attributable to an increase in transparent exopolymer particle (TEP) production (Yoshimura et al., 2014). Elevated TEP production under high pCO2 conditions has been measured at both the peak of a bloom in a mesocosm study (Engel et al., 2014) and in post-bloom nutrient-depleted conditions (MacGilchrist et al., 2014). However, during our study, TEP production decreased under high pCO2 (Gaaloul, 2017). Thus, the apparent decrease in PD cannot be attributed to a greater conversion of exuded dissolved carbohydrate into TEP. The apparent rise in PD under warming is consistent with previous studies reporting similar increases in phytoplankton dissolved carbon release with temperature (Morán et al., 2006; Engel et al., 2011). Although these apparent changes in PD with increasing pCO2 and warming require further investigations, they suggest that a larger proportion (∼15 % of PT at 15 ∘C compared to 10 % at 10 ∘C) of the newly fixed carbon could be exuded and become available for heterotrophic organisms under warmer conditions.
4.5 Implications and limitations
During our study, we chose to keep the pH constant during the whole experiment instead of allowing it to vary with changes in photosynthesis and respiration during the bloom phases. This approach differs from previous mesocosm experiments where generally no subsequent CO2 manipulations are conducted after the initial targets are attained (Schulz et al., 2017, and references therein). Keeping the pH and pCO2 conditions stable during our study allowed us to precisely quantify the effect of the changing pH/pCO2 on the processes taking place during the different phases of the bloom. Such control was not exercised in two of our mesocosms (i.e. the Drifters). In these two mesocosms, the pHT increased from 7.9 to 8.3 at 10 ∘C, and from 7.9 to 8.7 at 15 ∘C. Since the buffer capacity of acidified waters diminishes with increasing CO2, the drift in pCO2 and pH due to biological activity would have been even greater in the more acidified treatments (Delille et al., 2005; Riebesell et al., 2007). Hence, allowing the pH to drift in all mesocosms would have likely ended in an overlapping of the treatments where acidification effects would have been harder to detect. Thus, our experiment could be considered an intermediate one between strictly controlled small-scale laboratory experiments and large-scale pelagic mesocosm experiments in which only the initial conditions are set. By limiting pCO2 decrease under high CO2 drawdown due to photosynthesis during the development of the bloom phase, we minimise confounding effects of pCO2 potentially overlapping in association with high biological activity in the mesocosms. Hence, the experimental conditions could be considered extreme examples of acidification conditions, due to the extent of pCO2 values studied. However, the absence of OA effects on most biological parameters measured during our study, even under these extreme conditions, strengthens the argument that the phytoplankton community in LSLE is resistant to OA.
Our results reveal a remarkable resistance of the different phytoplankton size classes to the large range of pCO2/pH investigated during our study. It is noteworthy that the plankton assemblage was subjected to decreases in pH far exceeding those that they are regularly exposed to in the LSLE. The resistance of S. costatum to the pCO2 treatments suggests that the acidification of surface waters of the LSLE will not affect the development rate and the amplitude of fall blooms dominated by this species. Photosynthetic picoeukaryotes and picocyanobacteria thriving alongside the blooming diatoms were also insensitive to acidification. In contrast to the pCO2 treatments, warming the water by 5 ∘C had multiple impacts on the development and decline of the bloom. The 5 ∘C warming hastened the development of the diatom bloom (albeit with no increase in total cell number) and increased the abundance of picocyanobacteria during Phase II despite a reduction under high pCO2. These temperature-induced variations in the phytoplankton assemblage were accompanied by an increase in maximal PP and suggest a potential increase in PD under warming, although no significant changes in time-integrated PP and PD were observed over the phases or the full temporal scale of the experiment. Overall, our results indicate that warming could have more important impacts than acidification on phytoplankton bloom development in the LSLE in the next decades. Future studies should be conducted and specifically designed to better constrain the potential effects of warming on phytoplankton succession and primary production in the LSLE.
The data are freely accessible via https://doi.org/10.1594/PANGAEA.886887 (Bénard et al., 2018), or can be obtained by contacting the author (robin.benard.1@ulaval.ca).
RB was responsible for the experimental design elaboration, data sampling and processing, and redaction of this article. Several coauthors supplied specific data for this article, including carbonate chemistry data provided by AM, inorganic nutrient data from MAB and JÉT, and picophytoplankton and nanophytoplankton cell counts from MS. All co-authors contributed to the final version of this article.
The authors declare that they have no conflict of interest.
The authors wish to thank Station Aquicole ISMER, especially Nathalie Morin
and her staff, for their support during the project. We also wish to
acknowledge Gilles Desmeules, Bruno Cayouette, Sylvain Blondeau, Claire Lix,
Rachel Hussherr, Liliane St-Amand, Marjolaine Blais, Armelle Simo, and
Sonia Michaud for their help in setting up, sampling, and processing samples
during the experiment. The authors want to thank Jean-Pierre Gattuso for his
constructive comments on an earlier draft of the manuscript. This study was
funded by a Team grant from the Fonds de la Recherche du Québec – Nature
et Technologies (FRQNT-Équipe-165335), the Canada Foundation for
Innovation, and the Canada Research Chair on Ocean Biogeochemistry and
Climate. This is a contribution to the research programme of
Québec-Océan.
Edited by: Katja
Fennel
Reviewed by: two anonymous referees
Annane, S., St-Amand, L., Starr, M., Pelletier, E., and Ferreyra, G. A.: Contribution of transparent exopolymeric particles (TEP) to estuarine particulate organic carbon pool, Mar. Ecol.-Prog. Ser., 529, 17–34, https://doi.org/10.3354/meps11294, 2015.
Bach, L. T., Taucher, J., Boxhammer, T., Ludwig, A., Aberle-Malzahn, N., Abrahamsson, K., Almén, A. K., Asplund, M. E., Audritz, S., Boersma, M., Breitbarth, E., Bridges, C., Brussaard, C., Brutemark, A., Clemmesen, C., Collins, S., Crawfurd, K., Dahlke, F., Deckelnick, M., Dittmar, T., Doose, R., Dupont, S., Eberlein, T., Endres, S., Engel, A., Engström-Öst, J., Febiri, S., Fleischer, D., Fritsche, P., Gledhill, M., Göttler, G., Granberg, M., Grossart, H. P., Grifos, A., Hoffmann, L., Karlsson, A., Klages, M., John, U., Jutfelt, F., Köster, I., Lange, J., Leo, E., Lischka, S., Lohbeck, K., Lundve, B., Mark, F. C., Meyerhöfer, M., Nicolai, M., Pansch, C., Petersson, B., Reusch, T., De Moraes, K. R., Schartau, M., Scheinin, M., Schulz, K. G., Schwarz, U., Stenegren, M., Stiasny, M., Storch, D., Stuhr, A., Sswat, L., Svensson, M., Thor, P., Voss, M., Van De Waal, D., Wannicke, N., Wohlrab, S., Wulff, A., Achterberg, E. P., Algueró-Muñiz, M., Anderson, L. G., Bellworthy, J., Büdenbender, J., Czerny, J., Ericson, Y., Esposito, M., Fischer, M., Haunost, M., Hellemann, D., Horn, H. G., Hornick, T., Meyer, J., Sswat, M., Zark, M., and Riebesell, U.: Influence of ocean acidification on a natural winter-to-summer plankton succession: First insights from a long-term mesocosm study draw attention to periods of low nutrient concentrations, PLoS ONE, 11, 1–33, https://doi.org/10.1371/journal.pone.0159068, 2016.
Beardall, J., Stojkovic, S., and Gao, K.: Interactive effects of nutrient supply and other environmental factors on the sensitivity of marine primary producers to ultraviolet radiation: Implications for the impacts of global change, Aquat. Biol., 22, 5–23, https://doi.org/10.3354/ab00582, 2014.
Bénard, R., Levasseur, M., Scarratt, M. G., Blais, M.-A., Mucci, A., Ferreyra, G. A., Starr, M., Gosselin, M., Tremblay, J.-É., and Lizotte, M.: Experimental assessment of the St. Lawrence Estuary phytoplankton fall bloom sensitivity to acidification and warming, PANGAEA, https://doi.org/10.1594/PANGAEA.886887, 2018.
Bérard-Therriault, L., Poulin, M., and Bossé, L.: Guide d'identification du phytoplancton marin de l'estuaire et du golfe du Saint-Laurent incluant également certains protozoaires, Canadian Special Publication of Fisheries and Aquatic Sciences, 128, 1–387, 1999.
Boyd, P. W. and Hutchins, D. A.: Understanding the responses of ocean biota to a complex matrix of cumulative anthropogenic change, Mar. Ecol.-Prog. Ser., 470, 125–135, https://doi.org/10.3354/meps10121, 2012.
Boyd, P. W., Rynearson, T. A., Armstrong, E. A., Fu, F., Hayashi, K., Hu, Z., Hutchins, D. A., Kudela, R. M., Litchman, E., Mulholland, M. R., Passow, U., Strzepek, R. F., Whittaker, K. A., Yu, E., and Thomas, M. K.: Marine Phytoplankton temperature versus growth responses from polar to tropical waters – outcome of a scientific community-wide study, PLoS ONE, 8, https://doi.org/10.1371/journal.pone.0063091, 2013.
Boyd, P. W., Lennartz, S. T., Glover, D. M., and Doney, S. C.: Biological ramifications of climate-change-mediated oceanic multi-stressors, Nat. Clim. Change, 5, 71–79, https://doi.org/10.1038/nclimate2441, 2015.
Brussaard, C. P. D., Noordeloos, A. A. M., Witte, H., Collenteur, M. C. J., Schulz, K., Ludwig, A., and Riebesell, U.: Arctic microbial community dynamics influenced by elevated CO2 levels, Biogeosciences, 10, 719–731, https://doi.org/10.5194/bg-10-719-2013, 2013.
Butrón, A., Iriarte, A., and Madariaga, I.: Size-fractionated phytoplankton biomass, primary production and respiration in the Nervión-Ibaizabal estuary: A comparison with other nearshore coastal and estuarine ecosystems from the Bay of Biscay, Cont. Shelf Res., 29, 1088–1102, https://doi.org/10.1016/j.csr.2008.11.013, 2009.
Byrne, R. H.: Standardization of Standard Buffers by Visible Spectrometry, Anal. Chem, 59, 1479–1481, https://doi.org/10.1021/ac00137a025, 1987.
Cai, W. J. and Wang, Y.: The chemistry, fluxes, and sources of carbon dioxide in the estuarine waters of the Satilla and Altamaha Rivers, Georgia, Limnol. Oceanogr., 43, 657–668, https://doi.org/10.4319/lo.1998.43.4.0657, 1998.
Caldeira, K. and Wickett, M. E.: Ocean model predictions of chemistry changes from carbon dioxide emissions to the atmosphere and ocean, J. Geophys. Res., 110, 1–12, https://doi.org/10.1029/2004JC002671, 2005.
Clayton, T. D. and Byrne, R. H.: Spectrophotometric seawater pH measurements: total hydrogen ion concentration scale calibration of m-cresol purple and at-sea results, Deep-Sea Res. Pt. I, 40, 2115–2129, https://doi.org/10.1016/0967-0637(93)90048-8, 1993.
d'Anglejan, B.: Recent sediments and sediment transport processes in the St. Lawrence Estuary, in: Oceanography of a large-scale estuarine system, edited by: El-Sabh, M. I. and Silverberg, N., Springer-Verlag, New York, USA, 109–129, https://doi.org/10.1007/978-1-4615-7534-4_6, 1990.
Delille, B., Harlay, J., Zondervan, I., Jacquet, S., Chou, L., Wollast, R., Bellerby, R. G. J., Frankignoulle, M., Borges, A. V., Riebesell, U., and Gattuso, J. P.: Response of primary production and calcification to changes of pCO2 during experimental blooms of the coccolithophorid Emiliania huxleyi, Global Biogeochem. Cy., 19, 1–14, https://doi.org/10.1029/2004GB002318, 2005.
Dickson, A. G.: Standard potential of the reaction: AgCl(s) + 1 2H2(g) = Ag(s) + HCl(aq) and the standard acidity constant of the ion HSO in synthetic sea water from 273.15 to 318.15 K, J. Chem. Thermodyn., 22, 113–127, https://doi.org/10.1016/0021-9614(90)90074-Z, 1990.
Dinauer, A. and Mucci, A.: Spatial variability in surface-water pCO2 and gas exchange in the world's largest semi-enclosed estuarine system: St. Lawrence Estuary (Canada), Biogeosciences, 14, 3221–3237, https://doi.org/10.5194/bg-14-3221-2017, 2017.
Doney, S. C., Fabry, V. J., Feely, R. A., and Kleypas, J. A.: Ocean acidification: The other CO2 problem, Annu. Rev. Mar. Sci., 1, 169–192, https://doi.org/10.1146/annurev.marine.010908.163834, 2009.
Duarte, C. M., Hendriks, I. E., Moore, T. S., Olsen, Y. S., Steckbauer, A., Ramajo, L., Carstensen, J., Trotter, J. A., and McCulloch, M.: Is ocean acidification an open-ocean syndrome? Understanding anthropogenic impacts on seawater pH, Estuaries Coasts, 36, 221–236, https://doi.org/10.1007/s12237-013-9594-3, 2013.
Eberlein, T., Wohlrab, S., Rost, B., John, U., Bach, L. T., Riebesell, U., and Van De Waal, D. B.: Effects of ocean acidification on primary production in a coastal North Sea phytoplankton community, PLoS ONE, 12, e0172594, https://doi.org/10.1371/journal.pone.0172594, 2017.
Engel, A., Zondervan, I., Aerts, K., Beaufort, L., Benthien, A., Chou, L., Delille, B., Gattuso, J.-P., Harlay, J., Heeman, C., Hoffmann, L., Jacquet, S., Nejstgaard, J., Pizay, M.-D., Rochelle-Newall, E., Schneider, U., Terbrueggen A., and Riebesell, U.: Testing the direct effect of CO2 concentration on a bloom of the coccolithophorid Emiliania huxleyi in mesocosm experiments, Limnol. Oceanogr., 50, 493–507, https://doi.org/10.4319/lo.2005.50.2.0493, 2005.
Engel, A., Händel, N., Wohlers, J., Lunau, M., Grossart, H.-P., Sommer, U., and Riebesell, U.: Effects of sea surface warming on the production and composition of dissolved organic matter during phytoplankton blooms: Results from a mesocosm study, J. Plankton Res., 33, 357–372, https://doi.org/10.1093/plankt/fbq122, 2011.
Engel, A., Borchard, C., Piontek, J., Schulz, K. G., Riebesell, U., and Bellerby, R.: CO2 increases 14C primary production in an Arctic plankton community, Biogeosciences, 10, 1291–1308, https://doi.org/10.5194/bg-10-1291-2013, 2013.
Engel, A., Piontek, J., Grossart, H.-P., Riebesell, U., Schulz, K. G., and Sperling, M.: Impact of CO2 enrichment on organic matter dynamics during nutrient induced coastal phytoplankton blooms, J. Plankton Res., 36, 641–657, https://doi.org/10.1093/plankt/fbt125, 2014.
Feely, R. A., Doney, S. C., and Cooley, S. R.: Ocean acidification: present conditions and future changes in a high-CO2 world, Oceanography, 22, 36–47, https://doi.org/10.5670/oceanog.2009.95, 2009.
Feng, Y., Hare, C. E., Leblanc, K., Rose, J. M., Zhang, Y., DiTullio, G. R., Lee, P. A., Wilhelm, S. W., Rowe, J. M., Sun, J., Nemcek, N., Gueguen, C., Passow, U., Benner, I., Brown, C., and Hutchins, D. A.: Effects of increased pCO2 and temperature on the North Atlantic spring bloom. I. The phytoplankton community and biogeochemical response, Mar. Ecol.-Prog. Ser., 388, 13–25, https://doi.org/10.3354/meps08133, 2009.
Ferland, J., Gosselin, M., and Starr, M.: Environmental control of summer primary production in the Hudson Bay system: The role of stratification, J. Marine Syst., 88, 385–400, https://doi.org/10.1016/j.jmarsys.2011.03.015, 2011.
Fu, F. X., Warner, M. E., Zhang, Y., Feng, Y., and Hutchins, D. A.: Effects of increased temperature and CO2 on photosynthesis, growth, and elemental ratios in marine Synechococcus and Prochlorococcus (Cyanobacteria), J. Phycol., 43, 485–496, https://doi.org/10.1111/j.1529-8817.2007.00355.x, 2007.
Gaaloul, H.: Effets du changement global sur les particules exopolymériques transparentes au sein de l'estuaire maritime du Saint-Laurent, M.Sc. thesis, Université du Québec à Rimouski, Canada, 133 pp., 2017.
Galbraith, P. S., Chassé, J., Gilbert, D., Larouche, P., Caverhill, C., Lefaivre, D., Brickman, D., Pettigrew, B., Devine, L., and Lafleur, C.: Physical Oceanographic Conditions in the Gulf of St. Lawrence in 2013, DFO Can. Sci. Advis. Sec. Res. Doc., 2014/062 (November), vi + 84 pp., 2014.
Gao, G., Jin, P., Liu, N., Li, F., Tong, S., Hutchins, D. A., and Gao, K.: The acclimation process of phytoplankton biomass, carbon fixation and respiration to the combined effects of elevated temperature and pCO2 in the northern South China Sea, Mar. Pollut. Bull., 118, 213–220, https://doi.org/10.1016/j.marpolbul.2017.02.063, 2017.
Gao, K. and Campbell, D. A.: Photophysiological responses of marine diatoms to elevated CO2 and decreased pH: A review, Funct. Plant Biol., 41, 449–459, https://doi.org/10.1071/FP13247, 2014.
Gattuso, J. P., Mach, K. J., and Morgan, G.: Ocean acidification and its impacts: An expert survey, Climatic Change, 117, 725–738, https://doi.org/10.1007/s10584-012-0591-5, 2013.
Gattuso, J.-P., Magnan, A., Bille, R., Cheung, W. W. L., Howes, E. L., Joos, F., Allemand, D., Bopp, L., Cooley, S. R., Eakin, C. M., Hoegh-Guldberg, O., Kelly, R. P., Portner, H.-O., Rogers, A. D., Baxter, J. M., Laffoley, D., Osborn, D., Rankovic, A., Rochette, J., Sumaila, U. R., Treyer, S., and Turley, C.: Contrasting futures for ocean and society from different anthropogenic CO2 emissions scenarios, Science, 349, aac4722, https://doi.org/10.1126/science.aac4722, 2015.
Giordano, M., Beardall, J., and Raven, J. A.: CO2 concentrating mechanisms in algae: Mechanisms, environmental modulation., and evolution, Annu. Rev. Plant Biol., 56, 99–131, https://doi.org/10.1146/annurev.arplant.56.032604.144052, 2005.
Gunderson, A. R., Armstrong, E. J., and Stillman, J. H.: Multiple stressors in a changing World: The need for an improved perspective on physiological responses to the dynamic marine environment, Annu. Rev. Mar. Sci., 8, 357–378, https://doi.org/10.1146/annurev-marine-122414-033953, 2016.
Hama, T., Inoue, T., Suzuki, R., Kashiwazaki, H., Wada, S., Sasano, D., Kosugi, N., and Ishii, M.: Response of a phytoplankton community to nutrient addition under different CO2 and pH conditions, J. Oceanogr., 72, 207–223, https://doi.org/10.1007/s10872-015-0322-4, 2016.
Hansen, H. P. and Koroleff, F.: Determination of nutrients, in: Methods of Seawater Analysis, 3, edited by: Grasshoff K., Kremling, K., and Ehrhardt, M., Wiley-VCH Verlag GmbH, Weinheim, Germany, 159–228, https://doi.org/10.1002/9783527613984.ch10, 2007.
Hare, C. E., Leblanc, K., DiTullio, G. R., Kudela, R. M., Zhang, Y., Lee, P. A., Riseman, S., and Hutchins, D. A.: Consequences of increased temperature and CO2 for phytoplankton community structure in the Bering Sea, Mar. Ecol.-Prog. Ser., 352, 9–16, https://doi.org/10.3354/meps07182, 2007.
Havenhand, J., Dupont, S., and Quinn, G. P.: Designing ocean acidification experiments to maximise inference, in: Guide to best practices for ocean acidification research and data reporting, edited by: Riebesell, U., Fabry, V. J., and Gattuso, J.-P., Publications Office of the European Union, Luxembourg, 67–80, 2010.
Hopkins, F. E., Turner, S. M., Nightingale, P. D., Steinke, M., Bakker, D., and Liss, P. S.: Ocean acidification and marine trace gas emissions, P. Natl. Acad. Sci. USA, 107, 760–765, https://doi.org/10.1073/pnas.0907163107, 2010.
Hussherr, R., Levasseur, M., Lizotte, M., Tremblay, J.-É., Mol, J., Thomas, H., Gosselin, M., Starr, M., Miller, L. A., Jarniková, T., Schuback, N., and Mucci, A.: Impact of ocean acidification on Arctic phytoplankton blooms and dimethyl sulfide concentration under simulated ice-free and under-ice conditions, Biogeosciences, 14, 2407–2427, https://doi.org/10.5194/bg-14-2407-2017, 2017.
IPCC: Working Group I Contribution to the Fifth Assessment Report Climate Change 2013: The Physical Science Basis, Intergov. Panel Clim. Chang., 1535, Cambridge University Press, Cambridge, UK, https://doi.org/10.1017/CBO9781107415324, 2013.
Kim, J.-H., Kim, K. Y., Kang, E. J., Lee, K., Kim, J.-M., Park, K.-T., Shin, K., Hyun, B., and Jeong, H. J.: Enhancement of photosynthetic carbon assimilation efficiency by phytoplankton in the future coastal ocean, Biogeosciences, 10, 7525–7535, https://doi.org/10.5194/bg-10-7525-2013, 2013.
Kim, J. M., Lee, K., Shin, K., Yang, E. J., Engel, A., Karl, D. M., and Kim, H. C.: Shifts in biogenic carbon flow from particulate to dissolved forms under high carbon dioxide and warm ocean conditions, Geophys. Res. Lett., 38, L08612, https://doi.org/10.1029/2011GL047346, 2011.
Kim, K. Y., Garbary, D. J., and Mclachlan, J. L.: Phytoplankton dynamics in Pomquet Harbour, Nova Scotia: a lagoon in the southern Gulf of St Lawrence, Phycologica, 43, 311–328, 2004.
Knap, A., Michaels, A., Close, A. R., Ducklow, H., and Dickson, A. G.: Protocols for the Joint Global Ocean Flux Study (JGOFS) core measurements, JGOFS Rep No. 19, Reprint of the IOC Manuals and Guides No. 29, UNESCO, Bergen, Norway, 1996.
Kroeker, K. J., Kordas, R. L., Crim, R., Hendriks, I. E., Ramajo, L., Singh, G. S., Duarte, C. M., and Gattuso, J. P.: Impacts of ocean acidification on marine organisms: Quantifying sensitivities and interaction with warming, Glob. Change Biol., 19, 1884–1896, https://doi.org/10.1111/gcb.12179, 2013.
Larouche, P. and Galbraith, P. S.: Canadian coastal seas and Great Lakes sea surface temperature climatology and recent trends, Can. J. Remote Sens., 42, 243–258, https://doi.org/10.1080/07038992.2016.1166041, 2016.
Law, C. S., Breitbarth, E., Hoffmann, L. J., McGraw, C. M., Langlois, R. J., Laroche, J., Marriner, A., and Safi, K. A.: No stimulation of nitrogen fixation by non-filamentous diazoytrophs under elevated CO2 in the South Pacific, Glob. Change Biol., 18, 3004–3014, 2012.
Legendre, L., Demers, S., Yentsch, C. M., and Yentsch, C. S.: The 14C method: Patterns of dark CO2 fixation and DCMU correction to replace the dark bottle, Limnol. Oceanogr., 28, 996–1003, https://doi.org/10.4319/lo.1983.28.5.0996, 1983.
Le Quéré, C., Moriarty, R., Andrew, R. M., Canadell, J. G., Sitch, S., Korsbakken, J. I., Friedlingstein, P., Peters, G. P., Andres, R. J., Boden, T. A., Houghton, R. A., House, J. I., Keeling, R. F., Tans, P., Arneth, A., Bakker, D. C. E., Barbero, L., Bopp, L., Chang, J., Chevallier, F., Chini, L. P., Ciais, P., Fader, M., Feely, R. A., Gkritzalis, T., Harris, I., Hauck, J., Ilyina, T., Jain, A. K., Kato, E., Kitidis, V., Klein Goldewijk, K., Koven, C., Landschützer, P., Lauvset, S. K., Lefèvre, N., Lenton, A., Lima, I. D., Metzl, N., Millero, F., Munro, D. R., Murata, A., Nabel, J. E. M. S., Nakaoka, S., Nojiri, Y., O'Brien, K., Olsen, A., Ono, T., Pérez, F. F., Pfeil, B., Pierrot, D., Poulter, B., Rehder, G., Rödenbeck, C., Saito, S., Schuster, U., Schwinger, J., Séférian, R., Steinhoff, T., Stocker, B. D., Sutton, A. J., Takahashi, T., Tilbrook, B., van der Laan-Luijkx, I. T., van der Werf, G. R., van Heuven, S., Vandemark, D., Viovy, N., Wiltshire, A., Zaehle, S., and Zeng, N.: Global Carbon Budget 2015, Earth Syst. Sci. Data, 7, 349–396, https://doi.org/10.5194/essd-7-349-2015, 2015.
Levasseur, M., Therriault, J.-C., and Legendre, L.: Hierarchical control of phytoplankton succession by physical factors, Mar. Ecol.-Prog. Ser., 19, 211–222, https://doi.org/10.3354/meps019211, 1984.
Levasseur, M. E. and Therriault, J.-C.: Phytoplankton biomass and nutrient dynamics in a tidally induced upwelling: the role of teh NO3 : SiO4 ratio, Mar. Ecol.-Prog. Ser., 39, 87–97, 1987.
Levasseur, M. E., Harrison, P. J., Heimdal, B. R., and Therriault, J.-C.: Simultaneous nitrogen and silicate deficiency of a phytoplankton community in a coastal jet-front, Mar. Biol., 104, 329–338, https://doi.org/10.1007/BF01313275, 1990.
Lomas, M. W., Hopkinson, B. M., Losh, J. L., Ryan, D. E., Shi, D. L., Xu, Y., and Morel, F. M. M.: Effect of ocean acidification on cyanobacteria in the subtropical North Atlantic, Aquat. Microb. Ecol., 66, 211–222, https://doi.org/10.3354/ame01576, 2012.
Lund, J. W. G., Kipling, C., and Le Cren, E. D.: The inverted microscope method of estimating algal numbers and the statistical basis of estimates by counting, Hydrobiologia, 11, 143–170, 1958.
MacGilchrist, G. A., Shi, T., Tyrrell, T., Richier, S., Moore, C. M., Dumousseaud, C., and Achterberg, E. P.: Effect of enhanced pCO2 levels on the production of dissolved organic carbon and transparent exopolymer particles in short-term bioassay experiments, Biogeosciences, 11, 3695–3706, https://doi.org/10.5194/bg-11-3695-2014, 2014.
Marie, D., Simon, N., and Vaulot, D.: Phytoplankton cell counting by flow cytometry, in: Algal culturing techniques, edited by: Andersen, R. A., Elsevier Academic Press, San Diego, USA, 253–267, 2005.
Maugendre, L., Gattuso, J. P., Louis, J., De Kluijver, A., Marro, S., Soetaert, K., and Gazeau, F.: Effect of ocean warming and acidification on a plankton community in the NW Mediterranean Sea, ICES J. Mar. Sci., 72, 1744–1755, https://doi.org/10.1093/icesjms/fsu161, 2015.
Millero, F. J.: The pH of estuarine waters, Limnol. Oceanogr., 31, 839–847, https://doi.org/10.4319/lo.1986.31.4.0839, 1986.
Montagnes, D. J. S. and Franklin, M.: Effect of temperature on diatom volume, growth rate, and carbon and nitrogen content: Reconsidering some paradigms, Limnol. Oceanogr., 46, 2008–2018, https://doi.org/10.4319/lo.2001.46.8.2008, 2001.
Morán, X. A. G., Alonso-Sáez, L., Nogueira, E., Ducklow, H. W., González, N., López-Urrutia, Á, Díaz-Pérez, L., Calvo-Díaz, A., Arandia-Gorostidi, N., and Huete-Stauffer, T. M.: More, smaller bacteria in response to ocean's warming?, P. R. Soc B, 282, 1–9, https://doi.org/10.1098/rspb.2015.0371, 2015.
Morán, X. A. G., Sebastián, M., Pedrós-Alió, C., and Estrada, M.: Response of Southern Ocean phytoplankton and bacterioplankton production to short-term experimental warming, Limnol. Oceanogr., 51, 1791–1800, https://doi.org/10.4319/lo.2006.51.4.1791, 2006.
Mucci, A., Levasseur, M., Gratton, Y., Martias, C., Scarratt, M., Gilbert, D., Tremblay, J.-É., Ferreyra, G., and Lansard, B.: Tidally-induced variations of pH at the head of the Laurentian Channel, Can. J. Fish. Aquat. Sci., 75, 1128–1141, https://doi.org/10.1139/cjfas-2017-0007, 2018.
Neale, P. J., Sobrino, C., Segovia, M., Mercado, J. M., Leon, P., Cortés, M. D., Tuite, P., Picazo, A., Salles, S., Cabrerizo, M. J., Prasil, O., Montecino, V., and Reul, A.: Effect of CO2, nutrients and light on coastal plankton. I. Abiotic conditions and biological responses, Aquat. Biol., 22, 25–41, https://doi.org/10.3354/ab00587, 2014.
Parsons, T. R., Maita, Y., and Lalli, C. M.: A manual of chemical and biological methods for seawater analysis, Permagon Press, New York, 1984.
Paul, C., Matthiessen, B., and Sommer, U.: Warming, but not enhanced CO2 concentration, quantitatively and qualitatively affects phytoplankton biomass, Mar. Ecol.-Prog. Ser., 528, 39–51, https://doi.org/10.3354/meps11264, 2015.
Paul, C., Sommer, U., Garzke, J., Moustaka-Gouni, M., Paul, A., and Matthiessen, B.: Effects of increased CO2 concentration on nutrient limited coastal summer plankton depend on temperature, Limnol. Oceanogr., 61, 853–868, https://doi.org/10.1002/lno.10256, 2016.
Paulino, A. I., Egge, J. K., and Larsen, A.: Effects of increased atmospheric CO2 on small and intermediate sized osmotrophs during a nutrient induced phytoplankton bloom, Biogeosciences, 5, 739–748, https://doi.org/10.5194/bg-5-739-2008, 2008.
Pierrot, D., Lewis, E., and Wallace, D. W. R.: MS Excel program developed for CO2 system calculations, Carbon Dioxide Information Analysis Center, ORNL/CDIAC-105a, Oak Ridge National Laboratory, US Department of Energy, Oak Ridge, 592 Tennessee, 2006.
Raven, J. A., Beardall, J., and Giordano, M.: Energy costs of carbon dioxide concentrating mechanisms in aquatic organisms, Photosynth. Res., 121, 111–124, 2014.
Riebesell, U. and Gattuso, J.-P.: Lessons learned from ocean acidification research, Nat. Clim. Change, 5, 12–14, https://doi.org/10.1038/nclimate2456, 2015.
Riebesell, U. and Tortell, P. D.: Effects of ocean acidification on pelagic organism and ecosystems, in: Ocean Acidification, edited by: Gattuso, J.-P. and Hansson L., Oxford University Press, New York, 99–121, 2011.
Riebesell, U., Schulz, K. G., Bellerby, R. G. J., Botros, M., Fritsche, P., Meyerhöfer, M., Neill, C., Nondal, G., Oschlies, A., Wohlers, J., and Zöllner, E.: Enhanced biological carbon consumption in a high CO2 ocean, Nature, 450, 545–548, https://doi.org/10.1038/nature06267, 2007.
Riebesell, U., Czerny, J., von Bröckel, K., Boxhammer, T., Büdenbender, J., Deckelnick, M., Fischer, M., Hoffmann, D., Krug, S. A., Lentz, U., Ludwig, A., Muche, R., and Schulz, K. G.: Technical Note: A mobile sea-going mesocosm system – new opportunities for ocean change research, Biogeosciences, 10, 1835–1847, https://doi.org/10.5194/bg-10-1835-2013, 2013.
Robarts, R. D. and Zohary, T.: Temperature effects on photosynthetic capacity, respiration., and growth rates of bloom-forming cyanobacteria, New Zeal. J. Mar. Fresh., 21, 391–399, https://doi.org/10.1080/00288330.1987.9516235, 1987.
Robert-Baldo, G., Morris, M., and Byrne, R.: Spectrophotometric determination of seawater pH using phenol red, Anal. Chem., 3, 2564–2567, https://doi.org/10.1021/ac00290a030, 1985.
Rose, J. M., Feng, Y., Gobler, C. J., Gutierrez, R., Harel, C. E., Leblanc, K., and Hutchins, D. A.: Effects of increased pCO2 and temperature on the North Atlantic spring bloom. II. Microzooplankton abundance and grazing, Mar. Ecol.-Prog. Ser., 388, 27–40, https://doi.org/10.3354/meps08134, 2009.
Roy, S., Chanut, J.-P., Gosselin, M., and Sime-Ngando, T.: Characterization of phytoplankton communities in the Lower St. Lawrence Estuary using HPLC-detected pigments and cell microscopy, Mar. Ecol.-Prog. Ser., 142, 55–73, https://doi.org/10.3354/meps142055, 1996.
Sala, M. M., Aparicio, F. L., Balagué, V., Boras, J. A., Borrull, E., Cardelús, C., Cros, L., Gomes, A., López-Sanz, A., Malits, A., Martinez, R. A., Mestre, M., Movilla, J., Sarmento, H., Vázquez-Domínguez, E., Vaqué, D., Pinhassi, J., Calbet, A., Calvo, E., Gasol, J. M., Pelejero, C., and Marrasé, C.: Contrasting effects of ocean acidification on the microbial food web under different trophic conditions, ICES J. Mar. Sci., 73, 670–679, https://doi.org/10.1093/icesjms/fsv130, 2016.
Schulz, K. G., Bellerby, R. G. J., Brussaard, C. P. D., Büdenbender, J., Czerny, J., Engel, A., Fischer, M., Koch-Klavsen, S., Krug, S. A., Lischka, S., Ludwig, A., Meyerhöfer, M., Nondal, G., Silyakova, A., Stuhr, A., and Riebesell, U.: Temporal biomass dynamics of an Arctic plankton bloom in response to increasing levels of atmospheric carbon dioxide, Biogeosciences, 10, 161–180, https://doi.org/10.5194/bg-10-161-2013, 2013.
Schulz, K. G., Bach, L. T., Bellerby, R. G. J., Bermudez, R., Budenbender, J., Boxhammer, T., Czerny, J., Engel, A., Ludwig, A., Meyerhofer, M., Larsen, A., Paul, A., Sswat, M., and Riebesell, U.: Phytoplankton blooms at increasing levels of atmospheric carbon dioxide: experimental evidence for negative effects on prymnesiophytes and positive on small picoeukaryotes, Front. Mar. Sci., 4, 64, https://doi.org/10.3389/fmars.2017.00064, 2017.
Sommer, U. and Lengfellner, K.: Climate change and the timing, magnitude, and composition of the phytoplankton spring bloom, Glob. Change Biol., 14, 1199–1208, https://doi.org/10.1111/j.1365-2486.2008.01571.x, 2008.
Sommer, U., Paul, C., and Moustaka-Gouni, M.: Warming and ocean acidification effects on phytoplankton – From species shifts to size shifts within species in a mesocosm experiment, PLoS ONE, 10, 17, https://doi.org/10.1371/journal.pone.0125239, 2015.
Starr, M., St-Amand, L., Devine, L., Bérard-Therriault, L., and Galbraith, P. S.: State of phytoplankton in the Estuary and Gulf of St. Lawrence during 2003, DFO Can. Sci. Advis. Sec. Res. Doc., 2004/123, ii+31 pp., 2004.
Suzuki, Y. and Takahashi, M.: Growth responses of several diatom species isolated from various environments to temperature, J. Phycol., 31, 880–888, https://doi.org/10.1111/j.0022-3646.1995.00880.x, 1995.
Tatters, A. O., Roleda, M. Y., Schnetzer, A., Fu, F., Hurd, C. L., Boyd, P. W., Caron, D. A., Lie, A. A. Y., Hoffmann, L. J., and Hutchins, D. A.: Short- and long-term conditioning of a temperate marine diatom community to acidification and warming, Philos. T. Roy. Soc. B, 368, 20120437, https://doi.org/10.1098/rstb.2012.0437, 2013.
Taylor, A. H., Harbour, D. S., Harris, R. P., Burkill, P. H., and Edwards, E. S.: Seasonal succession in the pelagic ecosystem of the North Atlantic and the utilization of nitrogen, J. Plankton Res., 15, 875–891, https://doi.org/10.1093/plankt/15.8.875, 1993.
Thomas, M. K., Kremer, C. T., Klausmeier, C. A., and Litchman, E.: A global pattern of thermal adaptation in marine phytoplankton, Science, 338, 1085–1088, https://doi.org/10.1126/science.1224836, 2012.
Todgham, A. E. and Stillman, J. H.: Physiological responses to shifts in multiple environmental stressors: Relevance in a changing world, Integr. Comp. Biol., 53, 539–544, https://doi.org/10.1093/icb/ict086, 2013.
Tomas, C. R. (Ed.): Identifying Marine Phytoplankton, Academic Press, San Diego, 858 pp., 1997.
Tortell, P. D., DiTullio, G. R., Sigman, D. M., and Morel, F. M. M.: CO2 effects on taxonomic composition and nutrient utilization in an Equatorial Pacific phytoplankton assemblage, Mar. Ecol.-Prog. Ser., 236, 37–43, https://doi.org/10.3354/meps236037, 2002.
Trimborn, S., Wolf-Gladrow, D., Richter, K. U., and Rost, B.: The effect of pCO2 on carbon acquisition and intracellular assimilation in four marine diatoms, J. Exp. Mar. Bio. Ecol., 376, 26–36, https://doi.org/10.1016/j.jembe.2009.05.017, 2009.
Wijffels, S., Roemmich, D., Monselesan, D., Church, J., and Gilson, J.: Ocean temperatures chronicle the ongoing warming of Earth, Nat. Clim. Change, 6, 116–118, https://doi.org/10.1038/nclimate2924, 2016.
Wohlers, J., Engel, A., Zollner, E., Breithaupt, P., Jurgens, K., Hoppe, H.-G., Sommer, U., and Riebesell, U.: Changes in biogenic carbon flow in response to sea surface warming, P. Natl. Acad. Sci. USA, 106, 7067–7072, https://doi.org/10.1073/pnas.0812743106, 2009.
Wu, Y., Gao, K., and Riebesell, U.: CO2-induced seawater acidification affects physiological performance of the marine diatom Phaeodactylum tricornutum, Biogeosciences, 7, 2915–2923, https://doi.org/10.5194/bg-7-2915-2010, 2010.
Yoshimura, T., Nishioka, J., Suzuki, K., Hattori, H., Kiyosawa, H., and Watanabe, Y. W.: Impacts of elevated CO2 on organic carbon dynamics in nutrient depleted Okhotsk Sea surface waters, J. Exp. Mar. Bio. Ecol., 395, 191–198, https://doi.org/10.1016/j.jembe.2010.09.001, 2010.
Yoshimura, T., Sugie, K., Endo, H., Suzuki, K., Nishioka, J., and Ono, T.: Organic matter production response to CO2 increase in open subarctic plankton communities: Comparison of six microcosm experiments under iron-limited and -enriched bloom conditions, Deep-Sea Res. Pt. I, 94, 1–14, https://doi.org/10.1016/j.dsr.2014.08.004, 2014.