the Creative Commons Attribution 4.0 License.
the Creative Commons Attribution 4.0 License.
 | 06 Jul 2018
Abyssal plain faunal carbon flows remain depressed 26 years after a simulated deep-sea mining disturbance
Lidia Lins
Autun Purser
Yann Marcon
Clara F. Rodrigues
Ascensão Ravara
Marina R. Cunha
Erik Simon-Lledó
Daniel O. B. Jones
Andrew K. Sweetman
Kevin Köser
Dick van Oevelen
Future deep-sea mining for polymetallic nodules in abyssal plains will negatively impact the benthic ecosystem, but it is largely unclear whether this ecosystem will be able to recover from mining disturbance and if so, to what extent and at what timescale. During the “DISturbance and reCOLonization” (DISCOL) experiment, a total of 22 % of the seafloor within a 10.8 km2 circular area of the nodule-rich seafloor in the Peru Basin (SE Pacific) was ploughed in 1989 to bury nodules and mix the surface sediment. This area was revisited 0.1, 0.5, 3, 7, and 26 years after the disturbance to assess macrofauna, invertebrate megafauna and fish density and diversity. We used this unique abyssal faunal time series to develop carbon-based food web models for each point in the time series using the linear inverse modeling approach for sediments subjected to two disturbance levels: (1) outside the plough tracks; not directly disturbed by plough, but probably suffered from additional sedimentation; and (2) inside the plough tracks. Total faunal carbon stock was always higher outside plough tracks compared with inside plough tracks. After 26 years, the carbon stock inside the plough tracks was 54 % of the carbon stock outside plough tracks. Deposit feeders were least affected by the disturbance, with modeled respiration, external predation, and excretion rates being reduced by only 2.6 % inside plough tracks compared with outside plough tracks after 26 years. In contrast, the respiration rate of filter and suspension feeders was 79.5 % lower in the plough tracks after 26 years. The “total system throughput” (T..), i.e., the total sum of modeled carbon flows in the food web, was higher throughout the time series outside plough tracks compared with the corresponding inside plough tracks area and was lowest inside plough tracks directly after the disturbance (8.63 × 10⁻³ ± 1.58 × 10⁻⁵ mmol C m−2 d−1). Even 26 years after the DISCOL disturbance, the discrepancy of T.. between outside and inside plough tracks was still 56 %. Hence, C cycling within the faunal compartments of an abyssal plain ecosystem remains reduced 26 years after physical disturbance, and a longer period is required for the system to recover from such a small-scale sediment disturbance experiment.
- Article
(3634 KB) -
Supplement
(166 KB) - BibTeX
- EndNote


Abyssal plains cover approximately 50 % of the world's surface and 75 % of the seafloor (Ramírez-Llodrà et al., 2010). The abyssal seafloor is primarily composed of soft sediments consisting of fine-grained erosional detritus and biogenic particles (Smith et al., 2008). Occasionally, hard substrate occurs in the form of clinker from steam ships, glacial drop stones, outcrops of basaltic rock, whale carcasses, and marine litter (Amon et al., 2017; Kidd and Huggett, 1981; Radziejewska, 2014; Ramírez-Llodrà et al., 2011; Ruhl et al., 2008). In some soft-sediment regions, islands of hard substrate are provided by polymetallic nodules, authigenically formed deposits of metals, that grow at approximately 2 to 20 mm per million years (Guichard et al., 1978; Kuhn et al., 2017). These nodules have shapes and sizes of cauliflower florets, cannon balls, or potatoes, and are found on the sediment surface and in the sediment at water depths between 4000 and 6000 m in areas of the Pacific, Atlantic, and Indian Ocean (Devey et al., 2018; Kuhn et al., 2017).
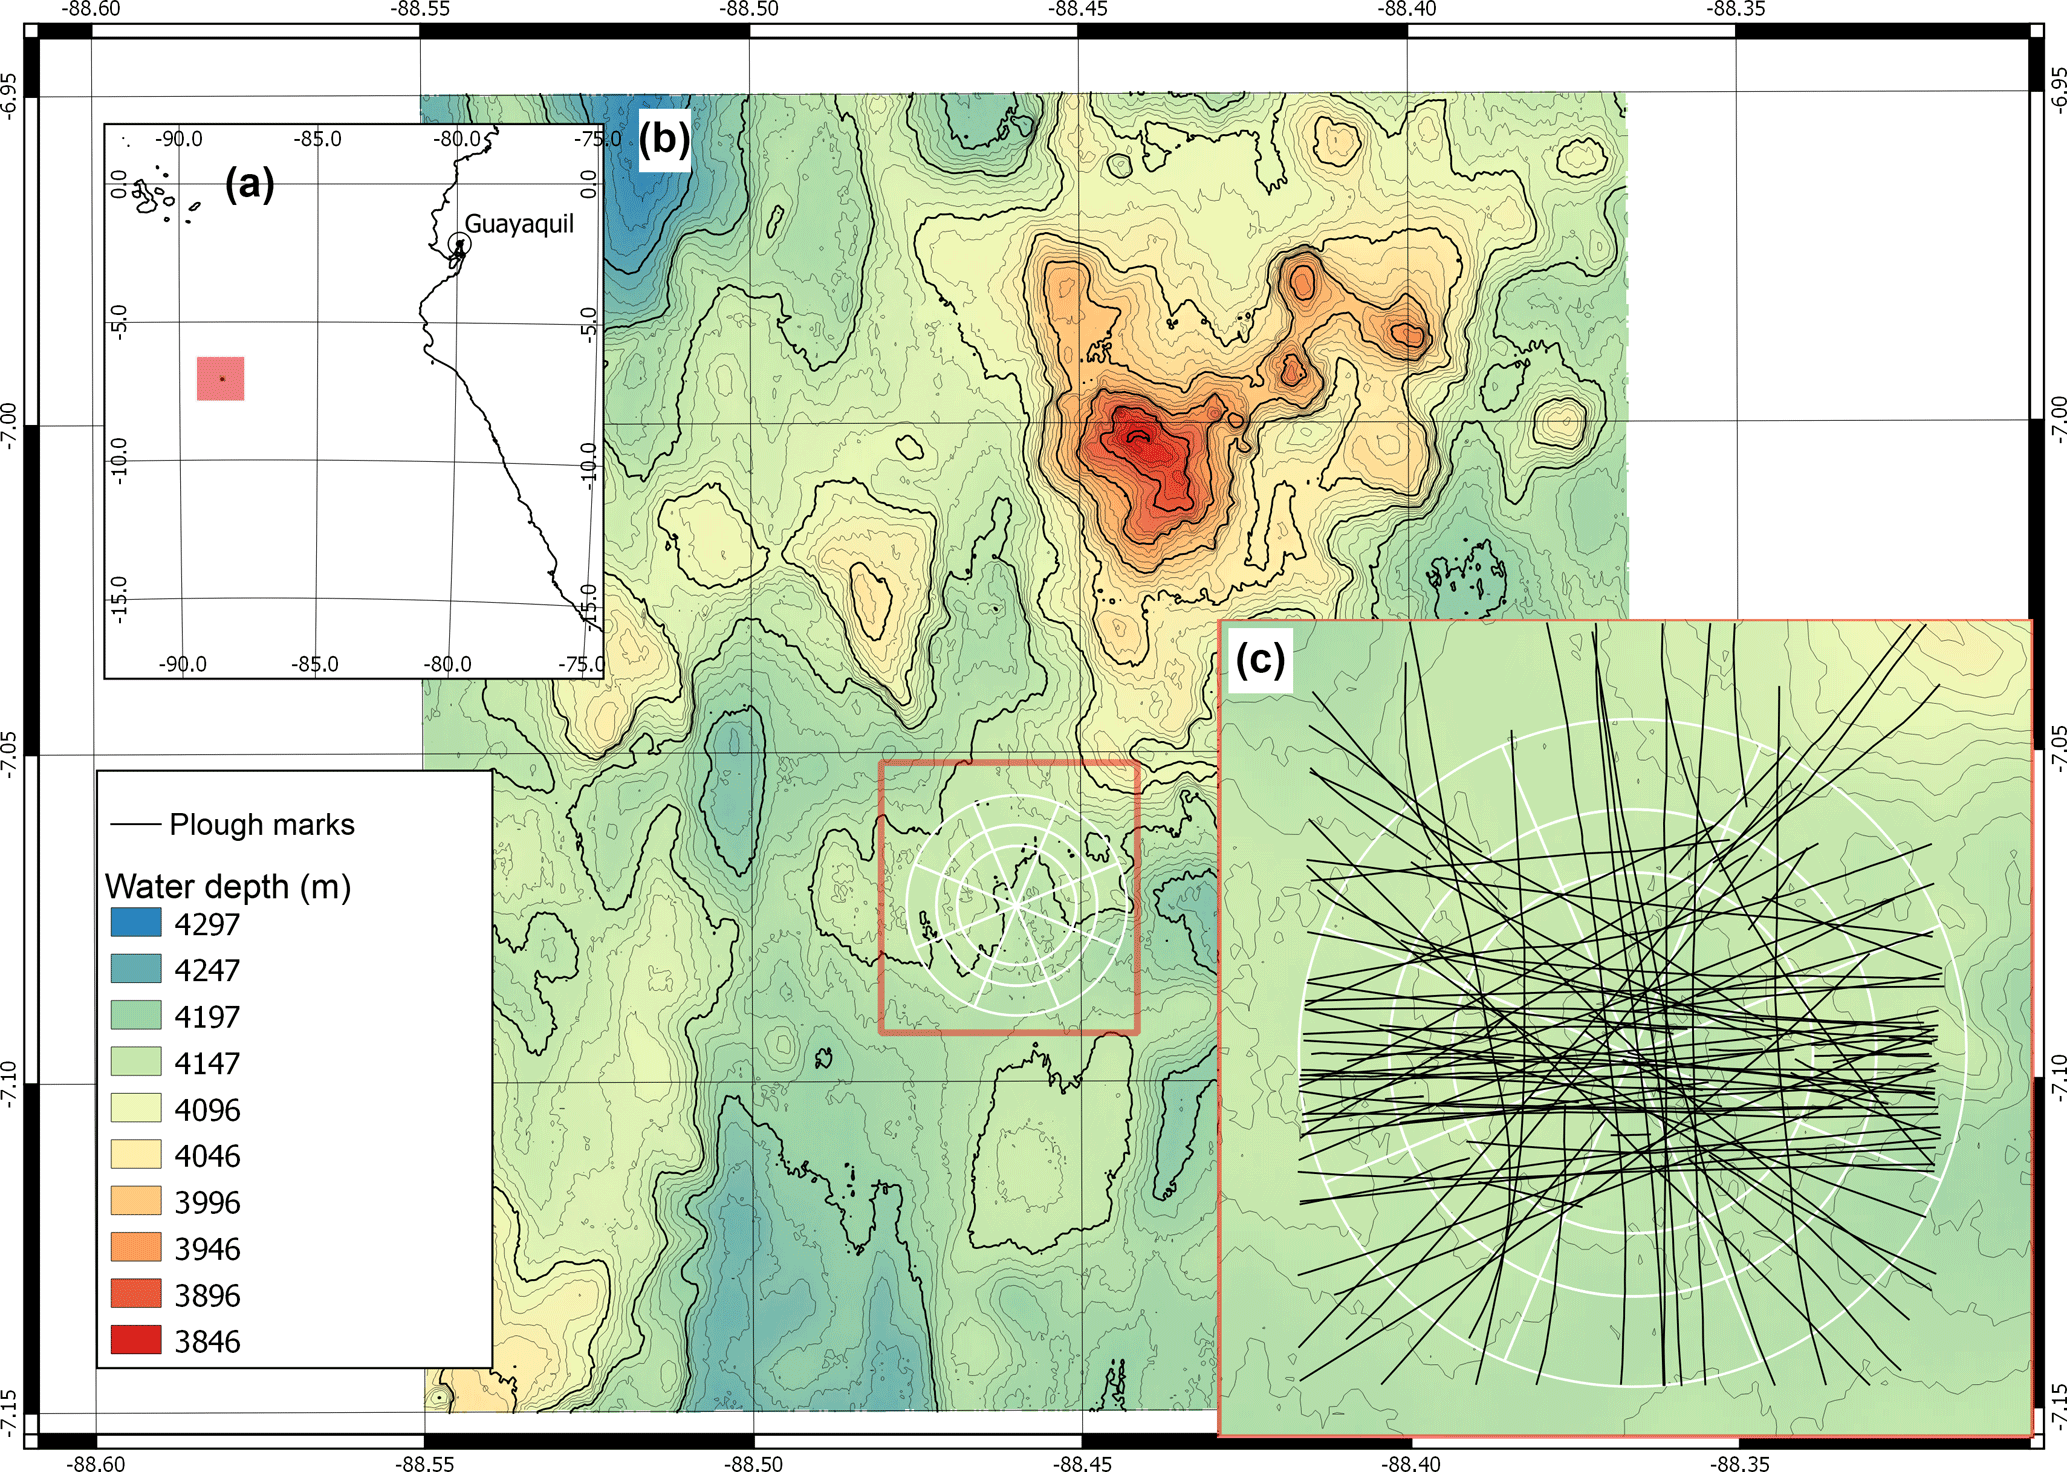
Figure 1(a) Location of the DISCOL experimental area (DEA) in the Peru Basin (SE Pacific; red square), (b) detailed map of the DEA indicated by the white circle, (c) location of all plough tracks (black lines) that were observed by the “AUV Abyss” (Geomar Kiel) after 26 year during the R/V Sonne cruise SO242-1 (Greinert, 2015).
Polymetallic nodules are rich in metals, such as nickel, copper, cobalt, molybdenum, zirconium, lithium, and rare-earth elements (Hein et al., 2013), and occur in sufficient densities for potential exploitation by commercial mining in the Clarion-Clipperton Fracture Zone (CCFZ; equatorial Pacific), around the Cook Islands (equatorial Pacific), in the Peru Basin (E Pacific) and in the central Indian Ocean basin (Kuhn et al., 2017). Extracting these polymetallic nodules during deep-sea mining operations will have severe impacts on the benthic ecosystem, such as the removal of hard substrate (i.e., nodules) and the food-rich surface sediments from the seafloor, physically causing the mortality of organisms within the mining tracks and resettlement of resuspended particles (Levin et al., 2016; Thiel and Forschungsverbund Tiefsee-Umweltschutz, 2001). Choosing appropriate regulations on deep-sea mining requires knowledge of ecosystem recovery from these activities, but to date information on these rates is not extensive, especially on the recovery of ecosystem functions, such as food-web structure and carbon (C) cycling (Gollner et al., 2017; Jones et al., 2017; Stratmann et al., 2018a, b; Vanreusel et al., 2016).
In the Peru Basin (SE Pacific), a small-scale sediment disturbance experiment was conducted during the “DISturbance and reCOLonization” experiment (DISCOL) in 1989, which was aimed at mimicking deep-sea mining. A 10.8 km2 circular area (Fig. 1) was ploughed diametrically 78 times with an 8 m wide plough-harrow; a treatment which did not remove nodules, but disturbed the surface sediment, buried nodules into the sediment and created a sediment plume (Thiel et al., 1989). This experimental disturbance resulted in a heavily disturbed center and a less affected periphery of the DISCOL area (Bluhm, 2001; Foell et al., 1990, 1992). Over 26 years, the region was revisited five times to assess the post-disturbance (PD) situation: directly after the disturbance event, March 1989: (hereafter referred to as “PD0.1”); half a year later, September 1989: “PD0.5”; 3 years later, January 1992: “PD3”; 7 years later, February 1996: “PD7”; and 26 years later, September 2015: “PD26”. During subsequent visits, densities of macrofauna and invertebrate megafauna were assessed, but data on meiofaunal and microbial communities were collected only sparsely. Therefore, the food-web models presented in this work cover post-disturbance 1989 (no adequate pre-disturbance sampling took place in 1989) to 2015, and contain only macrofauna, invertebrate megafauna and fish data.
Linear inverse modeling is an approach that has been developed to disentangle carbon flows between food-web compartments for data-sparse systems (Klepper and Van De Kamer, 1987; Vézina and Platt, 1988). It has been applied to assess differences in carbon and nitrogen (N) cycling in various ecosystems, including the abyssal-plain food web at Station M (NE Pacific) under various particulate organic carbon (POC) flux regimes (Dunlop et al., 2016), and a comparison of food-web flows between abyssal hills and plains at the Porcupine Abyssal Plain (PAP) in the north-eastern Atlantic (Durden et al., 2017).
The aim of this study was (I) to assess whether faunal carbon stock and trophic composition of the food webs varied and/or converged over the time series between outside and inside plough tracks at DISCOL; (II) to compare our model outcomes with the conceptual and qualitative predictions on benthic community recovery from polymetallic nodule mining published by Jumars (1981) and (III) to infer the recovery rate of C cycling following from a deep-sea sediment disturbance experiment using the network index “total system throughput” ΔT.., i.e., the sum of all C flows in the food web (Kones et al., 2009), developed over time.
2.1 Linear inverse model
Linear inverse modeling is based on the principle of mass balance and various data sources (Vézina and Platt, 1988), i.e., faunal carbon stock and physiological constraints, that are implemented in the model, either as equalities or inequalities, and they are solved simultaneously. A food-web model with all compartments present in the food web, e.g., the PD26 food web model outside plough tracks, consisted of 147 carbon flows with 14 mass balances, i.e., food-web compartments, and 76 data inequalities leading to a mathematically under-determined model (14 equalities vs. 147 unknown flows). Therefore, the linear inverse models (LIMs) were solved with the R package “LIM” (van Oevelen et al., 2010) in R (R-Core Team, 2017) following the likelihood approach (van Oevelen et al., 2010) to quantify means and standard deviations of each of the carbon flows from a set of 100 000 solutions. This set was sufficient to guarantee convergence of means and standard deviations within a 2.5 % deviation.
Table 1Number of box cores (nbox cores) taken for macrofauna sampling outside plough tracks (outside PT) and inside plough tracks (inside PT) directly after the disturbance event in March 1989 (PD0.1), 0.5-year post-disturbance (September 1989, PD0.5), 3-year post-disturbance (January 1992, PD3), 7-year post-disturbance (February 1996, PD7), and 26-year post-disturbance events (September 2015, PD26). Number of “OFOS” tracks (“ocean floor observatory system”; nOFOS tracks) analyzed to estimate invertebrate megafauna and fish density and total area of seafloor (m2) that was surveyed during each sampling event outside and inside plough tracks. References: 1 Borowski and Thiel (1998), 2 Borowski (2001), 3 this study, 4 Bluhm (2001).
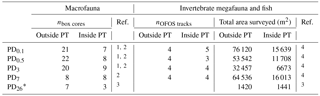
* During PD26, the densities of invertebrate megafauna and fish were estimated using 300 pictures from outside plough tracks and 300 pictures from inside plough tracks that were randomly selected from a 21 OFOS tracks (Boetius, 2015).
Food-web models from different sites and/or points in time were compared quantitatively by calculating T.. with the R package “NetIndices” (Kones et al., 2009) for each of the 100 000 model solutions and subsequently summarized as mean ± standard deviation. A decrease in the difference of T.. between the food webs from outside and inside plough tracks (ΔT..) over time was taken as a sign of ecosystem recovery following disturbance.
2.2 Data availability
Macrofauna, invertebrate megafauna, and fish density data (mean ± SD; ind. m−2) for the first four cruises (PD0.1 to PD7) were extracted from the original papers (Borowski and Thiel, 1998; Bluhm, 2001 annex 2.8; Borowski, 2001), and methodological details can be found in those papers. In brief, macrofaunal samples (> 500 µm size fraction) were collected with a 0.25 m−2 box corer (number of samples is reported in Table 1), and densities of invertebrate megafauna and fish were assessed on still photos and videos taken with a towed “Ocean Floor Observation System” (OFOS) underwater camera system (extent of total surveyed area is reported in Table 1). During the PD26 cruise (R/V Sonne cruise SO242-2; Boetius, 2015), macrofauna were collected with a square 50 × 50 × 60 cm box corer (outside plough tracks: n=7; inside plough tracks: n=3), and the upper 5 cm of sediment were sieved on a 500 µm sieve (Greinert, 2015). All organisms retained on the sieve were preserved in 96 % un-denatured ethanol on board (Greinert, 2015) and were sorted and identified ashore under a stereomicroscope to the same taxonomic level as the previous cruises. Invertebrate megafauna and fish density during the PD26 cruise were acquired by deploying the OFOS (Boetius, 2015). Every 20 s, the OFOS automatically took a picture from approximately 1.5 m above the seafloor (Boetius, 2015; Stratmann et al., 2018b) resulting in 1740 images of plough marks (inside plough tracks) and 6624 images from outside plough tracks (Boetius, 2015). A subset of 300 pictures from inside plough tracks (surface area: 1441 m2) and 300 pictures from the outside plough tracks (surface area: 1420 m2) were randomly selected from the original set of pictures and annotated using the open-source annotation software PAPARA(ZZ)I (Marcon and Purser, 2017). Invertebrate megafauna were identified to the same taxonomic levels as for the previous megafauna studies conducted within the DISCOL experimental area (DEA; Bluhm, 2001), whereas fishes were identified to genus using the Clarion-Clipperton Zone (CCZ) species atlas (http://www.ccfzatlas.com, last access: 14 February 2018).
The above-mentioned density data collected for macrofauna, invertebrate megafauna and fish were used to build food-web models to resolve carbon fluxes; hence, all faunal density data required conversion into carbon units before they could be used in the food-web model. Converting density data to carbon stocks was challenging in the current study, as few to no conversion factors for deep-sea fauna are available in the literature. Below, we describe the approach that we used to tackle this problem for macrofauna, invertebrate megafauna, and fish.
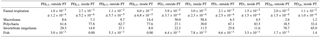
Table 2Taxon-specific biomass per individual (mmol C ind−1) for macrofauna and invertebrate megafauna including the specific feeding types. Macrofaunal biomass data are based on macrofaunal specimens collected in the abyssal plains of the Clarion-Clipperton Zone (NE Pacific; Sweetman et al., 2018). In contrast, invertebrate megafaunal biomass was estimated by converting size measurements of specific body parts of organisms from DEA that were acquired using photo-annotation into preserved wet weight per organism using the relationships presented in Durden et al. (2016). Subsequently the preserved wet weight was converted into fresh wet weight and biomass following the conversions presented in Durden et al. (2016) and Rowe (1983). Whenever no conversion factors for a specific taxon were reported in Durden et al. (2016) mean taxon-specific biomass data per individual were extracted from Tilot (1992) for the CCZ. The “n” refers to the number of individuals used to estimate taxon-specific biomasses. A detailed list with exact conversion factors for invertebrate megafauna is presented in Supplement 1. The abbreviation are the following: C = carnivores, DF = deposit feeders, FSF = filter/suspension feeders, O = omnivores, PolC = carnivorous polychaetes, PolOF = omnivorous polychaetes, PolSF = suspension-feeding polychaetes, PolSDF = surface deposit-feeding polychaetes, PolSSDF = subsurface deposit-feeding polychaetes, S = scavengers. References: 1 Fox et al. (2003), 2 Menzies (1962), 3 McClain et al. (2004), 4 Smith and Stockley (2005), 5 Gage and Tyler (1991), 7 Jumars et al. (2015), 8 Bluhm (2001), 9 Drazen and Sutton (2017).
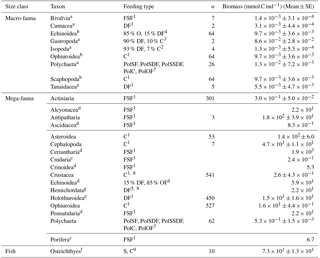
a Taxon-specific individual biomass; b Individual biomass calculated based on all other macrofauna data; c Median taxon-specific individual biomass for individuals from the Porcupine Abyssal Plain where Durden et al. (2016) did not have reliable dimension measurements; d Mean taxon-specific biomass data per individual were extracted from Tilot (1992) for the CCZ; e Individual biomass of Benthodytes sp., one of the most abundant holothurian morphotype at the DISCOL site (Stratmann et al., 2018b); f Individual biomass of Ipnops sp., the most abundant deep-sea fish at the PD26 outside plough tracks; g Individual biomass calculated for mean benthic invertebrate megafauna at 4100 m depth based on the biomass-bathymetry and abundance-bathymetry relationships presented in Rex et al. (2006).
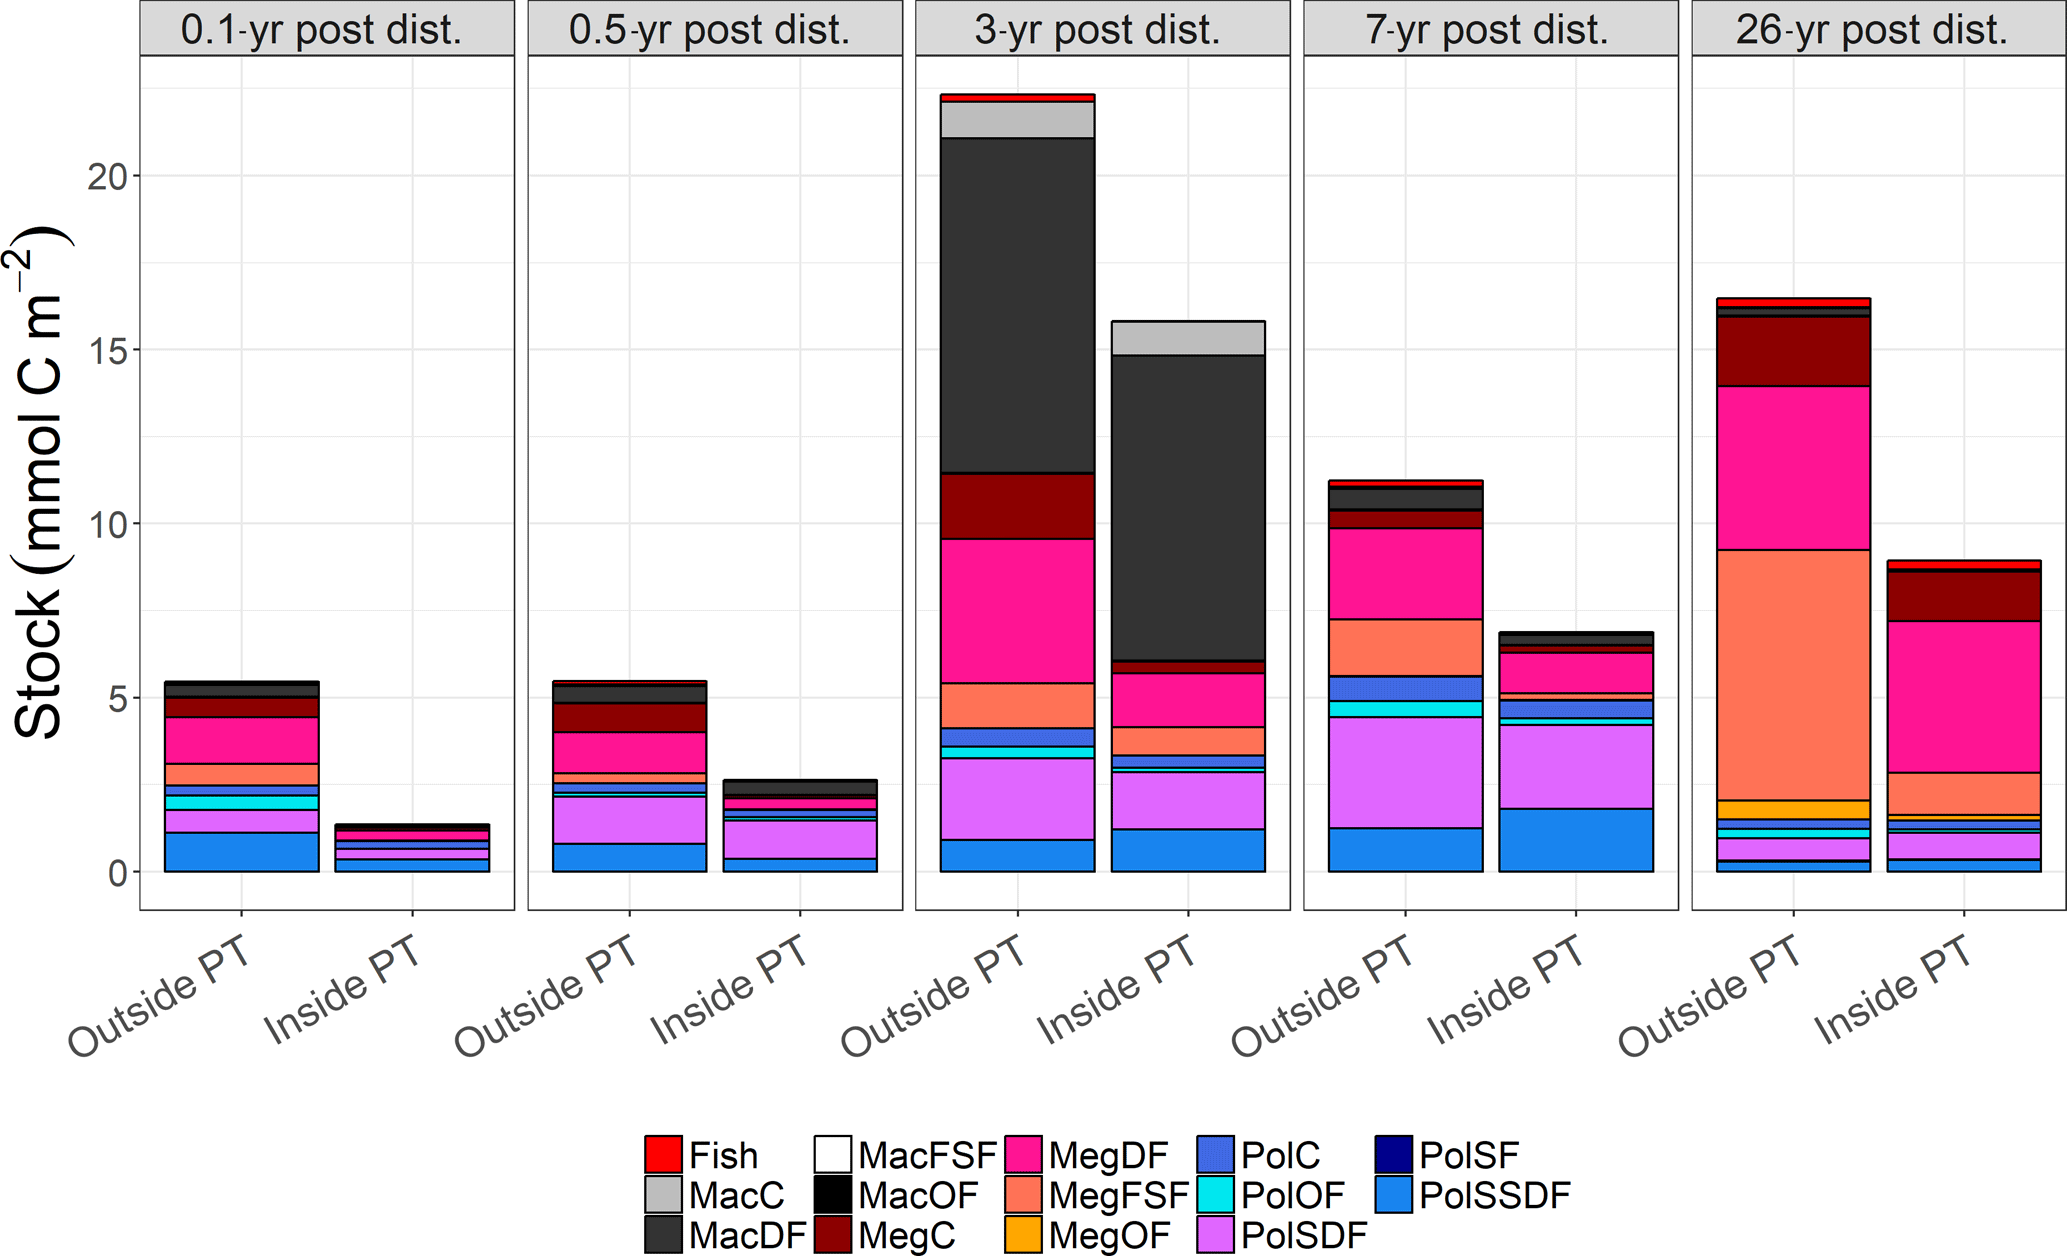
Figure 2Mean carbon stocks (mmol C m−2) of the food-web compartments for outside (outside PT) and inside (inside PT) the plough tracks at the DISCOL experimental area (Peru Basin, SE Pacific) 0.1 year post-disturbance (PD0.1), for 0.5-year post-disturbance (PD0.5), for 3-year post-disturbance (PD3), for 7-year post-disturbance (PD7), and for 26-year post-disturbance events (PD26). For visibility reasons, no error bars are plotted, but mean ± standard deviations of each food-web compartment are presented in Supplement 2. The abbreviation are the following: MacC = macrofauna carnivores, MacDF = macrofauna deposit feeders, MacFSF = macrofauna filter/suspension feeders, MacO = macrofauna omnivores, MegC = invertebrate megafauna carnivores, MegDF = invertebrate megafauna deposit feeders, MegFSF = invertebrate megafauna filter/suspension feeders, MegOF = invertebrate megafauna omnivores, PolC = polychaete carnivores, PolOF = polychaete omnivores, PolSDF = polychaete surface deposit feeders, PolSF = polychaete suspension feeders, PolSSDF = polychaete subsurface deposit feeders.
Measuring the carbon content of a macrofaunal specimen requires its complete combustion, which means that the specimen cannot be kept as a voucher. Macrofaunal samples collected for this study are part of the Biological Research Collection of Marine Invertebrates (Department of Biology & Centre for Environmental and Marine Studies, University of Aveiro, Portugal) and were therefore not sacrificed. Instead, we used the C conversion factors of macrofaunal specimens previously collected within the framework of a pulse-chase experiment in the CCZ (NE Pacific), in which a deep-sea benthic lander (3 incubation chambers, 20 × 20 × 20 cm each) was deployed at water depths between 4050 and 4200 m (Sweetman et al., 2018). The upper 5 cm of the sediment of the incubation chambers were sieved on a 500 µm sieve and preserved in 4 % buffered formaldehyde. Ashore, the samples were sorted and identified under a dissecting microscope, and the carbon content of individual freeze-dried, acidified specimens was determined with a Thermo Flash EA 1112 elemental analyzer (EA; Thermo Fisher Scientific, USA) to give the individual biomass in mmol C ind−1. Macrofaunal density data (ind. m−2) from all cruises were converted to macrofaunal carbon stocks (mmol C m−2) by multiplying each taxon-specific density (ind. m−2) with the mean, taxon-specific, individual biomass value for macrofauna (mmol C ind−1; Table 2). Subsequently, the carbon stock data of all taxa with the same feeding type (Table 2) were summed to calculate the carbon stock of each macrofaunal compartment (mmol C m−2; Supplement 2, Fig. 2).
The invertebrate megafaunal density data (ind. m−2) of the time series was converted to carbon stocks (mmol C m−2) by multiplying the taxon-specific density with a taxon-specific mean biomass per invertebrate megafaunal specimen (mmol C ind−1; Table 2). To determine this taxon-specific biomass per invertebrate megafaunal specimen, size measurements were used as follows. The “AUV Abyss” (Geomar Kiel) equipped with a Canon EOS 6D camera system with 8–15 mm f4 fisheye zoom lens and 24 LED arrays for lightning (Kwasnitschka et al., 2016) flew approximately 4.5 m above the seafloor at a speed of 1.5 m s−1 and took one picture every second (Greinert, 2015). Machine-vision processing was used to generate a photomosaic (Kwasnitschka et al., 2016). A subsample covering an area of 16 206 m2 of the mosaic was annotated using the web-based annotation software “BIIGLE 2.0” (Langenkämper et al., 2017). Lengths of all invertebrate megafaunal taxa for which data were available from previous cruises were measured using the approach presented in Durden et al. (2016). Briefly, depending on the taxon, either body length, the diameter of the disk, or the length of an arm was measured on the photo mosaic and converted into biomass per individual (g ind−1) using the relationship between measured body dimensions (mm) and preserved wet weight (g ind−1) (Durden et al., 2016). Subsequently, the preserved wet weight (g ind−1) was converted to fresh wet weight (g ind−1) using conversion factors from Durden et al. (2016) and to organic carbon (g C ind−1 and mmol C ind−1) using the taxon-specific conversion factors presented in Rowe (1983) (a detailed list with all conversion factors is presented in Supplement 2). For the taxa Cnidaria and Porifera, no conversion factors were available. Therefore, taxon-specific individual biomass values were extracted from a study from the CCZ (Tilot, 1992). The individual biomass of Hemichordata was calculated as the average biomass of an individual deep-sea invertebrate megafaunal organism (B, mmol C ind−1) at 4100 m depth following from the ratio of the regression for total biomass and abundance by Rex et al. (2006):
Following the approach applied to the macrofauna dataset, individual carbon stocks of taxa with similar feeding types (Table 2) were summed to determine carbon stocks of invertebrate megafauna food-web compartments (mmol C m−2; Supplement 1; Fig. 2).
Individual biomass of fish was calculated using the allometric relationship for Ipnops agassizii:
where a=0.0049 and b=3.03 (Froese et al., 2014; Froese and Pauly, 2017), as Ipnops sp. was the most abundant fish observed at the DEA (60 % of total fish density outside plough tracks and 40 % of total fish density inside plough tracks). The length (mm) of all Ipnops sp. specimens was measured on the annotated 600 pictures (300 pictures from outside plough tracks, 300 pictures from inside plough tracks) in PAPARA(ZZ)I (Marcon and Purser, 2017) using three laser points captured in each image (distance between laser points: 0.5 m; Boetius, 2015). The wet weight (g) was converted to dry weight and subsequently to carbon content (mmol C ind−1) using the taxon-specific conversion factors presented in Brey et al. (2010).
2.3 Food-web structure
Faunal carbon stocks were further divided into feeding guilds in order to define food-web compartments of the model. Fish (Osteichthyes) were classified as scavenger/predator and macrofauna and invertebrate megafauna were divided into filter/suspension feeders (FSF), deposit feeders (DF), carnivores (C), and omnivores (OF) (Fig. 3; Table 2). Since feeding types are well described for polychaetes (Jumars et al., 2015), we made a further detailed classification of the macrofaunal polychaetes into suspension feeders (PolSF), surface deposit feeders (PolSDF), subsurface deposit feeders (PolSSDF), carnivores (PolC), and omnivores (PolOF).
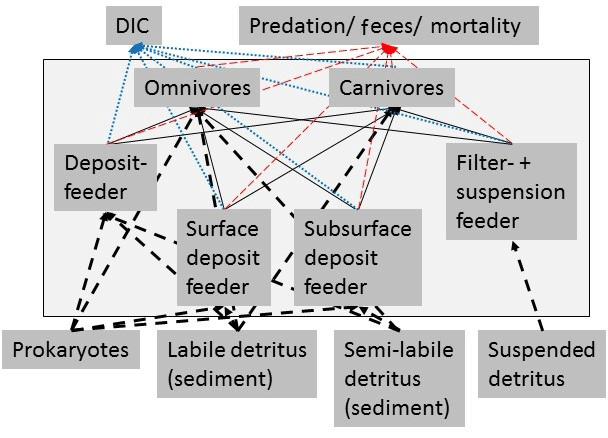
Figure 3Simplified schematic representation of the food web structure that forms the basis of the linear inverse model (LIM). All compartments inside the box were part of the food web model, whereas compartments outside the black box were only considered as carbon influx or efflux, but were not directly modeled. In order to simplify the graph, for macrofauna, polychaetes, and invertebrate megafauna, only feeding types were presented and no size classes. Solid black arrows represent the carbon flux between food-web compartments and black dashed arrows represent the influx of carbon to the model. Blue-dotted arrows show the loss of carbon from the food web via respiration to DIC. The red dashed arrows indicate the loss of carbon from the food web as feces and as predation by pelagic/benthopelagic fish.
External carbon sources that were considered in the model included suspended detritus in the water column (Det_w), labile (lDet_s), and semi-labile detritus (sDet_s) in the sediment. Suspended detritus was considered a food source for polychaete, macrofaunal, and invertebrate megafaunal suspension feeders. Labile and semi-labile sedimentary detritus was a source for deposit-feeding and omnivorous polychaetes, macrofauna, and invertebrate megafauna. Omnivores and carnivores of each size class preyed upon organisms of the same and smaller size classes, i.e., MegC and MegOF preyed upon MegDF, MegFSF, MacFSF, MacDF, MacC, MacOF, PolSDF, PolSSDF, PolSF, PolOF, and PolC. Furthermore, MacC, PolC, MacOF, and PolOF preyed upon MacFSF, MacDF, PolSDF, PolSSDF, and PolSF. Fish preyed upon all fauna and the carcass pool. This carcass pool consisted of all fauna (macrofauna, invertebrate megafauna, and fish) that died in the food web and was also a food source of omnivores.
Carbon losses from the food web were respiration to dissolved inorganic carbon (DIC), predation on macrofauna, invertebrate megafauna, and fish by pelagic/benthopelagic fishes, scavenging on carcasses by pelagic/benthopelagic scavengers and feces production by all faunal compartments.
2.4 Literature constraints
Carbon flows between faunal compartments are constrained in all models by various minimum and maximum process rates and conversion efficiencies. Assimilation efficiency (AE) is calculated as
where I is the ingested food and F is the feces (Crisp, 1971). The min-max range was set from 0.62 to 0.87 for macrofauna, including polychaetes (Stratmann et al., 2018c), from 0.48 to 0.80 for invertebrate megafauna (Stratmann et al., 2018c) and from 0.84 to 0.87 for fish (Drazen et al., 2007).
Net growth efficiency (NGE) is defined as
with P being secondary production and R being respiration (Clausen and Riisgård, 1996). The min–max ranges are set to 0.60 to 0.72 for macrofauna, including polychaetes (Clausen and Riisgård, 1996; Navarro et al., 1994; Nielsen et al., 1995), from 0.48 to 0.60 for invertebrate megafauna (Koopmans et al., 2010; Mondal, 2006; Nielsen et al., 1995) and from 0.37 to 0.71 for fish (Childress et al., 1980). The secondary production P (mmol C m−2) is calculated as
with the P ∕ B ratios for macrofauna, including polychaetes (8.49 × 10⁻⁴ to 4.77 × 10⁻³ d−1; Stratmann et al., 2018c), invertebrate megafauna (2.74 × 10⁻⁴ to 1.42 × 10⁻² d−1; Stratmann et al., 2018c), and fish (6.30 × 10⁻⁴ d−1; Collins et al., 2005; Randall, 2002). The respiration rate R (mmol C m−2) was calculated as
where bsFR is the biomass-specific faunal respiration rate (d−1), and ranges were fixed between 7.12 × 10⁻⁵ and 2.28 × 10⁻² d−1 for macrofauna, including polychaetes (Stratmann et al., 2018c), 2.74 × 10⁻⁴ and 1.42 × 10⁻² d−1 for invertebrate megafauna (Stratmann et al., 2018c), and 2.3 × 10⁻⁴ and 3.6 × 10⁻⁴ d−1 for fishes (Mahaut et al., 1995; Smith and Hessler, 1974).
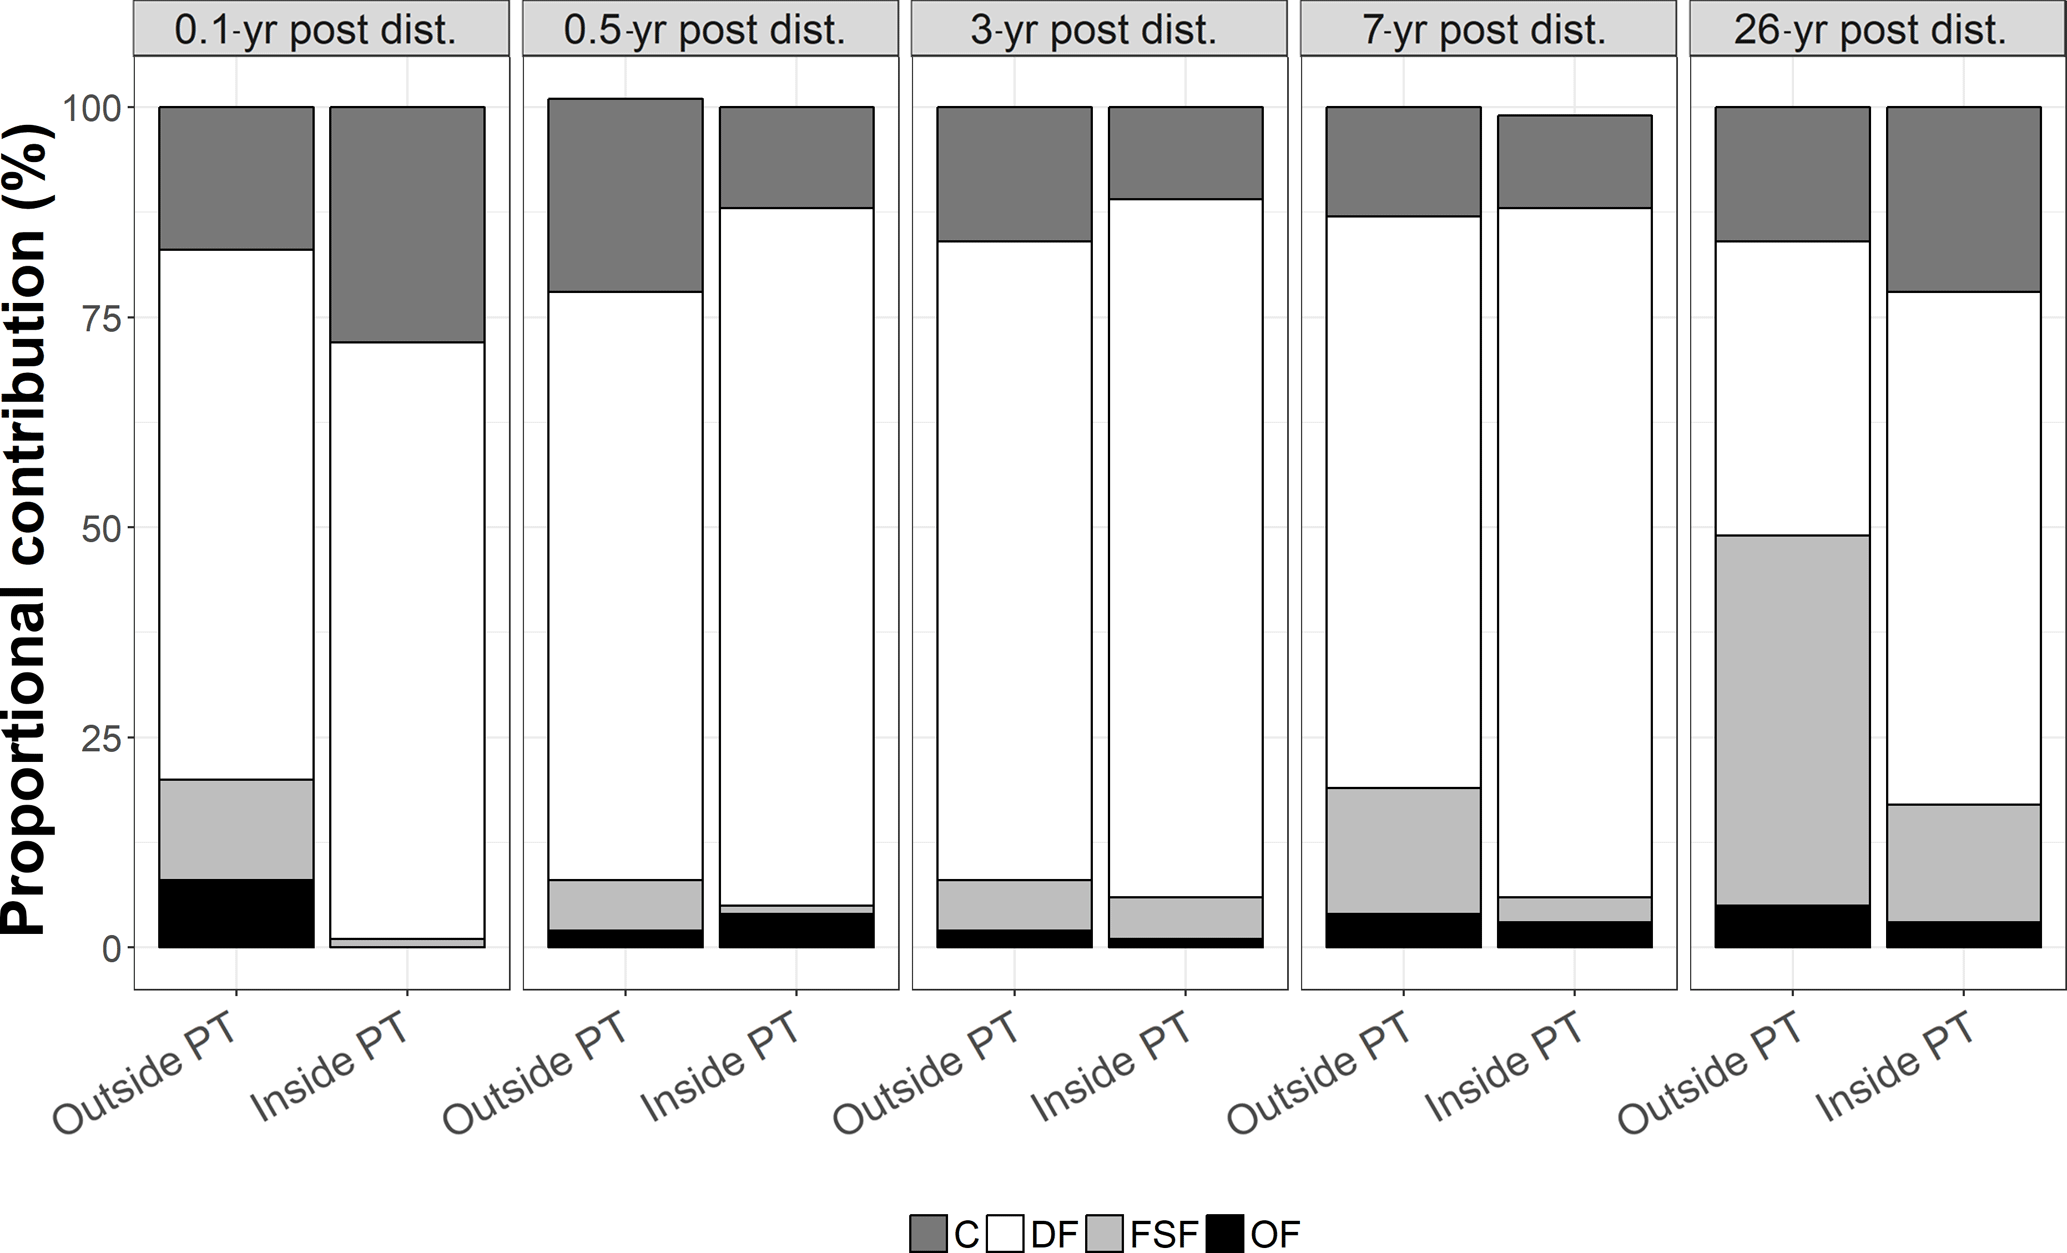
Figure 4Proportional contribution (in %) of the feeding types C = carnivores, DF = deposit feeders, FSF = filter and suspension feeders, and OF = omnivores to the total carbon stocks outside and inside plough tracks in the DISCOL experimental area (Peru Basin, SE Pacific) 0.1-year post-disturbance (PD0.1), for 0.5-year post-disturbance (PD0.5), for 3-year post-disturbance (PD3), for 7-year post-disturbance (PD7), and for 26-year post-disturbance events (PD26).
2.5 Statistical analysis
Statistical differences between individual compartment carbon stocks from outside vs. inside plough tracks for the same sampling event (PD0.1, PD0.5, PD3, PD7, and PD26) were omitted because of a lack of invertebrate megafaunal replicates) were assessed by calculating Hedges' d (Hedges and Olkin, 1985a), which is especially suitable for small sample sizes (Koricheva et al., 2013):
where is the mean of the experimental group (i.e., carbon stock from inside plough tracks of a particular year), is the mean of the control group (i.e., carbon stock from inside plough tracks of the respective year), sE and sC are the standard deviations with corresponding groups, nE and nC are the sample sizes of the corresponding groups. The variance in Hedges' (Koricheva et al., 2013) is estimated as
The weighted Hedges' d and estimated variances (Hedges and Olkin, 1985b) of the sum of all carbon stocks of the same sampling event were calculated as
with .
Following Cohen's (1988) rule of thumb for effect sizes, Hedges' signifies a small experimental effect, implying that the carbon stocks of the food-web compartments are similar between outside and inside plough tracks. When Hedges' , the effect size is medium, hence there is a moderate difference, and when Hedges' , the effect size is large, i.e., there is a large difference between carbon stocks of compartments from outside and inside plough tracks.
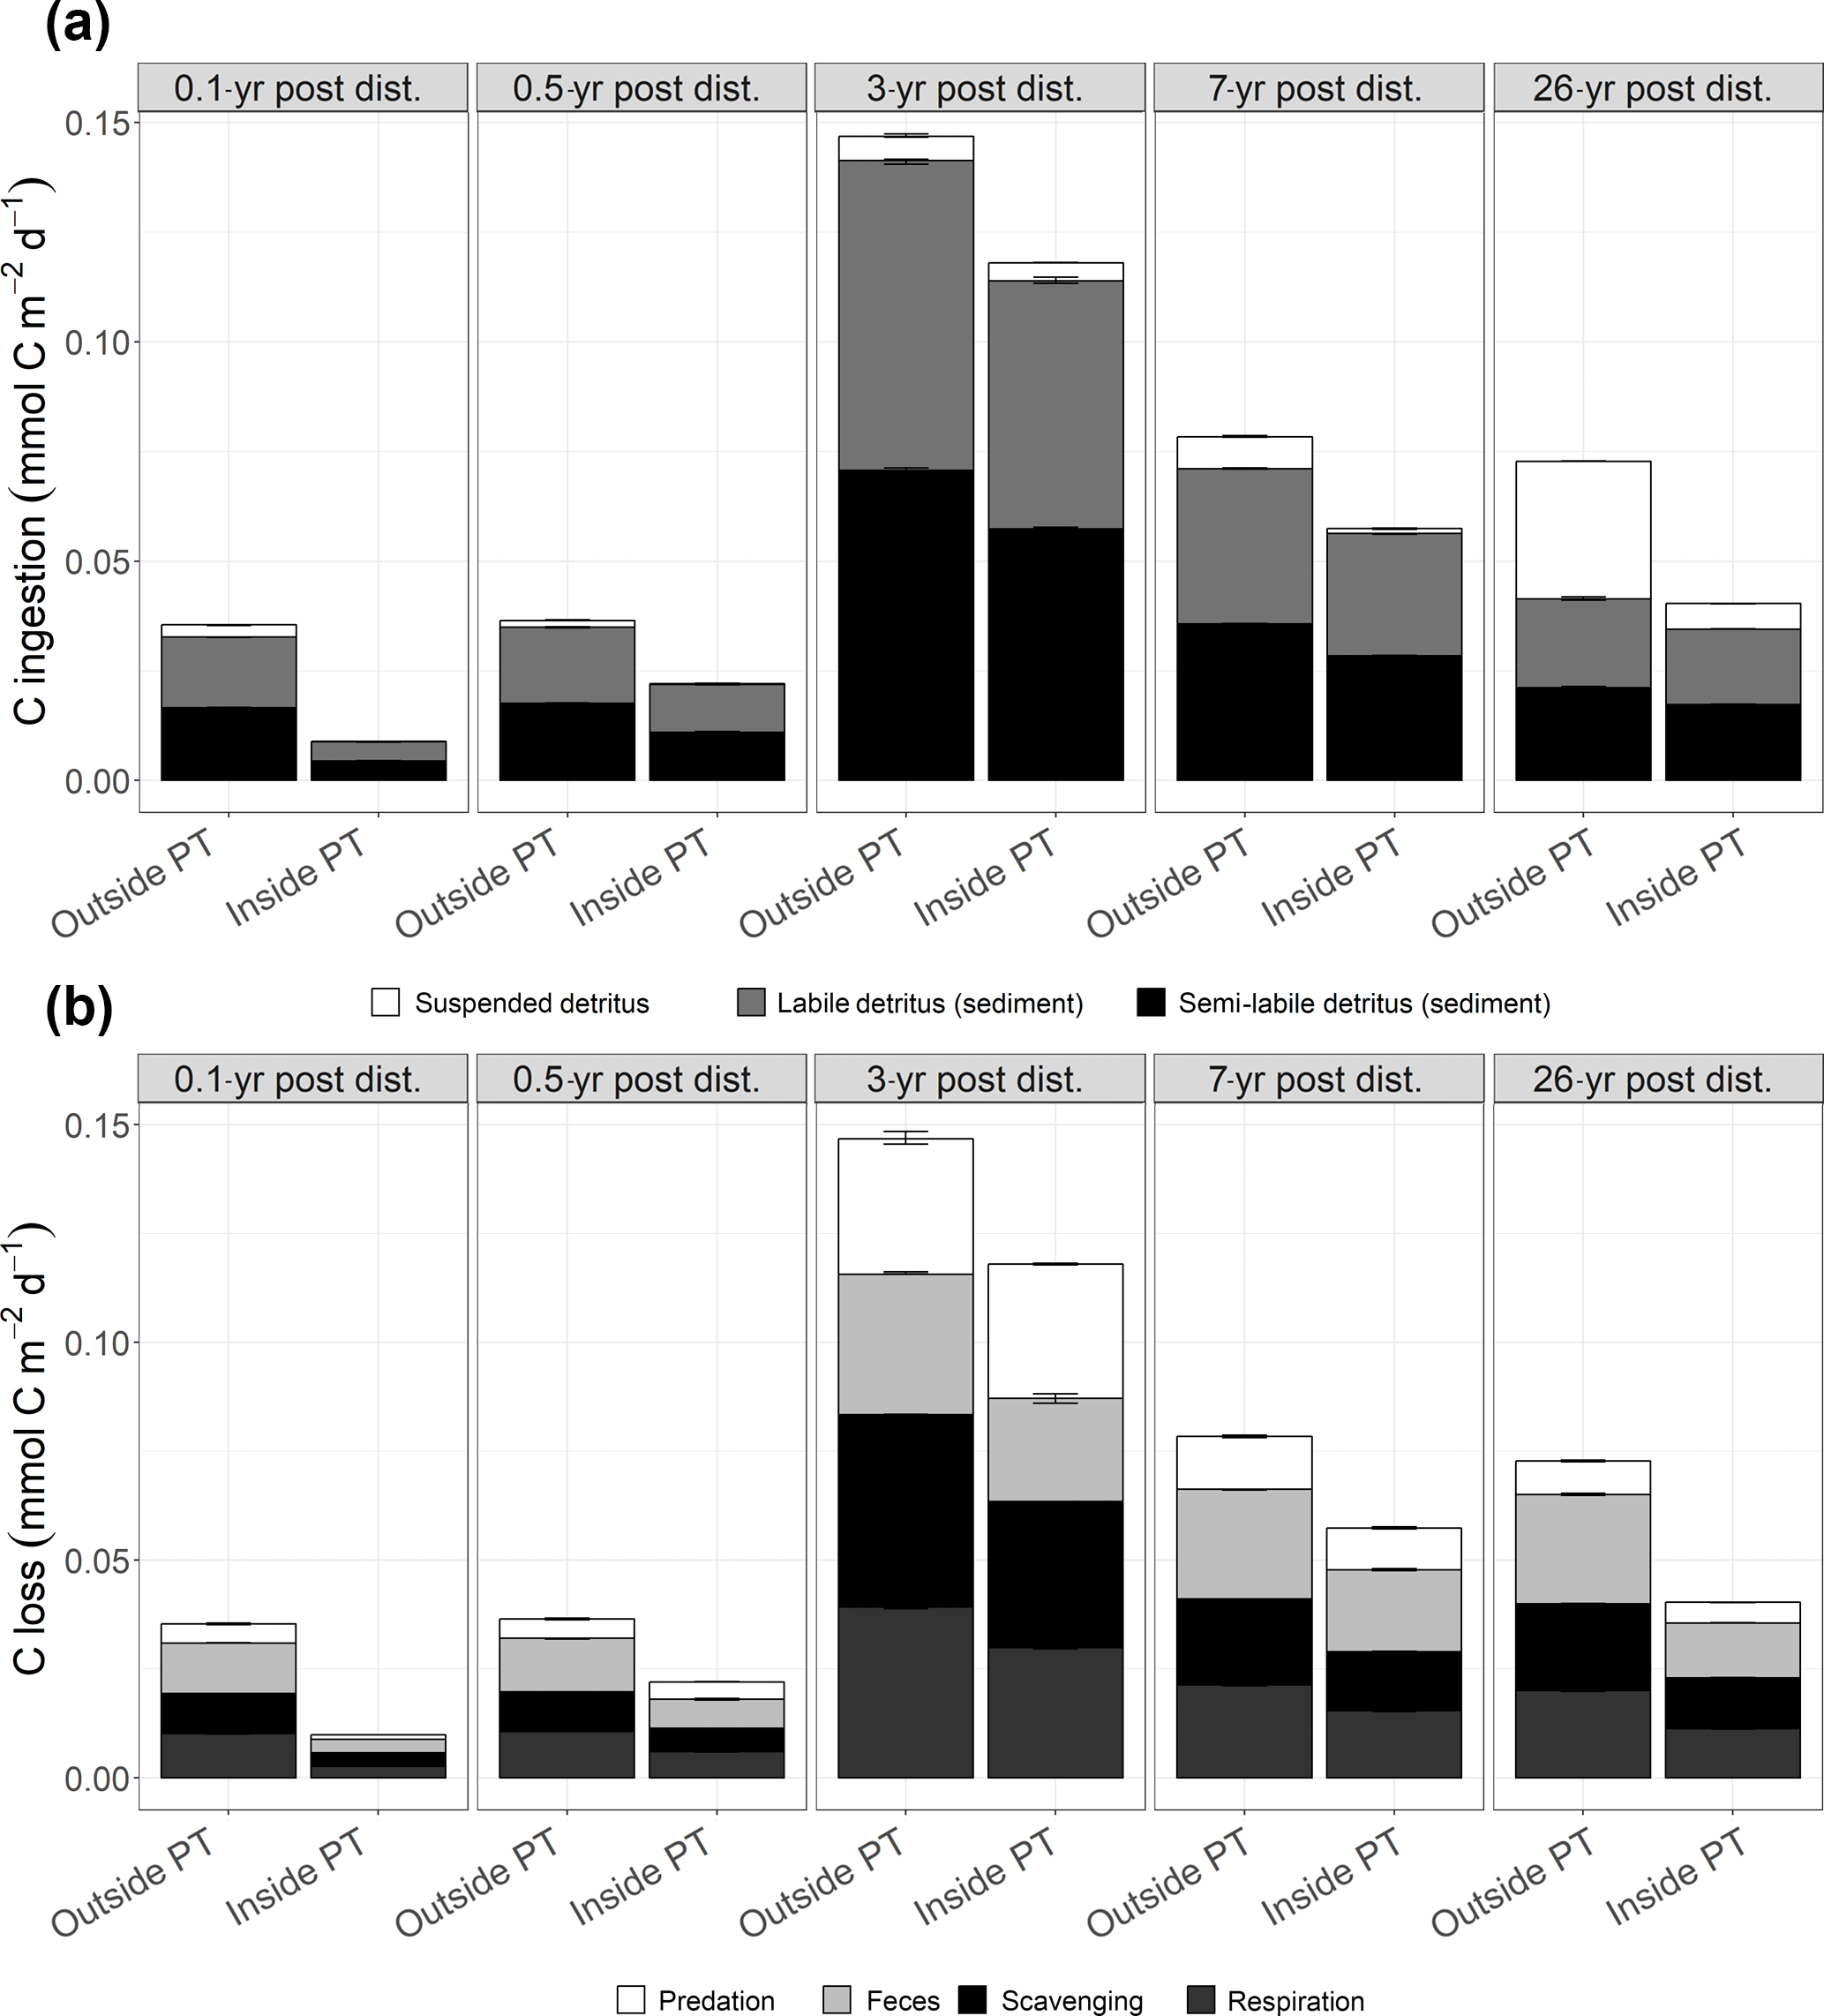
Figure 5(a) Mean faunal carbon ingestion (mmol C m−2 d−1) as suspended detritus, sedimentary labile and sedimentary semi-labile detritus outside and inside plough tracks 0.1-year post-disturbance (PD0.1), 0.5-year post-disturbance (PD0.5), 3-year post-disturbance (PD3), 7-year post-disturbance (PD7), and 26-year post-disturbance events (PD26). (b) Mean carbon losses (mmol C m−2 d−1) from the food webs as predation, feces, scavenging on the carcass, and faunal respiration outside and inside plough tracks during PD0.1, PD0.5, PD3, PD7, and PD26. In both figures, the error bars represent 1 standard deviation.
The network index T.. was compared between the outside and inside plough tracks of the same sampling event by assessing the fraction of the T.. values of the 100 000 model solutions of the outside plough track food web that were larger than the T.. values of the 100 000 model solutions of the outside plough track food web. When this fraction is > 0.95, the difference in “total system throughput” between the two food webs from the same sampling event is considered significantly different (van Oevelen et al., 2011), indicating that carbon flows in the food web from that specific sampling event have not recovered from the experimental disturbance.
3.1 Food-web structure and trophic composition
Total faunal carbon stocks were always higher outside plough tracks as compared to inside plough tracks during the same sampling year (Fig. 2, Supplement 1), and ranged from a minimum of 5.5 ± 1.3 mmol C m−2 (PD0.1) to a maximum 22.3 ± 3.4 mmol C m−2 (PD3) outside plough tracks and from a minimum of 1.4 ± 1.2 mmol C m−2 (PD0.1) to a maximum 15.8 ± 2.0 mmol C m−2 (PD3) inside plough tracks. During PD0.1, the total faunal carbon stock inside plough tracks was only 25 % of the total faunal carbon stock outside plough tracks, whereas during PD3 the total faunal carbon stock inside plough tracks was 71 % of the total faunal carbon stock outside plough tracks. During PD26, the faunal carbon stock inside plough tracks was 54% of the carbon stock outside plough tracks. The absolute weighted Hedges' of all faunal compartment carbon stocks for PD0.1 to PD7 ranged from 0.53 ± 0.02 during PD0.5 to 0.75 ± 0.02 during PD3 (Supplement 3), indicating a moderate experimental effect and therefore that carbon stocks of all faunal compartments failed to recover over the period analyzed (PD0.1 to PD7).
The faunal carbon stocks outside and inside plough tracks from PD0.1 to PD7 were dominated by deposit feeders (from 63 % outside plough tracks to 83 % inside plough tracks during PD0.5 and inside plough tracks during PD3) (Fig. 4). In contrast, outside plough tracks during PD26, filter- and suspension feeders had the largest contribution to total faunal carbon stock (44 %), whereas deposit feeders only contributed 35 %. Inside plough tracks during PD26, deposit feeders had the highest carbon stock (61 %), followed by carnivores (19 %) and filter and suspension feeders (14 %).
Table 3Faunal respiration rate (mmol C m−2 d−1) and contribution (%) of the size classes macrofauna, polychaetes, invertebrate megafauna, and fish to the respiration outside plough tracks (outside PT) and inside plough tracks (inside PT) directly after the disturbance event in March 1989 (PD0.1), 0.5-year post-disturbance (September 1989, PD0.5), 3-year post-disturbance (January 1992, PD3), 7-year post-disturbance (February 1996, PD7), and 26-year post-disturbance events (September 2015, PD26).
3.2 Carbon flows
Total faunal C ingestion (mmol C m−2 d−1) ranged from 8.6 × 10⁻³ ± 1.6 × 10⁻⁵ inside plough tracks during PD0.1 to 1.5 × 10⁻¹ ± 8.6 × 10⁻⁴ outside plough tracks during PD3 and was always lower inside plough tracks compared to outside plough tracks (Fig. 5a; Supplement 4). The ingestion consisted mainly of sedimentary detritus (labile and semi-labile) that contributed between 57 % (outside plough tracks, PD26) and 100 % (inside plough tracks, PD0.1) to the total carbon ingestion.
Faunal respiration (mmol C m−2 d−1) ranged from 6.0 × 10⁻³ ± 6.8 × 10⁻⁵ (inside plough tracks, PD0.5) to 3.9 × 10⁻² ± 3.7 × 10⁻⁴ (outside plough tracks, PD3). During the 26 years after the DISCOL experiment, modeled faunal respiration was always higher outside plough tracks than inside plough tracks (Table 3, Fig. 5b). Over time, non-polychaete macrofauna contributed least to total faunal respiration (Table 3), except inside plough tracks during PD0.5 and at both sites during PD3. During this PD3 sampling campaign, macrofauna contributed 50 % outside plough tracks and 58 % inside plough tracks to total faunal respiration. Polychaetes respired between 19 % of the total fauna respiration outside plough tracks during PD26 and 78 % of total faunal respiration inside plough tracks during PD0.5. Invertebrate megafaunal contribution to respiration was highest during PD26, when they respired 65 % of the total faunal respiration inside plough tracks and 79 % of the total faunal respiration outside plough tracks. The contribution of fish to total faunal respiration was always < 2 %. Besides respiration, feces production contributed between 20 % inside plough tracks during PD3 and 35 % outside plough tracks during PD0.1 to total carbon outflow from the food web (Fig. 5). The contribution of the combined outflow of predation by external predators and scavengers on carcasses to the total C loss from the food web ranged from 50 % inside plough tracks during PD7 to 65 % inside plough tracks during PD0.1.
The fraction of T.. values that were larger for the food webs outside plough tracks than inside plough tracks during the same sampling event was 1.0 at PD0.1, PD0.5, PD3, PD7, and PD26. No decreasing trend in ΔT.. over time was visible (Fig. 6); in fact, the largest ΔT.. values were calculated for PD3 (7.9 × 10⁻² ± 2.0 × 10⁻³ mmol C m−2 d−1) and PD26 (7.7 × 10⁻² ± 9.41 × 10⁻⁴ mmol C m−2 d−1).
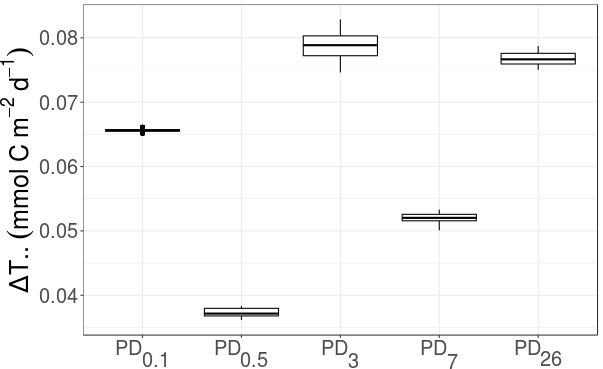
Figure 6Development of ΔT.. (mmol C m−2 d−1), i.e., the difference in “total system throughput” T.. outside plough tracks compared to inside plough tracks, over time. PD0.1 corresponds to 0.1-year post-disturbance, PD0.5 is 0.5-year post-disturbance, PD3 is 3-year post-disturbance, PD7 is 7-year post-disturbance, and PD26 is 26-year post-disturbance event.
This study assessed the change over time of food-web structure and the ecosystem function “faunal C cycling” in an abyssal, nodule-rich, soft-sediment ecosystem after an experimental sediment disturbance. From the 26-year time series, we show that total faunal carbon stock inside plough tracks was still only about half of total faunal carbon stock outside plough tracks. Furthermore, the role of the various feeding types in the carbon cycling differed by feeding type. In all, the “total system throughput” T.., i.e., the sum of all carbon flows in the food web, was still significantly lower inside plough tracks as compared to outside plough tracks 26 years after the experimental mining disturbance.
4.1 Model limitations
Our results are unique, as they allowed us, for the first time, to assess recovery of C cycling in benthic deep-sea food webs from a small-scale sediment disturbance in polymetallic nodule-rich areas. However, the models proposed here come with limitations. Pre-disturbance samples and samples from reference sites were not collected for all food-web compartments. A notable omission is the lack of data for microbes and meiofauna throughout the times series, hence our C cycling models only resolve C cycling by macro- and megafaunal compartments. Another omission is the lack of a baseline to which the “outside plough track” food web at PD0.1 could be compared to assess the impact that the disturbance effect had on sites outside the plough tracks. Hence, we cannot determine whether the high biomass and carbon flows at PD3 were due to the onset of the positive (La Niña) phase of the El Niño Southern Oscillation (Trenberth, 1997), a phenomenon which is known to lead to a comparatively high POC export flux in the Pacific Ocean (e.g., Station M; Ruhl et al., 2008).
Standard procedures to assess invertebrate megafaunal and fish densities have evolved during the 26 years of post-disturbance monitoring. The OFOS system used 26 years after the initial DISCOL experiment took pictures automatically every 20 s from a distance of 1.5 m above the seafloor (Boetius, 2015; Stratmann et al., 2018b). By contrast, the OFOS system used in former cruises was towed approximately 3 m above the seafloor, and pictures were taken selectively by the operating scientists (Bluhm and Gebruk, 1999). Therefore, the procedure used in the former cruises very likely overestimated rare and charismatic invertebrate megafauna, and probably underestimated dominant fauna and organisms of small size (< 3 cm) for PD0.1 to PD7, as compared to PD26.
Previous cruises to the DEA focused on monitoring changes in faunal density and diversity, but not on changes in carbon stock. Hence, a major task in this study was to find appropriate conversion factors to convert density into carbon stocks. However, no individual biomass data for macrofaunal taxa were available for the Peru Basin, so we used data from sampling stations of similar water depths in the eastern CCZ (NE Pacific; Sweetman et al., 2018). As organisms in deep-sea regions with higher organic carbon input are larger than their counterparts from areas with lower organic carbon input (McClain et al., 2012), using individual biomass data from the CCZ, a more oligotrophic region than the Peru Basin (Haeckel et al., 2001; Vanreusel et al., 2016), might have underestimated carbon stocks for macrofauna. However, this potential bias has likely limited the impact on the interpretation of the comparative results within the time series, because the same methodology was applied throughout. Moreover, the determination of invertebrate megafaunal carbon stocks was also difficult, as no size measurements were taken from invertebrate megafaunal individuals during the PD0.1 to PD7 cruises. Consequently, it was not possible to detect differences in size classes between inside and outside plough tracks or recruitment events in, e.g., echinoderms (Ruhl, 2007) following the DISCOL experiment. Instead, we used fixed conversion factors for the different taxa for the entire time series.
4.2 Feeding-type specific differences in recovery
Eight years before the experimental disturbance experiment was conducted at the DISCOL area, Jumars (1981) qualitatively predicted the response of different feeding types in the benthic community to polymetallic nodule removal. Although several seabed test mining or mining simulations were performed since then (Jones et al., 2017), no study compared or verified these conceptual predictions on feeding-type specific differences in recovery from deep-sea mining. As few comparative studies are available, we compare here our food-web model results with those of the conceptual model predictions for scavengers, surface and subsurface deposit feeders, and suspension feeders by Jumars (1981).
Jumars (1981) predicted that organisms inside the mining tracks would be killed either by the fluid shear of the dredge/plough or by abrasion and increased temperatures inside the rising pipe with a mortality rate of > 95 %. In contrast, the impact on mobile and sessile organisms in the vicinity of the tracks would depend on their feeding type (Jumars, 1981).
The author also predicted that the density of mobile scavengers, such as fish and lysianassid amphipods, would rise shortly after the disturbance in response to the increased abundance of dying or dead organisms within the mining tracks. In fact, experiments with baits at PAP and the Porcupine Seabight (NE Atlantic) showed that the scavenging deep-sea fish Coryphaenoides armatus intercept bait within 30 min (Collins et al., 1999) and stayed at the food fall for 114 ± 55 min (Collins et al., 1998). Therefore, the absence of fish inside plough tracks during PD0.1 and PD0.5 could be related to a lack of prey in a potential predator–prey relationship (Bailey et al., 2006). However, because of the relatively small area of plough tracks (only 22 % of the 10.8 km2 of sediment were ploughed; Thiel et al., 1989), the low density of deep-sea fish (e.g., between 7.5 and 32 ind. ha−1 of the dominant fish genus Coryphaenoides sp. at Station M; Bailey et al., 2006) and the high motility of fish, this observation is likely coincidental.
Jumars (1981) predicted that, on a short term, subsurface deposit feeders outside the mining tracks would be the least impacted feeding type, because of their relative isolation from the re-settled sediment, and their relative independence of organic matter on the sediment surface, whereas subsurface deposit feeders inside the mining tracks would experience high mortality. For the long-term recovery, the author pointed to the dependence of subsurface deposit feeders on bacterial production in the sediment covered with re-settled sediment. Moreover, this newly settling sediment would alter both sediment composition and food concentration in the sediment. As the total rate of sediment deposition would increase both inside and beyond mining tracks, Jumars (1981) anticipated that surface deposit feeders would endure stronger impacts from deep-sea mining activities compared with subsurface deposit feeders.
In our food-web model, subsurface and surface deposit feeders were grouped into the deposit feeder category, except for polychaetes, for which we kept the surface–subsurface distinction. The carbon stock of PolSSDF fluctuated by 1 order of magnitude over the 26 year time series and had high carbon stock values outside plough tracks during PD0.1, inside plough tracks during PD3, and inside and outside plough tracks during PD7. Hence, predictions by Jumars (1981) for subsurface deposit feeders are difficult to test, but Hedges' d for PolSSDF was at PD0.1 and decreased steadily to at PD7 (Supplement 3), indicating a very strong experimental effect after the disturbance event and a logarithmic recovery over time. In comparison, the recovery of surface deposit feeders might be delayed, owing to potential unfavorable food conditions as Stratmann et al. (2018b) hypothesized in a study about holothurian densities at the DISCOL experimental area.
Jumars (1981) expected that the suspension feeders outside the mining tracks would be negatively affected during the presence of the sediment plumes and/or as long as their filtration apparatus was clogged by sediment. This “clogging” hypothesis could not be tested here, because the models did not resolve these unknown changes in faunal physiology, so we could only assess carbon cycling differences associated with differences in carbon stocks. Furthermore, Jumars (1981) anticipated that the recovery of nodule-associated organisms, such as filter and suspension feeding Porifera, Antipatharia or Ascidiacea (Vanreusel et al., 2016) would require more than 10 000 years, owing to the slow growth rate of polymetallic nodules (Guichard et al., 1978; Kuhn et al., 2017) and the removal and/or burial of the nodules. This hypothesis could not be tested directly, because nodules were not removed in this experiment, but only ploughed into the sediment. However, the disappearance of nodules from the sediment surface will likely have the same effect on sessile epifauna that depend on nodules as hard substrate independently of the method by which the nodules disappeared. Immediately after the initial DISCOL disturbance event, the respiration rate of filter and suspension feeders inside plough tracks was only 1 % of the respiration rate of this feeding type outside plough tracks. After 26 years, the total respiration rate of filter and suspension feeders inside plough tracks was still 80 % lower than in outside plough tracks. Part of this difference at PD26 resulted from the presence of a single specimen of Alcyonacea with a biomass of 4.71 mmol C m−2 outside plough tracks. Even if we ignore this Alcyonacea specimen in the model, the respiration of suspension and filter feeding inside plough tracks would still be 71 % lower compared to outside plough tracks, indicating a slow recovery of this feeding group.
Deep-sea mining will negatively impact abyssal benthic ecosystems. It is therefore important to be able to estimate how long recovery of the ecosystem after a deep-sea mining operation will take. This study used the linear inverse modeling technique to compare the carbon flows between different food-web compartments outside and inside plough tracks at the DISCOL experimental area in the Peru Basin over a period of 26 years. Even after 26 years, total faunal carbon stock and total food-web activity (i.e., summed carbon cycling) inside plough tracks were only approximately half (54 and 56 %, respectively) of total faunal carbon stock and food-web activity outside plough tracks. Deposit feeders were the least impacted by the sediment disturbance, with less than 3 % relative difference in total carbon loss (i.e., respiration, external predation and feces production) between outside and inside plough tracks after 26 years. In contrast, filter and suspension feeders recovered less and the relative difference in respiration rates between inside and outside plough tracks was 79 %. Overall, ecosystem function (as measured by total carbon cycling) within the macrofauna, invertebrate megafauna, and fish has not fully recovered 26 years after the experimental disturbance.
Conversion factors used to calculate taxon-specific megafaunal biomasses data on carbon stocks of the different food-web compartments are presented in Supplement 1. Stocks of the various food-web compartments are presented in Supplement 2. Data on Hedges' d, the corresponding standard deviations, weighted Hedges' d, and weighted standard deviation are presented in Supplement 3. The mean and standard deviations calculated for each carbon flux over 100 000 iterations for all food webs from outside and inside plough tracks for all time steps is presented in Supplement 4. All OFOS images associated with this article are available at the PANGAEA storage archive (https://doi.org/10.1594/PANGAEA.890634).
The supplement related to this article is available online at: https://doi.org/10.5194/bg-15-4131-2018-supplement.
TS went through the published literature for data input to the model, LL, AP, YM, CR, AR, MRC, ESL, AKS, DOBJ, and KK contributed data, TS and DvO developed the food web models, TS and DvO wrote the manuscript with input from all co-authors.
The authors declare that they have no conflict of interest.
This article is part of the special issue “Assessing environmental impacts of deep-sea mining – revisiting decade-old benthic disturbances in Pacific nodule areas”. It is not associated with a conference.
We thank the chief scientists Jens Greinert (SO242-1) and Antje Boetius
(SO242-2) as well as the captain and crew of R/V Sonne for their
excellent support during both legs of cruise SO242. We also thank the “AUV
Abyss” team from Geomar, Kiel (Germany), Daniëlle de Jonge (Groningen
University, the Netherlands) for identifying the fish species and
Sebastian Rieger (Geomar, Kiel, Germany) for preparing the map of Fig. 1. The
research leading to these results has received funding from the European
Union Seventh Framework Programme (FP7/2007–2013) under the MIDAS project,
grant agreement no. 603418 and by the JPI Oceans – Ecological Aspects of
Deep Sea Mining project “MiningImpact” (NWO-ALW grant 856.14.002) and the
Bundesministerium für Bildung und Forschung (BMBF) grant no. 03F0707A-G.
Further financial support was granted to CESAM (UID/AMB/50017 –
POCI-01-0145-FEDER-007638), to FCT/MCTES by national funds (PIDDAC), and by
co-funding by the FEDER, within the PT2020 Partnership Agreement and Compete
2020. Clara F. Rodrigues was supported by Fundação para a Ciência
e a Tecnologia (FCT) grant (SFRH/BPD/107805/2015).
Edited by: Matthias Haeckel
Reviewed by: Peter
Jumars and one anonymous referee
Amon, D. J., Hilário, A., Martínez Arbizu, P., and Smith, C. R.: Observations of organic falls from the abyssal Clarion-Clipperton Zone in the tropical eastern Pacific Ocean, Mar. Biodivers., 47, 311–321, https://doi.org/10.1007/s12526-016-0572-4, 2017.
Bailey, D. M., Ruhl, H. A., and Smith, K. L.: Long-term change in benthopelagic fish abundance in the abyssal northeast Pacific Ocean, Ecology, 87, 549–555, https://doi.org/10.1890/04-1832, 2006.
Bluhm, H.: Re-establishment of an abyssal megabenthic community after experimental physical disturbance of the seafloor, Deep-Sea Res. Pt. II, 48, 3841–3868, https://doi.org/10.1016/S0967-0645(01)00070-4, 2001.
Bluhm, H. and Gebruk, A. V.: Holothuroidea (Echinodermata) of the Peru Basin – ecological and taxonomic remarks based on underwater images, Mar. Ecol., 20, 167–195, https://doi.org/10.1046/j.1439-0485.1999.00072.x, 1999.
Boetius, A.: RV SONNE SO242/2. Cruise Report/Fahrtbericht, DISCOL revisited, Guayaquil: 28 August 2015 – Guayaquil: 1 October 2015, SO242/2: JPI Oceans Ecological Aspects of Deep-Sea Mining, Bremen, 2015.
Borowski, C.: Physically disturbed deep-sea macrofauna in the Peru Basin, southeast Pacific, revisited 7 years after the experimental impact, Deep-Sea Res. Pt. II, 48, 3809–3839, https://doi.org/10.1016/S0967-0645(01)00069-8, 2001.
Borowski, C. and Thiel, H.: Deep-sea macrofaunal impacts of a large-scale physical disturbance experiment in the Southeast Pacific, Deep-Sea Res. Pt. II, 45, 55–81, https://doi.org/10.1016/S0967-0645(97)00073-8, 1998.
Brey, T., Müller-Wiegmann, C., Zittier, Z. M. C., and Hagen, W.: Body composition in aquatic organisms – A global data bank of relationships between mass, elemental composition and energy content, J. Sea Res., 64, 334–340, https://doi.org/10.1016/j.seares.2010.05.002, 2010.
Childress, J. J., Taylor, S. M., Cailliert, G. M., and Price, M. H.: Patterns of growth, energy utilization and reproduction in some meso- and bathypelagic fishes off Southern California, Mar. Biol., 61, 27–40, 1980.
Clausen, I. and Riisgård, H. U.: Growth, filtration and respiration in the mussel Mytilus edulis: No evidence for physiological regulation of the filter-pump to nutritional needs, Mar. Ecol.-Prog. Ser., 141, 37–45, https://doi.org/10.3354/meps141037, 1996.
Cohen, J.: Statistical power analysis for the behavioral sciences, 2nd Edn., Lawrence Erlbaum Associates, Mahwah, NJ, 1988.
Collins, M. A., Priede, I. G., Addison, S., Smith, A., and Bagley, P. M.: Acoustic tracking of the dispersal of organic matter by scavenging fishes in the deep-sea, Hydrobiologia, 371/372, 181–186, https://doi.org/10.1023/A:1017083107914, 1998.
Collins, M. A., Priede, I. G., and Bagley, P. M.: In situ comparison of activity in two deep-sea scavenging fishes occupying different depth zones, P. Roy. Soc. B-Biol. Sci., 266, 2011–2016, https://doi.org/10.1098/rspb.1999.0879, 1999.
Collins, M. A., Bailey, D. M., Ruxton, G. D., and Priede, I. G.: Trends in body size across an environmental gradient: A differential response in scavenging and non-scavenging demersal deep-sea fish, P. Roy. Soc. B-Biol. Sci., 272, 2051–2057, https://doi.org/10.1098/rspb.2005.3189, 2005.
Crisp, D.: Energy flow measurements, in: Methods for the Study of Marine Benthos, edited by: Holme, N. A. and McIntyre, A. D., 284–367, Blackwell Scientific Publications, Oxford, 1971.
Devey, C. W., Augustin, N., Brandt, A., Brenke, N., Köhler, J., Lins, L., Schmidt, C., and Yeo, I. A.: Habitat characterization of the Vema Fracture Zone and Puerto Rico Trench, Deep-Sea Res. Pt. II, 148, 7–20, https://doi.org/10.1016/j.dsr2.2018.02.003, 2018.
Drazen, J. C. and Sutton, T. T.: Dining in the deep: The feeding ecology of deep-sea fishes, Annu. Rev. Mar. Sci., 9, 337–366, https://doi.org/10.1146/annurev-marine-010816-060543, 2017.
Drazen, J. C., Reisenbichler, K. R., and Robison, B. H.: A comparison of absorption and assimilation efficiencies between four species of shallow- and deep-living fishes, Mar. Biol., 151, 1551–1558, https://doi.org/10.1007/s00227-006-0596-6, 2007.
Dunlop, K. M., van Oevelen, D., Ruhl, H. A., Huffard, C. L., Kuhnz, L. A., and Smith, K. L.: Carbon cycling in the deep eastern North Pacific benthic food web: Investigating the effect of organic carbon input, Limnol. Oceanogr., 61, 1956–1968, https://doi.org/10.1002/lno.10345, 2016.
Durden, J. M., Bett, B. J., Horton, T., Serpell-Stevens, A., Morris, K. J., Billett, D. S. M., and Ruhl, H. A.: Improving the estimation of deep-sea megabenthos biomass: Dimension to wet weight conversions for abyssal invertebrates, Mar. Ecol.-Prog. Ser., 552, 71–79, https://doi.org/10.3354/meps11769, 2016.
Durden, J. M., Ruhl, H. A., Pebody, C. A., Blackbird, S. J., and van Oevelen, D.: Differences in the carbon flows in the benthic food webs of abyssal hill and plain habitats, Limnol. Oceanogr., 62, 1771–1782, https://doi.org/10.1002/lno.10532, 2017.
Foell, E. J., Thiel, H., and Schriever, G.: DISCOL: A long-term, large-scale, disturbance-recolonization experiment in the abyssal eastern tropical south Pacific Ocean, 497–503, Offshore Technology Conference, Houston, Texas, 1990.
Foell, E. J., Thiel, H., and Schriever, G.: DISCOL: A long-term, large-scale disturbance-recolonization experiment in the abyssal eastern tropical South Pacific Ocean, Mar. Eng., 44, 90–94, 1992.
Fox, R., Barnes, R. D., and Ruppert, E. E.: Invertebrate Zoology: A functional evolutionary approach, Brooks/Cole Thompson Learning, Belmont, California, 2003.
Froese, R. and Pauly, D.: FishBase, available at: http://www.fishbase.org (last access: 21 February 2018), 2017.
Froese, R., Thorson, J. T., and Reyes, R. B.: A Bayesian approach for estimating length-weight relationships in fishes, J. Appl. Ichthyol., 30, 78–85, https://doi.org/10.1111/jai.12299, 2014.
Gage, J. D. and Tyler, P. A.: Deep-sea biology: A natural history of organisms at the deep-sea floor, Cambridge University Press, Cambridge, UK, 1991.
Gollner, S., Kaiser, S., Menzel, L., Jones, D. O. B., Brown, A., Mestre, N. C., van Oevelen, D., Menot, L., Colaço, A., Canals, M., Cuvelier, D., Durden, J. M., Gebruk, A. V., Egho, G. A., Haeckel, M., Marcon, Y., Mevenkamp, L., Morato, T., Pham, C. K., Purser, A., Sanchez-Vidal, A., Vanreusel, A., Vink, A., and Martínez Arbizu, P.: Resilience of benthic deep-sea fauna to mining activities, Mar. Environ. Res., 129, 76–101, https://doi.org/10.1016/j.marenvres.2017.04.010, 2017.
Greinert, J. (Ed.): RV Sonne Fahrtbericht/Cruise Report SO242-1. JPI OCEANS Ecological aspects of deep-sea mining, DISCOL revisited, GEOMAR Helmholtz-Zentrum für Ozeanforschung Kiel, 2015.
Guichard, F., Reyss, J.-L., and Yokoyama, Y.: Growth rate of manganese nodule measured with 10Be and 26Al, Nature, 272, 155–156, https://doi.org/10.1038/272155a0, 1978.
Haeckel, M., König, I., Riech, V., Weber, M. E., and Suess, E.: Pore water profiles and numerical modelling of biogeochemical processes in Peru Basin deep-sea sediments, Deep-Sea Res. Pt. I, 48, 3713–3736, 2001.
Hedges, L. V. and Olkin, I.: Estimation of a single effect size: Parametric and non parametric methods, in: Statistical Methods for Meta-Analysis, 75–106, Academic Press, Inc., Orlando, 1985a.
Hedges, L. V. and Olkin, I.: Parametric estimation of effect size from a series of experiments, in: Statistical Methods for Meta-Analysis, 107–145, Academic Press, Inc., Orlando, 1985b.
Hein, J. R., Mizell, K., Koschinsky, A., and Conrad, T. A.: Deep-ocean mineral deposits as a source of critical metals for high- and green-technology applications: Comparison with land-based resources, Ore Geol. Rev., 51, 1–14, https://doi.org/10.1016/j.oregeorev.2012.12.001, 2013.
Jones, D. O. B., Kaiser, S., Sweetman, A. K., Smith, C. R., Menot, L., Vink, A., Trueblood, D., Greinert, J., Billett, D. S. M., Martínez Arbizu, P., Radziejewska, T., Singh, R., Ingole, B., Stratmann, T., Simon-Lledó, E., Durden, J. M., and Clark, M. R.: Biological responses to disturbance from simulated deep-sea polymetallic nodule mining, PLoS One, 12, e0171750, https://doi.org/10.1371/journal.pone.0171750, 2017.
Jumars, P. A.: Limits in predicting and detecting benthic community responses to manganese nodule mining, Mar. Mining, 3, 213–229, 1981.
Jumars, P. A., Dorgan, K. M., and Lindsay, S. M.: Diet of worms emended: An update of polychaete feeding guilds, Annu. Rev. Mar. Sci., 7, 497–520, https://doi.org/10.1146/annurev-marine-010814-020007, 2015.
Kidd, R. B. and Huggett, J.: Rock debris on abyssal plains in the Northeast Atlantic: A comparison of epibenthic sledge hauls and photographic surveys, Oceanol. Acta, 4, 99–104, 1981.
Klepper, O. and Van De Kamer, J. P. G.: The use of mass balances to test and improve the estimates of carbon fluxes in an ecosystem, Math. Biosci., 85, 37–49, https://doi.org/10.1016/0025-5564(87)90098-8, 1987.
Kones, J. K., Soetaert, K., van Oevelen, D., and Owino, J. O.: Are network indices robust indicators of food web functioning? A Monte Carlo approach, Ecol. Model., 220, 370–382, https://doi.org/10.1016/j.ecolmodel.2008.10.012, 2009.
Koopmans, M., Martens, D., and Wijffels, R. H.: Growth efficiency and carbon balance for the sponge Haliclona oculata, Mar. Biotechnol., 12, 340–349, https://doi.org/10.1007/s10126-009-9228-8, 2010.
Koricheva, J., Gurevitch, J., and Mengersen, K.: Handbook of Meta-Analysis in Ecology and Evolution, Princeton University Press, Princeton, 2013.
Kuhn, T., Wegorzewski, A. V., Rühlemann, C., and Vink, A.: Composition, formation, and occurrence of polymetallic nodules, in: Deep-Sea Mining, edited by: Sharma, R., 23–63, Springer International Publishing, Cham., 2017.
Kwasnitschka, T., Köser, K., Sticklus, J., Rothenbeck, M., Weiß, T., Wenzlaff, E., Schoening, T., Triebe, L., Steinführer, A., Devey, C. W., and Greinert, J.: DeepSurveyCam – a deep ocean optical mapping system, Sensors, 16, 164, https://doi.org/10.3390/s16020164, 2016.
Langenkämper, D., Zurowietz, M., Schoening, T., and Nattkemper, T. W.: BIIGLE 2.0 – Browsing and annotating large marine image collections, Front. Mater Sci., 4, 1–10, https://doi.org/10.3389/fmars.2017.00083, 2017.
Levin, L. A., Mengerink, K. J., Gjerde, K. M., Rowden, A. A., Van Dover, C. L., Clark, M. R., Ramírez-Llodrà, E., Currie, B., Smith, C. R., Sato, K. N., Gallo, N., Sweetman, A. K., Lily, H., Armstrong, C. W., and Brider, J.: Defining “serious harm” to the marine environment in the context of deep-seabed mining, Mar. Policy, 74, 245–259, https://doi.org/10.1016/j.marpol.2016.09.032, 2016.
Mahaut, M.-L., Sibuet, M., and Shirayama, Y.: Weight-dependent respiration rates in deep-sea organisms, Deep-Sea Res. Pt. I, 42, 1575–1582, 1995.
Marcon, Y. and Purser, A.: PAPARA(ZZ)I?: An open-source software interface for annotating photographs of the deep-sea, SoftwareX, 6, 69–80, https://doi.org/10.1016/j.softx.2017.02.002, 2017.
McClain, C. R., Johnson, N. A., and Rex, M. A.: Morphological disparity as a biodiversity metric in lower bathyal and abyssal gastropod assemblages, Evolution, 58, 338–348, 2004.
McClain, C. R., Allen, A. P., Tittensor, D. P., and Rex, M. A.: Energetics of life on the deep seafloor, P. Natl. Acad. Sci. USA, 109, 15366–15371, https://doi.org/10.1073/pnas.1208976109, 2012.
Menzies, R. J.: On the food and feeding habits of abyssal organisms as exemplified by the isopoda, Int. Rev. Ges. Hydrobio., 47, 339–358, https://doi.org/10.1002/iroh.19620470303, 1962.
Mondal, S.: Effect of temperature and body size on food utilization in the marine pearl oyster Pinctada fucata (Bivalvia: Pteridae), Indian J. Mar. Sci., 35, 43–49, 2006.
Navarro, E., Iglesias, J. I. P., Ortega, M. M., and Larretxea, X.: The basis for a functional response to variable food quantity and quality in cockles Cerastoderma edule (Bivalvia, Cardiidae), Physiol. Zool., 67, 468–496, 1994.
Nielsen, A. M., Eriksen, N. T., Lønsmann Iversen, J. J., and Riisgård, H. U.: Feeding, growth and respiration in the polychaetes Nereis diversicolor (facultative filter-feeder) and N. virens (omnivorous) – a comparative study, Mar. Ecol.-Prog. Ser., 125, 149–158, https://doi.org/10.3354/meps125149, 1995.
R-Core Team: R: A language and environment for statistical computing, available at: https://www.r-project.org/ (last access: 1 January 2017), 2017.
Radziejewska, T.: Characteristics of the sub-equatorial north-eastern Pacific Ocean's abyss, with a particular reference to the Clarion-Clipperton Fracture Zone, in: Meiobenthos in the Sub-Equatorial Pacific Abyss, 13–28, Springer, Berlin, Heidelberg, 2014.
Ramirez-Llodra, E., Brandt, A., Danovaro, R., De Mol, B., Escobar, E., German, C. R., Levin, L. A., Martinez Arbizu, P., Menot, L., Buhl-Mortensen, P., Narayanaswamy, B. E., Smith, C. R., Tittensor, D. P., Tyler, P. A., Vanreusel, A., and Vecchione, M.: Deep, diverse and definitely different: unique attributes of the world's largest ecosystem, Biogeosciences, 7, 2851–2899, https://doi.org/10.5194/bg-7-2851-2010, 2010.
Ramírez-Llodrà, E., Tyler, P. A., Baker, M. C., Bergstad, O. A., Clark, M. R., Escobar-Briones, E., Levin, L. A., Menot, L., Rowden, A. A., Smith, C. R., and Van Dover, C. L.: Man and the last great wilderness: Human impact on the deep sea, PLoS One, 6, e22588, https://doi.org/10.1371/journal.pone.0022588, 2011.
Randall, R. G.: Using allometry with fish size to estimate production to biomass (P ∕ B) ratios of salmonid populations, Ecol. Freshw. Fish, 11, 196–202, https://doi.org/10.1034/j.1600-0633.2002.00012.x, 2002.
Rex, M. A., Etter, R. J., Morris, J. S., Crouse, J., McClain, C. R., Johnson, N. A., Stuart, C. T., Deming, J. W., Thies, R., and Avery, R.: Global bathymetric patterns of standing stock and body size in the deep-sea benthos, Mar. Ecol.-Prog. Ser., 317, 1–8, https://doi.org/10.3354/meps317001, 2006.
Rowe, G. T.: Biomass and production of the deep-sea macrobenthos, in: Deep-Sea Biology, edited by: Rowe, G. T., John Wiley & Sons, Inc., New York, 1983.
Ruhl, H. A.: Abundance and size distribution dynamics of abyssal epibenthic megafauna in the northeast Pacific, Ecology, 88, 1250–1262, https://doi.org/10.1890/06-0890, 2007.
Ruhl, H. A., Ellena, J. A., and Smith, K. L.: Connections between climate, food limitation, and carbon cycling in abyssal sediment communities, P. Natl. Acad. Sci. USA, 105, 17006–17011, https://doi.org/10.1073/pnas.0803898105, 2008.
Smith, A. B. and Stockley, B.: The geological history of deep-sea colonization by echinoids: Roles of surface productivity and deep-water ventilation, P. Roy. Soc. B-Biol. Sci., 272, 865–869, https://doi.org/10.1098/rspb.2004.2996, 2005.
Smith, C. R., De Leo, F. C., Bernardino, A. F., Sweetman, A. K., and Martínez Arbizu, P.: Abyssal food limitation, ecosystem structure and climate change, Trends Ecol. Evol., 23, 518–528, https://doi.org/10.1016/j.tree.2008.05.002, 2008.
Smith, K. L. and Hessler, R. R.: Respiration of benthopelagic fishes: In situ measurements at 1230 meters, Science, 184, 72–73, 1974.
Stratmann, T., Mevenkamp, L., Sweetman, A. K., Vanreusel, A., and van Oevelen, D.: Has phytodetritus processing by an abyssal soft-sediment community recovered 26 years after an experimental disturbance?, Front. Mar. Sci., 5, 1–13, https://doi.org/10.3389/fmars.2018.00059, 2018a.
Stratmann, T., Voorsmit, I., Gebruk, A. V., Brown, A., Purser, A., Marcon, Y., Sweetman, A. K., Jones, D. O. B., and van Oevelen, D.: Recovery of Holothuroidea population density, community composition and respiration activity after a deep-sea disturbance experiment, Limnol. Oceanogr., https://doi.org/10.1002/lno.10929, 2018b.
Stratmann, T., Soetaert, K., Wei, C.-L., and van Oevelen, D.: The role of benthos in the global marine carbon cycle, Global Biogeochem. Cy., in preparation, 2018c.
Sweetman, A. K., Smith, C. R., Shulse, C. N., Maillot, B., Lindh, M., Church, M. J., Meyer, K. S., van Oevelen, D., Stratmann, T., and Gooday, A. J.: Key role of bacteria in the short-term cycling of carbon at the abyssal seafloor, Limnol. Oceanogr., in prepration, 2018.
Thiel, H. and Forschungsverbund Tiefsee-Umweltschutz: Evaluation of the environmental consequences of polymetallic nodule mining based on the results of the TUSCH Research Association, Deep-Sea Res. Pt. II, 48, 3433–3452, https://doi.org/10.1016/S0967-0645(01)00051-0, 2001.
Thiel, H., Schriever, G., Borowski, C., Bussau, C., Hansen, D., Melles, J., Post, J., Steinkamp, K., and Watson, K.: Cruise Report DISCOL 1, Sonne – Cruise 61. Balboa/Panama – Calloa/Peru 02.02. – 05.03.1989; Callao/Peru – Callao/Peru 07.03. – 03.04.1989, Hamburg, 1989.
Tilot, V.: La structure des assemblages mégabenthiques d'une province à nodules polymétalliques de l'océan Pacifique tropical est, Université de Bretagne Occidentale, 7 July, available at: http://archimer.ifremer.fr/doc/00000/3754/ (last access: 27 June 2018), 1992.
Trenberth, K. E.: The definition of El Niño, B. Am. Meteorol. Soc., 78, 2771–2777, https://doi.org/10.1175/1520-0477(1997)078<2771:TDOENO>2.0.CO;2, 1997.
van Oevelen, D., Van den Meersche, K., Meysman, F. J. R., Soetaert, K., Middelburg, J. J., and Vézina, A. F.: Quantifying food web flows using linear inverse models, Ecosystems, 13, 32–45, https://doi.org/10.1007/s10021-009-9297-6, 2010.
van Oevelen, D., Soetaert, K., García, R., de Stigter, H. C., Cunha, M. R., Pusceddu, A., and Danovaro, R.: Canyon conditions impact carbon flows in food webs of three sections of the Nazaré canyon, Deep-Sea Res. Pt. II, 58, 2461–2476, https://doi.org/10.1016/j.dsr2.2011.04.009, 2011.
Vanreusel, A., Hilário, A., Ribeiro, P. A., Menot, L., and Martínez Arbizu, P.: Threatened by mining, polymetallic nodules are required to preserve abyssal epifauna, Sci. Rep., 6, 26808, https://doi.org/10.1038/srep26808, 2016.
Vézina, A. F. and Platt, T.: Food web dynamics in the ocean. I. Best-estimates of flow networks using inverse methods, Mar. Ecol.-Prog. Ser., 42, 269–287, 1988.