the Creative Commons Attribution 4.0 License.
the Creative Commons Attribution 4.0 License.
 | 19 Jun 2018
Population-specific responses in physiological rates of Emiliania huxleyi to a broad CO2 range
Yong Zhang
Lennart T. Bach
Kai T. Lohbeck
Kai G. Schulz
Luisa Listmann
Regina Klapper
Ulf Riebesell
Although coccolithophore physiological responses to CO2-induced changes in seawater carbonate chemistry have been widely studied in the past, there is limited knowledge on the variability of physiological responses between populations from different areas. In the present study, we investigated the specific responses of growth, particulate organic (POC) and inorganic carbon (PIC) production rates of three populations of the coccolithophore Emiliania huxleyi from three regions in the North Atlantic Ocean (Azores: six strains, Canary Islands: five strains, and Norwegian coast near Bergen: six strains) to a CO2 partial pressure (pCO2) range from 120 to 2630 µatm. Physiological rates of each population and individual strain increased with rising pCO2 levels, reached a maximum and declined thereafter. Optimal pCO2 for growth, POC production rates, and tolerance to low pH (i.e., high proton concentration) was significantly higher in an E. huxleyi population isolated from the Norwegian coast than in those isolated near the Azores and Canary Islands. This may be due to the large environmental variability including large pCO2 and pH fluctuations in coastal waters off Bergen compared to the rather stable oceanic conditions at the other two sites. Maximum growth and POC production rates of the Azores and Bergen populations were similar and significantly higher than that of the Canary Islands population. This pattern could be driven by temperature–CO2 interactions where the chosen incubation temperature (16 ∘C) was slightly below what strains isolated near the Canary Islands normally experience. Our results indicate adaptation of E. huxleyi to their local environmental conditions and the existence of distinct E. huxleyi populations. Within each population, different growth, POC, and PIC production rates at different pCO2 levels indicated strain-specific phenotypic plasticity. Accounting for this variability is important to understand how or whether E. huxleyi might adapt to rising CO2 levels.
- Article
(1639 KB) -
Supplement
(392 KB) - BibTeX
- EndNote


Coccolithophores form a layer of calcium carbonate (CaCO3) platelets (coccoliths) around their cells. Coccoliths are of biogeochemical importance due to ballasting of organic matter with CaCO3, a phenomenon which is thought to promote the transport of organic carbon to the deep ocean (Klaas and Archer, 2002; Rost and Riebesell, 2004). The coccolithophore Emiliania huxleyi forms extensive blooms under favorable light intensity, temperature, and nutrient conditions with different morphotypes in certain regions (Cook et al., 2011; Henderiks et al., 2012; Smith et al., 2012; Balch et al., 2014; Krumhardt et al., 2017).
Variable responses of growth, photosynthetic carbon fixation, and calcification rates of different E. huxleyi strains to rising CO2 levels have been reported (Langer et al., 2009; Hoppe et al., 2011; Müller et al., 2015; Hattich et al., 2017) and are likely a result of intra-specific variability of genotypes (Langer et al., 2009). Several recent studies observed optimum curve responses in physiological rates of a single E. huxleyi strain to a broad pCO2 range from about 20 to 5000 µatm, and linked them to inorganic carbon substrate limitation at low pCO2 and inhibiting H+ concentrations at high pCO2 (Bach et al., 2011, 2015; Kottmeier et al., 2016). Until now, studies on the physiological responses of E. huxleyi to rising CO2 are mostly based on a few genotypes and little is known about the potential variability in CO2 and H+ sensitivity between and within populations. Recently, several studies found substantial variations in CO2 responses for N2 fixation rates between Trichodesmium strains, as well as for growth rates between strains of Gephyrocapsa oceanica, Ostreococcus tauri, and Fragilariopsis cylindrus (Hutchins et al., 2013; Schaum et al., 2013; Pančić et al., 2015; Hattich et al., 2017). Hence, multiple strains, ideally from geographically distinct regions, should be considered for investigating phytoplankton responses to climate change (Zhang et al., 2014; Blanco-Ameijeiras et al., 2016; Krumhardt et al., 2017).
Oceanographic boundaries formed by both ocean currents and environmental factors such as temperature, can limit dispersal of marine phytoplankton, reduce gene flow between geographic populations, and give rise to differentiated populations (Palumbi, 1994). Different populations were found to show different growth rates for E. huxleyi, G. oceanica, and Skeletonema marinoi at the same temperatures, and for Ditylum brightwellii at the same light intensities (Brand, 1982; Rynearson and Armbrust, 2004; Kremp et al., 2012; Zhang et al., 2014). Phenotypic plasticity describes the ability of a strain to change its morphology or physiology in response to changing environmental conditions (Bradshaw, 1965). Plasticity can be assessed by analyzing the reaction norm of one trait and a plastic response may allow a strain to acclimate across an environmental gradient and widen its bio-geographical distribution (Reusch, 2014; Levis and Pfennig, 2016).
In order to better understand how local adaptation affects the physiological response of E. huxleyi to rising CO2 conditions, we isolated 17 strains from three regions in the Atlantic Ocean, and assessed growth, carbon fixation, and calcification responses of the population over a pCO2 range from 120 to 2630 µatm.
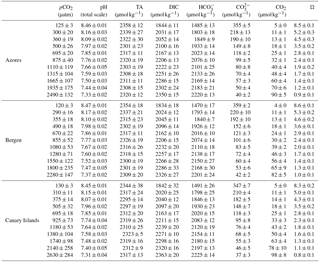
Table 1Surface seawater CO2 levels and pH at the Azores, Bergen, and Canary Islands.

2.1 Cell isolation sites and experimental setup
Emiliania huxleyi strains EHGKL B95, B63, B62, B51, B41, and B17 originated from Raunefjord (Norway, 60∘18′ N, 05∘15′ E) and were isolated by Kai T. Lohbeck in May 2009 (Lohbeck et al., 2012), at ∼ 10 ∘C in situ water temperature. E. huxleyi strains EHGLE A23, A22, A21, A19, A13 and A10 originated from coastal waters near the Azores (38∘34′ N, 28∘42′ W) and were isolated by Sarah L. Eggers in May or June 2010 at ∼ 17 ∘C in situ water temperature. E. huxleyi strains EHGKL C98, C91, C90, C41, and C35 originated from coastal waters near Gran Canaria (27∘58′ N, 15∘36′ W) and were isolated by Kai T. Lohbeck in February 2014 at ∼ 18 ∘C in situ water temperature. Seasonal CO2 concentration in the surface seawater ranges from 240 to 400 µatm near Bergen, from 320 to 400 µatm around the Azores, and from 320 to 400 µatm around the Canary Islands (Table 1). Monthly surface seawater temperature ranges from 6.0 to 16.0 ∘C near Bergen, 15.6 to 22.3 ∘C around the Azores and from 18.0 to 23.5 ∘C around the Canary Islands (Table S1 in the Supplement).
All 17 strains belong to morphotype A (determined by scanning electron microscopy) and have been deposited in the Roscoff culture collection (RCC) under the official names as shown above. Genetically different isolates, here called strains, were identified by five microsatellite markers (P02E09, P02B12, P02F11, EHMS37, EHMS15) (Table S2). For a description of primer testing, deoxyribonucleic acid (DNA) extraction, DNA concentration measurements, and polymerase chain reaction (PCR) protocols see Zhang et al. (2014). The Azores and Bergen strains had been used earlier by Zhang et al. (2014).
The six or five (in case of Canary Islands) strains of each region were used to test the physiological response to varying CO2 concentrations at constant total alkalinity (TA). The experiment was performed in six consecutive incubations, with one strain from each population (Azores, Bergen, Canary Islands) being cultured at a time (Fig. S1 in the Supplement). Monoclonal populations were always grown in sterile-filtered (0.2 µm diameter, Sartobran® P 300, Sartorius) artificial seawater medium (ASW) as dilute batch cultures at 200 light intensity under a 16 ∕ 8 h light ∕ dark cycle (light period: 05:00 to 21:00) at 16 ∘C which we consider to be a compromise for the three different origins of the strains. Nutrients were added in excess (with nitrate and phosphate concentrations of 64 and 4 µmol kg−1, respectively). For the preparation of ASW and nutrient additions see Zhang et al. (2014). Calculated volumes of Na2CO3 and hydrochloric acid were added to the ASW to achieve target CO2 levels at an average TA of 2319±23 µmol kg−1 (Pierrot et al., 2006; Bach et al., 2011). Each strain was grown under 11 CO2 levels ranging from 115 to 3070 µatm without replicate. Mean response variables of all strains with a population were calculated and mean CO2 levels of all strains within a population ranged from 120 to 2630 µatm. Cells grew in the experimental conditions for at least seven generations, which corresponded to 4–7 days depending on cell division rates. Cells were cultured for 4 days in 120–925 µatm CO2, for 5 days in 1080–1380 µatm CO2, and for 6 or 7 days in 1550–2630 µatm CO2. Initial cell concentration was 200 cells mL−1 (estimated from measured pre-culture concentrations and known dilution) and final cell concentration was lower than 100 000 cells mL−1. Dissolved inorganic carbon (DIC) concentrations and pCO2 levels changed less than 7 and 11 %, respectively, during the experimental growth phase.
2.2 pHT and total alkalinity measurements
At 10:00 on the last day of incubations (at day 4–7 depending on CO2 concentration), pHT and TA samples were filtered (0.2 µm diameter, Filtropur S 0.2, Sarstedt) by gentle pressure and stored at 4 ∘C for a maximum of 14 days. The entire sampling lasted less than 2 h. The pHT sample bottles were filled with considerable overflow and closed tightly with no space. The pHT was measured spectrophotometrically (Cary 100, Agilent) using the indicator dye m-cresol purple (Sigma-Aldrich) similar to Carter et al. (2013) with constants of acid dissociation for the protonated and un-protonated forms reported in Clayton and Byrne (1993). TA was measured by open-cell potentiometric titration (862 Compact Titrosampler, Metrohm) according to Dickson et al. (2003). The carbonate system was calculated from measured TA, pHT, (assuming 4 µmol kg−1 of phosphate and 0 µmol kg−1 of silicate) using the CO2 system calculations in MS Excel software (Pierrot et al., 2006) with carbonic acid constants K1 and K2 as determined by Roy et al. (1993).
2.3 Growth rate measurements
At 13:00 on the last day of incubation, 25 mL samples were used to measure cell concentration. Cell concentration was determined within two hours using a Z2 Coulter Particle Counter (Beckman). Growth rate (μ) was calculated according to the following equation:
where N1 is cell concentration on the last day of incubation, N0 is 200 cells mL−1, and d is the time period for growth of algae in days.
2.4 Particulate organic (POC) and inorganic (PIC) carbon measurements
At 15:00 on the last day of incubation, cells for total particulate (TPC) and total organic (TOC) carbon were filtered onto GF/F filters which were pre-combusted at 500 ∘C for 8 h. Samples of background particulate carbon (BPC) were determined in a similar way but using filtered ASW without algae, which was previously adjusted to target pCO2 levels, and allowed to age for about 7 days under incubation conditions (see above). All samples were placed at −20 ∘C. BPC filters were used as blanks to correct for organic carbon in the medium. TOC and BPC filters were acid fumed. Afterwards, all filters were dried for 8 h at 60 ∘C. TPC, TOC, and BPC were measured using an elemental analyzer (EuroEA, Hekatech GmbH). The percentages of BPC in TPC were about 20 % at cell densities < 10 000 cells mL−1 and about 10 % at cell densities > 40 000 cells mL−1. POC was calculated as the difference between TOC and BPC. PIC was calculated as the difference between TPC and TOC. POC and PIC production rates were calculated as follows:
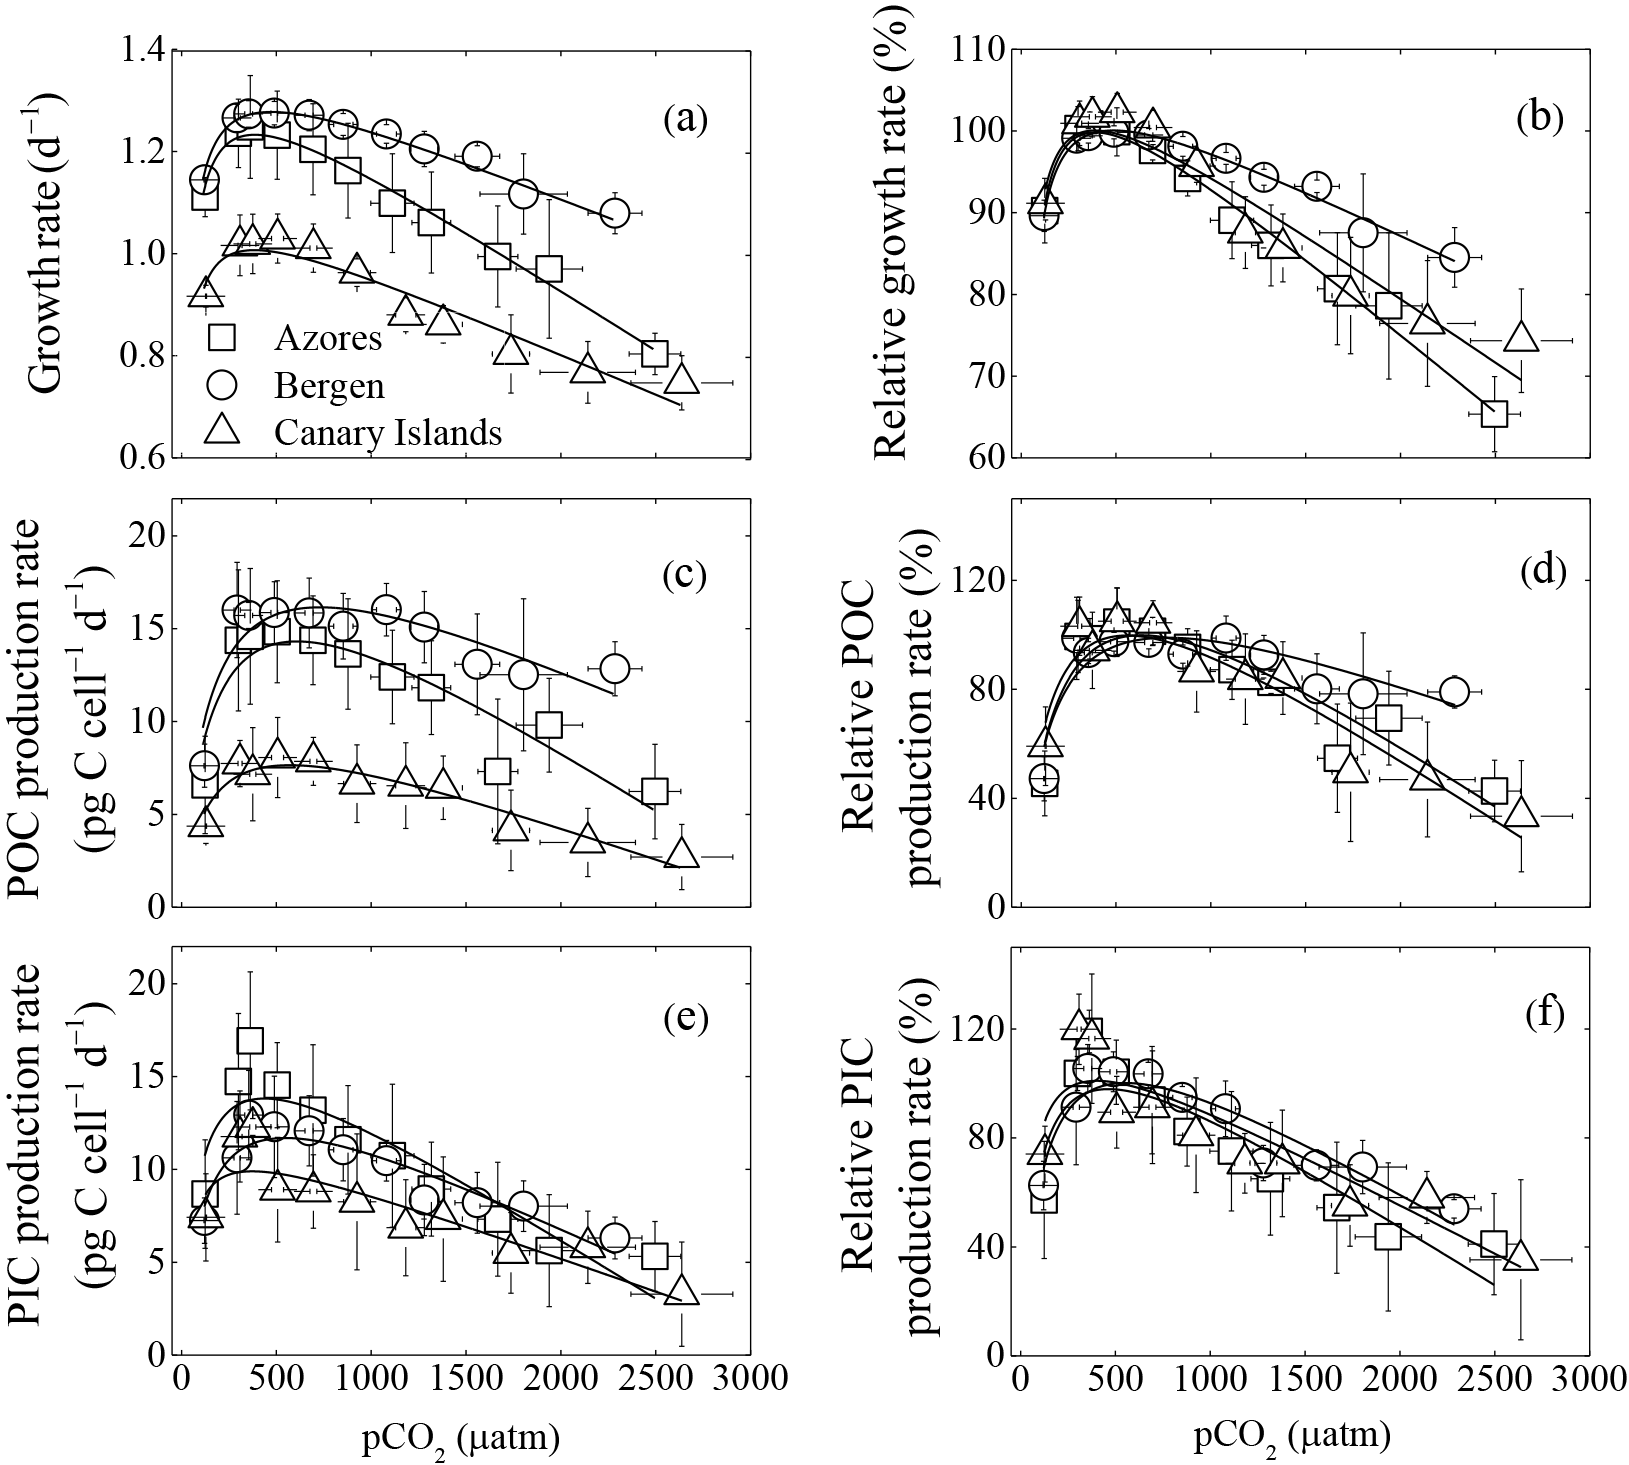
Figure 1Optimum curve responses of measured and relative growth, particulate organic (POC) and inorganic carbon (PIC) production rates of three Emiliania huxleyi populations to a pCO2 range from 120 to 2630 µatm. Responses of measured (a) and relative (b) growth rates to pCO2. Responses of measured (c) and relative (d) POC production rates to pCO2. Responses of measured (e) and relative (f) PIC production rates to pCO2. Using the nonlinear regression model derived by Bach et al. (2011), the curves were fitted based on average growth, POC, and PIC production rates of six strains from the Azores and Bergen, and of five strains from the Canary Islands. Vertical error bars represent standard deviations of six growth, POC, and PIC production rates for the Azores and Bergen populations, and five growth, POC, and PIC production rates for the Canary Islands population. Horizontal error bars represent standard deviations of six pCO2 levels for the Azores and Bergen populations and five pCO2 levels for the Canary Islands populations. At the population levels, 120 and 2630 µatm was the lowest and highest pCO2 level, respectively.
2.5 Data analysis
In a broad pCO2 range, physiological rates are expected to initially increase quickly until reaching an optimum and then decline towards further increasing CO2 levels (e.g., Krug et al., 2011). Hence we used the following modified Michaelis–Menten equation (Bach et al. 2011), which was fitted to measured cellular growth, POC, and PIC production rates, and yield theoretical optimum pCO2 and maximum values for each of the three populations (combining the data of five or six strains) (Bach et al., 2011).
where X and Y are fitted parameters, and s, the sensitivity constant, depicts the slope of the decline after optimum CO2 levels in response to rising H+. Based on the fitted X, Y and s, we calculated pCO2 optima (Km) (Eq. 5) and maximum growth, POC, and PIC production rates following Bach et al. (2011).
The relative values for growth, POC, and PIC production rates were calculated as ratios of growth, POC, and PIC production rates at each pCO2 level to the maximum (highest) rates. We obtained the relative sensitivity constant by fitting function (4) based on relative growth, POC, and PIC production rates.
A one-way ANOVA was then used to test for statistically significant differences in theoretical optimum pCO2, maximum value and relative sensitivity constant between populations. A Tukey HSD test was conducted to determine the differences between strains from different populations. A Shapiro–Wilk's analysis was tested to analyze residual normality. Statistical calculations were carried out using R and significance was shown by p<0.05.
Table 2Carbonate chemistry parameters (mean values for the beginning and end of the incubations) of the artificial seawater for each Emiliania huxleyi population. The pH and TA samples were collected and measured before and at the end of incubation. Data are expressed as mean values of six strains in the Azores and Bergen population, and five strains in the Canary Islands population.
3.1 Carbonate chemistry parameters
Carbonate system parameters are shown in Table 2. Average pCO2 levels of the ASW ranged from 125 to 2490 µatm for the Azores population, from 120 to 2280 µatm for the Bergen population, and from 130 to 2630 µatm for the Canary Islands population. Corresponding pHT values of the ASW ranged from 8.46 to 7.33 for the Azores population, from 8.47 to 7.37 for the Bergen population, and from 8.45 to 7.31 for the Canary Islands population.
3.2 Measured growth, POC, and PIC production rates of each population
As expected, growth rates, POC, and PIC production rates of the three E. huxleyi populations increased with rising pCO2, reached a maximum, and then declined with further pCO2 increase (Fig. 1). Growth rates of the Azores and Bergen populations were larger than those of the Canary Islands population at all investigated pCO2 levels (Fig. 1a). With rising pCO2 levels beyond the pCO2 optimum, decline in growth rates was more pronounced in the Azores and Canary Islands populations than in the Bergen population (Fig. 1b).
Measured POC production rates of the Azores and Bergen populations were larger than those of the Canary Islands population at all pCO2 levels (Fig. 1c) and decline in POC production rates with increasing pCO2 levels beyond the pCO2 optimum was larger in the Azores and Canary Islands populations than in the Bergen population (Fig. 1d).
Measured PIC production rates at investigated pCO2 levels did not show significant differences among the Azores, Bergen and Canary Islands populations (Fig. 1e). Exceptions were that at 365–695 µatm, PIC production rates of the Azores population were larger than those of the Canary Islands population (all p<0.05).
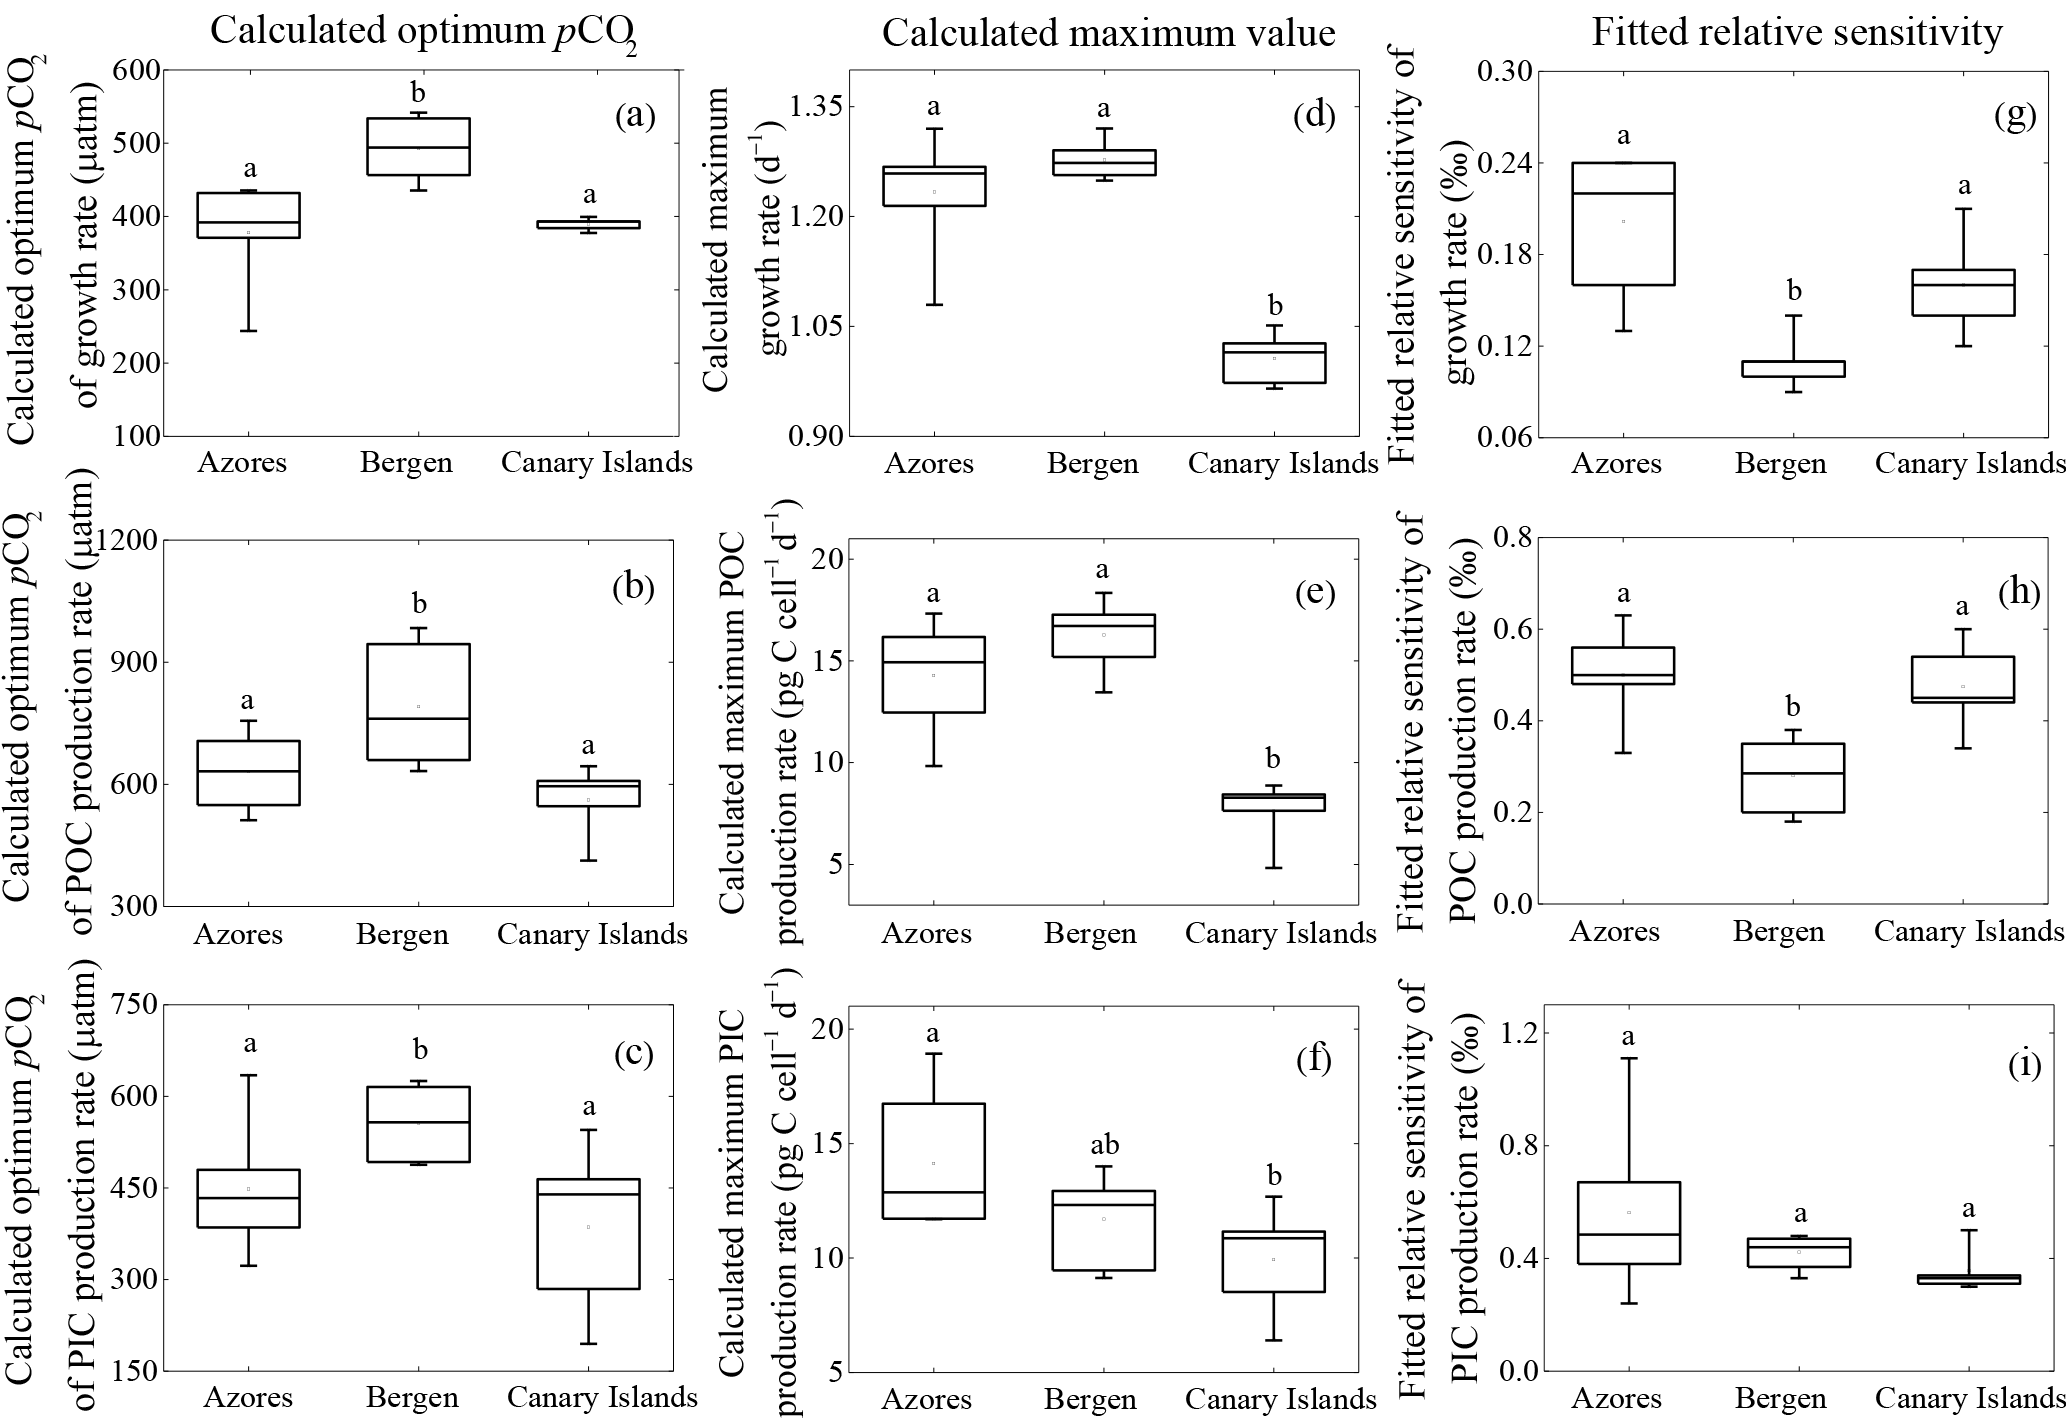
Figure 2Calculated optimum pCO2, calculated maximum value and fitted relative sensitivity constant of growth, POC, and PIC production rates of each population. (a) optimum pCO2 of growth rate; (b) optimum pCO2 of POC production rates; (c) optimum pCO2 of PIC production rates; (d) maximum growth rate, (e) maximum POC production rate, (f) maximum PIC production rate; (g) relative sensitivity constant of growth rate; (h) relative sensitivity constant of POC production rate; (i) relative sensitivity constant of PIC production rate. The line in the middle of each box indicates the mean of 6 or 5 optimum pCO2, 6 or 5 maximum values, and 6 or 5 relative sensitivity constants for growth, POC, and PIC production rates in each population. Bars indicate the 99 % confidence interval. The maximum or minimum data are shown as the small line on the top or bottom of the bar, respectively. Letters in each panel represent statistically significant differences (Tukey HSD, p<0.05).
3.3 Physiological responses of populations to pCO2
Calculated optimum pCO2 for growth, POC, and PIC production rates of the Bergen population were significantly larger than those of the Azores and Canary Islands populations (all p<0.05) (Fig. 2a–c). Optimum pCO2 for these physiological rates between the Azores and Canary Islands population were not different (all p>0.1).
Calculated maximum growth rates, POC, and PIC production rates were not significantly different between the Azores and the Bergen populations (all p>0.1) (Fig. 2d–f). Maximum growth rate and POC production rate of the Canary Islands population were significantly lower than those of the Azores and Bergen populations (both p<0.01) (Fig. 2d, e). Maximum PIC production rates of the Canary Islands population were significantly lower than that of the Azores population (p<0.05), while there was no difference to the Bergen population (p>0.1) (Fig. 2f).
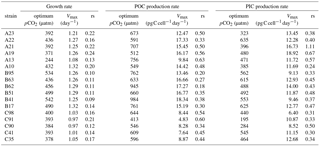
Table 3Calculated optimum pCO2, calculated maximum value (Vmax), and fitted relative sensitivity constant (rs, ‰) of growth, POC, and PIC production rates of each E. huxleyi strain.
Fitted relative sensitivity constants for growth and POC production rates of the Bergen population were significantly lower than those of the Azores and Canary Islands populations (p<0.01) (Fig. 2g, h). Fitted relative sensitivity constants for growth and POC production rates between the Azores and Canary Islands populations were not significantly different (p>0.1). Fitted relative sensitivity constants for PIC production rates did not show difference among three populations (p=0.13) (Fig. 2i).
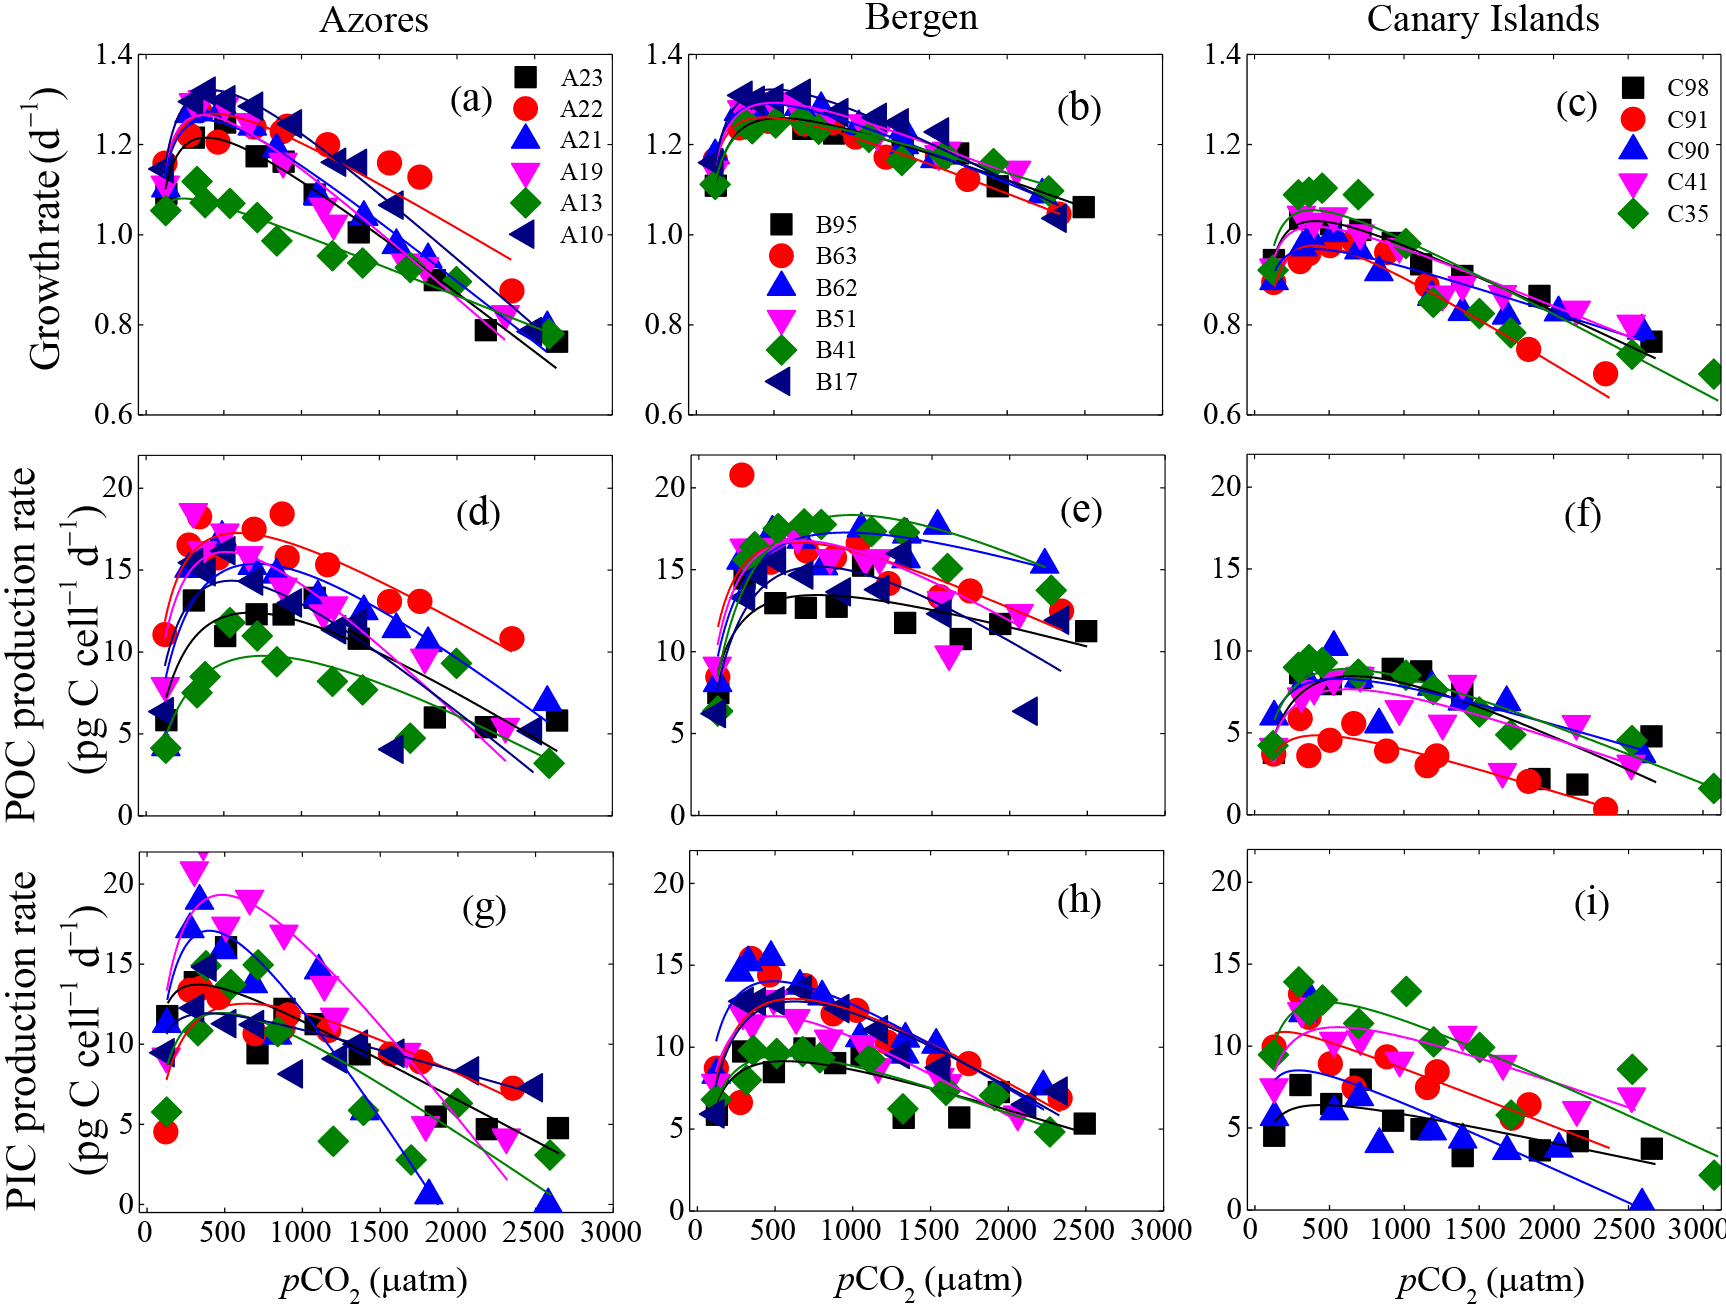
Figure 3Optimum curve responses of growth, POC, and PIC production rates of individual E. huxleyi strains in the Azores (left), Bergen (center), and Canary Islands (right) populations to a CO2 range from 115 to 3070 µatm. Growth rates of each strain as a function of pCO2 within the Azores (a), Bergen (b), and Canary Islands (c) populations. POC production rates of each strain as a function of pCO2 within the Azores (d), Bergen (e) and Canary Islands (f) populations. PIC production rates of each strain as a function of pCO2 within the Azores (g), Bergen (h), and Canary Islands (i) populations. At the strain levels, 115 and 3070 µatm was the lowest and highest pCO2 level, respectively.
3.4 Physiological responses of individual strains to pCO2
Measured growth rates, POC, and PIC production rates of 17 E. huxleyi strains showed optimum curve response patterns to the broad pCO2 gradient (Fig. 3). Variations in calculated pCO2 optima, maximum values, and relative sensitivity constants of physiological rates were found between the strains (Table 3).
For all strains within each population, optimum pCO2 of POC production rates were larger than optimum pCO2 of growth rates or PIC production rates with the exception of optimum pCO2 of POC and PIC production rates of E. huxleyi strain EHGLE A22 (Table 3). Compared to the Azores and Bergen populations, strains isolated near the Canary Islands showed larger variation in optimum pCO2 of PIC production rates. Within the Azores population, variations in maximum values (Vmax) and relative sensitivity constants (rs) of growth, POC, and PIC production rates of all strains were larger than those within the Bergen and Canary Islands populations (Fig. 3).
We investigated growth, POC, and PIC production rates of 17 E. huxleyi strains from three populations to a broad pCO2 range (120–2630 µatm). The three populations differed significantly in growth and POC production rates at the investigated pCO2 levels. The reaction norms of the individual strains and populations equaled an optimum curve for all physiological rates (Figs. 1 and 3). However, we detected distinct pCO2 optima for growth, POC, and PIC production rates, and different H+ sensitivities for growth and POC production rates among them (Fig. 2). These results indicate the existence of distinct populations in the cosmopolitan coccolithophore E. huxleyi.
In comparison to the Azores and Canary Islands populations, variability in growth rates between strains of the Bergen population was smaller even though they had higher growth rates at all pCO2 levels (Fig. 3). Furthermore, the Bergen population showed significantly higher pCO2 optima and lower H+ sensitivity for growth and POC production rates (Fig. 2). These findings indicate that the Bergen population may be more tolerant to changing carbonate chemistry in terms of its growth and photosynthetic carbon fixation rates. The Bergen strains were isolated from coastal waters, while the Azores and Canary Islands strains were isolated from a more oceanic environment. Seawater carbonate chemistry of coastal waters is usually more dynamic than in the open ocean (Cai, 2011). In fact, previous studies have reported that CO2 and pH variability of the seawater off Bergen was larger than off the Azores and Canary Islands (Table 1). In addition, due to riverine input, seawater upwelling, and metabolic activity of plankton communities, environmental variability in coastal waters are larger than in open-ocean ecosystems (Duarte and Cerbrian, 1996). Doblin and van Sebille (2016) suggested that phytoplankton populations should be constantly under selection when experiencing changing environmental conditions. In this case, the Bergen population, exposed to larger CO2 or pH fluctuations, may have acquired a higher capacity to acclimate to changing carbonate chemistry resulting in a higher tolerance (or lower sensitivity) to rising CO2 levels. In contrast, the Azores and Canary Islands populations experience similar, less variable seawater carbonate chemistry conditions in their natural environment, which could explain why they also show similar pCO2 optima and H+ sensitivity for physiological rates (Fig. 2).
In an earlier study (Zhang et al., 2014), growth rates of the same Azores and Bergen strains as used here were measured at 8–28 ∘C. While at 26–28 ∘C the Bergen strains grew slower than the Azores strains, at 8 ∘C the Azores strains grew slower than the Bergen strains. This illustrates how adaptation to local temperature can significantly affect growth of E. huxleyi strains in laboratory experiments. Considering these findings and the temperature ranges of the three isolation locations (Table S1), the incubation temperature of 16 ∘C used in the present study was lower than the minimum sea surface temperature (SST) commonly recorded at the Canary Islands. In contrast, SSTs of 16 ∘C and lower have been reported for Azores and Bergen waters (Table S1). When exposed to 16 ∘C, growth rate of the Canary Islands population might have already been below their optimum and hence significantly reduced in comparison to the other populations (Fig. 2d).
Furthermore, compared to the Canary Islands population, the Azores population had higher maximum growth and POC production rates, and similar optimum CO2 for these physiological rates. Again, this might be related to sub-optimal incubation conditions as temperature has been found to significantly modulate CO2 responses in coccolithophores in terms of maximum rates, CO2 optima and half-saturation, and H+ sensitivity (Sett et al., 2014; Gafar et al., 2018; Gafar and Schulz, 2018). In a similar fashion, light can also modulate CO2 responses, hence different requirements by strains adapted to different light availabilities could also explain our observations (Zhang et al., 2015; Gafar et al., 2018; Gafar and Schulz, 2018). Thus, with rising CO2, growth, photosynthetic carbon fixation and calcification rates of the Canary Islands population cannot increase as much as in the Azores and Bergen populations. In addition, the Canary Islands population showed smallest variability in optimum pCO2 and maximum values for growth and POC production rates (Fig. 2). The reason may be that low incubation temperature predominantly limited growth and POC production rates of the Canary Islands population, and decreased the sensitivities of these physiological rates to rising pCO2.
Before we started this experiment, strains isolated from the Azores, Bergen, and Canary Islands grew as stock cultures at 15 ∘C and 400 µatm for 4 years, 5 years and 3 months, respectively. Schaum et al. (2015) provide evidence that long-term laboratory incubation affects responses of phytoplankton to different pCO2 levels. Thus, it is conceivable that the same selection history in the laboratory incubation may contribute to a more similar response of growth, POC, and PIC production rates between the Azores and Bergen populations at low pCO2 levels (Fig. 1).
Our results indicate that E. hulxyei populations are adapted to the specific environmental conditions of their origin, resulting in different responses to increasing pCO2 levels. The ability to adapt to diverse environmental conditions is supposed to be one reason for the global distribution of E. huxleyi (Paasche, 2002), spanning a temperature range of about 30 ∘C. In addition, these results will improve our understanding on variation in physiological responses of different E. huxleyi populations to climate change, and variation in production of different areas in future oceans. The optimum temperature for growth of the Bergen population was about 22 ∘C and was 5 ∘C higher than the maximum SST in Bergen waters (Zhang et al., 2014). Furthermore, in comparison to the Azores and Canary Islands populations, larger optimum pCO2 of growth rate indicates that the Bergen population may benefit more from the rising CO2 levels. PIC : POC ratios of the Azores and Bergen populations declined with rising pCO2, whereas PIC : POC ratios of the Canary Islands population were rather constant (Figs. S6, S7). As changes in PIC : POC ratios of coccolithophore blooms were suggested to impact on biological carbon pump (Rost and Riebesell, 2004), variation in PIC : POC ratios of different populations indicates that different regions might have different changes in marine carbon cycle in the future ocean. In natural seawater, due to ocean currents and gene flow, populations at any given location may get replaced by immigrant genotypes transported there from other locations (Doblin and van Sebille, 2016). In addition, E. huxleyi is thought to utilize for calcification which generates protons, and increase in proton concentration may mitigate the potential of the ocean to absorb atmospheric CO2 and then give a positive feedback to rising atmosphere CO2 levels (Paasche, 2002).
Within a population, individual strains showed different growth, POC, and PIC production rates at different pCO2 levels, indicating phenotypic plasticity of individual strains (Reusch, 2014). Phenotypic plasticity constitutes an advantage for individual strains to acclimate and adapt to elevated pCO2 by changing fitness-relevant traits and potentially to attenuate the short-term effects of changing environments on fitness-relevant traits (Schaum et al., 2013).
The strain-specific CO2-response curves revealed considerable physiological diversity in co-occurring strains (Fig. 3). Physiological variability makes a population more resilient, increases its ability to persist in variable environments and potentially forms the basis for selection (Gsell et al., 2012; Hattich et al., 2017). It is clear that other environmental factors such as light intensity, temperature, and nutrient concentration affect the responses of physiological rates of individual E. huxleyi strains to changing carbonate chemistry, and thus change the physiological variability within populations (Zhang et al., 2015; Feng et al., 2017). However, different sensitivities and requirements of each strain to the variable environments can allow strains to co-exist within a population in the natural environment (Hutchinson, 1961; Reed et al., 2010; Krueger-Hadfield et al., 2014). In a changing ocean, strain succession is likely to occur and shift the population composition (Blanco-Ameijeiras et al., 2016; Hattich et al., 2017). Strains with higher growth rates or other competitive abilities may out compete others (Schaum et al., 2013). Further, a significant positive correlation between growth and POC production rate or POC quota (Fig. S5) indicates that higher growth rate means larger populations and then greater production.
In the present study, we found population-specific responses in physiological rates of E. huxleyi to a broad pCO2 range, which may have arisen from local adaptation to environmental conditions at their origins. The existence of distinct E. huxleyi populations and phenotypic plasticity of individual strains may both be important for E. huxleyi when adapting to natural environmental variability and to ongoing climate changes. Our results suggest that when assessing phytoplankton responses to changing environments on a global scale, variability in population and strain responses need to be considered. In this study, we only studied the effects of rising CO2 but future studies should take into account simultaneous effects from other interacting factors such as light and temperature variability.
The manuscript and all data can be found in following link: https://issues.pangaea.de/projects/PDI/issues/PDI-17737?filter=allopenissues, last access: 15 June 2018.
The supplement related to this article is available online at: https://doi.org/10.5194/bg-15-3691-2018-supplement.
YZ, LTB, UR designed the experiment. YZ, LL, RK performed the experiment. YZ prepare the manuscript and all authors analyzed the data, reviewed and improved the manuscript.
The authors declare that they have no conflict of interest.
The authors thank Jana Meyer for particulate organic and inorganic carbon
measurements. This work was supported by the German Federal Ministry of
Education and Research (Bundesministerium für Bildung und Forschung) in
the framework of the collaborative project Biological Impacts of Ocean
Acidification (BIOACID). Kai G. Schulz is the recipient of an Australian
Research Council Future Fellowship (FT120100384). We also thank the China
Postdoctoral Science Foundation (2017M612129) and Outstanding Postdoctoral
Scholarship in State Key Laboratory of Marine Environmental Science at
Xiamen University for their support of Yong Zhang.
Edited by: Katja Fennel
Reviewed by: two anonymous referees
Bach, L. T., Riebesell, U., and Schulz, K. G.: Distinguishing between the effects of ocean acidification and ocean carbonation in the coccolithophore Emiliania huxleyi, Limnol. Oceanogr., 56, 2040–2050, https://doi.org/10.4319/lo.2011.56.6.2040, 2011.
Bach, L. T., Riebesell, U., Gutowska, M. A., Federwisch, L., and Schulz, K. G.: A unifying concept of coccolithophore sensitivity to changing carbonate chemistry embedded in an ecological framework, Prog. Oceanogr., 135, 125–138, https://doi.org/10.1016/j.pocean.2015.04.012, 2015.
Balch, W. M., Drapeau, D. T., Bowler, B. C., Lyczkowski, E. R., Lubelczyk, L. C., Painter, S. C., and Poulton, A. J.: Surface biological, chemical, and optical properties of the Patagonian Shelf coccolithophore bloom, the brightest waters of the Great Calcite Belt, Limnol. Oceanogr., 59, 1715–1732, https://doi.org/10.4319/lo.2014.59.5.1715, 2014.
Blanco-Ameijeiras, S., Lebrato, M., Stoll, H. M., Iglesias-Rodriguez, D., Müller, M. N., Méndez-Vicente, A., and Oschlies, A: Phenotypic variability in the coccolithophore Emiliania huxleyi, PLoS ONE, 11, e0157697, https://doi.org/10.1371/journal.pone.0157697, 2016.
Bradshaw, A. D.: Evolutionary significance of phenotypic plasticity in plants, Adv. Genet, 13, 115–155, https://doi.org/10.1016/S0065-2660(08)60048-6, 1965.
Brand, L. E.: Genetic variability and spatial patterns of genetic differentiation in the reproductive rates of the marine coccolithophores Emiliania huxleyi and Gephyrocapsa oceanica, Limnol. Oceanogr., 27, 236–245, https://doi.org/10.4319/lo.1982.27.2.0236, 1982.
Cai, W. J.: Estuarine and coastal ocean carbon paradox: CO2 sinks or sites of terrestrial carbon incineration?, Ann. Rev. Mar. Sci., 3, 123–145, https://doi.org/10.1146/annurev-marine-120709-142723, 2011.
Carter, B. R., Radich, J. A., Doyle, H. L., and Dickson, A. G.: An automated system for spectrophotometric seawater pH measurements, Limnol. Oceanogr.-Methods, 11, 16–27, https://doi.org/10.4319/lom.2013.11.16, 2013.
Clayton, T. D. and Byrne, R. H.: Spectrophotometric seawater pH measurements–Total hydrogen-ion concentration scale calibration of m-cresol purple and at-sea results, Deep Sea Res. I, 40, 2115–2129, https://doi.org/10.1016/0967-0637(93)90048-8, 1993.
Cook, S. S., Whittock, L., Wright S. W., and Hallegraeff, G. M.: Photosynthetic pigment and genetic differences between two southern ocean morphotypes of Emiliania huxleyi (Haptophyta), J. Phycol., 47, 615–626, https://doi.org/10.1111/j.1529-8817.2011.00992.x, 2011.
Dickson, A. G., Afghan, J. D., and Anderson, G. C.: Reference materials for oceanic CO2 analysis: a method for the certification of total alkalinity, Mar. Chem., 80, 185–197, https://doi.org/10.1016/S0304-4203(02)00133-0, 2003.
Doblin, M. A. and van Sebille, E.: Drift in ocean currents impacts intergenerational microbial exposure to temperature, P. Natl. Acad. Sci. USA, 113, 5700–5705, https://doi.org/10.1073/pnas.1521093113, 2016.
Duarte, C. M. and Cerbrian, J.: The fate of marine autotrophic production, Limnol. Oceanogr., 41, 1758–1766, 1996.
Feng, Y. Y., Roleda, M. Y., Armstrong, E., Boyd, P. W., and Hurd, C. L.: Environmental controls on the growth, photosynthetic and calcification rates of a Southern Hemisphere strain of the coccolithophore Emiliania huxleyi, Limnol. Oceanogr., 62, 519–540, https://doi.org/10.1002/lno.10364, 2017.
Gafar, N. A. and Schulz, K. G.: A niche comparison of Emiliania huxleyi and Gephyrocapsa oceanica and potential effects of climate change, Biogeosciences Discuss., https://doi.org/10.5194/bg-2018-88, in review, 2018.
Gafar, N. A., Eyre, B. D., and Schulz, K. G.: A conceptual model for projecting coccolithophorid growth, calcification and photosynthetic carbon fixation rates in response to global ocean change, Front. Mar. Sci., 4, 433, https://doi.org/10.3389/fmars.2017.00433, 2018.
González-Dávila, M. and Santana-Casiano, M.: Seasonal and interannual variability of sea-surface carbon dioxide species at the European Station for Time Series in the Ocean at the Canary Islands (ESTOC) between 1996 and 2000, Global Biogeochem. Cy., 17, 1076, https://doi.org/10.1029/2002GB001993, 2003.
Gsell, A. S., de Senerpont-Domis, L. N., Przytulska-Bartosiewicz, A., Mooij, W. M., van Donk, E., and Ibelings, B. W.: Genotype-by-temperature interactions may help to maintain clonal diversity in Asterionella formosa (Bacillariophyceae), J. Phycol., 48, 1197–1208, https://doi.org/10.1111/j.1529-8817.2012.01205.x, 2012.
Hattich, G. S. I., Listmann, L., Raab, J., Ozod-Seradj, D., Reusch, T. B. H., and Matthiessen, B.: Inter- and intraspecific phenotypic plasticity of three phytoplankton species in response to ocean acidification, Biol. Lett., 13, 20160774, https://doi.org/10.1098/rsbl.2016.0774, 2017.
Henderiks, J., Winter, A., Elbrächter, M., Feistel, R., van der Plas, A., Nausch, G., and Barlow, R.: Environmental controls on Emiliania huxleyi morphotypes in the Benguela coastal upwelling system (SE Atlantic), Mar. Ecol. Prog. Ser., 448, 51–66, https://doi.org/10.3354/meps09535, 2012.
Hoppe, C. J. M., Langer, G., and Rost, B.: Emiliania huxleyi shows identical responses to elevated pCO2 in TA and DIC manipulations, J. Exp. Mar. Biol. Ecol., 406, 54–62, https://doi.org/10.1016/j.jembe.2011.06.008, 2011.
Hutchins, D. A., Fu, F. X., Webb, E. A., Walworth, N., and Tagliabue, A.: Taxon-specific response of marine nitrogen fixers to elevated carbon dioxide concentrations, Nat. Geosci., 6, 790–795, https://doi.org/10.1038/ngeo1858, 2013.
Hutchinson, G. E.: The paradox of the plankton, Am. Nat., 95, 137–145, 1961.
Klaas, C. and Archer, D. E.: Association of sinking organic matter with various types of mineral ballast in the deep sea: Implications for the rain ratio, Global Biogeochem. Cy., 16, 1116, https://doi.org/10.1029/2001GB001765, 2002.
Kottmeier, D. M., Rokitta, S. D., and Rost, B.: H+-driven increase in CO2 uptake and decrease in uptake explain coccolithophores' acclimation responses to ocean acidification, Limnol. Oceanogr., 61, 2045–2057, https://doi.org/10.1002/lno.10352, 2016.
Kremp, A., Godhe, A., Egardt, J., Dupont, S., Suikkanen, S., Casabianca, S., and Penna, A.: Intraspecific variability in the response of bloom-forming marine microalgae to changed climate conditions, Ecol. Evol., 2, 1195–1207, https://doi.org/10.1002/ece3.245, 2012.
Krueger-Hadfield, S. A., Balestreri, C., Schroeder, J., Highfield, A., Helaouët, P., Allum, J., Moate, R., Lohbeck, K. T., Miller, P. I., Riebesell, U., Reusch, T. B. H., Rickaby, R. E. M., Young, J., Hallegraeff, G., Brownlee, C., and Schroeder, D. C.: Genotyping an Emiliania huxleyi (prymnesiophyceae) bloom event in the North Sea reveals evidence of asexual reproduction, Biogeosciences, 11, 5215–5234, https://doi.org/10.5194/bg-11-5215-2014, 2014.
Krug, S. A., Schulz, K. G., and Riebesell, U.: Effects of changes in carbonate chemistry speciation on Coccolithus braarudii: a discussion of coccolithophorid sensitivities, Biogeosciences, 8, 771–777, https://doi.org/10.5194/bg-8-771-2011, 2011.
Krumhardt, K. M., Lovenduski, N. S., Debora Iglesias-Rodriguez, M., and Kleypas, J. A.: Coccolithophore growth and calcification in a changing ocean, Prog. Oceanogr., 159, 276–295, https://doi.org/10.1016/j.pocean.2017.10.007, 2017.
Langer, G., Nehrke, G., Probert, I., Ly, J., and Ziveri, P.: Strain-specific responses of Emiliania huxleyi to changing seawater carbonate chemistry, Biogeosciences, 6, 2637–2646, https://doi.org/10.5194/bg-6-2637-2009, 2009.
Levis, N. A. and Pfennig, D. W.: Evaluating “plasticity-first” evolution in nature: key criteria and empirical approaches, Trends Eco. Evol., 31, 563–574, https://doi.org/10.1016/j.tree.2016.03.012, 2016.
Lohbeck, K. T., Riebesell, U., and Reusch, T. B. H.: Adaptive evolution of a key phytoplankton species to ocean acidification, Nat. Geosci., 5, 346–351, https://doi.org/10.1038/ngeo1441, 2012.
Müller, M. N., Trull, T. W., and Hallegraeff, G. M.: Differing responses of three Southern Ocean Emiliania huxleyi ecotypes to changing seawater carbonate chemistry, Mar. Ecol. Prog. Ser., 531, 81–90, https://doi.org/10.3354/meps11309, 2015.
Omar, A. M., Olsen, A., Johannessen, T., Hoppema, M., Thomas, H., and Borges, A. V.: Spatiotemporal variations of fCO2 in the North Sea, Ocean Sci., 6, 77–89, https://doi.org/10.5194/os-6-77-2010, 2010.
Paasche, E.: A review of the coccolithophorid Emiliania huxleyi (Prymnesiophyceae), with particular reference to growth, coccolith formation, and calcification-photosynthesis interactions, Phycologia, 40, 503–529, https://doi.org/10.2216/i0031-8884-40-6-503.1, 2002.
Palumbi, S. R.: Genetic divergence, reproductive isolation, and marine speciation. Ann. Rev. Ecol. Evol. Syst., 25, 547–572, https://doi.org/10.1146/annurev.es.25.110194.002555, 1994.
Pančić, M., Hansen, P. J., Tammilehto, A., and Lundholm, N.: Resilience to temperature and pH changes in a future climate change scenario in six strains of the polar diatom Fragilariopsis cylindrus, Biogeosciences, 12, 4235–4244, https://doi.org/10.5194/bg-12-4235-2015, 2015.
Pierrot, D., Lewis, E., and Wallace, D. W. R.: MS Excel program developed for CO2 system calculations, ORNL/CDIAC-105, Carbon Dioxide Information Analysis Centre, Oak Ridge National Laboratory, U.S., Department of Energy, Oak Ridge, Tennessee, https://doi.org/10.3334/CDIAC/otg.CO2SYS_XLS_CDIAC105a, 2006.
Reed, T. E., Waples, R. S., Schindler, D. E., Hard, J. J., and Kinnison, M. T.: Phenotypic plasticity and population viability: the importance of environmental predictability, P. R. Soc. B, 277, 3391, https://doi.org/10.1098/rspb.2010.0771, 2010.
Reusch, T. B. H.: Climate change in the oceans: Evolutionary versus phenotypically plastic responses of marine animals and plants, Evol. Appl., 7, 104–122, https://doi.org/10.1111/eva.12109, 2014.
Ríos, A. F., Pérez, F. F., Álvarez, M., Mintrop, L., González-Dávila, M., Santana-Casiano, J. M., Lefèvre, L., and Watson, A. J.: Seasonal sea-surface carbon dioxide in the Azores area, Mar. Chem., 96, 35–51, https://doi.org/10.1016/j.marchem.2004.11.001, 2005.
Rost, B. and Riebesell, U.: Coccolithophores and the biological pump: responses to environmental changes, in: Coccolithophores – From Molecular Biology to Global Impact, edited by: Thierstein, H. R. and Young, J. R., Springer, Berlin, 99–125, 2004.
Roy, R. N., Roy, L. N., Lawson, M., Vogel, K. M., Moore, C. P., Davis W., and Millero, F. J.: Thermodynamics of the dissociation of boric acid in seawater at S 5 35 from 0 degrees C to 55 degrees C, Mar. Chem., 44, 243–248, https://doi.org/10.1016/0304-4203(93)90206-4, 1993.
Rynearson, T. A. and Armbrust, E. V.: Genetic differentiation among populations of the planktonic marine diatom Ditylum Brightwellii (Bacillariophyceae), J. Phycol., 40, 34–43, https://doi.org/10.1046/j.1529-8817.2004.03089.x, 2004.
Schaum, E., Rost, B., Millar, A. J., and Collins, S.: Variation in plastic responses of a globally distributed picoplankton species to ocean acidification, Nat. Clim. Change, 3, 298–302, https://doi.org/10.1038/nclimate1774, 2013.
Schaum, E., Rost, B., and Collins, S.: Environmental stability affects phenotypic evolution in a globally distributed marine picoplankton, The ISME Journal, 10, 75–84, https://doi.org/10.1038/ismej.2015.102, 2015.
Sett, S., Bach, L. T., Schulz, K. G., Koch-Klavsen, S., Lebrato, M., and Riebesell, U.: Temperature modulates coccolithophorid sensitivity of growth, photosynthesis and calcification to increasing seawater pCO2, PLoS ONE, 9, e88308, https://doi.org/10.1371/journal.pone.0088308, 2014.
Smith, H. E. K., Tyrrell, T., Charalampopoulou, A., Dumousseaud, C., Legge, O. J., Birchenough, S., Pettit, L. R., Garley, R., Hartman, S. E., Hartman, M. C., Sagoo, N., Daniels, C. J., Achterberg, E. P., and Hydes, D. J.: Prodominance of heavily calcified coccolithophores at low CaCO3 saturation during winter in the Bay of Biscay, P. Natl. Acad. Sci. USA, 109, 8845–8849, https://doi.org/10.1073/pnas.1117508109, 2012.
Wisshak, M., Form, A., Jakobsen, J., and Freiwald, A.: Temperate carbonate cycling and water mass properties from intertidal to bathyal depths (Azores), Biogeosciences, 7, 2379–2396, https://doi.org/10.5194/bg-7-2379-2010, 2010.
Zhang, Y., Klapper, R., Lohbeck, K. T., Bach, L. T., Schulz, K. G., Reusch, T. B. H., and Riebesell, U.: Between- and within-population variations in thermal reaction norms of the coccolithophore Emiliania huxleyi, Limnol. Oceanogr., 59, 1570–1580, https://doi.org/10.4319/lo.2014.59.5.1570, 2014.
Zhang, Y., Bach, L. T., Schulz, K. G., and Riebesell, U.: The modulating effect of light intensity on the response of the coccolithophore Gephyrocapsa oceanica to ocean acidification, Limnol. Oceanogr., 60, 2145–2157, https://doi.org/10.1002/lno.10161, 2015.