the Creative Commons Attribution 4.0 License.
the Creative Commons Attribution 4.0 License.
 | 15 Jan 2018
Impacts of the seasonal distribution of rainfall on vegetation productivity across the Sahel
Wenmin Zhang
Martin Brandt
Xiaoye Tong
Qingjiu Tian
Rasmus Fensholt
Climate change in drylands has caused alterations in the seasonal distribution of rainfall including increased heavy-rainfall events, longer dry spells, and a shifted timing of the wet season. Yet the aboveground net primary productivity (ANPP) in drylands is usually explained by annual-rainfall sums, disregarding the influence of the seasonal distribution of rainfall. This study tested the importance of rainfall metrics in the wet season (onset and cessation of the wet season, number of rainy days, rainfall intensity, number of consecutive dry days, and heavy-rainfall events) for growing season ANPP. We focused on the Sahel and northern Sudanian region (100–800 mm yr−1) and applied daily satellite-based rainfall estimates (CHIRPS v2.0) and growing-season-integrated normalized difference vegetation index (NDVI; MODIS) as a proxy for ANPP over the study period: 2001–2015. Growing season ANPP in the arid zone (100–300 mm yr−1) was found to be rather insensitive to variations in the seasonal-rainfall metrics, whereas vegetation in the semi-arid zone (300–700 mm yr−1) was significantly impacted by most metrics, especially by the number of rainy days and timing (onset and cessation) of the wet season. We analysed critical breakpoints for all metrics to test if vegetation response to changes in a given rainfall metric surpasses a threshold beyond which vegetation functioning is significantly altered. It was shown that growing season ANPP was particularly negatively impacted after >14 consecutive dry days and that a rainfall intensity of ∼13 mm day−1 was detected for optimum growing season ANPP. We conclude that the number of rainy days and the timing of the wet season are seasonal-rainfall metrics that are decisive for favourable vegetation growth in the semi-arid Sahel and need to be considered when modelling primary productivity from rainfall in the drylands of the Sahel and elsewhere.


Livelihoods in most drylands depend heavily on aboveground net primary production (ANPP) in the form of rain-fed crops and fodder for livestock (Abdi et al., 2014; Leisinger and Schmitt, 1995). Annual ANPP thus plays a decisive role in the context of livelihood strategies, food security, and people's general well-being. ANPP in drylands is primarily controlled by water availability, with annual rainfall typically being limited to a short and erratic wet season which can be highly variable in time and space. The current study focuses on the sub-Saharan Sahel zone, which is one of the largest dryland areas in the world. The Sahel has been referred to as the region showing the largest rainfall anomalies worldwide during the last century (Nicholson, 2000). Throughout the centuries, the Sahelian population has adapted to this high rainfall variability, and the associated great inter-annual differences in available ANPP are balanced for example by a temporary abandonment of agriculture or seasonal livestock migration (Romankiewicz et al., 2016). However, 21st-century climate change is predicted to threaten established coping strategies – not only by increasing inter-annual variability of rainfall regimes as a whole (Field, 2012; Kharin et al., 2007), but also by an increasingly unpredictable seasonality and an altered number of heavy rainfall and drought events (Fischer et al., 2013; Smith, 2011; Taylor et al., 2017). Improved knowledge on the vegetation response to the seasonal variability of rainfall is thus crucial to better interpret the consequences of climate predictions of an altered global hydrological cycle and to implement appropriate adaptation measures to climate change and food security in arid and semi-arid lands like the Sahel.
While it is well known that the productivity of dryland vegetation is highly prone to variations in the availability of water resources at the annual scale (Fensholt et al., 2013; Fensholt and Kjeld, 2011; Herrmann et al., 2005; Huber et al., 2011), there is a current lack of understanding of how the seasonal distribution of rainfall impacts growing season ANPP (Rishmawi et al., 2016). Several studies have demonstrated the vegetation sensitivity to the timing and magnitude of rainfall events based on individual-plot data and model estimates (Bates et al., 2006; Fay et al., 2000; Guan et al., 2014; Thomey et al., 2011), but the impact of specific rainfall metrics (such as wet season length/timing, number of rainy days, rainfall intensity, number of consecutive dry days, and extreme events; see Table 1 for index definitions) on dryland vegetation productivity has rarely been studied in a spatially distributed manner, potentially including different biotic and abiotic controls. A few studies show that there is a strong dependency of Sahelian vegetation growth on the timing of the wet season (Diouf et al., 2016) and the frequency and distribution of dry spells (Proud and Rasmussen, 2011), but currently no regional-scale study have systematically analysed the importance of a variety of rainfall metrics for vegetation growth as a function of mean annual rainfall. Further, there is evidence showing that not only a shift in the timing of the wet season but also increasing extreme events occur in the Sahel (Panthou et al., 2014; Sanogo et al., 2015; Taylor et al., 2017; Zhang et al., 2017), suggesting the need for a comprehensive understanding of how rainfall seasonality impacts vegetation production.
The assessment of rainfall metrics capturing the seasonal variability and the associated impact on growing season ANPP requires daily rainfall records and a robust methodology that is able to extract the timing (onset and cessation) and duration of the wet season (Dunning et al., 2016; Liebmann et al., 2012). The availability and quality of such data, and uncertainties in methods to extract the rainfall seasonality, have complicated regionally scaled studies on this topic (Fitzpatrick et al., 2015). However, a new generation of high-spatial-resolution satellite-based daily rainfall estimates blended with station data has recently opened up the possibility to fill the gap between plot- and model-based studies. Here our study aims at applying daily rainfall estimates to analyse and understand the impact of seasonal-rainfall metrics on vegetation productivity for the entire Sahel.
An empirical analysis was conducted based on gridded information of rainfall metrics based on daily satellite estimates and seasonally integrated normalized difference vegetation index (hereafter ∑NDVI) as a proxy for the growing season ANPP. The period of analysis covers 2001–2015, which allows for a per-pixel analysis including state-of-the-art Earth observation data sets of both Climate Hazards Group InfraRed Precipitation with Station (CHIRPS v2.0) and Moderate Resolution Imaging Spectroradiometer (MODIS) vegetation. The rainfall metrics include number of rainy days, daily intensity, heavy-rainfall events, number of consecutive dry days, and seasonal rainfall amount, which were analysed as explanatory variables for the observed spatial variability in seasonal vegetation productivity along the gradient of mean seasonal rainfall.
2.1 Study area
The Sahelian zone covers arid and semi-arid biomes and is one of the world's largest dryland areas, bordering the Sahara to the north (Fig. 1). The delineation of the Sahel is often done by using average annual-rainfall isohyets, with the northern boundary at 100 mm yr−1 and the southern boundary defined by 700 mm yr−1 (Lebel and Ali, 2009). For this study we expanded the southern limit towards the Sudanian zone until 800 mm yr−1 to include also the zone where rainfall as the primary climatic-forcing variable on vegetation productivity is expected to level off (Fensholt et al., 2013; Huber et al., 2011; Kaspersen et al., 2011). The Sahel is characterized by a unimodal rainfall regime, and the landscape is generally flat and consists of large plains interspersed with sand dunes and rocky formations. The large stretches of plains are mainly used for grazing and subsistence cultivation. The northern parts of the Sahel are dominated by open and sparse grass- and shrublands, while cropland, open woody vegetation, and deciduous shrublands characterize the southern parts (Breman and Kessler, 1995).
2.2 CHIRPS rainfall data
The CHIRPS v2.0 data set uses TIR (thermal infrared) imager and gauge data, as well as monthly precipitation climatology, CHPClim (Climate Hazards Group's Precipitation Climatology), and atmospherically modelled rainfall fields from the NOAA Climate Forecast System version 2 (CFSv2) and Tropical Rainfall Measuring Mission (TRMM) 3B42 (Funk et al., 2015). The CHIRPS data are provided as grids at 0.05 and 0.25∘ spatial resolutions and extend from 1981 to the present. In our study, the CHIRPS data at daily resolution with a spatial resolution of 0.05∘ were used to extract seasonal-rainfall metrics.
Table 1Rainfall metrics describing the seasonality and extreme events.

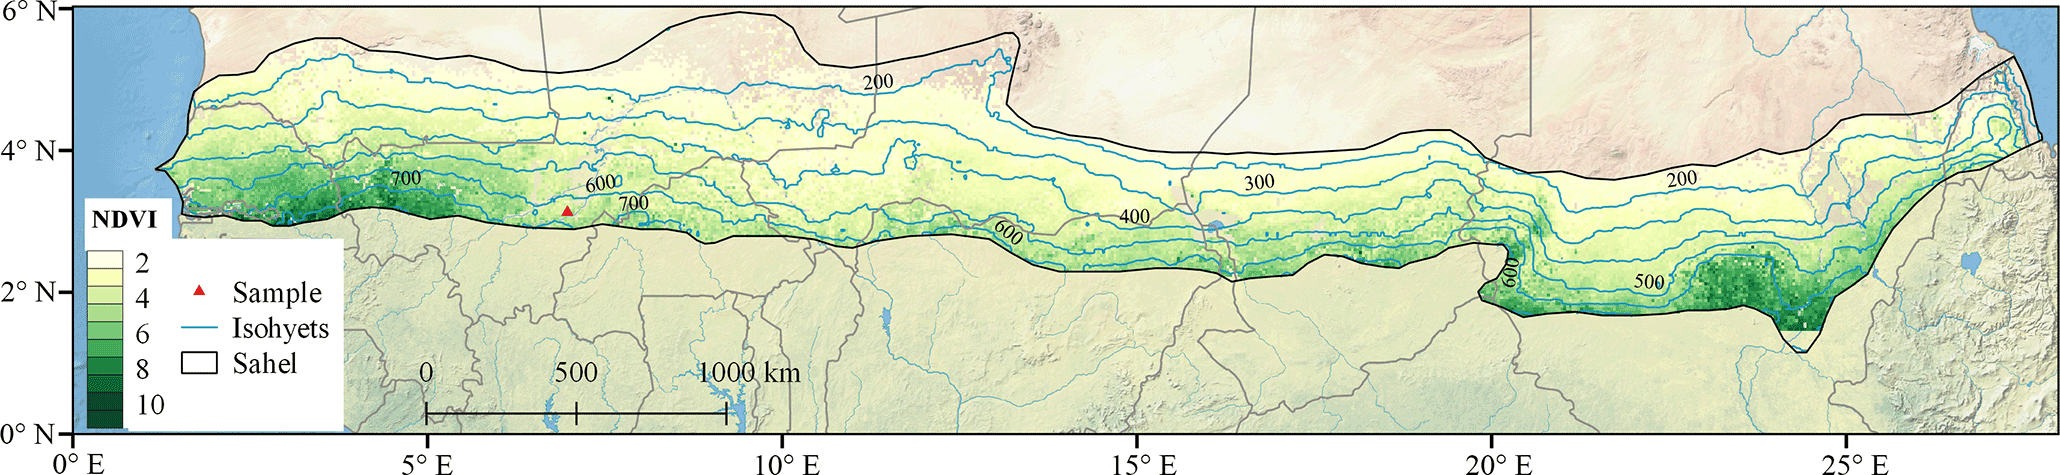
Figure 1Study area outlining the Sahelian region (black colour; 100–800 mm yr−1). ∑NDVI (seasonal integral) is based on a 15-year (2001–2015) average using MODIS data; the red grid point (13.5∘ N, 5.0∘ W) is used to illustrate the extractions of onset and cessation of the wet season shown in Fig. 2. Isohyets are based on a 15-year (2001–2015) average of the seasonal rainfall amount (CHIRPS v2.0).

Figure 2(a) Daily rainfall distribution and (b) anomalous accumulative curve for the grid point 13.5∘ N, 5.0∘ W (shown in Fig. 1) for the year 2001. The blue line (accumulated anomaly) is computed from a 15-year (2001–2015) average of daily rainfall.

Figure 3Spatial distribution of average seasonal-rainfall metrics: (a) onset of wet season (day of year); (b) cessation of wet season (day of year); (c) rainy days (days); (d) daily intensity (mm day−1); (e) heavy-rainfall events (%); (f) consecutive dry days (days) based on 15-year averages (2001–2015). Pixels within the study area are masked (white colour) in accordance with the description in the methods section.
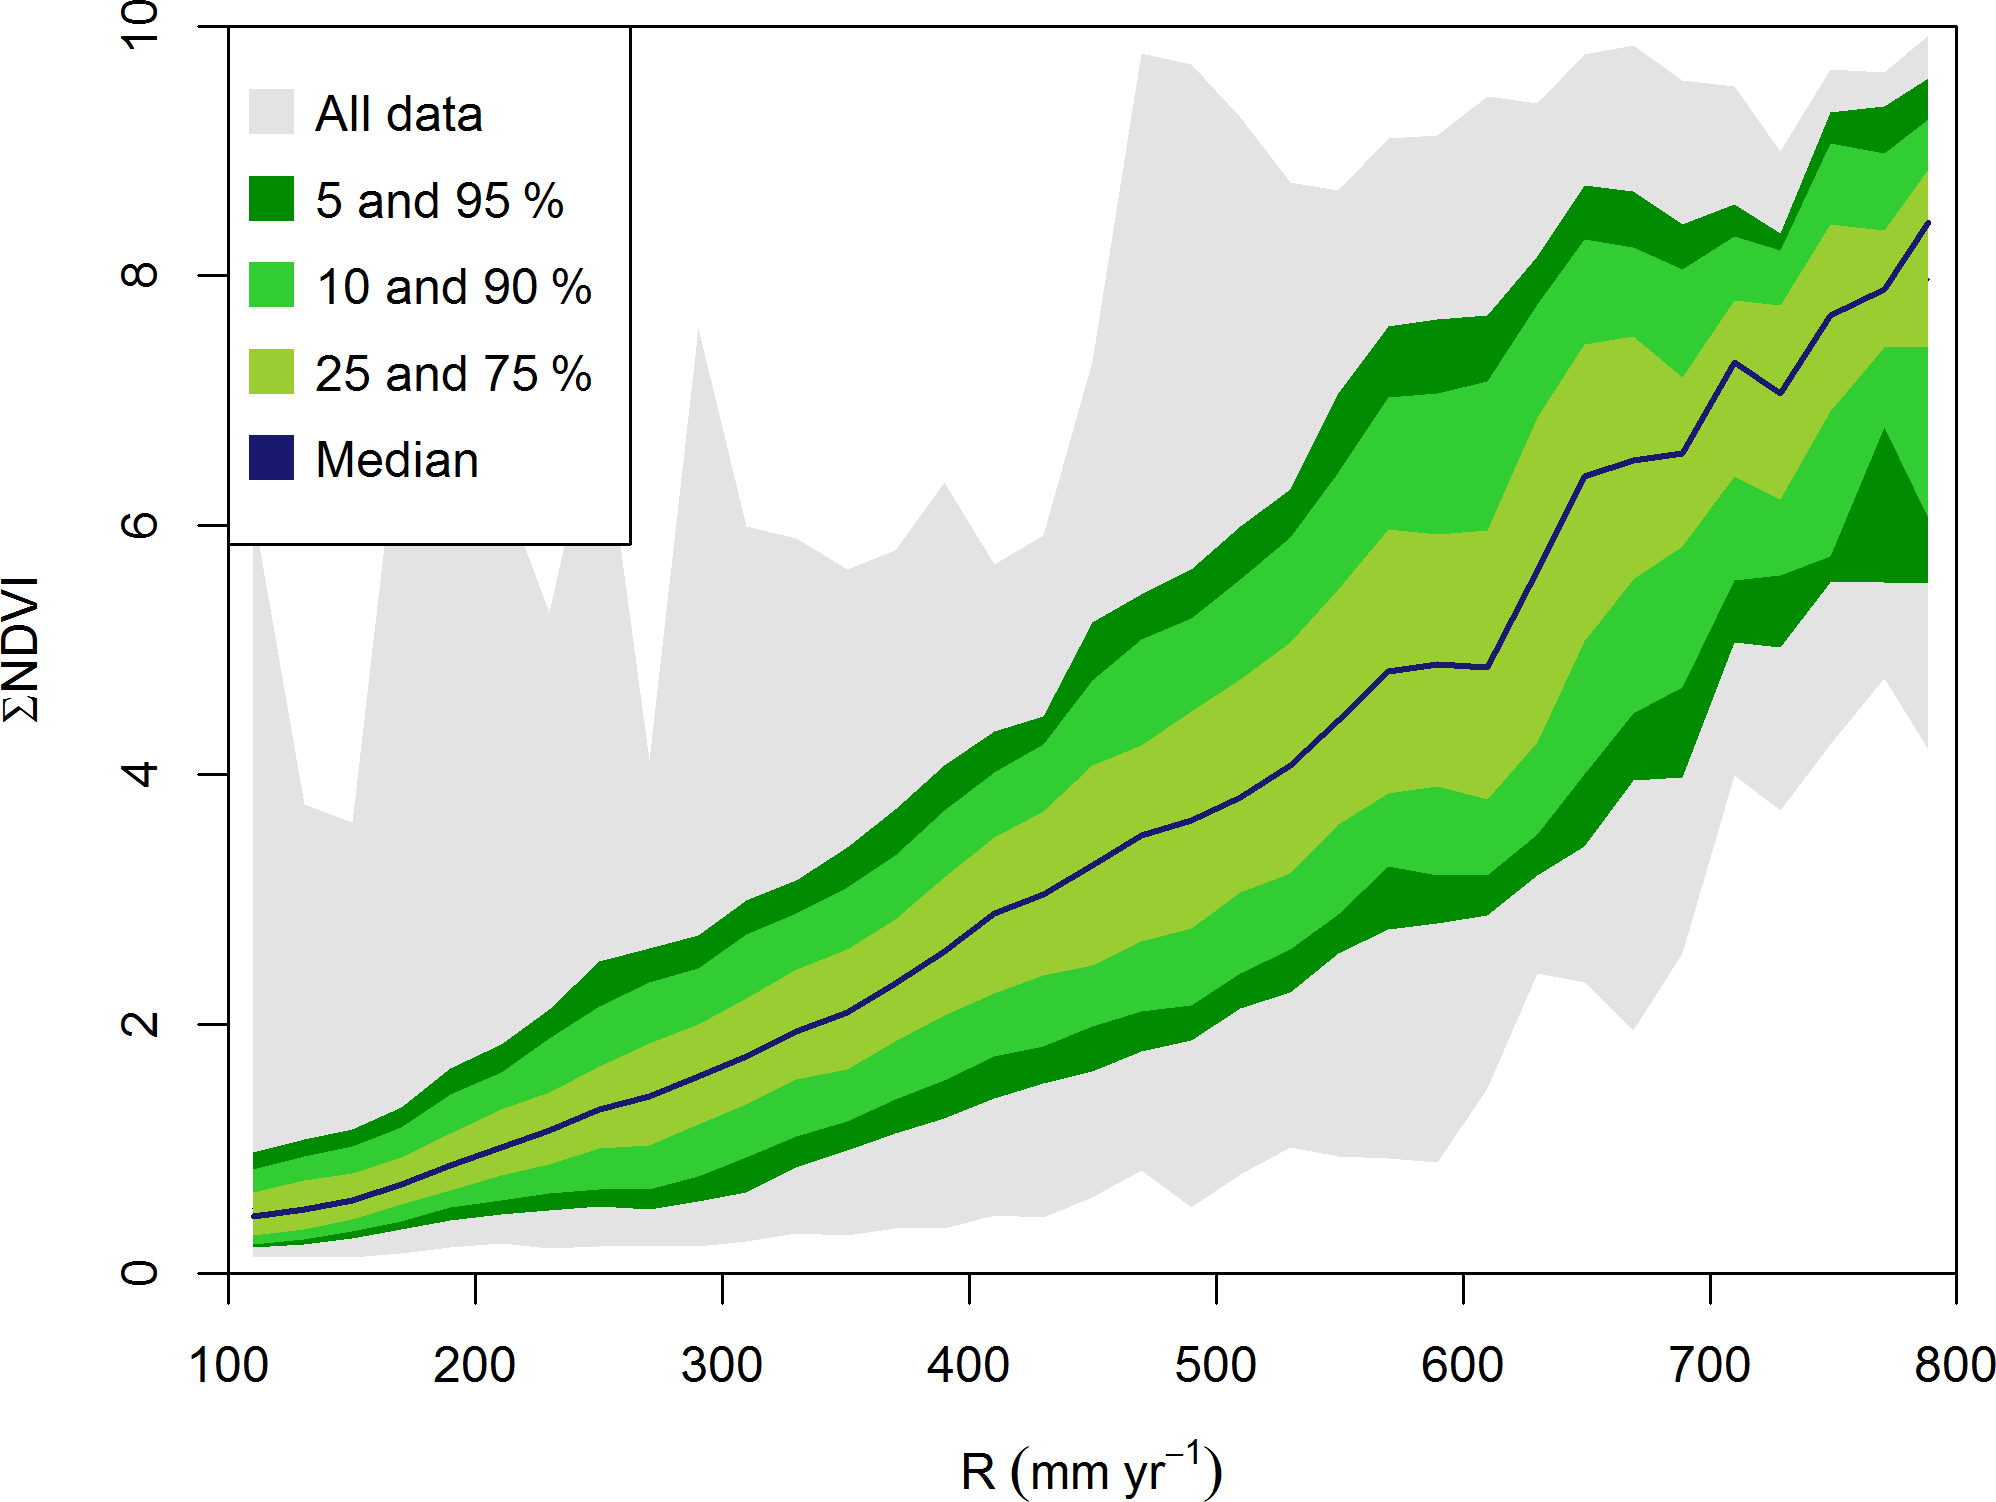
Figure 4Growing season ANPP (∑NDVI) as a function of mean seasonal rainfall amount (R) plotted as quantiles for the Sahel–Sudanian zone (pixel averages for 2001–2015).
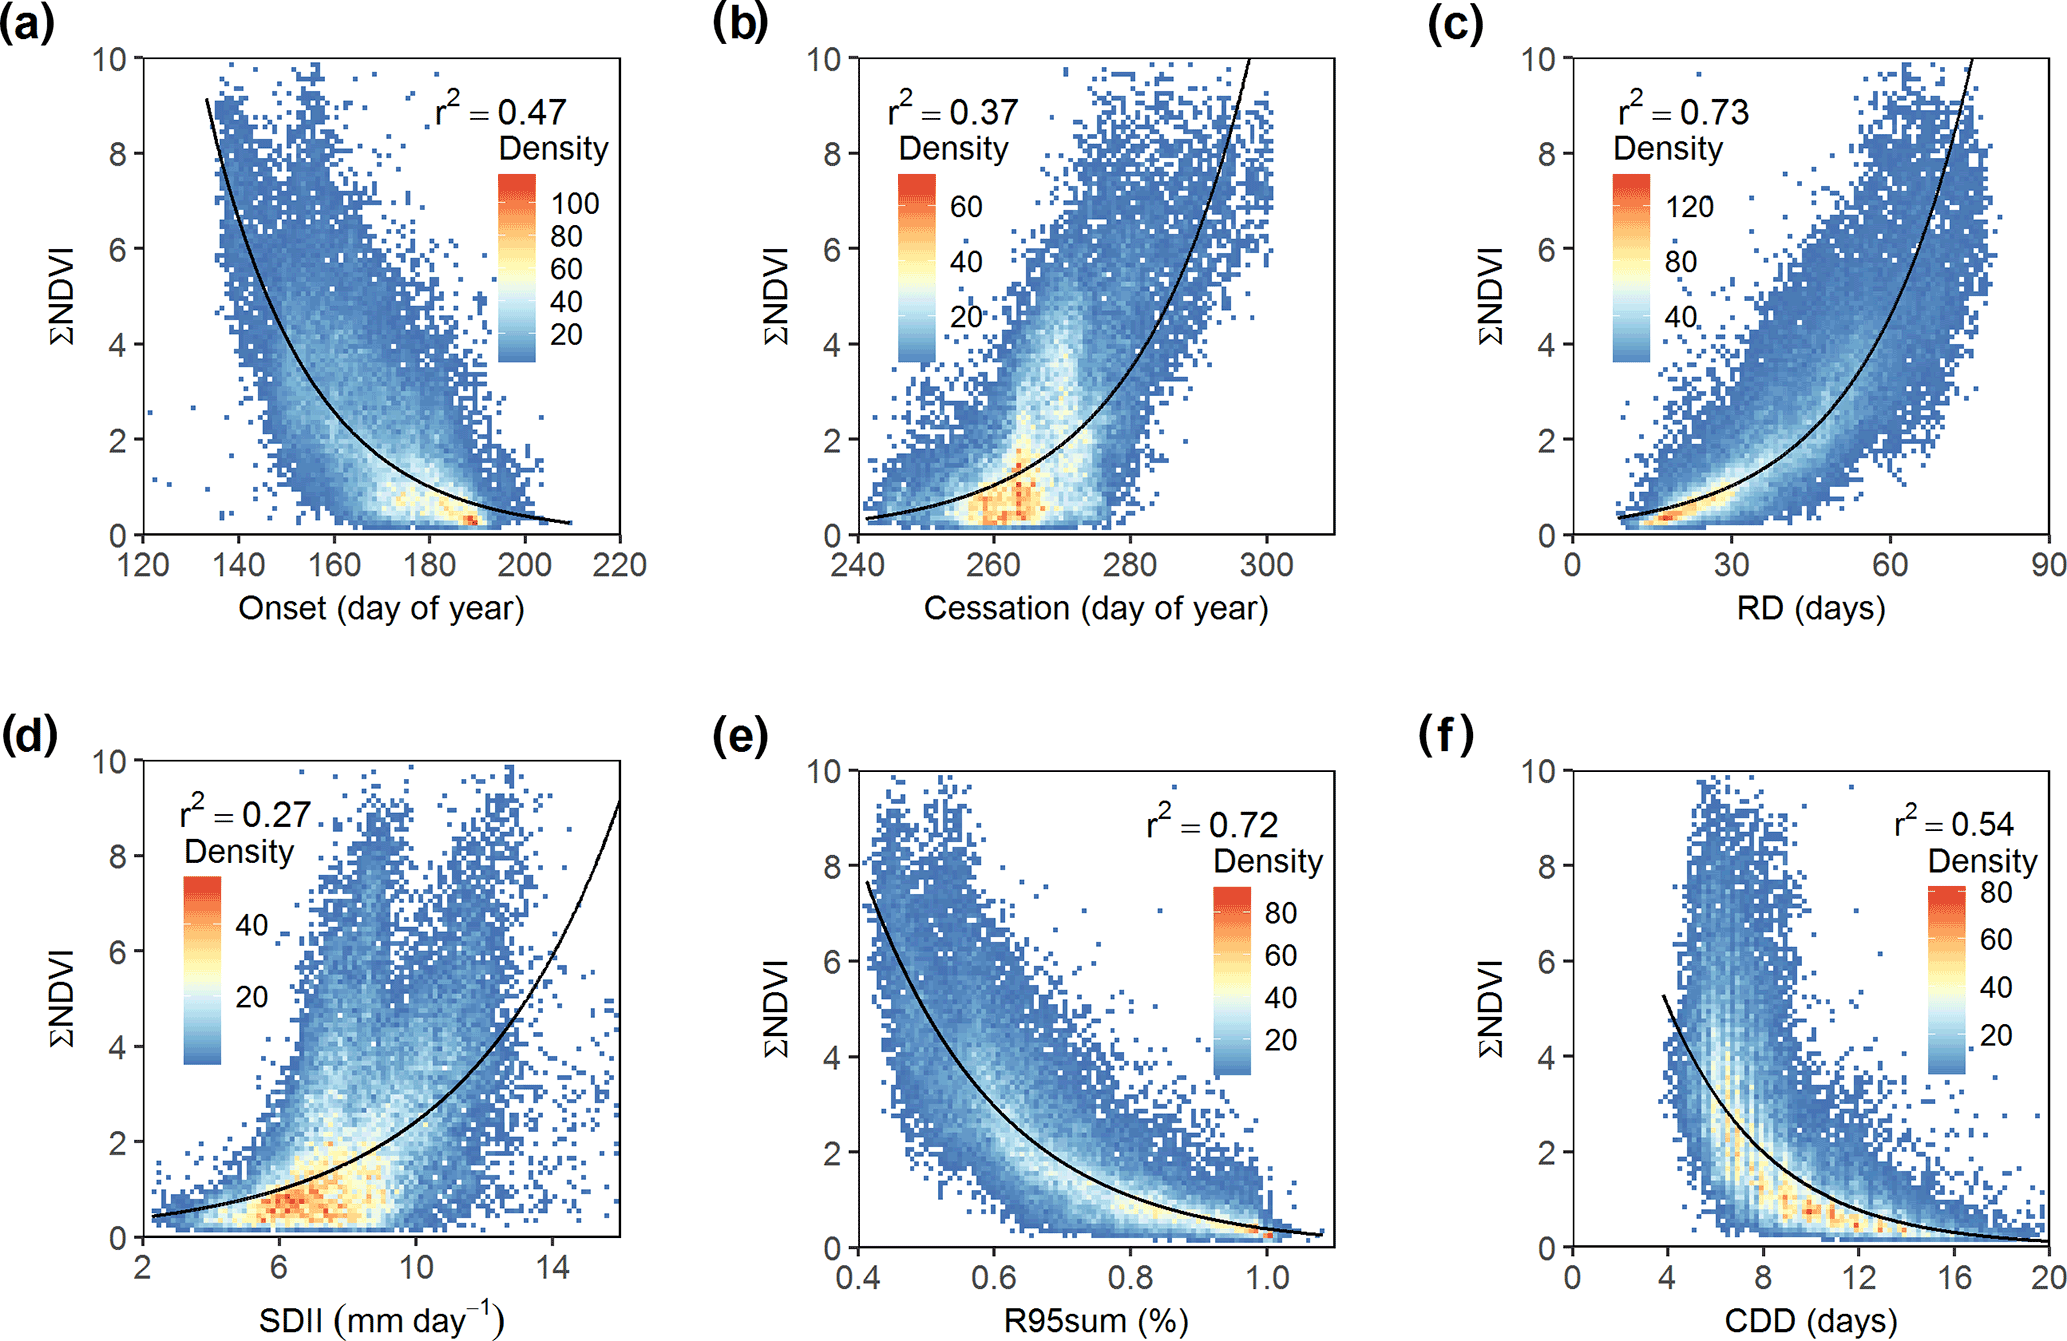
Figure 5Density scatter plot showing the relationships between seasonal-rainfall metrics and growing season ANPP (∑NDVI). All analyses are based on 15-year averages (2001–2015). The black lines are exponential regression curves. All points (n=30 862) are located between 100 and 800 mm annual rainfall.

Figure 6Relationships between seasonal-rainfall metrics and growing season ANPP as a function of seasonal rainfall amount based on 15-year averages (2001–2015).
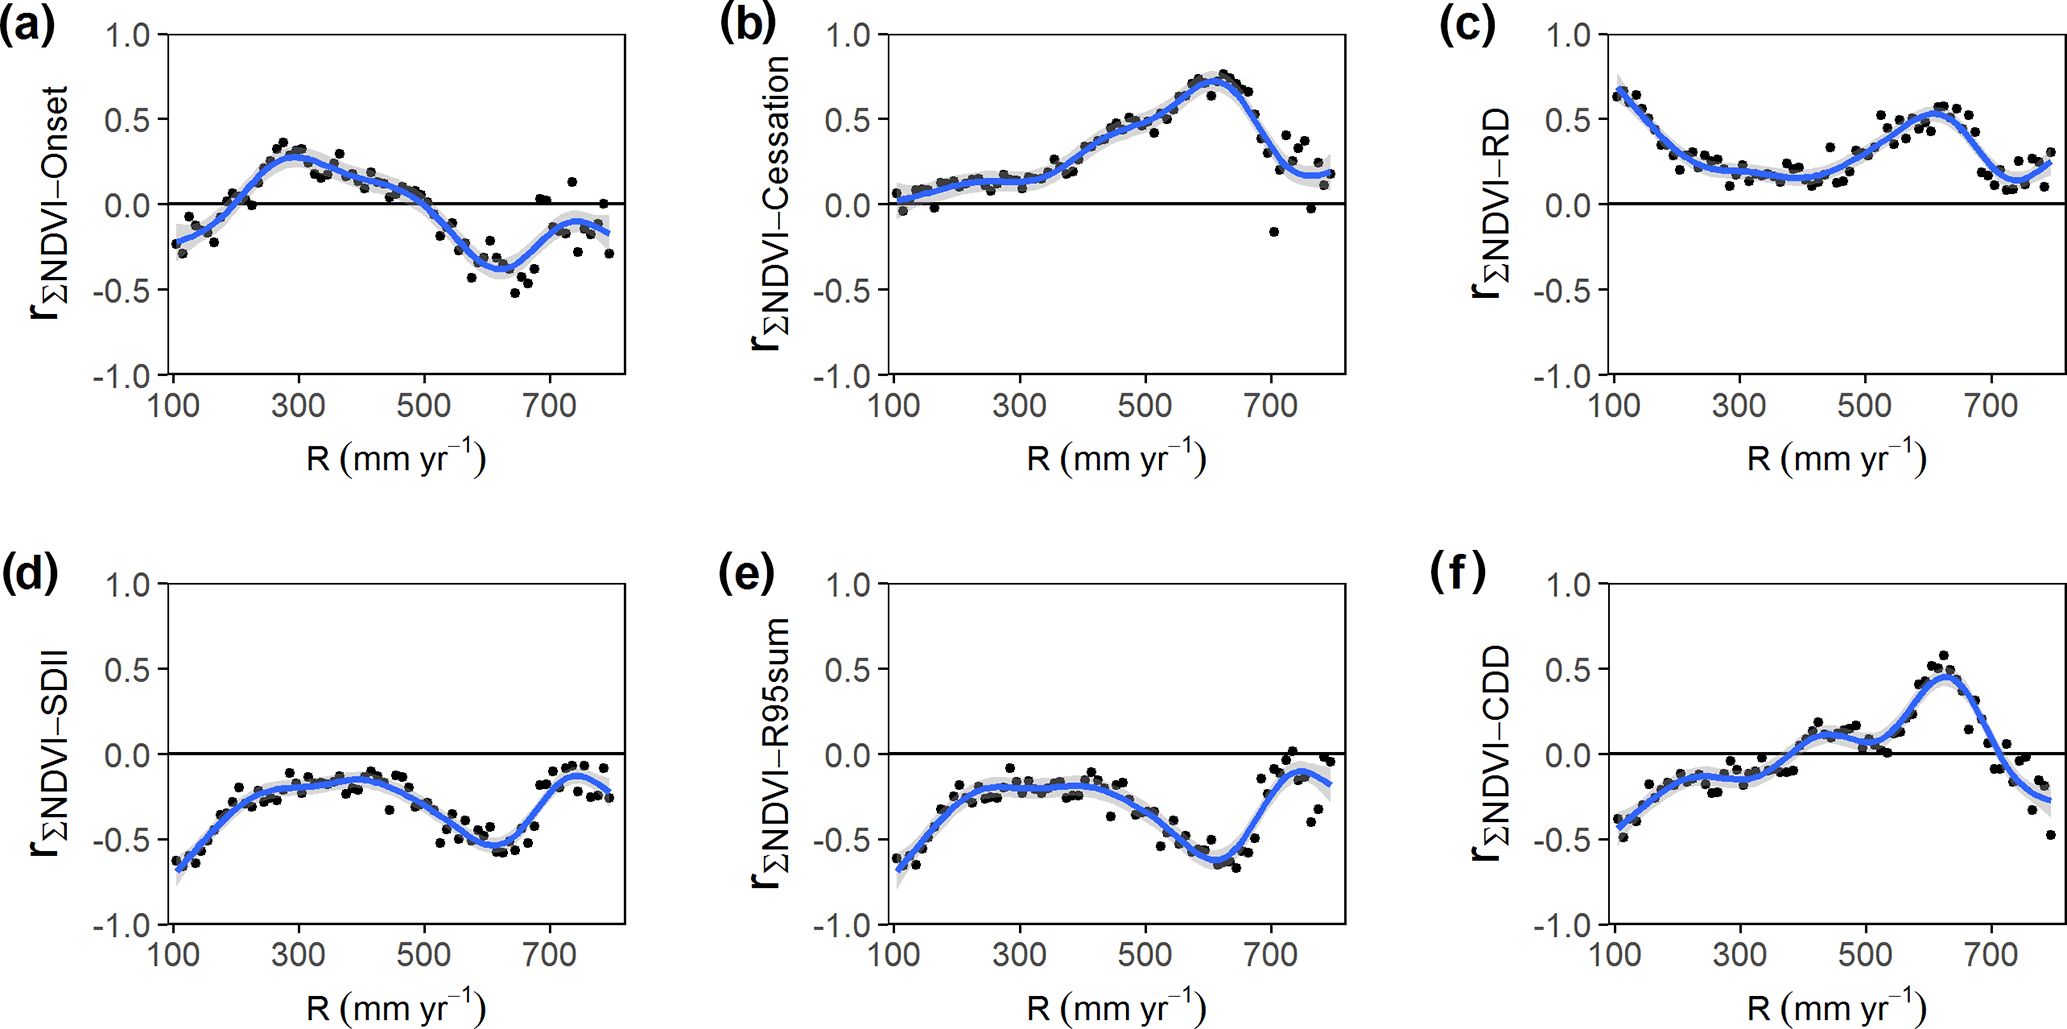
Figure 7Effects of seasonal-rainfall metrics on growing season ANPP as a function of seasonal rainfall amount. The non-parametric Spearman's rank correlation between growing season ANPP and rainfall metrics are shown for each 10 mm interval. The lines are GAM fitting curves, and shading represents the 95 % confidence intervals of the fitting.
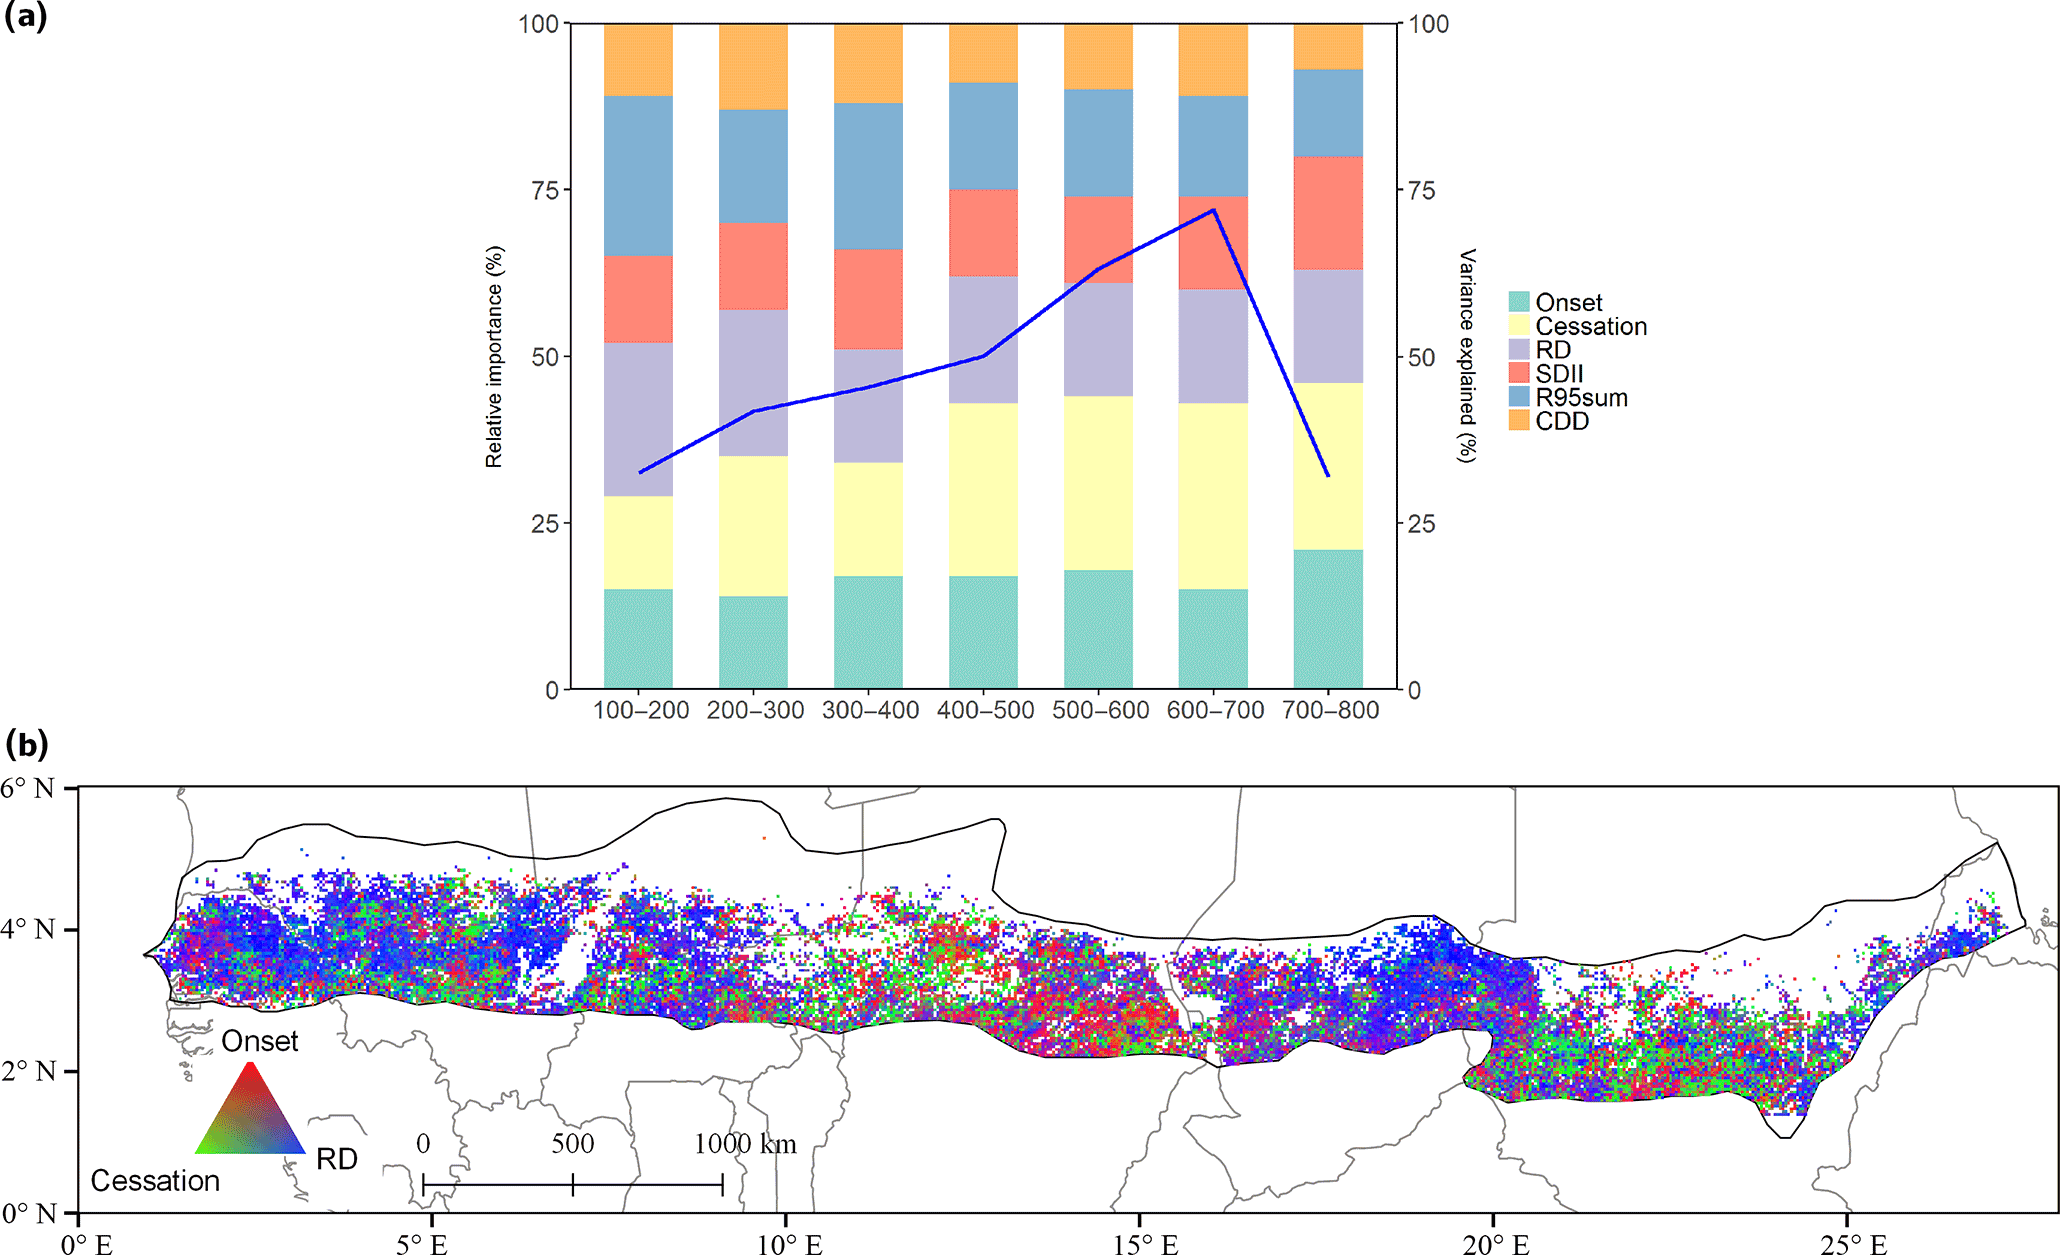
Figure 8(a) Generalized relationships between growing season ANPP and onset, cessation, RD, SDII, R95sum, and CDD as a function of seasonal rainfall amount (100 mm intervals) based on 15-year average values (relative importance in %). The blue line shows the overall variance of growing season ANPP explained by the rainfall metrics per 100 mm seasonal rainfall amount based on the random forest method. (b) Spatial distribution of the relative importance of onset and cessation of wet season and rainy days for growing season ANPP for 2001–2015 based on a multiple-regression analysis. Pixels within the study area are masked (white colour) in accordance with the description in the methods section.
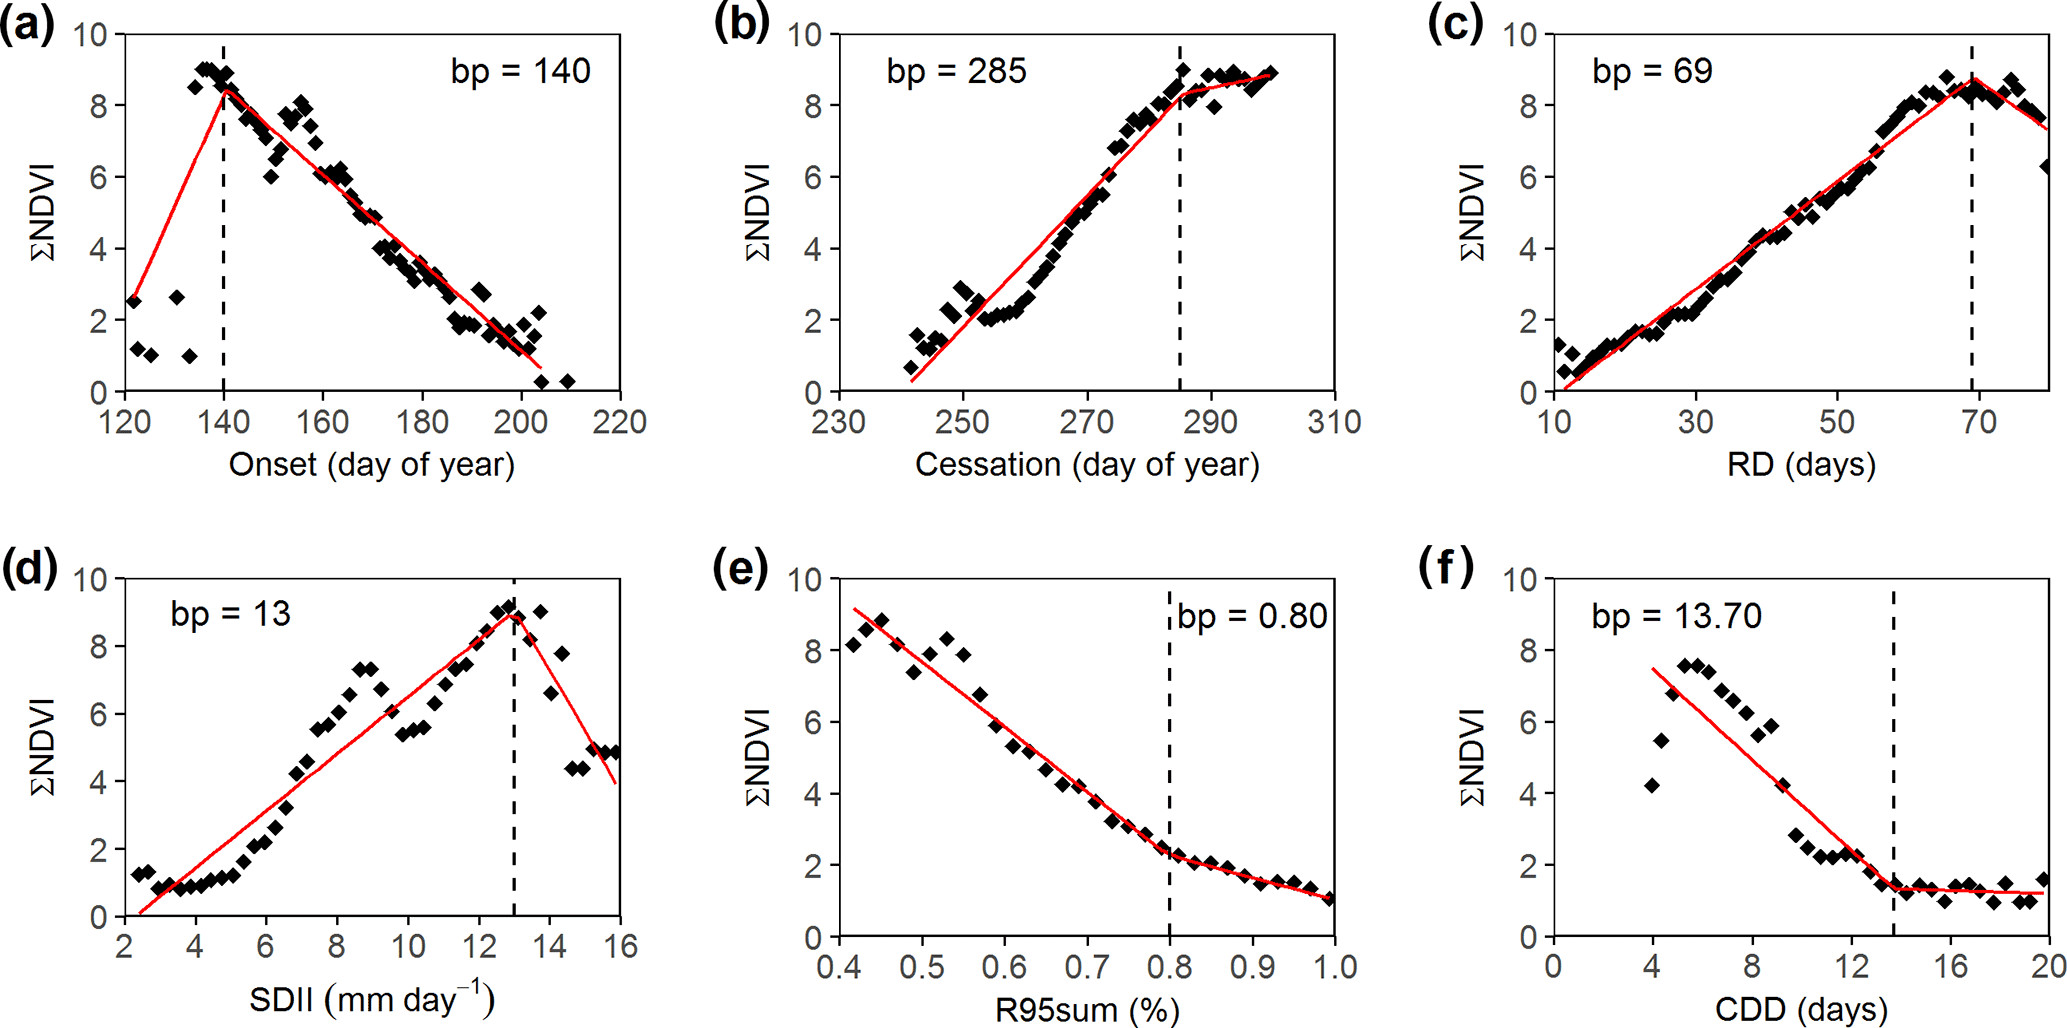
Figure 9Growing season ANPP (individual points represent 95th percentile of ∑NDVI value for each seasonal-rainfall metric bin) plotted against rainfall metrics. Solid red lines denote piecewise regression between growing season ANPP and seasonal-rainfall metrics, and dashed lines indicate the breakpoint (bp) for rainfall individual metrics.
2.3 Deriving seasonal-rainfall metrics
The method used to identify the onset and cessation of the wet season is referred to Liebmann et al. (2012) and applicable to multiple data sets for precipitation seasonality analysis across the African continent (Dunning et al., 2016). As was described in Liebmann et al. (2012), the climatology wet season was initially determined by the climatological cumulative daily rainfall anomaly, A(d), calculated from the long-term (2001–2015) average rainfall (Ri) for each day of the calendar year minus the long-term annual-mean daily average (). The day with minimum value (ds) was defined as the start of the wet season and the maximum point (dc) marks the end of the wet season.
Subsequently, the onset and cessation were calculated individually for each year and each grid point. For each year the extraction of the rainfall metrics of the wet season was based on Eq. (2). The daily cumulative rainfall anomaly A(D) on a certain day (Pi) was computed for each day in the range ds −50 to dc +50 for each year, and the day with minimum value was considered as the onset of the wet season.
Once the onset and cessation dates of the wet season for each year were found, the remaining metrics were calculated (Table 1). Figure 2a illustrates an example of daily rainfall for the grid point (13.5∘ N, 5.0∘ W) in 2001, and the corresponding cumulative daily anomaly curves are shown in Fig. 2b. The blue and red lines signify A(d) and A(D), respectively. The range of minimum and maximum points on the blue line denoted the climatological wet season (Liebmann et al., 2012). The wet season of each individual year was then determined based on the daily precipitation observations covered by the climatological wet season. Areas where the annual minimum occurs after 1 October (desert areas) were excluded from further analysis (Diaconescu et al., 2015).
2.4 Estimation of growing season ANPP
The MODIS/Terra surface reflectance product (MOD09Q1, Collection 6) was used to derive a time series of NDVI for the period 2001–2015. NDVI was calculated from the MODIS red and near-infrared bands (8-day composites). The growing-season-integrated NDVI (∑NDVI) was used as a proxy for the growing season ANPP. The method is well established and has proven to be a reliable proxy for the growing season ANPP in the Sahel (Fensholt et al., 2013; Olsson et al., 2005). The ∑NDVI (defined by the area under the curve delimited by start and end of the season) was derived using the TIMESAT software (Jönsson and Eklundh, 2004), which was a widely used tool to extract vegetation seasonal metrics. For this study, we applied the Savitzky–Golay filter implemented in TIMESAT with the following settings: a window size of 4 was applied and a seasonal parameter of 0.5 to fit one season per year. Both the number of iterations for upper envelope adaptation and strength of the envelope adaptation were set to 2, and the start and end of season were determined as 20 and 50 % of the amplitude, respectively. The ∑NDVI data were then aggregated to the spatial resolution of CHIRPS (0.05∘) using a bilinear resampling method. Both Globeland30 (Chen et al., 2014) and ESA CCI (2010) land cover maps (https://www.esa-landcover-cci.org/) were used to mask waterbodies, irrigated areas, and flooded areas if one or both of the land cover products indicated the presence of water in a pixel.
2.5 Statistical analyses
An exponential regression was used to quantify the relationship between growing season ANPP and seasonal-rainfall metrics for the entire study area (Fig. 5), and the non-parametric Spearman's rank correlation coefficient was used to measure the relationship between growing season ANPP and seasonal-rainfall metrics as a function of seasonal rainfall amount (Fig. 6). Additionally, generalized additive models (GAMs) implemented using the mgcv package (Wood, 2017) in the R computing environment (R Team, 2014) were applied to derive smooth response curves with seasonal rainfall amount as the explanatory variable and the linear coefficients (averaged over 10 mm rainfall steps) as the response variable (Fig. 7). The models were parameterized assuming normal error distributions. Furthermore, a random forest ensemble learning method (Breiman, 2001) was used to analyse the relative importance of individual seasonal-rainfall metrics for growing season ANPP as a function of the seasonal rainfall amount (Fig. 8a). This algorithm produces multiple decision trees based on bootstrapped samples, and the nodes of each tree are built up by an iterative process of choosing and splitting nodes to achieve maximum variance reduction. Thus the metrics with highest difference are considered as the most important factors. All pixels based on 15-year averages of seasonal-rainfall metrics and ANPP were used for this analysis. Additionally, a multiple-regression analysis was applied to identify and map the spatial distribution of the relative importance of the three most important seasonal-rainfall metrics (onset and cessation of the wet season and rainy days) explaining the growing season ANPP at the per-pixel level (based on a 15-year time series) (Fig. 8b).
A piecewise regression was used to identify breakpoints (Muggeo, 2003), i.e. critical thresholds in the relationship between rainfall metrics and vegetation growth (Fig. 9). A breakpoint is an indication that the vegetation response to changes in a given rainfall metric surpasses a threshold beyond which vegetation functioning is significantly altered. Such a threshold, at the level of the individual rainfall seasonality metric, provides an indication of rainfall conditions beyond which vegetation does not tolerate further stress without a marked impact on the growing season ANPP. The 95th percentile of ∑NDVI was selected to represent the potential vegetation productivity attainable for a given seasonal-rainfall metric (Donohue et al., 2013). Seasonal-rainfall metrics were binned according to the dynamic range of the individual metrics, and the average 95th percentile of ∑NDVI was calculated for each bin (for onset, cessation, and RD, bins with an interval of 1 were used; for SDII, a bin of 0.3 was applied; for R95sum, bin intervals were set to 0.02; finally we used bins of 0.5 for CDD). The breakpoint regression was then applied to the potential vegetation productivity and corresponding seasonal-rainfall metrics.
2.6 Data availability
The CHIRPS data are available at http://chg.geog.ucsb.edu/data/chirps/. The MODIS Surface Reflectance product (MOD09Q1) can be downloaded at https://lpdaac.usgs.gov/dataset_discovery/modis/modis_products_table. The Globeland30 is available at http://www.globeland30.org/, and ESA CCI land cover is accessible from https://www.esa-landcover-cci.org/.
3.1 Spatial pattern of seasonal-rainfall metrics
A clear north–south gradient was observed for the onset, rainy days (RD), heavy-rainfall events (R95sum), and consecutive dry days (CDD) based on a 15-year (2001–2015) average value, with an earlier onset, more rainy days, and fewer heavy-rainfall events towards the south (Fig. 3a, c and e). The cessation of the wet season (Fig. 3b) showed some longitudinal differences, with the latest dates found in the eastern Sahel, followed by the western Sahel and the central Sahel showing the earliest cessation dates. A considerable difference between the southeastern and southwestern Sahel (Fig. 3d) was observed in the rainfall intensity (SDII). The relatively low rainfall intensity in the southeastern Sahel was mirrored by considerably higher numbers of rainy days.
3.2 General response of growing season ANPP to rainfall metrics
The median growing season ANPP clearly followed the mean seasonal-rainfall gradient (Fig. 4), with other biotic and abiotic factors (e.g. soil texture, nutrients, species composition, fire regime, and seasonal-rainfall distribution) causing a wide range of values as indicated by the different quantile values.
The relationships between all the rainfall metrics and growing season ANPP were found to be significant (p<0.001), and the coefficient of determination (r2) modelled by exponential regression varied between 0.27 and 0.73 (Fig. 5). For the region as a whole, the number of rainy days was identified as the most important metric impacting the growing season ANPP (r2=0.73) (Fig. 5c), closely followed by heavy-rainfall events (R95sum) (r2=0.72) (Fig. 5e), consecutive dry days (CDD) (r2=0.54) (Fig. 5f), and cessation (r2=0.37) (Fig. 5b) of the wet season. The impact of the onset on growing season ANPP was also relatively strong (r2=0.47) (Fig. 5a), whereas a rather weak relationship was observed between growing season ANPP and rainfall intensity (SDII) (r2=0.27) (Fig. 5d). For all seasonal-rainfall metrics except RD, R95sum, and CDD, the plots showed some signs of a bimodal distribution of the points, which was caused by the differences in the east–west patterns of the spatial distribution of seasonal-rainfall metrics (onset, cessation, and SDII) in the Sahel as reported in Fig. 3.
3.3 Response of growing season ANPP to seasonal-rainfall metrics along the rainfall gradient
Although the relationship between growing season ANPP and seasonal rainfall amount (R) obviously changed along the rainfall gradient (Fig. 4), variations in seasonal-rainfall distribution (e.g. onset and R95sum) can cause considerable changes in growing season ANPP under the same rainfall gradient (Fig. 5). The influence of seasonal-rainfall distribution on growing season ANPP was thus analysed under different mean annual-rainfall values along the north (low rainfall) to south (high rainfall) gradient (Fig. 6). The dependency of growing season ANPP on seasonal-rainfall metrics was clearly seen to be a function of the seasonal rainfall amount. Below ∼300 mm yr−1, the vegetation seems to be stable and rather insensitive to variations of the rainfall metrics; however, above 300 mm yr−1, the impacts can be clearly seen by a larger spread in growing season ANPP values for a given amount of seasonal rainfall (Fig. 6). For example, the growing season ANPP decreased strongly with a later onset, an earlier cessation of the wet season, a smaller number of rainy days, a higher rainfall intensity, more heavy-rainfall events, and longer dry spells. Above ∼700 mm yr−1, the vegetation showed again a reduced sensitivity to variations of the wet season by a convergence of growing season ANPP values irrespective of the seasonal-rainfall-metric value.
The non-parametric Spearman's rank correlation coefficient was used to quantify the strength of the impact of individual seasonal-rainfall metrics on growing season ANPP as a function of seasonal rainfall (Fig. 7). In general, the impacts of rainfall metrics on vegetation were distinctive along the 100–800 mm yr−1 gradient with a peak in r values (positive or negative dependent on the rainfall metric) for most metrics around 650 mm yr−1 followed by a sharp drop-off (Fig. 7). It should be noted that modelling uncertainties increased for all rainfall metrics due to fewer observations in the lowermost total-seasonal-rainfall bins. For the wet season the pattern of RD, SDII, R95sum, and CDD showed a sharp decrease in r values from 100 to 300 mm yr−1. The number of consecutive dry days (CDD) showed moderate r values balancing around zero, generally indicating less importance of the CDD variable for growing season ANPP along the rainfall gradient analysed.
The relative importance of the individual rainfall metrics for growing season ANPP was assessed based on a random forest model (Fig. 8a). The explained variance of growing season ANPP explained by rainfall metrics (blue line in Fig. 8a) increased with mean annual rainfall up to 600–700 mm yr−1, from where the degree of explained variance decreases, which corresponds with the results presented in Fig. 4 (the widest belt of the quantile values was observed for rainfall of 600–700 mm yr−1, suggesting that the seasonal-rainfall metrics additional to the seasonal rainfall amount were increasingly important in this rainfall zone) and in Fig. 7. The cessation of the wet season was identified as the most important factor controlling growing season ANPP in semi-arid areas of the Sahel (400–700 mm yr−1), followed by the onset and number of rainy days. As measured by the relative importance, these three rainfall metrics together accounted for 60–70 % of the variance explained by all rainfall metrics for all seasonal rainfall amounts. In arid areas (100–300 mm yr−1) the number of rainy days was found to be the most important variable.
The spatial distribution of the relative importance of the onset and cessation of the wet season and the number of rainy days for growing season ANPP was identified at the pixel-level for 2001 to 2015 (Fig. 8b). At the Sahel scale, the number of rainy days (bluish colours) was observed to be the dominating factor, followed by the onset of the wet season (reddish colours) and cessation (greenish colours). There were no clear signs of a latitudinal or longitudinal dependency on which rainfall metric was dominating, but some clustering was evident with a predominance of rainy-day influence in the western Sahel with limited influence by the cessation date on the growing season ANPP.
3.4 Critical points for growing season ANPP
A piecewise regression between growing season ANPP and seasonal-rainfall metrics was applied to identify if critical breakpoints in the relationship between growing season ANPP and rainfall metrics exist (Fig. 9). We found that the most evident thresholds (average values for the Sahel zone) in relation to seasonal-rainfall metrics' influence on growing season ANPP relate to the onset of the wet season (Fig. 9a), the rainfall intensity (SDII) (Fig. 9d), and consecutive dry days (CDD) (Fig. 9f). If the onset of the wet season is later than day of year 140, this will have an increasingly negative effect on growing season ANPP as a function of the onset delay; contrastingly, if the onset starts earlier than day of year 140, this will also have an increasingly adverse effect on growing season ANPP. Also, an optimum of rainfall intensity of 13 mm day−1 was detected; if rainfall intensity exceeds 13 mm day−1, vegetation productivity starts to be negatively affected, whereas a lower intensity will also negatively impact growing season ANPP. There was a pronounced decline in growing season ANPP as a function of number of consecutive dry days. However, when CDD exceeded ∼14 days, a breakpoint in the curve was detected, as dry spells of this magnitude led to a strong reduction in vegetation growth. The number of rainy days (Fig. 9c) was linearly related to growing season ANPP until day 69, beyond which RD became less decisive for the amount of growing season ANPP. Similarly, heavy-rainfall events (fraction of annual rainfall events exceeding the 95th percentile) (Fig. 9e) were negatively related to growing season ANPP, until a certain threshold (larger than 0.80), from where the vegetation loses sensitivity to the impact from an increased frequency of heavy-rainfall events. Finally, the cessation date of the wet season (Fig. 9b) was shown to be nearly linearly related to growing season ANPP. A breakpoint was detected by the piecewise regression algorithm around day 285, beyond which the delay in cessation date was slightly more favourable for higher growing season ANPP yields than a cessation date before day 285.
This study presents initial empirical evidence of the impact of rainfall seasonality on vegetation productivity at the regional scale, and the results provide a clear picture of the importance of six seasonal-rainfall metrics for growing season ANPP under different rainfall conditions (i.e. mean annual rainfall). Uncertainty in the rainfall data inevitably has an impact on the extraction of seasonal-rainfall metrics, which further impacts the relationship between seasonal-rainfall metrics and ANPP. Based on improved climatologies, systematic bias in the CHIRPS data set has been removed, and the data are considered state of the art within quasi-global, high-spatial-resolution rainfall data sets (Funk et al., 2015). As this study does not address temporal changes in the seasonal-rainfall metrics or ∑NDVI, but merely presents results on the general coupling between rainfall metrics and vegetation productivity, we consider the results to be statistically robust. We conducted a parallel set of analyses based on the Rainfall Algorithm Estimation Version 2 (RFE 2.0) rainfall product developed by the NOAA Climate Prediction Center (CPC) (Herman et al., 1997), which, like CHIRPS, is also a blended gauge satellite, and the outcome of these analyses (not shown) yielded nearly similar results to what was presented here. At the same time ∑NDVI derived from MODIS will also be impacted from cloud cover during the growing season, but the use of the Savitzky–Golay filtering algorithm has proven to be an effective way of overcoming residual noise effects in the NDVI time series (Fensholt et al., 2015).
The Sahel zone is often defined from isohyets of annual rainfall as a common denominator of the hydrological conditions of the region. It was however shown here that considerable east–west differences occurred in several of the seasonal-rainfall metrics analysed with a much higher number of rainy days and corresponding lower rainfall intensity in the southeastern Sahel than the southwestern part. Variability in the rainfall intensity was shown here to influence the growing season ANPP generated over a growing season (Fig. 9d), and hence spatio-temporal changes in rainfall intensity (but characterized by the same amount of seasonal rainfall) will impact vegetation productivity. This has important implications for the use of the rain use efficiency (RUE) (Houerou, 1984) or residual trend analysis (RESTREND) approach (regressing ∑NDVI from annual precipitation and subsequently calculating the residuals as the difference between observed ∑NDVI and ∑NDVI as predicted from annual precipitation) (Evans and Geerken, 2004), which is derived from annually or seasonally summed rainfall and commonly used as an indicator for land degradation (Archer, 2004; Bai et al., 2008; Fensholt and Kjeld, 2011; Prince et al., 1998; Ratzmann et al., 2016; Wessels et al., 2007) as discussed in Ratzmann et al. (2016). Interestingly, a limited impact of rainfall seasonality on growing season ANPP was found in arid lands below 300 mm yr−1 rainfall, suggesting that the species composition was adapted to rainfall variation and that the rather sparse vegetation cover was able to effectively utilize rainfall independent of the seasonal distribution. This was very different in the semi-arid and northern sub-humid zone (300–700 mm yr−1), where variations in rainfall seasonality were found to be more closely linked with variations in growing season ANPP. This implied that a favourable distribution of rainfall may lead to increased productivity, as was observed in Senegal between 2006 and 2011 (Brandt et al., 2017), but below average rainfall conditions with an unfavourable distribution led to an immediate reduction in vegetation cover and growing season ANPP.
Not surprisingly, the number of rainy days showed the highest relationship with growing season ANPP (Fig. 5c), with increasing productivity along with increasing rainy days, up to 69 days, where the relation weakens (Fig. 9c). The importance of this metric was closely followed by the heavy-rainfall events, which were negatively correlated with growing season ANPP (Fig. 5e) and decreased the productivity until heavy-rainfall events reached a share of 80 %, which led to a constant level of low vegetation productivity (Fig. 9e). The importance of the timing of the wet season, i.e. the onset and cessation, increases rapidly along the rainfall gradient, having the highest impact on growing season ANPP in the semi-arid zone (300–700 mm yr−1). The reason for the importance of the timing of the onset of the growing season for the growing season ANPP (Fig. 9a) with an almost linear decrease in growing season ANPP as a function of onset delay should be found in the predominance of annual grasses which are photoperiodic (Penning de Vries and Djiteye, 1982). The cessation of season was thus controlled by day length and therefore does not compensate for a delay in the onset. Also, a too-early onset was found to decrease growing season ANPP, which is likely to be associated with so-called “false starts” of the growing season. Often, an early start of the growing season is accompanied by a significant number of dry days occurring shortly after the start of the wet season, with a detrimental impact upon plant growth (Proud and Rasmussen, 2011). Finally, we found that the general impact of consecutive dry days was difficult to quantify (Fig. 7f). However, a rather clear critical threshold of 14 consecutive days without rainfall was found to have an increased adverse impact on the growing season ANPP. This threshold of 14 days as an average for the Sahel was related to the depletion time of the upper-layer soil water and the root depth of the herbaceous stratum (primarily annual grasses) but will vary spatially with different soil and vegetation types (Penning de Vries and Djiteye, 1982).
Several studies have reported a tendency towards an earlier start of the wet season (Sanogo et al., 2015; Zhang et al., 2017), but projections predict a delay of the wet season in the later 21th century (Biasutti and Sobel, 2009; Guan et al., 2014). Moreover, an increase in heavy-rainfall events and prolonged dry spells have been observed and are projected for the future (Sanogo et al., 2015; Taylor et al., 2017; Zhang et al., 2017). Our results showed that the semi-arid zone will be most prone to these projected changes, and an increase in heavy-rainfall events, a delay in the onset of the wet season and dry spells exceeding 14 days will cause a significant reduction in vegetation productivity, although the annual rainfall amount may be constant or even increasing. Disregarding the importance and impact of varying rainfall distribution on vegetation productivity leads to a bias in any ANPP prediction, and this knowledge should be implemented in any prediction and estimation of ANPP, both for ecosystem models and for remote-sensing-based analyses, especially in the context of food security. Although this study did not include a temporal change component of the metrics analysed, the length of high-quality time series data of both vegetation productivity and rainfall with a daily temporal resolution does provide the possibility for adding a temporal dimension, which will be pursued in a future study.
In this study we analysed the impact of seasonal rainfall distribution (represented by onset and cessation of the wet season, number of rainy days, rainfall intensity, number of consecutive dry days, and heavy-rainfall events) on growing season ANPP for the Sahelian zone. Overall, a clear north–south gradient was observed for the onset, rainy days, heavy-rainfall events, and consecutive dry days; additionally, considerable differences in cessation date, number of rainy days, and the rainfall intensity were observed between the eastern and western Sahel. We found the strongest relationship between growing season ANPP and the number of rainy days (r2=0.73), closely followed by a relationship between growing season ANPP and heavy-rainfall events (r2=0.72). Growing season ANPP in the arid zone (100–300 mm yr−1) was rather insensitive to variations in the seasonal-rainfall metrics, whereas vegetation in the semi-arid zone (300–700 mm yr−1) was significantly impacted by most metrics, especially by the number of rainy days and timing (onset and cessation) of the wet season. Finally, the critical-breakpoint analysis between growing season ANPP and all rainfall metrics showed that the growing season ANPP were particularly negatively impacted after >14 consecutive dry days and that a rainfall intensity of 13 mm day−1 was detected for optimum growing season ANPP. Overall, it can be concluded that seasonal rainfall distribution significantly influences ANPP, and the effect of different rainfall metrics was observed to vary along the north–south rainfall gradient. These findings have important implications for the sheer amount of dryland studies in which annually or seasonally summed rainfall and ANPP are used to derive indicators of land degradation or anthropogenic influence (e.g. the use of RUE and RESTREND). When studying subtle changes in dryland vegetation productivity based on time series of satellite data, as caused by both climate and anthropogenic forcing, it is essential also to consider the potential effect from changes in the rainfall regime as expressed in the seasonal-rainfall metrics studied here. Inter-annual differences in the seasonal distribution of rainfall are known to have an impact on species composition in the Sahel (Mbow et al., 2013), and it is likely that the herbaceous vegetation is able to adapt to changes in seasonal rainfall distribution as expressed by a shift in the abundance of species favoured by increased heavy-rainfall events and longer dry spells.
The authors declare that they have no conflict of interest.
This study is jointly supported by the European Union's Horizon 2020
research and innovation programme under the Marie Skłodowska-Curie grant
agreement (project BICSA number 656564); the China Scholarship Council (CSC,
201506190076); the Danish Council for Independent Research (DFF)
project “Greening of drylands: Towards understanding ecosystem functioning
changes, drivers and impacts on livelihoods”; and the
Chinese National Science and Technology Major Project (03-Y20A04-9001-15/16).
Also, we would like to thank the associate editor, Jochen Schöngart; the
reviewer, M. Marshall; and the anonymous reviewer for providing detailed
comments and constructive suggestions.
Edited by: Jochen Schöngart
Reviewed by: Michael Marshall and one anonymous referee
Abdi, A. M., Seaquist, J., Tenenbaum, D. E., Eklundh, L., and Ardö, J.: The supply and demand of net primary production in the Sahel, Environ. Res. Lett., 9, 94003, https://doi.org/10.1088/1748-9326/9/9/094003, 2014.
Archer, E.: Beyond the “climate versus grazing” impasse: using remote sensing to investigate the effects of grazing system choice on vegetation cover in the eastern, J. Arid Environ., 57, 381–408, https://doi.org/10.1016/S0140-1963(03)00107-1, 2004.
Bai, Z., Dent, D., and Olsson, L.: Proxy global assessment of land degradation, Soil Use Manage., 24, 223–234, https://doi.org/10.1111/j.1475-2743.2008.00169.x, 2008.
Bates, J. D., Svejcar, T., Miller, R. F., and Angell, R. A.: The effects of precipitation timing on sagebrush steppe vegetation, J. Arid Environ., 64, 670–697, https://doi.org/10.1016/j.jaridenv.2005.06.026, 2006.
Biasutti, M. and Sobel, A. H.: Delayed Sahel rainfall and global seasonal cycle in a warmer climate, Geophys. Res. Lett., 36, 1–5, https://doi.org/10.1029/2009GL041303, 2009.
Brandt, M., Tappan, G., Diouf, A., Beye, G., and Mbow, C.: Woody vegetation die off and regeneration in response to rainfall variability in the West African Sahel, Remote Sensing, 9, 39, https://doi.org/10.3390/rs9010039, 2017.
Breiman, L.: Random forests, Mach. Learn., 45, 5–32, https://doi.org/10.1023/A:1010933404324, 2001.
Breman, H. and Kessler, J.: Woody Plants in Agro-Ecosystems of Semi-Arid Regions: With an Emphasis on the Sahelian Countries, Springer, Berlin Heidelberg, 1995.
Chen, J., Chen, J., Liao, A., Cao, X., Chen, L., Chen, X., He, C., Han, G., Peng, S., Lu, M., Zhang, W., Tong, X., and Mills, J.: Global land cover mapping at 30 m resolution: a POK-based operational approach, ISPRS J. Photogramm., 103, 7–27, https://doi.org/10.1016/j.isprsjprs.2014.09.002, 2014.
Diaconescu, E. P., Gachon, P., Scinocca, J., and Laprise, R.: Evaluation of daily precipitation statistics and monsoon onset/retreat over western Sahel in multiple data sets, Clim. Dynam., 45(5–6), 1325–1354, https://doi.org/10.1007/s00382-014-2383-2, 2015.
Diouf, A. A., Hiernaux, P., Brandt, M., Faye, G., Djaby, B., Diop, M. B., Ndione, J. A., and Tychon, B.: Do agrometeorological data improve optical satellite-based estimations of the herbaceous yield in Sahelian semi-arid ecosystems?, Remote Sensing, 8, 668, https://doi.org/10.3390/rs8080668, 2016.
Donohue, R. J., Roderick, M. L., McVicar, T. R., and Farquhar, G. D.: Impact of CO2 fertilization on maximum foliage cover across the globe's warm, arid environments, Geophys. Res. Lett., 40, 3031–3035, https://doi.org/10.1002/grl.50563, 2013.
Dunning, C. M., Black, E. C. L., and Allan, R. P.: The onset and cessation of seasonal rainfall over Africa, J. Geophys. Res.-Atmos., 121, 11405–11424, https://doi.org/10.1002/2016JD025428, 2016.
Evans, J. and Geerken, R.: Discrimination between climate and human-induced dryland degradation, J. Arid Environ., 57, 535–554, https://doi.org/10.1016/S0140-1963(03)00121-6, 2004.
Fay, P. A., Carlisle, J. D., Knapp, A. K., Blair, J. M., and Collins, S. L.: Altering rainfall timing and quantity in a mesic grassland ecosystem: design and performance of rainfall manipulation shelters, Ecosystems, 3, 308–319, https://doi.org/10.1007/s100210000028, 2000.
Fensholt, R. and Kjeld, R.: Analysis of trends in the Sahelian “rain-use efficiency” using GIMMS NDVI, RFE and GPCP rainfall data, Remote Sens. Environ., 115, 438–451, https://doi.org/10.1016/j.rse.2010.09.014, 2011.
Fensholt, R., Rasmussen, K., Kaspersen, P., Huber, S., Horion, S., and Swinnen, E.: Assessing land degradation/recovery in the African Sahel from long-term earth observation based primary productivity and precipitation relationships, Remote Sensing, 5, 664–686, https://doi.org/10.3390/rs5020664, 2013.
Fensholt, R., Horion, S., Tagesson, T., Ehammer, A., Grogan, K., Tian, F., Huber, S., Verbesselt, J., Prince, S. P., Tucker, C. J., and Rasmussen, K.: Assessment of Vegetation Trends in Drylands from Time Series of Earth Observation Data, Remote Sensing Time Series, 22, 159–182, 2015.
Field, C.: Managing the risks of extreme events and disasters to advance climate change adaptation, IPCC Special Report of the Intergovernmental Panel on Climate Change, Cambridge University Press, Cambridge, UK and New York, NY, USA, 582 pp., 2012.
Fischer, E. M., Beyerle, U., and Knutti, R.: Robust spatially aggregated projections of climate extremes, Nat. Clim. Change, 3, 1033–1038, https://doi.org/10.1038/nclimate2051, 2013.
Fitzpatrick, R. G. J., Bain, C. L., Knippertz, P., Marsham, J. H., and Parker, D. J.: The West African monsoon onset: a concise comparison of definitions, J. Climate, 28, 8673–8694, https://doi.org/10.1175/JCLI-D-15-0265.1, 2015.
Funk, C., Peterson, P., Landsfeld, M., Pedreros, D., Verdin, J., Shukla, S., Husak, G., Rowland, J., Harrison, L., Hoell, A., and Michaelsen, J.: The climate hazards infrared precipitation with stations – a new environmental record for monitoring extremes, Sci. Data, 2, 150066, https://doi.org/10.1038/sdata.2015.66, 2015.
Guan, K., Good, S. P., Caylor, K. K., Sato, H., Wood, E. F., and Li, H.: Continental-scale impacts of intra-seasonal rainfall variability on simulated ecosystem responses in Africa, Biogeosciences, 11, 6939–6954, https://doi.org/10.5194/bg-11-6939-2014, 2014.
Herman, A., Kumar, V. B., Arkin, P. A., and Kousky, J. V.: Objectively determined 10-day African rainfall estimates created for famine early warning systems, Int. J. Remote Sens., 18, 2147–2159, https://doi.org/10.1080/014311697217800, 1997.
Herrmann, S. M., Anyamba, A., and Tucker, C. J.: Recent trends in vegetation dynamics in the African Sahel and their relationship to climate, Global Environ. Chang., 15, 394–404, https://doi.org/10.1016/j.gloenvcha.2005.08.004, 2005.
Houerou, H. Le: Rain use efficiency: a unifying concept in arid-land ecology, J. Arid Environ., 7, 213–247, 1984.
Huber, S., Fensholt, R., and Rasmussen, K.: Water availability as the driver of vegetation dynamics in the African Sahel from 1982 to 2007, Global Planet. Change, 76(3–4), 186–195, https://doi.org/10.1016/j.gloplacha.2011.01.006, 2011.
Jönsson, P. and Eklundh, L.: TIMESAT – a program for analyzing time-series of satellite sensor data, Comput. Geosci., 30, 833–845, 2004.
Kaspersen, P. S., Fensholt, R., and Huber, S.: A spatiotemporal analysis of climatic drivers for observed changes in Sahelian vegetation productivity (1982–2007), Int. J. Geophys., 2011, 1–14, https://doi.org/10.1155/2011/715321, 2011.list
Kharin, V. V., Zwiers, F. W., Zhang, X., and Hegerl, G. C.: Changes in temperature and precipitation extremes in the IPCC ensemble of global coupled model simulations, J. Climate, 20, 1419–1444, https://doi.org/10.1175/JCLI4066.1, 2007.
Lebel, T. and Ali, A.: Recent trends in the Central and Western Sahel rainfall regime (1990–2007), J. Hydrol., 375, 52–64, https://doi.org/10.1016/j.jhydrol.2008.11.030, 2009.
Leisinger, K. M. and Schmitt, K.: Survival in the Sahel: an Ecological and Developmental Challenge, International Service for National Agricultural Research (ISNAR), The Hague, The Netherlands, 1995.
Liebmann, B., Bladé, I., Kiladis, G. N., Carvalho, L. M. V, Senay, G. B., Allured, D., Leroux, S., and Funk, C.: Seasonality of African precipitation from 1996 to 2009, J. Climate, 25, 4304–4322, https://doi.org/10.1175/JCLI-D-11-00157.1, 2012.
Mbow, C., Fensholt, R., Rasmussen, K., and Diop, D.: Can vegetation productivity be derived from greenness in a semi-arid environment? Evidence from ground-based measurements, J. Arid Environ., 97, 56–65, https://doi.org/10.1016/j.jaridenv.2013.05.011, 2013.
Muggeo, V. M. R.: Estimating regression models with unknown break-points, Stat. Med., 22, 3055–3071, https://doi.org/10.1002/sim.1545, 2003.
Nicholson, S. E.: The nature of rainfall variability over Africa on time scales of decades to millenia, Global Planet. Change, 26(1–3), 137–158, https://doi.org/10.1016/S0921-8181(00)00040-0, 2000.
Olsson, L., Eklundh, L., and Ardö, J.: A recent greening of the Sahel – trends, patterns and potential causes, J. Arid Environ., 63, 556–566, https://doi.org/10.1016/j.jaridenv.2005.03.008, 2005.
Panthou, G., Vischel, T., and Lebel, T.: Recent trends in the regime of extreme rainfall in the Central Sahel, Int. J. Climatol., 34, 3998–4006, https://doi.org/10.1002/joc.3984, 2014.
Penning de Vries, F. W. T. and Djiteye, M. A.: The Productivity of Sahelian Rangeland: a Study of Soils, Vegetation and the Exploitation of This Natural Resource, Centre for Agricultural Publishing and Documentation, Wageningen, Netherlands, 1982.
Prince, S., Colstoun, D., and Brown, E.: Evidence from rain-use efficiencies does not indicate extensive Sahelian desertification, Glob. Change Biol., 4, 359–374, https://doi.org/10.1046/j.1365-2486.1998.00158.x, 1998.
Proud, S. R. and Rasmussen, L. V.: The influence of seasonal rainfall upon Sahel vegetation, Remote Sens. Lett., 2, 241–249, https://doi.org/10.1080/01431161.2010.515268, 2011.
Ratzmann, G., Gangkofner, U., Tietjen, B., and Fensholt, R.: Dryland vegetation functional response to altered rainfall amounts and variability derived from satellite time series data, Remote Sensing, 8, 1026, https://doi.org/10.3390/rs8121026, 2016.
Rishmawi, K., Prince, S., and Xue, Y.: Vegetation responses to climate variability in the northern arid to sub-humid zones of Sub-Saharan Africa, Remote Sensing, 8, 910, https://doi.org/10.3390/rs8110910, 2016.
R Team: R: a language and environment for statistical computing. Vienna, Austria: R Foundation for Statistical Computing, available at: http://www.R-project.org/ (last access: 5 May 2017), 2014.
Romankiewicz, C., Doevenspeck, M., Brandt, M., and Samimi, C.: Adaptation as by-product: migration and environmental change in Nguith, Senegal, J. Geogr. Soc. Berlin, 147, 95–108, https://doi.org/10.12854/erde-147-7, 2016.
Sanogo, S., Fink, A. H., Omotosho, J. A., Ba, A., Redl, R., and Ermert, V.: Spatio-temporal characteristics of the recent rainfall recovery in West Africa, Int. J. Climatol., 35, 4589–4605, https://doi.org/10.1002/joc.4309, 2015.
Smith, M. D.: The ecological role of climate extremes: current understanding and future prospects, J. Ecol., 99, 651–655, https://doi.org/10.1111/j.1365-2745.2011.01833.x, 2011.
Taylor, C. M., Belušić, D., Guichard, F., Parker, D. J., Vischel, T., Bock, O., Harris, P. P., Janicot, S., Klein, C., and Panthou, G.: Frequency of extreme Sahelian storms tripled since 1982 in satellite observations, Nature, 544, 475–478, https://doi.org/10.1038/nature22069, 2017.
Thomey, M. L., Collins, S. L., Vargas, R., Johnson, J. E., Brown, R. F., Natvig, D. O., and Friggens, M. T.: Effect of precipitation variability on net primary production and soil respiration in a Chihuahuan Desert grassland, Glob. Change Biol., 17, 1505–1515, https://doi.org/10.1111/j.1365-2486.2010.02363.x, 2011.
Wessels, K., Prince, S., Malherbe, J., and Small, J.: Can human-induced land degradation be distinguished from the effects of rainfall variability? A case study in South Africa, J. Arid Environ., 68, 271–297, https://doi.org/10.1016/j.jaridenv.2006.05.015, 2007.
Wood, S.: Package mgcv, https://cran.r-project.org/web/packages/mgcv/index.html (last access: 1 September 2017), 2017.
Zhang, W., Brandt, M., Guichard, F., Tian, Q., and Fensholt, R.: Using long-term daily satellite based rainfall data (1983–2015) to analyze spatio-temporal changes in the sahelian rainfall regime, J. Hydrol., 550, 427–440, https://doi.org/10.1016/j.jhydrol.2017.05.033, 2017.