the Creative Commons Attribution 3.0 License.
the Creative Commons Attribution 3.0 License.
Water-stress-induced breakdown of carbon–water relations: indicators from diurnal FLUXNET patterns
Nuno Carvalhais
Mirco Migliavacca
Markus Reichstein
Martin Jung
Understanding of terrestrial carbon and water cycles is currently hampered by an uncertainty in how to capture the large variety of plant responses to drought. In FLUXNET, the global network of CO2 and H2O flux observations, many sites do not uniformly report the ancillary variables needed to study drought response physiology. To this end, we outline two data-driven indicators based on diurnal energy, water, and carbon flux patterns derived directly from the eddy covariance data and based on theorized physiological responses to hydraulic and non-stomatal limitations. Hydraulic limitations (i.e. intra-plant limitations on water movement) are proxied using the relative diurnal centroid (), which measures the degree to which the flux of evapotranspiration (ET) is shifted toward the morning. Non-stomatal limitations (e.g. inhibitions of biochemical reactions, RuBisCO activity, and/or mesophyll conductance) are characterized by the Diurnal Water–Carbon Index (DWCI), which measures the degree of coupling between ET and gross primary productivity (GPP) within each day. As a proof of concept we show the response of the metrics at six European sites during the 2003 heat wave event, showing a varied response of morning shifts and decoupling. Globally, we found indications of hydraulic limitations in the form of significantly high frequencies of morning-shifted days in dry/Mediterranean climates and savanna/evergreen plant functional types (PFTs), whereas high frequencies of decoupling were dominated by dry climates and grassland/savanna PFTs indicating a prevalence of non-stomatal limitations in these ecosystems. Overall, both the diurnal centroid and DWCI were associated with high net radiation and low latent energy typical of drought. Using three water use efficiency (WUE) models, we found the mean differences between expected and observed WUE to be −0.09 to 0.44 µmol mmol−1 and −0.29 to −0.40 µmol mmol−1 for decoupled and morning-shifted days, respectively, compared to mean differences −1.41 to −1.42 µmol mmol−1 in dry conditions, suggesting that morning shifts/hydraulic responses are associated with an increase in WUE, whereas decoupling/non-stomatal limitations are not.
- Article
(2655 KB) - Full-text XML
-
Supplement
(445 KB) - BibTeX
- EndNote


Processes such as photosynthesis and transpiration are so intimately linked that knowledge and assumptions about one process are needed to accurately understand the other. Unfortunately, the relationship between carbon and water cycles is not fully understood (Tang et al., 2014), passing the biases and uncertainties caused by an incomplete carbon–water framework back onto flux estimates specifically and global water and carbon cycle interactions and dynamics in general (Keenan et al., 2013; Schlesinger and Jasechko, 2014; Ito and Inatomi, 2012). One source of uncertainty that is increasingly being identified is the diverse responses of plants to water limitation
(Zhou et al., 2013; Dietze et al., 2014; Rogers et al., 2017), which hampers the understanding and predictability of water and carbon cycles during drought. Here we outline potential causes of uncertainty in carbon–water dynamics in an effort to outline data-derived inductors based on current theory.
Classically, vegetation water and carbon fluxes are linked by stomates, where an open stomate allows CO2 to enter the leaf and, consequentially, water is lost. Most theoretical frameworks make some form of assumption that carbon assimilation (A) and water losses (T) are both contingent primarily on leaf stomatal conductance (gs). This assumed relationship allows us to pass between the realms of carbon and water, based on the assumption that at any given time both A and T are proportional to the stomatal conductance multiplied by the difference in internal and external CO2 and water vapor concentrations. More specifically,
where Δc and Δv are the differences in inner and outer stomatal cavity concentrations of CO2 and water vapor, respectively. These diffusion equations lead to the relatively consistent carbon : water ratio, generally expressed as a water use efficiency . At the ecosystem level where direct measurements of A and T are not available, WUE is simply calculated as the ratio of gross primary productivity (GPP) to total evapotranspiration (ET) (Kuglitsch et al., 2008). These carbon–water links are fundamental to understanding how stomata are regulated and underlie key functioning in mechanistic plant and ecosystem models. One such set of models are those based on optimality theory which posit that plants tend to optimize carbon gains to water losses, such as the models described by Katul et al. (2010) and Katul et al. (2009). These concepts from Katul, which carry the assumptions of RuBisCO (light) limitation, were built upon by Zhou et al. (2014) and Zhou et al. (2015) to give the equation
where the accounts for the stomatal response to vapor pressure deficit (VPD), assuming the stomatal response optimizes carbon gain to water losses. Accounting for the VPD response allows for a more stable metric of WUE that is temporally more stable and physiologically more meaningful, such as when comparing the diurnal cycles of carbon and water. As ET is the sum of both T and non-biological evaporation (e.g. soil and intercepted evaporation), often periods during and shortly after rain events are excluded from WUE estimates to minimize the influence of non-plant evaporation. Ultimately, calculations of WUE provide a simple summary of the cost in water per carbon gain and become an indicator of how plants have and will adapt to the physical limitations of their changing environments (Keenan et al., 2013; Tang et al., 2014).
Though assuming a rigid carbon–water relationship works well in conditions when ecosystems are moderately wet, conditions associated with the majority of carbon and water fluxes, an inflexible carbon–water assumption is unsatisfactory in that these assumptions may break down as plants shift from light to water limitations. Indeed, in a review of leaf-level stomatal conductance models, Damour et al. (2010) concluded that the majority of stomatal models fail to adequately capture the effects of drought. This failure to capture the effects of drought is not only disconcerting as water-limited conditions are when ecosystems are most at risk, but an incomplete framework tends to propagate errors and uncertainties from models into estimates of the water and carbon cycles. For instance, in outlining a road map for an improved modeling of photosynthesis, Rogers et al. (2017) noted as key recommendations both improving information about water–carbon relations (in the form of the stomatal slope parameter g1) as well as improving the understanding of the response of carbon assimilation to drought. Similarly, in an analysis of parameter uncertainties for a terrestrial biosphere model, Dietze et al. (2014) found that two of the top five parameters contributing to the predictive uncertainty of net primary productivity were associated with plant water regulation. This uncertainty is reflected in the stomatal conductance parameterization exercise from Knauer et al. (2015), where the authors were able to improve model performance in predicting eddy covariance (EC)-measured GPP and ET by including atmospheric effects (in the form of VPD) on stomatal conductance but concluded that further improvement required a global understanding of water limitation response variation across plant functional traits and growing conditions, which is currently unavailable.
Two ideas to account for the errors in carbon–water assumptions under dry conditions have begun to emerge: that hydraulic limitations in transporting water from root to leaf change stomatal responses and thus limit transpiration under high demand and that changes in the intra-leaf processes of carbon transport and fixation under drought conditions result in non-stomatal limitations that impact carbon assimilation independently of water fluxes (Novick et al., 2016).
As soil water potentials in the root zone become increasingly negative, the long-term plant strategy may turn from optimizing carbon fixation to preventing damage to hydraulic architecture (Tyree and Sperry, 1988). As such, stomata and transpiration are likely to increasingly respond not just to atmospheric conditions but also to soil moisture. Under this hydraulic limitation framework, a plant will be reacting to the inability to transport water, even though the key control mechanism for a plant is via the stomata, possibly expressed as an increase in sensitivity. Such assumptions are consistent with the mechanisms encoded in some land surface and ecosystem models, which account for water limitations by scaling the water-to-carbon ratio in relation to available soil moisture. Though this method should link the leaf physiology to the soil and thus capture some hydraulic limitation, it has been criticized for not capturing the variety of drought responses found in different plant species and ecosystems (De Kauwe et al., 2015). This diversity in plant responses has been pointed to as a key point of uncertainty in earth system models (Dietze et al., 2014).
Though ecosystem water and carbon fluxes are predominantly controlled by stomates, non-stomatal or bio-/photo-chemical inhibitions to carbon assimilation are worth considering as they have the capacity to decouple the water–carbon exchange. This decoupling could include conditions where the stomates are transpiring water but intra-leaf factors are slowing carbon fixation, changing the intrinsic water use efficiency directly. Intra-leaf factors could include effects such as the production of reactive oxygen species (Lawlor and Tezara, 2008); environmental limitations on the photosynthetic pathways, such as leaf temperature (Medlyn et al., 2002); or declines in mesophyll conductance (Flexas et al., 2012). Non-stomatal limitations have been observed at the ecosystem scale (Reichstein et al., 2002; Migliavacca et al., 2009), though the exact mechanism is difficult to elucidate (Reichstein, 2003). These effects likely vary between species, as well as with the rate of the onset of drought, access to water, and other environmental conditions.
1.1 Objectives
There seems to be a collective conclusion that the breakdown of carbon–water assumptions needs to be better characterized in general and specifically for the implementation in modeling frameworks (Egea et al., 2011; Flexas et al., 2012; Zhou et al., 2013; Manzoni, 2014; De Kauwe et al., 2015).
Though the problem is becoming clear, the way forward is hampered by an uncertainty in how to capture the large variety in the response to drought across climates, strategies, and species. In this sense, the use of EC-measured diurnal patterns of carbon, water, and energy fluxes to derive clues on ecosystem drought responses at a daily resolution could prove valuable both as a means to identify potential periods of ecosystem stress, inform machine learning algorithms on ecophysiological conditions not found in environmental variables, as well as benchmarking a model's ability to capture sub-daily dynamics. To this end, we propose two data-driven indicators of water stress, the Diurnal Water–Carbon Index (DWCI) and the relative diurnal centroid in latent energy (LE) (). Both metrics are derived directly from the EC data and based on expected physiological responses to hydraulic and non-stomatal limitations. Using these data-driven indicators we then characterize the distribution of these limitations across a global spread of climate and vegetation types. Finally, we explore the ability of these indicators to detect the disagreements between modeled and observed water use efficiency and explore how these biases may be attributed to hydraulic and non-stomatal limitations.
2.1 Data
Carbon, water, and all fluxes measured with EC, as well as meteorological data, were obtained from the 2007 FLUXNET La Thuile Synthesis Dataset (NOA, 2007). Half-hourly latent heat and net ecosystem exchange (NEE) fluxes were collected and processed using standard quality-assurance–quality-control (QA/QC) procedures (Papale et al., 2006), gap-filling, and partitioning algorithms (Reichstein et al., 2005). From the database, half-hourly GPP and ET data (derived from latent heat flux measurements) were downloaded and used for the following analysis. An interactive map of sites used can be found in File S1 in the Supplement.
In order to provide a consistent measure of ecosystem dryness that can be utilized across sites, the ratio of water evaporated to potential water evaporated was calculated as evaporative fraction (EF), or the fraction of actual ET to Potential ET (PET). PET was calculated as the daily fraction between the measured ET and estimated ET via a Priestley–Taylor model (Priestley and Taylor, 1972) using site measured net radiation (Rn) and air temperature (Tair). The slope (alpha parameter) was fit for each site year using 95th quantile regression (Koenker and Bassett Jr., 1978) instead of using the original 1.26 value derived for a “well watered crop” (Priestley and Taylor, 1972).

Figure 1One-month average cycle (solid lines) and accompanying diurnal centroid (vertical dashed lines) of incoming shortwave radiation (Rg), evapotranspiration (ET), and gross primary productivity (GPP) at the Puéchabon, France (FR-Pue), site during 2003. May is relatively wet (32 mm rainfall, a) and July is relatively dry (0 mm rainfall, b). While ET and Rg correspond well in the wet month, the dry month shows a distinct phase shift in both GPP and ET fluxes towards the morning, as well as a midday depression in GPP.
In order to obtain high-quality data and minimize the influence of abiotic evaporation (hereafter just evaporation), all data was filtered with the aim to include only non-gap-filled data in the growing season with dry surface conditions. The growing season was defined as all days where GPP > 1 gC m−2 d−1 and daily mean air temperature > 5 ∘C. These threshold were shown to give a good response in the proposed metrics while minimizing variability due to low diurnal signals, a sensitivity analysis of which can be found in the Supplement Fig. S2. In an effort to minimize contributions of evaporation, the conservative soil wetness index (CSWI) was employed which was designed to estimate whether the ecosystem is likely to have “dry” surfaces and therefore ET is likely to be dominated by transpiration. This approach requires a certain amount of evaporation to occur after a rain event before the surface is considered to be dry and can be contrasted to the method of removing a set time period after rain employed in previous studies (Medlyn et al., 2017; Beer et al., 2009; Keenan et al., 2013). CSWI is calculating by first quantifying the storage at time t (St) as
where ETt and Pt are the ET and precipitation at time step t, respectively, and St is effectively capped at a maximum storage value of So, which was set to 5 mm. Furthermore, to make the metric conservative with regard to assumed water inputs, any precipitation event will refill the storage from 0 mm:
which has the effect of requiring all precipitation up to 5 mm to be evaporated from the system before negative storage can occur. Any gaps in the precipitation data were assumed to be a precipitation event of 5 mm in order to prevent any unmeasured precipitation from biasing the results by inadvertently including rainy days. The code and a further outline of the algorithm can be found in File S3 as well as in Nelson (2017). Evaporation was assumed to be negligible when CSWI < 0. This method was used over the more standard method of removing 1–5 days after a rain event, as it does not make the assumption that the surface will dry in a fixed amount of time, instead relying on a minimum amount of ET. As a comparison, the median time period for the CSWI to go from fully wet (CSWI = 5) to dry (CSWI ≤ 0) was 3.5 days across all sites in summer, where summer was defined as the period when daily potential radiation was above median daily potential radiation for each site.
The data filtering as outlined in this section was designed to isolate periods firmly in the growing season when plants are active and the signal of ET is most likely to be dominated by plant controls.
2.2 Relative diurnal centroid
As soils dry, it becomes more difficult to transport stem and root zone moisture to the leaf, potentially causing hydraulic limitations for the plant to transport water. This shift was seen in eddy covariance data in a study by Wilson et al. (2003), who examined the shift of latent compared to sensible heat, which suggested that a shift in water fluxes towards dawn can be indicative of afternoon stomatal closure. Shifts were further explored in a modeling study by Matheny et al. (2014), which found that the morning shift was not well captured by models and attributed the errors to inadequate hydraulic limitations in the models. The daily cycle of wetting and drying acts as a capacitor in the hydraulic circuit, allowing water stores to be more easily transported in the morning and depleted in the afternoon. As bulk soil moisture declines, this effect may be strong enough to shift the diurnal cycle of ET significantly toward the morning. Quantifying diurnal shifts in EC data using the diurnal centroid was first explored by Wilson et al. (2003) and defined as the flux weighted mean hour or
where t is a regular, sub-daily time interval (here t measures as decimal hour at half-hourly time step). The resulting Cflux is the weighted mean hour of the diurnal cycle of that particular flux for that particular day. For example, if a calculated CET for a given day (using measurements of decimal hour) equals 12.25, this would entail that the weighted mean for that day is 15 min past noon. Figure 1 shows an example of the shifts in the monthly average cycle from a wet month to a dry month. In order to isolate a shift, we then had to control for variations in global radiation (Rg) and fluctuations due both to clouds and to differences in the timing of solar noon. Therefore, the difference between the diurnal centroids of ET (CET) and Rg was calculated as
giving as the diurnal centroid of ET relative to Rg. The resulting values of are not tied to the carbon cycle, which can be affected by non-stomatal limitations and generally shows a more prominent midday depression. The annotated code for the CSWI calculation can be found in File S4 as well as in Nelson (2017). Though a diurnal centroid can be calculated for any diurnal cycle, basing a metric on the morning shift of ET relative to Rg has the advantage of targeting the non-atmospheric drivers of the water flux, of which there are few ancillary variables.
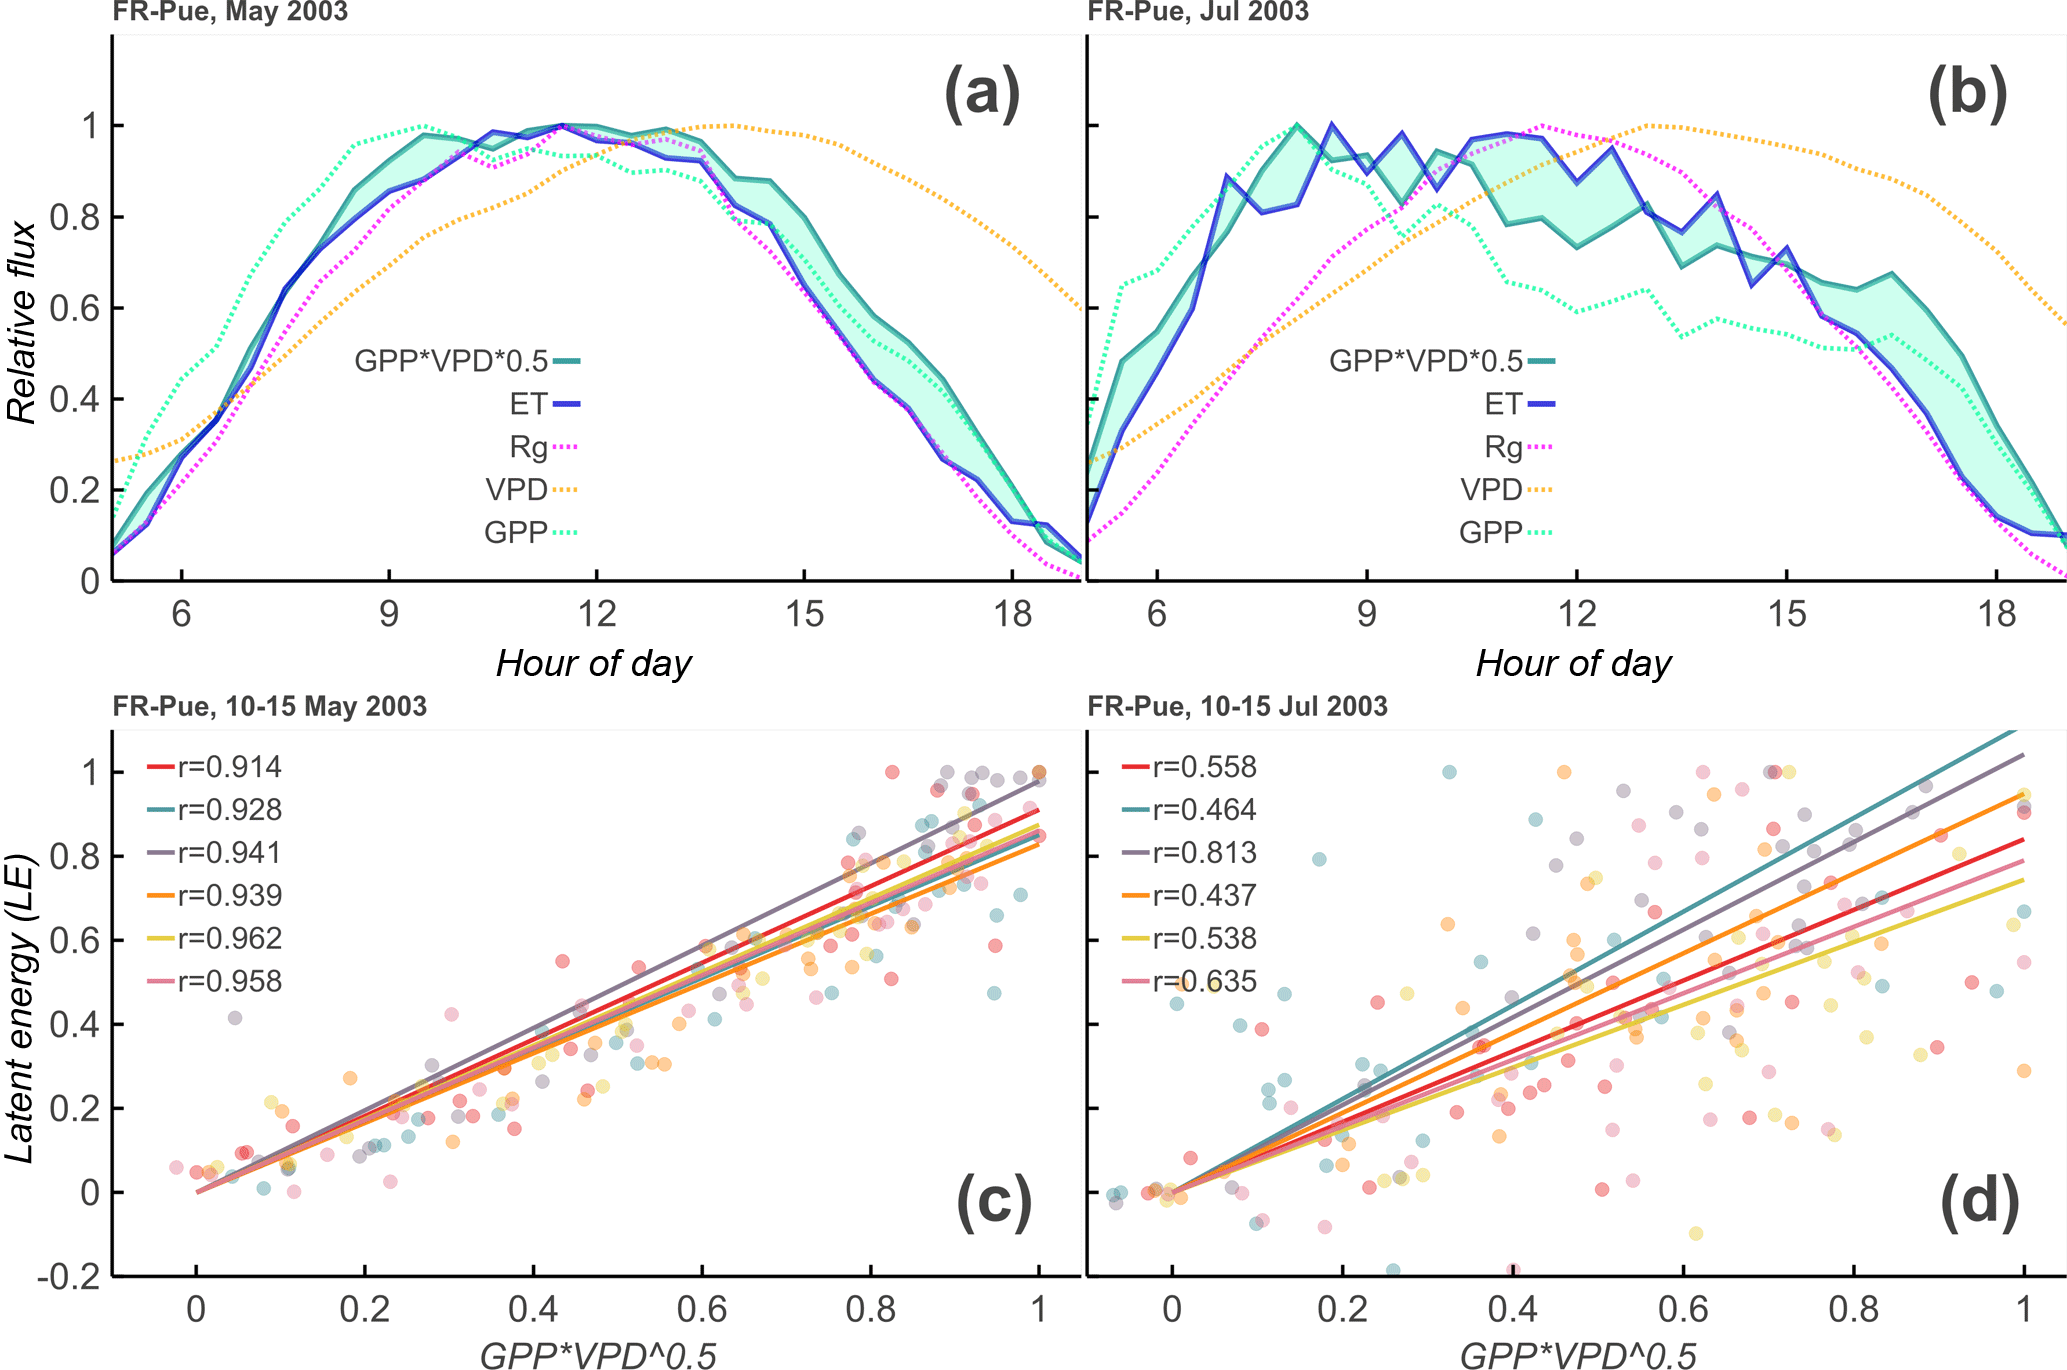
Figure 2Theoretical overview of Diurnal Water–Carbon Index. Panels (a) and (b): 1-month average diurnal cycle of incoming shortwave radiation (Rg), evapotranspiration (ET), vapor pressure deficit (VPD), gross primary productivity (GPP), and at the Puéchabon Forest, France (FR-Pue), site during 2003. Discrepancies between and ET increase from the relatively wet May (32 mm rainfall, a, c) to the relatively dry July (0 mm rainfall, b, d). Panels (c) and (d): these discrepancies are reflected in the daily correlation values between and ET, giving an indication of the appropriateness of the uWUE model for each day, as well as the degree of coupling between water and carbon signals.
2.3 Diurnal Water-Carbon Index (DWCI)
If transpiration and carbon assimilation are predominantly controlled by stomatal conductance, it follows that their diurnal cycles should be largely in sync. In other words, regardless of a plant's maximum T or A, if the stomates start to close, both rates should decrease by a similar percentage. On the other hand, non-stomatal limitations that inhibit carbon assimilation independently of water have the capability to alter the diurnal cycle on just one flux, causing them to decouple. In an effort to quantify the degree of carbon–water coupling for an individual day, we examined the relationship of GPP and ET, where
or
This relationship incorporates the assumption that, at least over short timescales, the amount of carbon that enters the leaf is proportional to the amount of water that leaves and also incorporates the nonlinear response of stomates to VPD (Katul et al., 2010, 2009; Zhou et al., 2014). This model, though simple, has been shown to work well across a variety of EC sites (Zhou et al., 2015). Figure 2a and b show a comparison between the daily cycles in a wet and a dry month. By calculating a daily correlation between the normalized daily cycles of ET and GPP , we come to a correlation coefficient for each day (see Fig. 2c, d). For well-watered days in the growing season, the two signals tend to be well correlated (ρ > 0.9), but they tend to be less correlated in periods of stress, a comparison of which can be seen in Fig. 2c, d.
As it is, this daily correlation coefficient is dependent on the signal strength, or magnitude, of the flux. Low correlation values could just as easily be from carbon–water decoupling as from a low signal-to-noise ratio. Therefore, to produce a more robust metric and account for these statistical decreases in correlation, we turned the daily correlation coefficient into an index based on its rank in a distribution of correlation coefficients from artificial datasets. These artificial datasets are constructed using the diurnal signal from potential radiation, with Gaussian noise (𝒩(0,σ)) added according to the standard deviation random uncertainty of the ET and NEE fluxes or
and
Uncertainties of the NEE and ET fluxes were estimated from the gap-filling procedure of Reichstein et al. (2005), with the uncertainty equal to the standard deviation of flux measurements within a time window and similar meteorological conditions. As GPP is calculated from gap-filled values of NEE, the uncertainty from NEE was used for GPP. Furthermore, the correlation structure between the noises in LE and NEE was preserved in the artificial dataset.
In essence, by using the underlying signal from potential radiation, both the artificial ET and GPP are perfectly correlated when no noise is added. Adding noise then isolates the decoupling effect of the signal-to-noise ratio. An artificial correlation coefficient can then be calculated from the two artificial datasets in the same manner as from the real dataset, and this experiment is repeated 100 times for each day, giving a daily distribution of artificial correlation coefficients. The rank of the real correlation coefficient in the distribution from the artificial set gives a probability that the carbon and water signals are actually coupled. The resulting index has a range of 0–100, with 100 indicating that the real correlation coefficient was greater than the entire artificial set, and therefore it is very likely that carbon and water are coupled. From this index we can now quantify if the water and carbon signals are coupled for any given day, and therefore shed light on whether the two fluxes are only controlled by the opening and closing of stomates. Annotated code for this calculation can be found in File S5 as well as in Nelson (2017).
2.4 Models and parameter estimation
In order to benchmark whether these metrics are capturing information that is possibly not being captured in modern model frameworks, three simple models were used to estimate WUE (GPP/ET) for each day at each site and compared to actual flux data. The purpose of the exercise was to evaluate if bias in the model predictions was associated with decoupled or morning-shifted days, thus indicating that the metrics correspond to information that the models are unable to capture. Here we utilize three models to provide a spectrum of theoretical to empirical basis. The Katul–Zhou model, as defined and used in the calculation of the DWCI, is based in stomatal optimization theory (Katul et al., 2010, 2009; Zhou et al., 2015), which makes the assumption that the WUE is constant if corrected by the effect of VPD, using an inverse square root as the assumed relationship. Though the constant nature of the underlying water use efficiency (uWUE, following convention in Zhou et al., 2015) may not be correct, with the optimal carbon cost of water changing over days or weeks (Manzoni et al., 2013; Palmroth et al., 2013), a yearly parameter of uWUE was estimated which is consistent with other modeling exercises (Zhou et al., 2016). A revision of this model which is one step away from a theoretical basis is the Boese model by Boese et al. (2017), where an additional radiation term was added such that
where i and r are parameters fit to each site year. This relationship with Rg was shown to have a better predictive performance for EC data from 115 sites (Boese et al., 2017). The interpretation of this extra radiation term is not clear and is difficult to reconcile with the current understanding of physiology. It is possible the term could be related to biophysical effects, e.g. VPD at leaf surface vs. the measured ambient VPD. Nevertheless, the Boese model is an empirical and ecosystem-scale model that complements the theoretical and originally leaf-level model from Katul–Zhou.
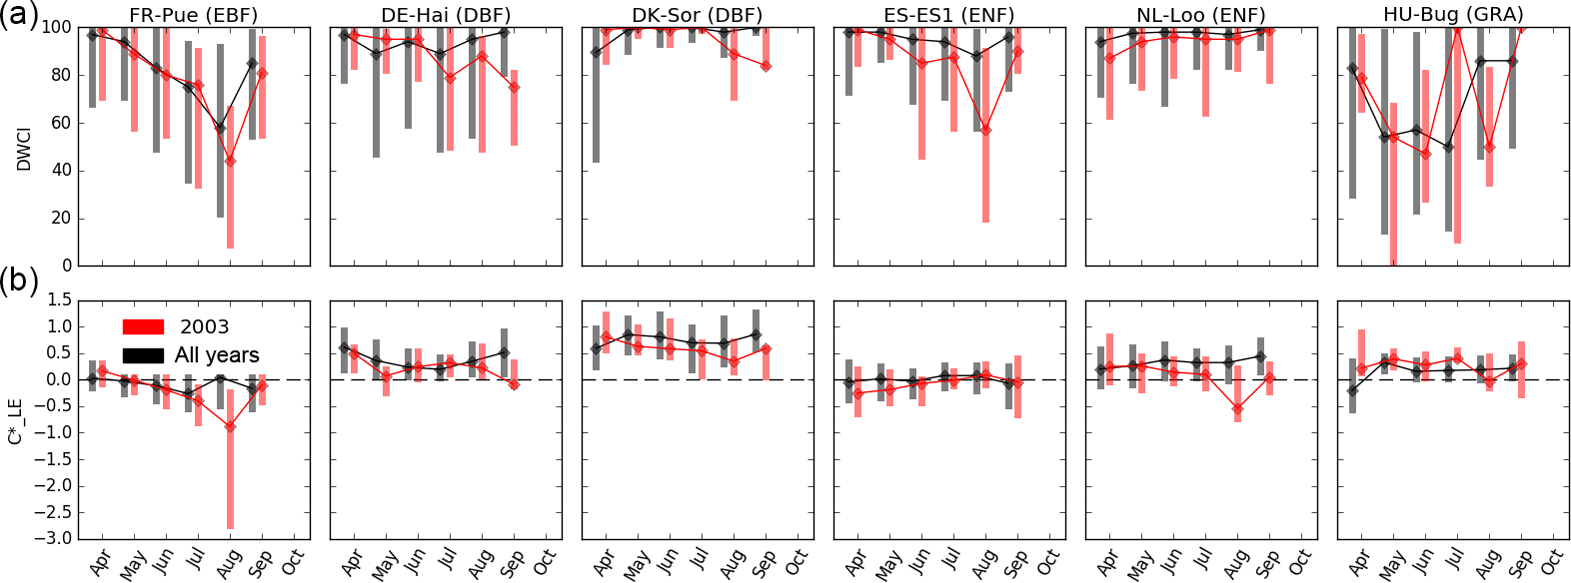
Figure 3Monthly median Diurnal Water–Carbon Index (DWCI, lower panels) and diurnal centroids (, upper panels) for six sites in Europe. Data from all years available (black) is compared to 2003 (red) during which a drought event resulted in high temperatures and low precipitation throughout the summer. Note that DWCI of 0–100 indicates lowest–highest probability of diurnal carbon–water coupling and that of −1 to 1 indicates 1-hour morning-shifted to 1-hour afternoon-shifted ET. Vertical bars represent interquartile range. Sites from four plant functional types: evergreen broadleaf (EBF), deciduous broadleaf (DBF) and evergreen needleleaf (ENF) forests, as well as grasslands (GRA). Ecosystems show tendencies of morning shifts (e.g. DK-Sor and NL-Loo) and carbon–water decoupling (e.g. ES-ES1 and HU-Bug) during the drought year.
Parameters of these models were estimated for each site year. The Boese model parameters were fit using trimmed least squares regression (TLS), which minimizes the 90th percentile of sum of squared errors (SSE) to prevent the influence of large outliers (Rousseeuw, 1983; Reth et al., 2005). As the error in both ET and GPP are assumed to be of a similar magnitude, the i parameter in the Katul–Zhou model was calculated using geometric mean regression, where the final slope was calculated as the geometric mean of the parameters from
Both the Katul–Zhou and Boese models are theoretically based and, implemented here, have the underlying assumptions of RuBisCO-limited conditions and a constant carbon cost of water throughout the season which may not reflect reality. Therefore a fully empirical and highly nonlinear model can give insight into how much information is actually stored in the data while minimizing any assumptions. As a fully empirical model, a random forest regression (RandomForestRegressor from Pedregosa et al., 2011 based on Breiman, 2001) was fit to half-hourly ET data for each site using Rg, VPD, Tair, GPP, and year as input parameters. Values were estimated using 50 trees, with predictions made using out-of-bag estimates to prevent over-fitted model predictions.
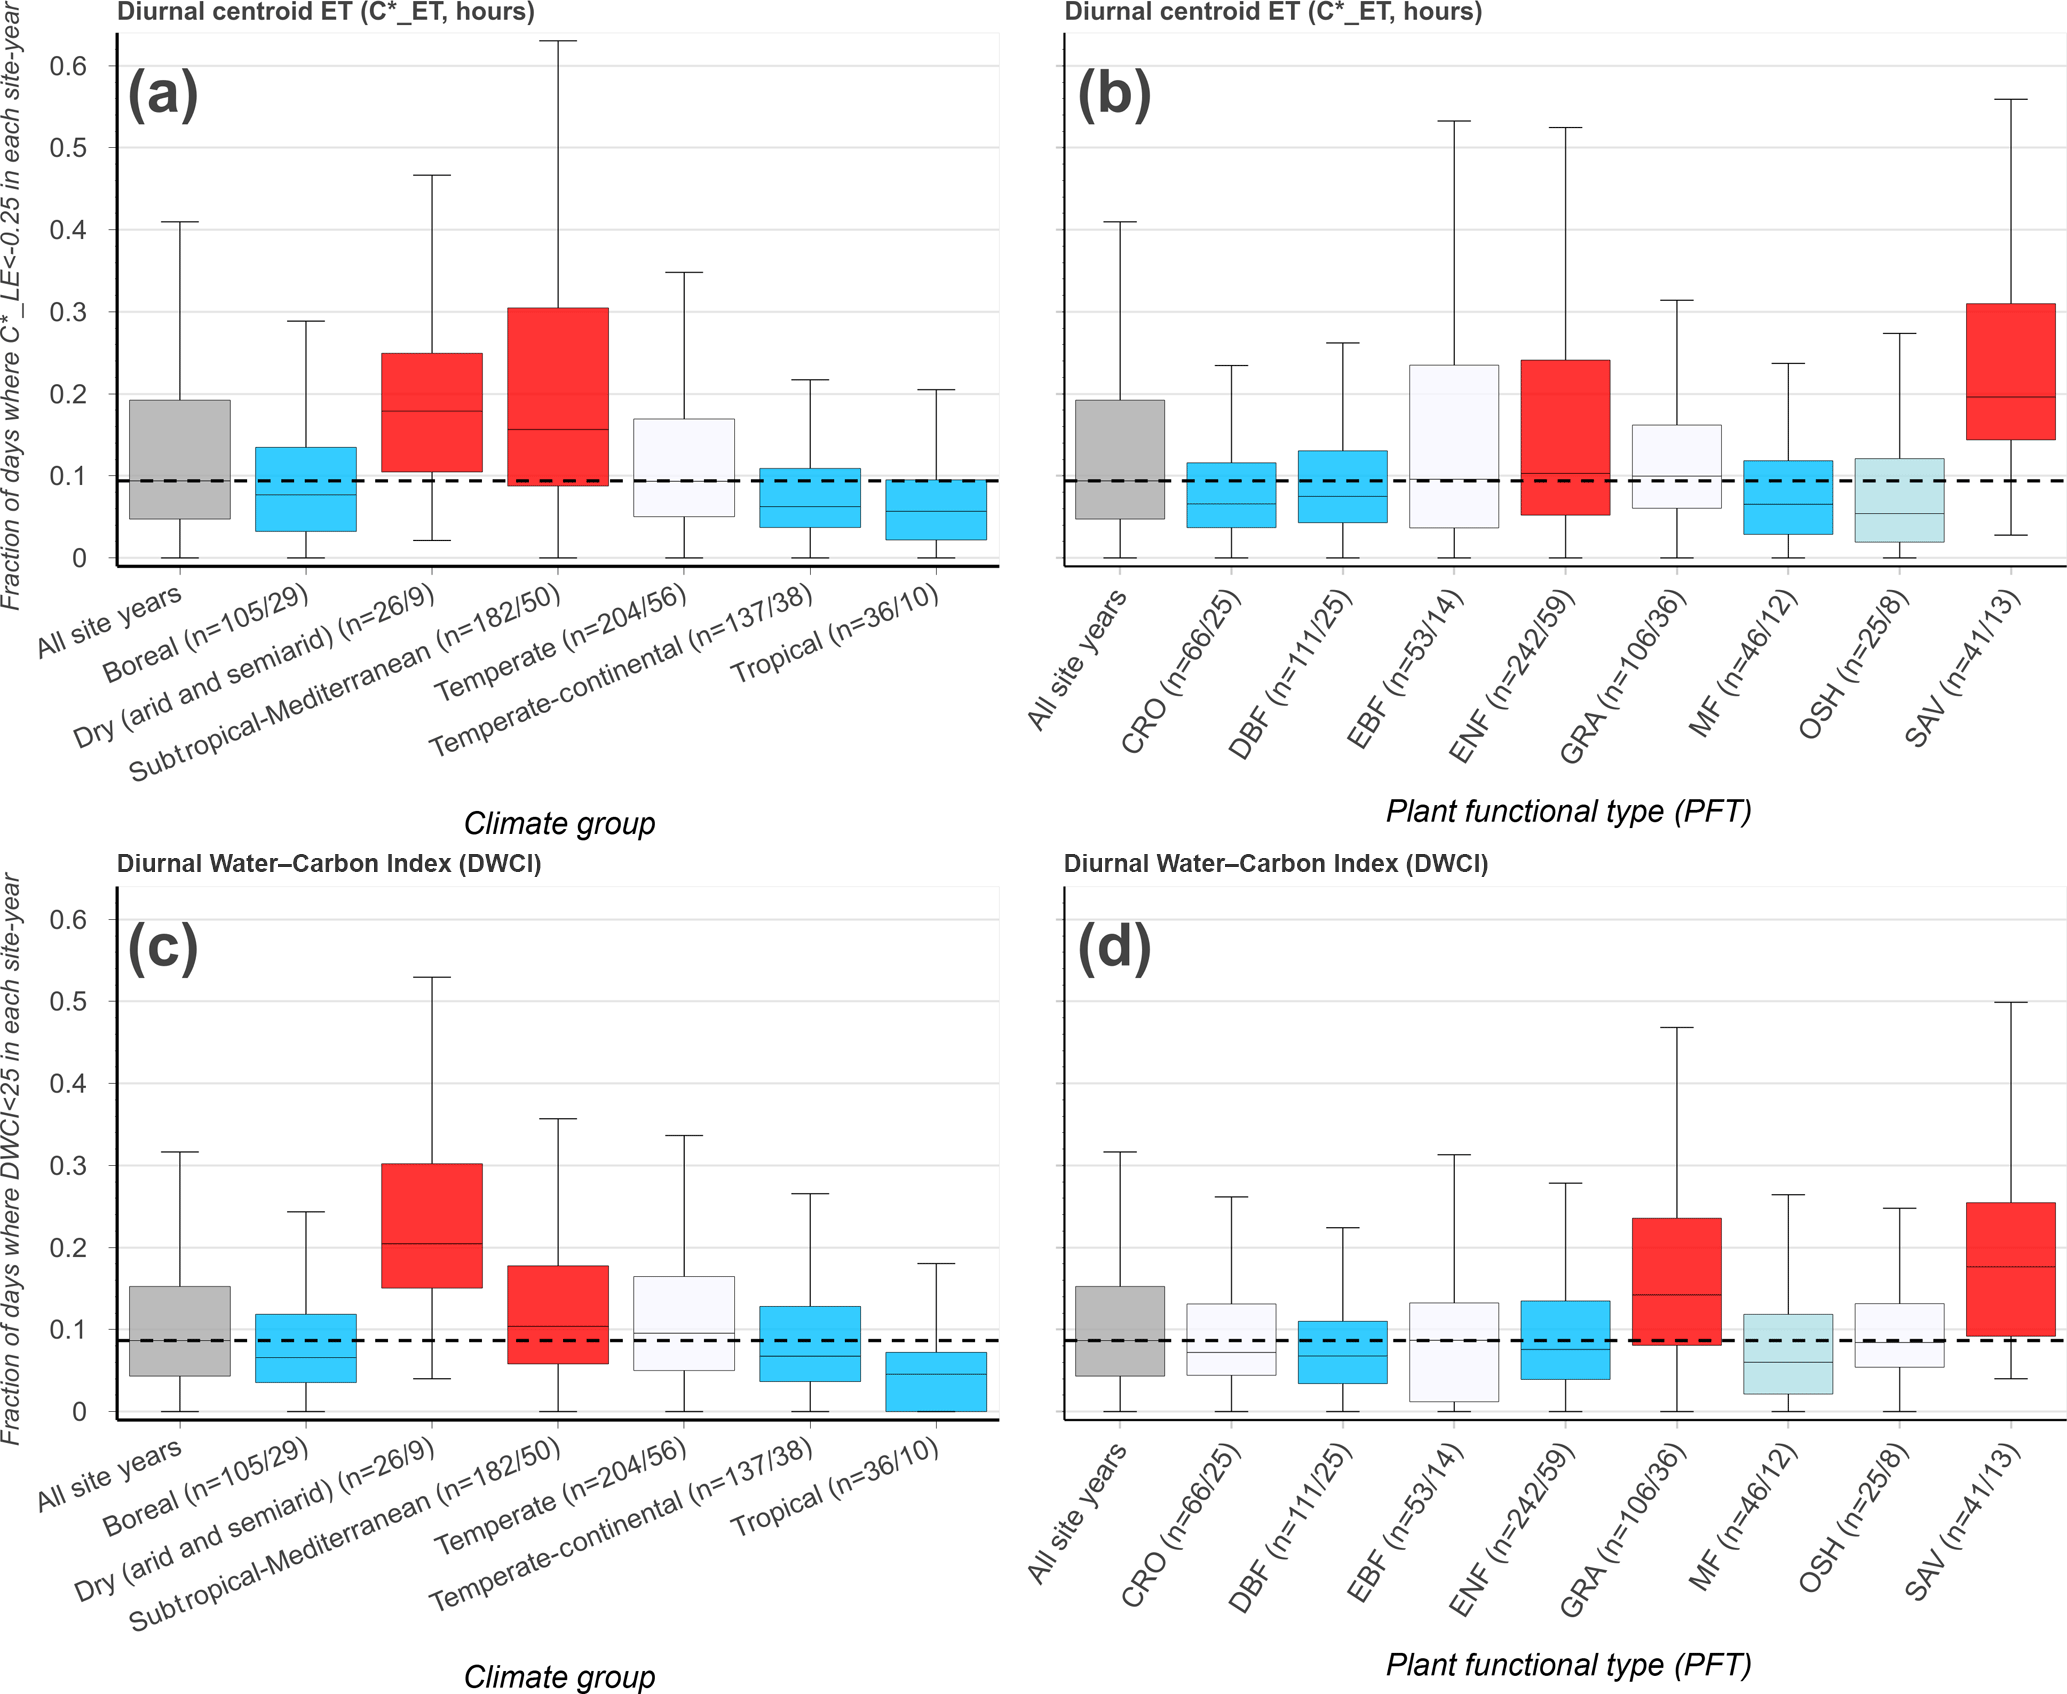
Figure 4The frequency of morning-shifted diurnal centroids ( h, a, b) and low Diurnal Water–Carbon Index (DWCI < 25, c, d) for 690 FLUXNET site years/192 sites, grouped by climate group (a, c) and plant functional type (b, d). Group labels on x axis indicate the number of site years/sites (n= site-years/sites) for each category. The dashed line is the median for all site years. Color shade indicates level of significance, with light colors and dark colors having p values < 0.10 and < 0.05, respectively (Wilcoxon–Mann–Whitney two-sample rank-sum test); red and blue colors indicate distributions higher and lower, respectively, compared to data from all sites excluding the group. Only site years with at least 20 data points and groups with more than 5 site years were included.
As a case study, and DWCI time courses for six sites from Europe are shown in Fig. 3, with an emphasis on 2003 when the continent was struck by a heat wave that was shown to effect both the carbon and water cycles (Ciais et al., 2005; Reichstein et al., 2007; Granier et al., 2007). For DWCI, forest sites showed high water–carbon coupling throughout the growing season, with the exception of Puéchabon (FR-Pue), which showed a regular seasonal cycle of decoupling. The grassland site (HU-Bg) showed a higher variability in DWCI compared to the forest sites (all others). All sites showed either a decrease in median DWCI or an increase in variability during 2003, generally in July or August, particularly at Hainich (DE-Hai), Bugacpuszta (HU-Bug), and El Saler (ES-ES1). This increase in decoupling during 2003 is consistent with the hypothesis of non-stomatal limitations being expressed in hot, dry conditions which can affect carbon fixing mechanisms. Median diurnal centroid values across all years varied in absolute magnitude but were generally near or above zero, i.e. the water cycle showed no shift or an afternoon shift. One exception would be the Mediterranean oak forest of Puéchabon, which shows a slight seasonal cycle of morning shifts going from a slight afternoon shift to a slight morning shift during June, July, and August. During drought years, sites that showed distinctive morning shifts were Puéchabon (FR-Pue), Sorø (DK-Sor), and Loobos (NL-Loo). The framework that morning shifts are associated with water stress from soil moisture depletion would be supported by the increase in morning shifts during 2003, though factors such as species composition and access to soil water would play a significant role and could account for the differences among sites. All sites had significantly different (p < 0.05, Wilcoxon rank-sum test) DWCI values between 2003 and all other years except Puéchabon, whereas with only Puéchabon, Sorø, and Loobos showed significant differences.
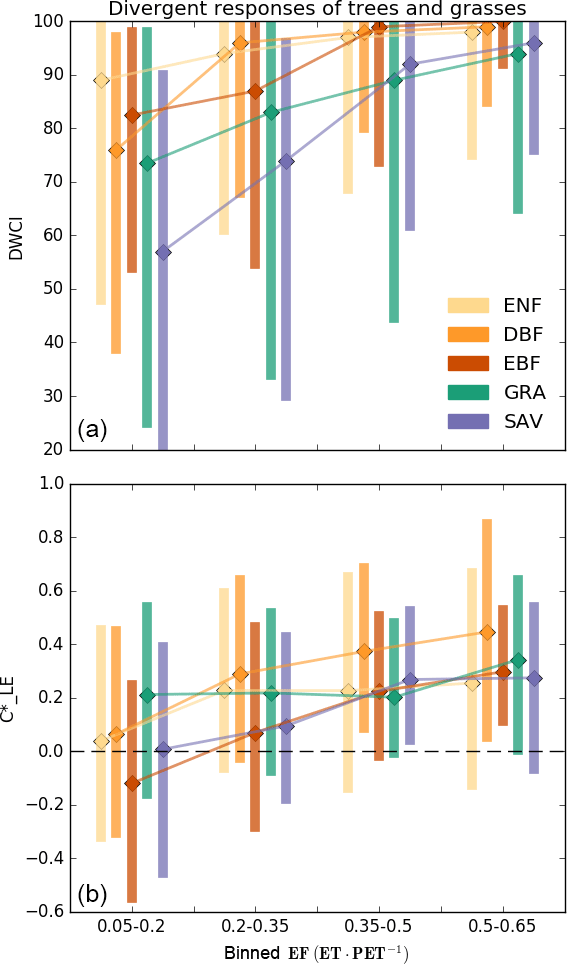
Figure 5Median Diurnal Water–Carbon Index (DWCI, a) and diurnal centroid (, b) of plant functional types binned by evaporative fraction (EF, low values indicate dry conditions). Note that DWCI of 0–100 indicates lowest–highest probability of diurnal carbon–water coupling and that of −1 to 1 indicates 1-hour morning-shifted to 1-hour afternoon-shifted ET. Evergreen needleleaf (ENF), deciduous broadleaf (DBF), and evergreen broadleaf (EBF) forests show increased morning shifts (low ) with decreasing EF when compared to grassland (GRA) sites, which tended to have decreased carbon–water decoupling (low DWCI) with decreasing EF. Savanna ecosystems (SAV) show a high degree of decoupling and intermediate levels of morning shifts. Vertical bars represent the interquartile range.
3.1 Distribution of data-driven indicators by vegetation type and climate
The frequency of low values of diurnal centroid and DWCI across climate groups and plant functional types is shown in Fig. 4. The thresholds designating decoupling and morning shifts were 25 and −0.25 for DWCI and , respectively. These thresholds were chosen to highlight frequency differences between sites and were shown to have large metric responses under dry conditions while having low frequencies under wetter conditions (see sensitivity analysis in Fig. S2). Furthermore, these thresholds result in a similar median frequency of uncoupled and morning-shifted days between all site years being 8.7 and 9.4 % of days, respectively. The similarity in median frequencies across site years allowed for easier intercomparison between the two metrics. The frequency of decoupling and morning shifts using these thresholds for each site can be found in the map found in File S1. Though there is a fairly large variance across climate groups and plant functional types, low values of both DWCI and occur at higher frequencies in savanna ecosystems and dry or Mediterranean climates. Conversely, lower frequencies of both metrics are seen in tropical, boreal, and temperate–continental climates. Strikingly, the arid and semiarid climate group seems to be associated with the majority of low DWCI occurrences, with a median frequency of about 20 % of days being uncoupled between site years. Overall, frequencies were highly variable within plant functional types. Interestingly, seems to be more variable in moderately dry ecosystems with potentially deep roots, favoring woodier savannas and evergreen needleleaf forests over grasslands and open shrublands. In contrast, DWCI shows similarly high frequencies from savannas and grasslands. The differing responses between tree- and grass-dominated ecosystems can be further seen in Fig. 5, where savanna and grassland ecosystems show a distinct decrease in DWCI under conditions of low EF, in contrast to the forested sites which show a higher degree of carbon–water coupling, though still a slight decrease. Forested ecosystems show a higher degree of morning shift under low EF conditions when compared to grasslands, with savannas being somewhere between the two.
The response of both variables to drought stress is further observed in Fig. 6, where low mean values of both DWCI and are associated with conditions of high net radiation and low latent energy, indicative of drought. As this figure includes all days from all sites which meet the filtering outlined in the “Data” subsection of the “Methods and materials” section, i.e. dry periods in the growing season, these figures exhibit the universality of the metrics across climates, ecosystems, and time periods. This pattern is much cleaner with the diurnal centroid than with DWCI, though mean values are generally above 50 for most bins, indicating that most days are well coupled. Low values of both indicators are also seen under conditions with low Rn and high latent energy (as seen by the dark streak at the top edge in Fig. 6c, e), which is generally not associated with drought stress. Further analysis showed that these points are also associated with energy balance over-closure, where the sum of latent and sensible heat is greater than net radiation (ET + H > Rn, see Fig. S2), and therefore they likely represent a data problem rather than a physiological response. Removing all days where the energy balance is over-closed did not alter the patterns associated with drought. Apart from the response to periods of high LE and low Rn, the metrics showed a diverging response when looking at EF (ET ∕ PET which is similar to LE ∕ Rn) and VPD, with DWCI showing a much stronger response to VPD and showing a much stronger response to EF (Fig. 6a, d). This difference in response would indicate that DWCI is more responsive to atmospheric demand (estimated via VPD) and is more responsive to water limitations. Both DWCI and also show a trend with low GPP, although in the case of the diurnal centroid the effect is limited to both low GPP and ET (Fig. 6c, g).

Figure 6Mean DWCI (a, b, c) and (d, e, f) with respect to evaporative fraction (EF) by vapor pressure deficit (VPD) (a, d), latent energy (LE) by Rn (b, e) and LE by GPP (c, g). Note that DWCI of 0–100 indicates lowest–highest probability of diurnal carbon–water coupling and that of −1 to 1 indicates 1-hour morning-shifted to 1-hour afternoon-shifted ET. Points with high Rn and low LE are associated with both low DWCI and , indicating that both metrics are related to water limitations. Though both metrics are associated with low EF, DWCI shows a much higher response to atmospheric demand as measured by VPD, with showing a very limited response. Both metrics, and DWCI in particular, show low values with high ET and low Rn, though these points are also associated with over-closed energy balances (LE + H > Rn). Both metrics are associated with low GPP, but the is restricted to both low GPP and ET, indicating that water and carbon can decouple over a wider range of water stress. This also holds when points with energy balance over-closed are excluded (data not shown).

Figure 7Difference in modeled and measured WUE for Katul–Zhou (a), Boese (b), and random forest (c) models. The random forest model was fit using Rg, VPD, Tair, GPP, and year. Thresholds designating dry, morning-shifted, and carbon–water uncoupled days were EF < 0.2, < −0.25, and DWCI < 25, respectively, for each day. The distributions span from the 5th to 95th percentiles, and the width of each gives an indication of the variance, which is larger in the subgroups compared to all points. Furthermore, the mean difference in WUE (black lines) tends to be shifted in dry and morning-shifted days, indicating a mean underestimation of WUE by the models mostly due to the long tails. Decoupled days show higher variance but no clear pattern in under- or overestimation. The percentage of days in each category is designated in parentheses next to the y axis label .
3.2 Difference between modeled and actual WUE
Figure 7 shows the difference between expected and observed WUE from the Katul–Zhou, Boese, and random forest (RF) models, with respect to conditions of drought as characterized by low evaporative fraction (EF < 0.2), carbon–water (C–W) decoupling (DWCI < 25), and morning shifts ( < −0.25). This exercise was designed to test whether the metrics were associated with bias in the models, indicating that the metrics are able to capture information that the models are not (as further outlined in the “Methods and materials” subsection entitled “Models and parameter estimation”). For all models, the dry days show the largest average shift between expected and observed WUE, followed by morning-shifted days. Uncoupled days show the smallest shifts for all models, with an overestimation of WUE for the Katul–Zhou and Boese models and no significant shift of WUE with the random forest model. As all models were calibrated within a site year, the over- or underestimation of WUE indicate an inability of the model to capture a change in the system. Cases of mean misestimation tended to be influenced by long tails in the distribution, with median differences being less exaggerated. However, these long tails are indicative of major model error in periods where the ecosystem is likely under stress conditions.
4.1 Looking beyond sums and means
The proposed metrics – DWCI and – depart from more traditional methods to summarize from sub-daily to daily timescales such as sums and means. This departure is advantageous in that it extracts added information that may otherwise have been ignored by turning the focus from signal amplitude to the signal shape. However, these new metrics also come with their own set of caveats, most notably issues with data quality confounding interpretability. Both metrics are susceptible to noise, as one or two errant points within a day can be reflected as a decrease in correlation or a shift in diurnal centroid. This is evident from the existence of very afternoon-shifted , sometimes by more than an hour, which the authors have no proposed explanation for other than noise in the data. However, attributing highly afternoon-shifted points to poor data requires further investigation. Note here that the “resting” seems to be slightly afternoon-shifted, which could be caused by real physiological factors such as differences in the incoming shortwave (SW) radiation (Rg) used in the calculation and net radiation (Rn), higher atmospherics demand (VPD) in the afternoon driving higher ET, or increased convection throughout the day resulting in higher transport of water away from the canopy and is likely a combination of all three. Differences in resting between sites could also be from instrumental causes such as radiometric sensors which are not adequately leveled or dirty, though the consistent, slight afternoon shifts would suggest this is a real response. Despite the possible shortcomings, both metrics show a definite response to drought conditions across the broad array of sites, climates, and ecosystems contained in FLUXNET (see Fig. 6) and give valuable insight into the underlying physiology. Given the broad nature of the analysis here, the metrics and hypothesis presented would benefit from site-specific validations such as looking to see if the morning shifts and decoupling are indeed associated with lower soil moisture levels, leaf water potentials, and/or decreases in sap flux. Sap flux in particular could give some interesting insights, as the diurnal patters in sap flux velocity will also have an offset to incoming radiation related to tree capacitance; therefore, relating sap flow diurnal centroids to the ET diurnal centroid could give some information on changes in plant water recharge. Furthermore, the diurnal centroid base metrics complement the hysteresis quantification methods such as those employed by Zhou et al. (2014) and Matheny et al. (2014), with the advantage of being compensated for by cloudy conditions and possibly comparatively less influence of noise, though an intercomparison would be useful to explore the strengths and weaknesses of the different approaches. By providing both the equations and related code of the metrics, we hope the metrics will be used by the community for both validation and to further ecophysiological understanding.
4.2 Trees, grass, and drought stress
By comparing climate groups and plant functional types (PFTs) with the frequent occurrence of low DWCI and from Fig. 4, we can note two striking differences: evergreen broad- and needleleaf forests show high variability in morning-shifted days but not uncoupled days, whereas grasslands show significantly high uncoupled but not morning-shifted days. The pattern is further seen in Fig. 5, which shows the distinct divergent responses of decoupling and morning shifts between tree- and grass-dominated systems. This disparity may indicate an interaction of not only with drought but hydraulic sensitivity. The association of morning shifts with hydraulic sensitivity is further strengthened by Fig. 6a, d, where shows a much stronger response to EF rather than VPD, indicating that morning shifts of ET are not simply due to stomatal closure due to VPD but are in fact a response to drought conditions. The shorter hydraulic system of grasses may not necessitate stomatal closure under high demands (Holloway-Phillips and Brodribb, 2011), thus causing less frequent phase shifts even under drought conditions. In contrast, tree ecosystems may only exhibit higher hydraulic stresses, associated with both dryness and a more sensitive hydraulic strategy. Temperate–continental and tropical climates all showed a low frequency of morning-shifted days, even though they are occupied by large trees with cavitation-susceptible vascular systems (Konings and Gentine, 2016), suggesting that these ecosystems show limited drought stress even with the hydraulic susceptibility. Similarly, the high degree of variability in morning-shifted frequency between site years in subtropical/Mediterranean and evergreen broad- and needleleaf forests could either indicate variation in the response in hydraulic stress between sites or that hydraulic stress is only expressed some years, leading to high and low frequencies within the same site.
In this way, it seems that though is less noisy as a drought indicator (see Fig. 6), it may only be of use in tree systems that are more prone to hydraulic stress. However, this does put the metric in a rather unique position in that it could be used as a global-scale hydraulic indicator, having potential application in exploring ecosystem-level isohydricity (Martínez-Vilalta and Garcia-Forner, 2016) or the degree to which continuing to extract water risks vascular system damage. Isohydricity is intrinsically a concept that relates to an individual plant, as dynamics of rooting depth, hydraulic conductances, and sensitivities to VPD can vary within individuals of the same species at the same location. However, these factors are all interrelated, as hydraulic and stomatal conductances drive transpiration dynamics which control the rate of depletion of root zone water which can then feed back to stomatal sensitivity, such as via the plant hormone abscisic acid (ABA) signaling (Wilkinson and Davies, 2002). As such, current estimates of isohydricity require plant-level measurements, which are currently restrained to the individual scale, i.e. from actual leaf measurements (Martínez-Vilalta et al., 2014), or to a global scale, but only 0.5∘ resolution estimates from radar (Konings and Gentine, 2016). This limitation of large and small scales leaves a knowledge gap the size of an eddy covariance footprint, hindering the study of ecosystem response to drought. However, under the assumption that the morning shifts seen under low evaporative fraction are related to increased stomatal sensitivity in response to root zone moisture depletion, it may be possible to compare the onset and speed with which the diurnal centroid shifts toward the mornings as ecosystems dry. In this way, one could infer the ecosystem response to soil moisture, without explicitly knowing the soil moisture. The resulting relationship could prove useful as a data-derived ecosystem functional property, giving direct information on variations in water limitation response.
4.3 C–W decoupling and energy balance closure
In addition to error from single data points, both metrics, but especially the DWCI, show some relationship with energy balance over-closure. Energy balance mismatch is a common phenomenon in EC measurements, with under-closure (ET + H < Rn) being a more common concern (Leuning et al., 2012; Wilson et al., 2002). Issues with energy balance closure can be, among other causes, attributed to advection, where energy, water, and carbon are transported in and out of the tower footprint, complicating an absolute accounting of these quantities (Wilson et al., 2003; Barr et al., 2006; Brötz et al., 2014). The apparent association of DWCI and over-closure could be due to the transfer of moist air from the surrounding landscape, causing the DWCI to be more contingent on the mixing of source air and less on plant controls. In this scheme, the over-closure seen in Fig. 6 could be caused by the mixing of outside moist air into the drier air from the EC site, causing an increase in latent energy. However, the infiltrating air sources could also have similar or drier moisture levels which would not necessarily be seen as over-closure. In this scenario, this infiltrating air could contain varying carbon and water concentrations, again causing a carbon–water decoupling but one that would not be associated with over-closure. If this effect has no diurnal pattern and thus does not generally influence the mean diurnal centroid in ET, it could explain why the patterns with dryness are much clearer with compared to DWCI. This would have the implication that DWCI is then a mixture of advection and non-stomatal signals, complicating the biological interpretability. However, the association with dryness in both metrics gives credence that they do indeed reflect some physiology, if we assume energy balance closure (EBC) should not be influenced by dryness level. Furthermore, if potential stress conditions are removed, the DWCI could be useful as a metric of advection in the system, even when the energy balance is relatively well closed.
4.4 WUE shifts associated with metrics and not captured by models
Figure 7 demonstrates the strong tendency of the models to underestimation WUE in dry conditions. This is true even for the fully nonlinear and empirical random forest model, indicating that the model underperformance is not necessarily due to an incomplete model framework but due to a lack of information to constrain the problem. Given the association of both metrics with drought (Fig. 6), one could expect that the models would underestimate WUE in uncoupled and morning-shifted days. Though this is the case with morning-shifted days, decoupling shows no underestimations of WUE and even shows a mean overestimation in the case of the Katul–Zhou and Boese models. Given the limitations outlined in the previous sections, one could blame noise for the lack of the WUE shift, but this cannot be reconciled with the higher frequency of decoupling during dry days, which should bias the WUE estimates. Furthermore, the more empirical random forest model reduces the prediction variability, leaving a slight WUE underestimation and indicating that some of the overestimation from the Katul–Zhou and Boese models may be tied to limitations of the underlying assumptions; yet the distribution from the RF model still lacks the long tails of underestimation characteristic of the dry points. Extending these findings to the underlying hypotheses of the metrics, namely hydraulic and non-stomatal limitations, we could conclude that the hydraulic controls do impose a greater water use advantage than non-stomatal limitations. In other words, the findings suggest that days with water–carbon decoupling, and possibly non-stomatal limitations, do not improve WUE, whereas hydraulic responses can improve WUE. As WUE is a ratio, this does not shed any light on the change in productivity, as low values of WUE may indicate that a plant is still productive but at a higher water cost. However, solid conclusions would require further analysis with some site-specific measurements of actual plant function.
Though the models used here are relatively simple and lack the complexities and feedbacks found in more vigorous ecosystem models, Matheny et al. (2014) also demonstrated the fundamental inability of nine different land surface models with four different stomatal conductance schemes to capture diurnal variability which the authors attributed to inadequate representation of how water gets from the soil to the leaf. Given the demonstrated phenomenon of morning shifts and decoupling across sites under dry conditions, the metrics here provide a benchmarking tool for mechanistic models to test their ability to replicate these patterns, suggesting that the models are capable of expressing hydraulic and non-stomatal limitations. Furthermore, in the case of machine learning approaches, the metrics may provide a useful input parameter which summarizes these diurnal effects, as is evidenced by the difference in response the bias in RF modeled WUE; i.e. while both metrics are associated with low EF, RF WUE was underestimated with morning-shifted days but not decoupled days, implying that two different strategies are being captured by the metrics. As such, by demonstrating the utility of the metrics and providing code and explanations for calculation, we hope they will become useful to the community at large.
Both the DWCI and the demonstrate an ability to show consistent patterns with drought across a broad array of sites, climates, and ecosystems, with the added advantage of being tied to theoretical underpinnings. In particular, the demonstrated patterns give novel information about carbon–water relations and hydrological dynamics that are not currently present at the ecosystem scale across a database as large as FLUXNET. These metrics and their underlying theory provide a data-derived example differentiating the hydrological response of tree and grass plant functional types as well as constituting evidence for the presence and absence of a WUE advantage from hydraulic and stomatal limitations, respectively. Going forward, these metrics can be used as a tool to further understand the diversity of ecosystem drought responses.
Code used to calculate the metrics described here can be found both in the Supplement as well as in Nelson (2017). Data used in this analysis can be found at http://fluxnet.fluxdata.org/ (NOA, 2015).
The supplement related to this article is available online at: https://doi.org/10.5194/bg-15-2433-2018-supplement.
The authors declare that they have no conflict of interest.
This work used eddy covariance data acquired by the FLUXNET community and in
particular by the following networks: AmeriFlux (US Department of Energy,
Biological and Environmental Research, Terrestrial Carbon Program
(DE-FG02-04ER63917 and DE-FG02-04ER63911)), AfriFlux, AsiaFlux, CarboAfrica,
CarboEuropeIP, CarboItaly, CarboMont, ChinaFlux, FluxnetCanada (supported
by CFCAS, NSERC, BIOCAP, Environment Canada, and NRCan), GreenGrass, KoFlux,
LBA, NECC, OzFlux, TCOS-Siberia, and USCCC. We acknowledge the financial
support to the eddy covariance data harmonization provided by CarboEuropeIP,
FAO-GTOS-TCO, iLEAPS, the Max Planck Institute for Biogeochemistry, the National
Science Foundation, the University of Tuscia, Université Laval and Environment
Canada, and the US Department of Energy and the database development and technical
support from Berkeley Water Center, Lawrence Berkeley National Laboratory,
Microsoft Research eScience, Oak Ridge National Laboratory, the University of
California-Berkeley, and the University of Virginia.
The article processing charges for this open-access
publication were covered by the Max Planck Society.
Edited by: Trevor Keenan
Reviewed by: Martin De Kauwe and two anonymous referees
Barr, A. G., Morgenstern, K., Black, T. A., McCaughey, J. H., and Nesic, Z.: Surface energy balance closure by the eddy-covariance method above three boreal forest stands and implications for the measurement of the CO2 flux, Agr. Forest Meteorol., 140, 322–337, https://doi.org/10.1016/j.agrformet.2006.08.007, 2006. a
Beer, C., Ciais, P., Reichstein, M., Baldocchi, D., Law, B. E., Papale, D., Soussana, J.-F., Ammann, C., Buchmann, N., Frank, D., Gianelle, D., Janssens, I. A., Knohl, A., Köstner, B., Moors, E., Roupsard, O., Verbeeck, H., Vesala, T., Williams, C. A., and Wohlfahrt, G.: Temporal and among-site variability of inherent water use efficiency at the ecosystem level: VARIABILITY OF INHERENT WUE, Global Biogeochem. Cy., 23, GB2018, https://doi.org/10.1029/2008GB003233, 2009. a
Boese, S., Jung, M., Carvalhais, N., and Reichstein, M.: The importance of radiation for semiempirical water-use efficiency models, Biogeosciences, 14, 3015–3026, https://doi.org/10.5194/bg-14-3015-2017, 2017. a, b
Breiman, L.: Random forests, Mach. Learn., 45, 5–32, 2001. a
Brötz, B., Eigenmann, R., Dörnbrack, A., Foken, T., and Wirth, V.: Early-Morning Flow Transition in a Valley in Low-Mountain Terrain Under Clear-Sky Conditions, Bound.-Lay. Meteorol., 152, 45–63, https://doi.org/10.1007/s10546-014-9921-7, 2014. a
Ciais, P., Reichstein, M., Viovy, N., Granier, A., Ogée, J., Allard, V., Aubinet, M., Buchmann, N., Bernhofer, C., Carrara, A., Chevallier, F., De Noblet, N., Friend, A. D., Friedlingstein, P., Grünwald, T., Heinesch, B., Keronen, P., Knohl, A., Krinner, G., Loustau, D., Manca, G., Matteucci, G., Miglietta, F., Ourcival, J. M., Papale, D., Pilegaard, K., Rambal, S., Seufert, G., Soussana, J. F., Sanz, M. J., Schulze, E. D., Vesala, T., and Valentini, R.: Europe-wide reduction in primary productivity caused by the heat and drought in 2003, Nature, 437, 529–533, https://doi.org/10.1038/nature03972, 2005. a
Damour, G., Simonneau, T., Cochard, H., and Urban, L.: An overview of models of stomatal conductance at the leaf level: Models of stomatal conductance, Plant, Cell Environ., 33, 1419–1438, https://doi.org/10.1111/j.1365-3040.2010.02181.x, 2010. a
De Kauwe, M. G., Zhou, S.-X., Medlyn, B. E., Pitman, A. J., Wang, Y.-P., Duursma, R. A., and Prentice, I. C.: Do land surface models need to include differential plant species responses to drought? Examining model predictions across a mesic-xeric gradient in Europe, Biogeosciences, 12, 7503–7518, https://doi.org/10.5194/bg-12-7503-2015, 2015. a, b
Dietze, M. C., Serbin, S. P., Davidson, C., Desai, A. R., Feng, X., Kelly, R., Kooper, R., LeBauer, D., Mantooth, J., McHenry, K., and Wang, D.: A quantitative assessment of a terrestrial biosphere model's data needs across North American biomes: PEcAn/ED model-data uncertainty analysis, J. Geophys. Res.-Biogeo., 119, 286–300, https://doi.org/10.1002/2013JG002392, 2014. a, b, c
Egea, G., Verhoef, A., and Vidale, P. L.: Towards an improved and more flexible representation of water stress in coupled photosynthesis–stomatal conductance models, Agr. Forest Meteorol., 151, 1370–1384, https://doi.org/10.1016/j.agrformet.2011.05.019, 2011. a
Flexas, J., Barbour, M. M., Brendel, O., Cabrera, H. M., Carriquí, M., Díaz-Espejo, A., Douthe, C., Dreyer, E., Ferrio, J. P., Gago, J., Gallé, A., Galmés, J., Kodama, N., Medrano, H., Niinemets, Ü., Peguero-Pina, J. J., Pou, A., Ribas-Carbó, M., Tomás, M., Tosens, T., and Warren, C. R.: Mesophyll diffusion conductance to CO2: An unappreciated central player in photosynthesis, Plant Science, 193/194, 70–84, https://doi.org/10.1016/j.plantsci.2012.05.009, 2012. a, b
Granier, A., Reichstein, M., Bréda, N., Janssens, I.A., Falge, E., Ciais, P., Grünwald, T., Aubinet, M., Berbigier, P., Bernhofer, C., Buchmann, N., Facini, O., Grassi, G., Heinesch, B., Ilvesniemi, H., Keronen, P., Knohl, A., Köstner, B., Lagergren, F., Lindroth, A., Longdoz, B., Loustau, D., Mateus, J., Montagnani, L., Nys, C., Moors, E., Papale, D., Peiffer, M., Pilegaard, K., Pita, G., Pumpanen, J., Rambal, S., Rebmann, C., Rodrigues, A., Seufert, G., Tenhunen, J., Vesala, T., and Wang, Q.: Evidence for soil water control on carbon and water dynamics in European forests during the extremely dry year: 2003, Agr. Forest Meteorol., 143, 123–145, https://doi.org/10.1016/j.agrformet.2006.12.004, 2007. a
Holloway-Phillips, M.-M. and Brodribb, T. J.: Minimum hydraulic safety leads to maximum water-use efficiency in a forage grass: Minimum hydraulic safety, maximum water-use efficiency, Plant Cell Environ., 34, 302–313, https://doi.org/10.1111/j.1365-3040.2010.02244.x, 2011. a
Ito, A. and Inatomi, M.: Water-Use Efficiency of the Terrestrial Biosphere: A Model Analysis Focusing on Interactions between the Global Carbon and Water Cycles, J. Hydrometeorol., 13, 681–694, https://doi.org/10.1175/JHM-D-10-05034.1, 2012. a
Katul, G., Manzoni, S., Palmroth, S., and Oren, R.: A stomatal optimization theory to describe the effects of atmospheric CO2 on leaf photosynthesis and transpiration, Ann. Bot.-London, 105, 431–442, https://doi.org/10.1093/aob/mcp292, 2010. a, b, c
Katul, G. G., Palmroth, S., and Oren, R.: Leaf stomatal responses to vapour pressure deficit under current and CO2-enriched atmosphere explained by the economics of gas exchange, Plant Cell Environ., 32, 968–979, https://doi.org/10.1111/j.1365-3040.2009.01977.x, 2009. a, b, c
, Keenan, T. F., Hollinger, D. Y., Bohrer, G., Dragoni, D., Munger, J. W., Schmid, H. P., and Richardson, A. D.: Increase in forest water-use efficiency as atmospheric carbon dioxide concentrations rise, Nature, 499, 7458, https://doi.org/10.1038/nature12291, 2013. a, b, c
Knauer, J., Werner, C., and Zaehle, S.: Evaluating stomatal models and their atmospheric drought response in a land surface scheme: A multibiome analysis: Multibiome Stomatal Model Evaluation, J. Geophys. Res.-Biogeo., 120, 1894–1911, https://doi.org/10.1002/2015JG003114, 2015. a
Koenker, R. and Bassett Jr., G.: Regression quantiles, Econometrica, Journal of the Econometric Society, 46, 33–50, https://doi.org/10.2307/1913643, 1978. a
Konings, A. G. and Gentine, P.: Global variations in ecosystem-scale isohydricity, Glob. Change Biol., 23, 891–905, https://doi.org/10.1111/gcb.13389, 2016. a, b
Kuglitsch, F. G., Reichstein, M., Beer, C., Carrara, A., Ceulemans, R., Granier, A., Janssens, I. A., Koestner, B., Lindroth, A., Loustau, D., Matteucci, G., Montagnani, L., Moors, E. J., Papale, D., Pilegaard, K., Rambal, S., Rebmann, C., Schulze, E. D., Seufert, G., Verbeeck, H., Vesala, T., Aubinet, M., Bernhofer, C., Foken, T., Grünwald, T., Heinesch, B., Kutsch, W., Laurila, T., Longdoz, B., Miglietta, F., Sanz, M. J., and Valentini, R.: Characterisation of ecosystem water-use efficiency of european forests from eddy covariance measurements, Biogeosciences Discuss., 5, 4481–4519, https://doi.org/10.5194/bgd-5-4481-2008, 2008. a
Lawlor, D. W. and Tezara, W.: Causes of decreased photosynthetic rate and metabolic capacity in water-deficient leaf cells: a critical evaluation of mechanisms and integration of processes, Ann. Bot.-London, 103, 561–579, https://doi.org/10.1093/aob/mcn244, 2008. a
Leuning, R., van Gorsel, E., Massman, W. J., and Isaac, P. R.: Reflections on the surface energy imbalance problem, Agr. Forest Meteorol., 156, 65–74, https://doi.org/10.1016/j.agrformet.2011.12.002, 2012. a
Manzoni, S.: Integrating plant hydraulics and gas exchange along the drought-response trait spectrum, Tree Physiol., 34, 1031–1034, https://doi.org/10.1093/treephys/tpu088, 2014. a
Manzoni, S., Vico, G., Palmroth, S., Porporato, A., and Katul, G.: Optimization of stomatal conductance for maximum carbon gain under dynamic soil moisture, Adv. Water. Resour., 62, 90–105, https://doi.org/10.1016/j.advwatres.2013.09.020, 2013. a
Martínez-Vilalta, J. and Garcia-Forner, N.: Water potential regulation, stomatal behaviour and hydraulic transport under drought: deconstructing the iso/anisohydric concept: Deconstructing the iso/anisohydric concept, Plant Cell Environ., 40, 962–976, https://doi.org/10.1111/pce.12846, 2016. a
Martínez-Vilalta, J., Poyatos, R., Aguadé, D., Retana, J., and Mencuccini, M.: A new look at water transport regulation in plants, New Phytol., 204, 105–115, https://doi.org/10.1111/nph.12912, 2014. a
Matheny, A. M., Bohrer, G., Stoy, P. C., Baker, I. T., Black, A. T., Desai, A. R., Dietze, M. C., Gough, C. M., Ivanov, V. Y., Jassal, R. S., Novick, K. A., Schäfer, K. V. R., and Verbeeck, H.: Characterizing the diurnal patterns of errors in the prediction of evapotranspiration by several land-surface models: An NACP analysis: Error patterns in modeled transpiration, J. Geophys. Res.-Biogeo., 119, 1458–1473, https://doi.org/10.1002/2014JG002623, 2014. a, b, c
Medlyn, B. E., Dreyer, E., Ellsworth, D., Forstreuter, M., Harley, P. C., Kirschbaum, M. U. F., Le Roux, X., Montpied, P., Strassemeyer, J., and Walcroft, A.: Temperature response of parameters of a biochemically based model of photosynthesis. II. A review of experimental data, Plant Cell Environ., 25, 1167–1179, 2002. a
Medlyn, B. E., De Kauwe, M. G., Lin, Y.-S., Knauer, J., Duursma, R. A., Williams, C. A., Arneth, A., Clement, R., Isaac, P., Limousin, J.-M., Linderson, M.-L., Meir, P., Martin-StPaul, N., and Wingate, L.: How do leaf and ecosystem measures of water-use efficiency compare?, New Phytol., 216, 758–770, https://doi.org/10.1111/nph.14626, 2017. a
Migliavacca, M., Meroni, M., Manca, G., Matteucci, G., Montagnani, L., Grassi, G., Zenone, T., Teobaldelli, M., Goded, I., Colombo, R., and Seufert, G.: Seasonal and interannual patterns of carbon and water fluxes of a poplar plantation under peculiar eco-climatic conditions, Agr. Forest Meteorol., 149, 1460–1476, https://doi.org/10.1016/j.agrformet.2009.04.003, 2009. a
Nelson, J. A.: Jnelson18/Fluxnettools: Initial Release, https://doi.org/10.5281/zenodo.1010483, 2017. a, b, c, d
NOA: FLUXNET Data Download, available at: http://www.fluxdata.org/DataDownload/default.aspx (last access: 17 February 2015), 2007. a
NOA: FLUXNET, available at: http://fluxnet.fluxdata.org/, last access: 17 February 2015. a
Novick, K. A., Miniat, C. F., and Vose, J. M.: Drought limitations to leaf-level gas exchange: results from a model linking stomatal optimization and cohesion-tension theory: Drought limitations to gas exchange, Plant Cell Environ., 39, 583–596, https://doi.org/10.1111/pce.12657, 2016. a
Palmroth, S., Katul, G. G., Maier, C. A., Ward, E., Manzoni, S., and Vico, G.: On the complementary relationship between marginal nitrogen and water-use efficiencies among Pinus taeda leaves grown under ambient and CO2-enriched environments, Ann. Bot., 111, 467–477, https://doi.org/10.1093/aob/mcs268, 2013. a
Papale, D., Reichstein, M., Aubinet, M., Canfora, E., Bernhofer, C., Kutsch, W., Longdoz, B., Rambal, S., Valentini, R., Vesala, T., and Yakir, D.: Towards a standardized processing of Net Ecosystem Exchange measured with eddy covariance technique: algorithms and uncertainty estimation, Biogeosciences, 3, 571–583, https://doi.org/10.5194/bg-3-571-2006, 2006. a
Pedregosa, F., Varoquaux, G., Gramfort, A., Michel, V., Thirion, B., Grisel, O., Blondel, M., Prettenhofer, P., Weiss, R., Dubourg, V., et al.: Scikit-learn: Machine learning in Python, J. Mach. Learn. Res., 12, 2825–2830, 2011. a
Priestley, C. H. B. and Taylor, R. J.: On the assessment of surface heat flux and evaporation using large-scale parameters, Mon. Weather Rev., 100, 81–92, 1972. a, b
Reichstein, M.: Inverse modeling of seasonal drought effects on canopy CO2 ∕ H2O exchange in three Mediterranean ecosystems, J. Geophys. Res., 108, 4726, https://doi.org/10.1029/2003JD003430, 2003. a
Reichstein, M., Tenhunen, J. D., Roupsard, O., Ourcival, J.-M., Rambal, S., Miglietta, F., Peressotti, A., Pecchiari, M., Tirone, G., and Valentini, R.: Severe drought effects on ecosystem CO2 and H2O fluxes at three Mediterranean evergreen sites: revision of current hypotheses?, Glob. Change Biol., 8, 999–1017, https://doi.org/10.1046/j.1365-2486.2002.00530.x, 2002. a
Reichstein, M., Falge, E., Baldocchi, D., Papale, D., Aubinet, M., Berbigier, P., Bernhofer, C., Buchmann, N., Gilmanov, T., Granier, A., Grunwald, T., Havrankova, K., Ilvesniemi, H., Janous, D., Knohl, A., Laurila, T., Lohila, A., Loustau, D., Matteucci, G., Meyers, T., Miglietta, F., Ourcival, J.-M., Pumpanen, J., Rambal, S., Rotenberg, E., Sanz, M., Tenhunen, J., Seufert, G., Vaccari, F., Vesala, T., Yakir, D., and Valentini, R.: On the separation of net ecosystem exchange into assimilation and ecosystem respiration: review and improved algorithm, Glob. Change Biol., 11, 1424–1439, https://doi.org/10.1111/j.1365-2486.2005.001002.x, 2005. a, b
Reichstein, M., Ciais, P., Papale, D., Valentini, R., Running, S., Viovy, N., Cramer, W., Granier, A., OgéE, J., Allard, V., Aubinet, M., Bernhofer, C., Buchmann, N., Carrara, A., GrüNwald, T., Heimann, M., Heinesch, B., Knohl, A., Kutsch, W., Loustau, D., Manca, G., Matteucci, G., Miglietta, F., Ourcival, J. M., Pilegaard, K., Pumpanen, J., Rambal, S., Schaphoff, S., Seufert, G., Soussana, J.-F., Sanz, M.-J., Vesala, T., and Zhao, M.: Reduction of ecosystem productivity and respiration during the European summer 2003 climate anomaly: a joint flux tower, remote sensing and modelling analysis, Glob. Change Biol., 13, 634–651, https://doi.org/10.1111/j.1365-2486.2006.01224.x, 2007. a
Reth, S., Reichstein, M., and Falge, E.: The effect of soil water content, soil temperature, soil pH-value and the root mass on soil CO2 efflux – A modified model, Plant Soil, 268, 21–33, https://doi.org/10.1007/s11104-005-0175-5, 2005. a
Rogers, A., Medlyn, B. E., Dukes, J. S., Bonan, G., Caemmerer, S., Dietze, M. C., Kattge, J., Leakey, A. D., Mercado, L. M., Niinemets, Ü., and Prentice, I. C.: A roadmap for improving the representation of photosynthesis in Earth system models, New Phytol., 213, 22–42, 2017. a, b
Rousseeuw, P. J.: Regression techniques with high breakdown point, Institute of Mathematical Statistics Bulletin, 12, 155 pp., 1983. a
Schlesinger, W. H. and Jasechko, S.: Transpiration in the global water cycle, Agr. Forest Meteorol., 189–190, 115–117, https://doi.org/10.1016/j.agrformet.2014.01.011, 2014. a
Tang, X., Li, H., Desai, A. R., Nagy, Z., Luo, J., Kolb, T. E., Olioso, A., Xu, X., Yao, L., Kutsch, W., Pilegaard, K., Köstner, B., and Ammann, C.: How is water-use efficiency of terrestrial ecosystems distributed and changing on Earth?, Sci. Rep., 4, 7483, https://doi.org/10.1038/srep07483, 2014. a, b
Tyree, M. T. and Sperry, J. S.: Do woody plants operate near the point of catastrophic xylem dysfunction caused by dynamic water stress? Answers from a model, Plant Physiol., 88, 574–580, 1988. a
Wilkinson, S. and Davies, W. J.: ABA-based chemical signalling: the co-ordination of responses to stress in plants, Plant Cell Environ., 25, 195–210, https://doi.org/10.1046/j.0016-8025.2001.00824.x, 2002. a
Wilson, K., Goldstein, A., Falge, E., Aubinet, M., Baldocchi, D., Berbigier, P., Bernhofer, C., Ceulemans, R., Dolman, H., Field, C., Grelle, A., Ibrom, A., Law, B. E., Kowalski, A., Meyers, T., Moncrieff, J., Monson, R., Oechel, W., Tenhunen, J., Valentini, R., and Verma, S.: Energy balance closure at FLUXNET sites, Agr. Forest Meteorol., 113, 223–243, 2002. a
Wilson, K. B., Baldocchi, D., Falge, E., Aubinet, M., Berbigier, P., Bernhofer, C., Dolman, H., Field, C., Goldstein, A., Granier, A., Hollinger, D., Katul, G., Law, B. E., Meyers, T., Moncrieff, J., Monson, R., Tenhunen, J., Valentini, R., Verma, S., and Wofsy, S.: Diurnal centroid of ecosystem energy and carbon fluxes at FLUXNET sites: Diurnal Energy Fluxes At Fluxnet Sites, J. Geophys. Res.-Atmos., 108, 4664, https://doi.org/10.1029/2001JD001349, 2003. a, b, c
Zhou, S., Duursma, R. A., Medlyn, B. E., Kelly, J. W. G., and Prentice, I. C.: How should we model plant responses to drought? An analysis of stomatal and non-stomatal responses to water stress, Agr. Forest Meteorol., 182–183, 204–214, https://doi.org/10.1016/j.agrformet.2013.05.009, 2013. a, b
Zhou, S., Yu, B., Huang, Y., and Wang, G.: The effect of vapor pressure deficit on water use efficiency at the subdaily time scale: Underlying water use efficiency, Geophys. Res. Lett., 41, 5005–5013, https://doi.org/10.1002/2014GL060741, 2014. a, b, c
Zhou, S., Yu, B., Huang, Y., and Wang, G.: Daily underlying water use efficiency for AmeriFlux sites: DAILY UNDERLYING WUE, J. Geophys. Res.-Biogeo., 120, 887–902, https://doi.org/10.1002/2015JG002947, 2015. a, b, c, d
Zhou, S., Yu, B., Zhang, Y., Huang, Y., and Wang, G.: Partitioning evapotranspiration based on the concept of underlying water use efficiency: ET PARTITIONING, Water Resour. Res., 52, 1160–1175, https://doi.org/10.1002/2015WR017766, 2016. a