the Creative Commons Attribution 3.0 License.
the Creative Commons Attribution 3.0 License.
Variation pattern of particulate organic carbon and nitrogen in oceans and inland waters
Changchun Huang
Quanliang Jiang
Hao Yang
Chen Lin
Tao Huang
A-Xing Zhu
Yimin Zhang
We examined the relationship between, and variations in, particulate organic carbon (POC) and particulate organic nitrogen (PON) based on previously acquired ocean and inland water data. The latitudinal dependency of POC ∕ PON is significant between 20 and 90∘ N but weak in low-latitude areas and in the Southern Hemisphere. The mean values of POC ∕ PON in the Southern Hemisphere and Northern Hemisphere were 7.40±3.83 and 7.80±3.92, respectively. High values of POC ∕ PON appeared between 80–90 (12.2±7.5) and 70–80∘ N (9.4±6.4), while relatively low POC ∕ PON was found from 20 (6.6±2.8) to 40∘ N (6.7±2.7). The latitudinal variation of POC ∕ PON in the Northern Hemisphere is much stronger than in the Southern Hemisphere due to the influence of more terrestrial organic matter. Higher POC and PON could be expected in coastal waters. POC ∕ PON growth ranged from 6.89±2.38 to 7.59±4.22 in the Northern Hemisphere, with an increasing rate of 0.0024 km from the coastal to open ocean. Variations of POC ∕ PON in lake water also showed a similar latitude-variation tendency of POC ∕ PON with ocean water but were significantly regulated by the lakes' morphology, trophic state and climate. Small lakes and high-latitude lakes prefer relatively high POC ∕ PON, and large lakes and low-latitude lakes tend to prefer low POC ∕ PON. The coupling relationship between POC and PON in oceans is much stronger than in inland waters. Variations in POC, PON and POC ∕ PON in inland waters should receive more attention due to the implications of these values for the global carbon and nitrogen cycles and the indeterminacy of the relationship between POC and PON.
- Article
(4597 KB) -
Supplement
(1904 KB) - BibTeX
- EndNote


Inland waters and oceans transport, transform and contain large amounts of organic carbon. Thus they play an important role in global carbon, nitrogen and nutrient cycles (Cole et al., 2007). Inland waters receive carbon from terrestrial ecosystems at a rate of 2.9 PgC yr−1. Of this carbon, 21 % (0.6 PgC yr−1) is stored in sediment, 48 % (1.4 PgC yr−1) is emitted to the atmosphere as CO2 and CH4, and 31 % (0.9 PgC yr−1) is discharged into oceans via rivers (Tranvik et al., 2009). Recent studies suggest that the emission of CO2 in inland waters could increase to 2.1 PgC yr−1 (Raymond et al., 2013) from past estimates of 0.8 (Cole et al., 2007) and 1.4 PgC yr−1 (Tranvik et al., 2009). The received carbon in inland waters from terrestrial ecosystems can reach 5.7 PgC yr−1 (Le Quéré et al., 2015). The carbon stored in the sediment and discharged into oceans could increase to 2.6 PgC yr−1 by subtracting 2.1 PgC yr−1 from 5.7 PgC yr−1 according to Raymond et al. (2013) and Le Quéré et al. (2015). The ocean is an important carbon sink due to the flux of riverine carbon at 0.9 PgC yr−1 (Tranvik et al., 2009) or higher (Raymond et al., 2013; Le Quéré et al., 2015). The absorption of atmospheric CO2 is fixed by phytoplankton at a rate of 42.3±0.7 PgC yr−1 (IPCC, 2013).
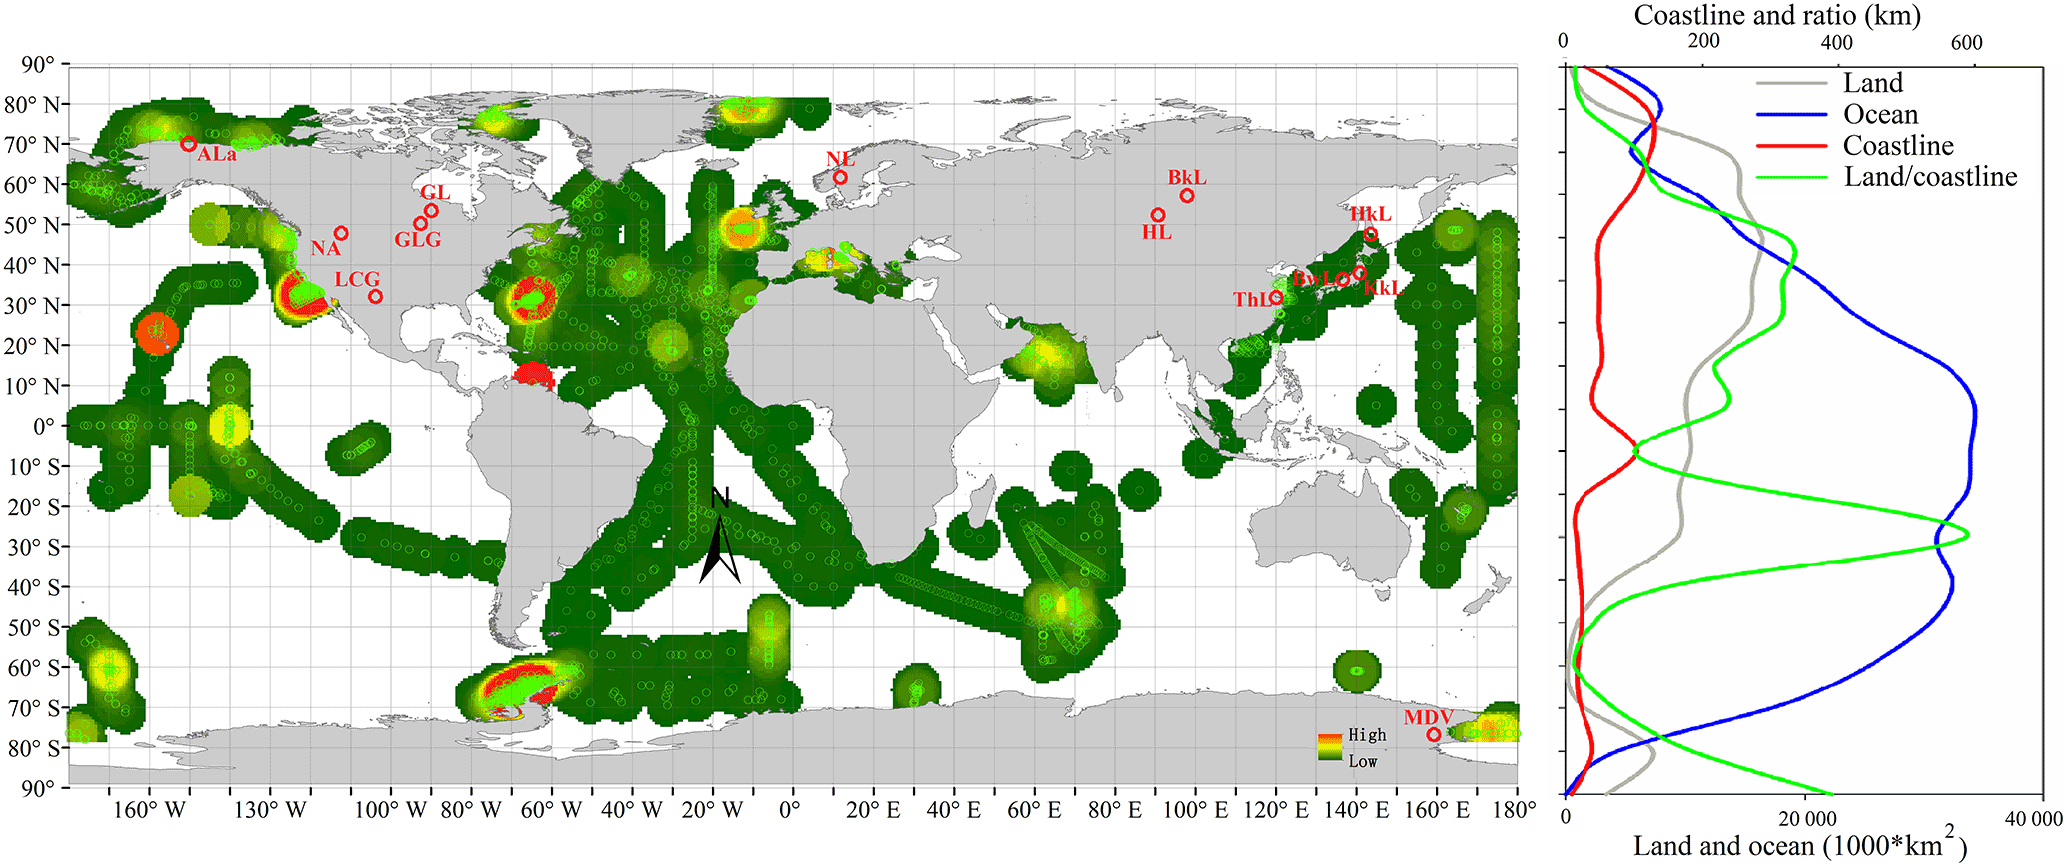
Figure 1Global distribution of paired samples of POC and PON. Green circles are oceanic samples and red circles are inland samples. Land and ocean area, coastline length and the ratio of land area to coastline are also shown. The original map data of the world vector downloaded from http://www.naturalearthdata.com.
There is a strong relationship between nitrogen and carbon cycles in natural aquatic ecosystems. The input of nitrogen into aquatic ecosystems as nutrients from the land and atmosphere stimulates additional uptake of carbon (Hyvönen et al., 2007), and fixed carbon and nitrogen are released as gas and ions (CO2, CH4 and NOx, etc.) when organisms are mineralized (Galloway, et al., 2004; Flückiger et al., 2004). This relationship is made stronger by the life processes of organisms, but it is weakened by variations in the sequestration and mineralization rates of carbon and nitrogen (Gruber and Galloway, 2008). The relationship between carbon and nitrogen is relatively stable in natural aquatic ecosystems, although carbon and nitrogen levels vary depending on autotrophic biotypes, water environment (Thornton and McManus, 1994; Gruber and Galloway, 2008) and human activities (Gruber and Galloway, 2008; Galloway et al., 2008; Perga et al., 2016).
The elemental composition of organic matter affects the global biogeochemical cycle and varies depending on its sources (Devries and Deutsch, 2014). The carbon to nitrogen (C ∕ N) ratio is affected by the life processes of organisms and is a good measure of the relationship between carbon and nitrogen cycles (Sterner and Elser, 2002; Schneider et al., 2003; Meisel and Struck, 2011; Babbin et al., 2014). Organic nitrogen originates from plant proteins and nucleic acids and, to a lesser extent, from lignin and cellulose. The C ∕ N ratio in terrestrial plants is much higher than in autotrophic phytoplankton due to their high lignin and cellulose content (Kendall et al., 2001; Mcgroddy et al., 2004; Watanabe and Kuwae, 2015). This leads to a C ∕ N ratio that is higher and much more variable in inland waters than in offshore oceans; there is also a sharp contrast in nutrient levels and water residence times between the two (Hall et al., 2007; Sterner et al., 2008). Several studies suggest that the currently observed C ∕ N ratio, and variations in it, are difficult to reconcile with the value estimated by Redfield (6.63), which was based on data taken from ocean-surface plankton and deep, dissolved nutrients from 1898 to 1933 (Körtzinger et al., 2001; Schneider et al., 2004; Koeve, 2006; Sterner et al., 2008; Martiny et al., 2013a, b; Devries and Deutsch, 2014). The factors influencing variations in C ∕ N are complex due to the loss and product rates of POC and PON. Nitrogen, light limitation and phytoplankton can only explain approximately 20 % of the variation in C ∕ N on a global scale (Martiny et al., 2013b). Temperature, composition of organic matter and dynamic characteristics of water significantly determine the loss rates of POC and PON in the water (Stief, 2007; Gälman et al., 2008; Gudasz et al., 2010; Sobek et al., 2014; Cardoso et al., 2014). Other factors that regulate C ∕ N on a regional scale include microzooplankton (Talmy et al., 2016), heterotrophic microbes (Crawford et al., 2015) and terrestrial organisms (Jiang, 2013). This variation in C ∕ N increases the uncertainty of global carbon and nitrogen estimation (Babbin, 2014). Consequently, understanding temporal and spatial variation in POC, PON and the POC ∕ PON ratio, as well as the processes that govern POC ∕ PON, is critical to better explain the global biogeochemical cycles of carbon and nitrogen.
Recently, global oceanic studies have proposed that the median global value of C ∕ N in oceans is close to the Redfield value, but there is significant regional variation (Martiny et al., 2013b). Meanwhile, POC ∕ PON exhibits a strong latitudinal pattern, with lower values in the cold ocean waters of the higher latitudes (Martiny et al., 2013a). In contrast to the study of oceanic POC ∕ PON, the elemental stoichiometry research of C ∕ N in inland waters still needs to be complemented and perfected (Sterner et al., 2008). In this study, we extend the study area and dataset of previous studies (Martiny et al., 2013b, 2014; Kim et al., 2015), from 60∘ N–78∘ S with 40 482 samples to 80∘ N–78∘ S with 63 184 samples, to re-examine variations in POC, PON and POC ∕ PON on a global scale. Values for POC, PON and POC ∕ PON in inland waters were combined to further reveal the relationship between POC and PON and deviations in POC ∕ PON from the classical Redfield value.
2.1 Data collection
To achieve this study's objective, datasets from previously published studies and publicly available online data were acquired (detailed information is listed in Supplement Table S1). This compiled dataset contained 63 184 paired POC and PON samples (Northern Hemisphere, 40 809 samples; Southern Hemisphere, 22 448 samples) from offshore and coastal oceans and 23 996 samples from inland waters (rivers and lakes). The spatial distribution of samples is shown in Fig. 1. Measurements of particulate elements were carried out by similar methods, where C and N were analyzed on a C ∕ N elemental analyzer after water samples were filtered through pre-weighed, pre-combusted (450 ∘C for 4 h) GF/F filters and acidified. The units of POC and PON in all data (µg L−1, µmol L−1) were unified to µmol L−1 via molecular weight of C and N.
Geographical land and ocean distribution data and soil organic carbon data (Harmonized World Soil Database, http://daac.ornl.gov/SOILS/guides/HWSD.html) were also used to analyze the factors influencing variations in POC, PON and POC ∕ PON.
2.2 Data category and analysis methods
Samples with extremely low POC (<0.01 µmol L−1) and PON (<0.001 µmol L−1) values were removed due to the limit of detection for the analysis. The collection of ocean data from previous studies and web-sharing databases contained variable ranges of POC and PON with latitude, time, depth and temperature. To reveal the pattern of POC and PON, the remaining data were classified into four types relating to latitude, depth, offshore distance and temperature to aid data analysis: (1) oceanic samples, taken from 80∘ N to 78∘ S, were divided into 17 ranges with 10∘ latitudinal intervals (Table S2 in the Supplement). The data in each latitudinal range include all ranges of temperature, time and depth for samples. (2) Ocean POC and PON samples were separated into 0–5, 5–10, 10–20, 20–80 and > 80 m depth ranges according to the distribution of the samples' number (Table S3 and Fig. S1 in the Supplement). The distribution of samples at each depth covers most ranges of latitude, time and temperature for POC and PON. (3) POC and PON samples were divided into temperature ranges with an interval of approximately 1 ∘C. (4) Offshore distance ranges (5, 10, 15, 20, 25, 50, 75, 100, 125, 150, 200, 300, 500, 800 and 1100 km) were created via the buffer establishment module in Arcgis 10 (Esri), and the samples located in each range were separated and statistically analyzed (Table S4 in the Supplement). All ranges of POC and PON with different depths, times and latitudes in each buffer were treated as the same category for each offshore distance range. The samples in different ranges of buffers (different distances offshore) can show the variation of POC, PON and POC ∕ PON from coastal areas to the open sea (Fig. S2 in the Supplement).
Lake collection data of POC and PON were analyzed for individual lakes. Some measurements of POC and PON include multiple observations in many of the small lakes. The observational data were processed as lake groups, such as the Great Lakes Group, Lacustrine Central Group, or Alaskan Lakes (Table S7 in the Supplement).
The number of samples is listed in the tables of the supporting material (Table S2–6 in the Supplement). Statistical values (mean, maximum, minimum and standard deviation) were calculated for POC, PON and POC ∕ PON for all groups. The relationships between PON and POC for all categories (ocean and lakes) were also regressed and listed in the supporting material. The relationships between particulate organic matter (PON and POC) and water properties (temperature, DOM, chlorophyll and total suspended sediment), as well as soil organic carbon, were regressed to explore the effect of each influencing factor on the variation pattern of POC and PON.
The soil organic carbon data from the Harmonized World Soil Database were also divided into 17 ranges with 10∘ latitudinal intervals according to the process of oceanic POC and PON data. The soil organic carbon and oceanic POC, PON and POC ∕ PON in the same latitudinal range were statistically compared with the mean, maximum, and minimum values, respectively. The relationships between soil organic carbon and POC, PON and POC ∕ PON reveal the potential impact of terrestrial organic matter on the variation of oceanic POC, PON and POC ∕ PON.

Figure 2Latitudinal variation of POC (a), PON (b) and the POC ∕ PON (c) ratio from the compiled statistical results of depth-integrated data for all ocean data. The box plots show the median and 25th and 75th percentiles, with whiskers covering most of the data. The red line with green boxes shows the mean value for each latitudinal range.
3.1 Spatial variation of POC, PON and POC ∕ PON in the ocean
3.1.1 Latitudinal variation of POC, PON and POC ∕ PON
The spatial distributions of POC, PON and POC ∕ PON significantly affect marine carbon and nitrogen flux estimation as well as the air–ocean exchange of CO2 via the global ocean carbon cycle model (Schneider et al., 2004). Studies have proposed that the elemental ratio (POC ∕ PON) of particulate organic matter in marine environments is characterized by a strong latitudinal pattern (for 60∘ N–60∘ S) due to the influence of nutrients, temperature and respiration (Martiny et al., 2013a; Devries and Deutsch, 2014). Microzooplankton and algae production also regulate POC ∕ PON in the ocean (Tamelander et al., 2013; Crawford et al., 2015; Talmy et al., 2016). Compared with the strongly latitudinal-dependent relationship in the elemental ratios (Martiny et al., 2013a), both POC and PON barely show a global latitudinal pattern, but latitudinal variations in POC and PON in the Southern Hemisphere are much weaker than in the Northern Hemisphere (Fig. 2a and b). The latitudinal dependency of POC ∕ PON in the Northern Hemisphere is stronger than in the Southern Hemisphere, especially between 40 and 90∘ N, which shows an attenuation trend with a decrease in latitude (Fig. 2c). Different from a previous study (Crawford et al., 2015), which observed that a low POC ∕ PON ratio (2.1 to 5.6) existed in the middle–high latitudes (80–50∘ N) due to the presence of heterotrophic microbes in summer, we found high values for POC ∕ PON, 12.2±7.5 and 9.4 ± 6.4 between 80–90∘ N and 70–80∘ N, respectively. Relatively low POC ∕ PON ratios were found from 20∘ N (6.6 ± 2.8) to 40∘ N (6.7 ± 2.7). Consistent with earlier studies, the low POC ∕ PON ratios were very close to the Redfield value (6.625). The mean value of POC ∕ PON in the Northern Hemisphere (7.50 ± 4.65) is slightly lower than in the Southern Hemisphere (7.81 ± 3.79) and close to the global mean value of POC ∕ PON (7.54 ± 3.82). The variation for POC ∕ PON in the Northern Hemisphere is bigger than in the Southern Hemisphere (Table S2). This could indicate that biogeochemical processes and the circulation of carbon and nitrogen in the Northern Hemisphere are much more complex than in the Southern Hemisphere.
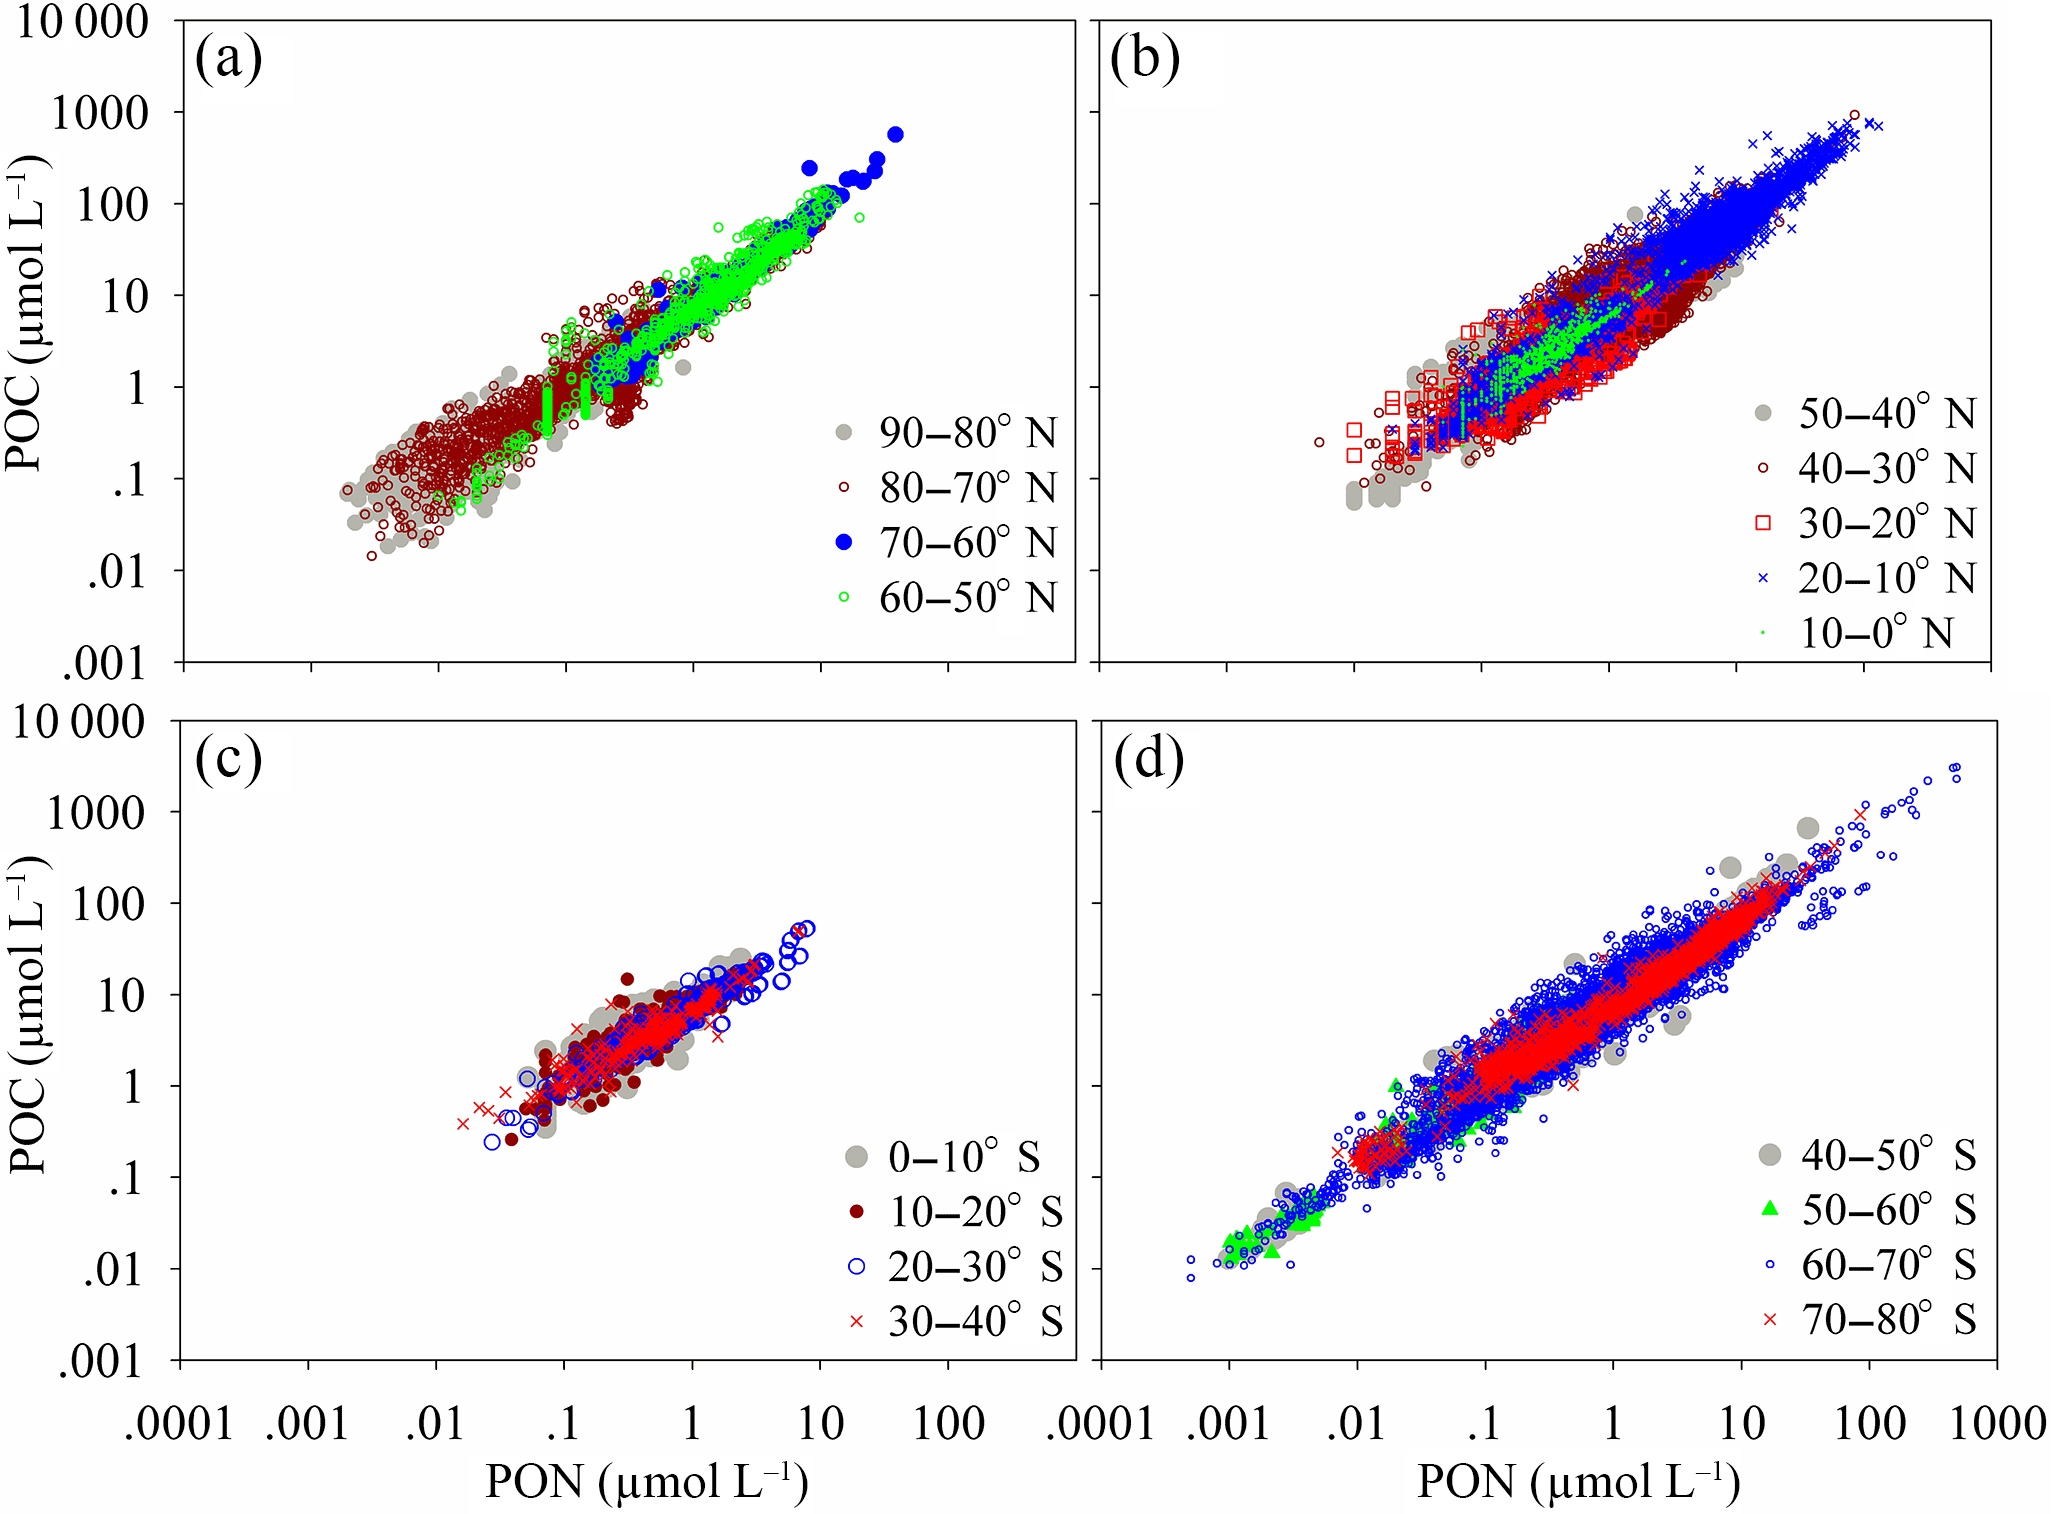
Figure 3Panels (a, b) are scatter plots of POC and PON for each latitudinal range of the Northern Hemisphere. Panels (c, d) are scatter plots of POC and PON for each latitudinal range of the Southern Hemisphere. The relationships between POC and PON are listed in Table S2.
PON and POC co-vary, resulting in a strongly coupled relationship (Fig. 3a–d). Linear functions (including and excluding intercepts) and power functions can be used to express the relationship between carbon and nitrogen for each latitudinal range (Table S2). However, the optimal function is different for each latitudinal range. The regression functions for POC and PON and the best regression results (highest R2) marked with an asterisk are listed in Table S2. The linear function used to describe the relationship between POC and PON globally is (R2=0.916). The linear functions between POC and PON for the Southern Hemisphere and Northern Hemisphere are (R2=0.913) and (R2=0.899), respectively. The slopes of the linear regressions in the Northern Hemisphere and Southern Hemisphere (5.97 and 7.06) are very close to the Redfield ratio of 6.63 and almost cover the range of POC ∕ PON in previous regional studies (e.g., 5.89, 5.06 and 4.63, Caperon, 1976; 6.43, Verity, 2002; 5.8, Lara et al., 2010; 5.53 and 5.38, Crawford et al., 2015; 6.62, P. H. Cai et al., 2015; 6.75, Kim et al., 2015). However, the global linear slope between POC and PON (6.17) is slightly lower than the Redfield ratio of 6.63.
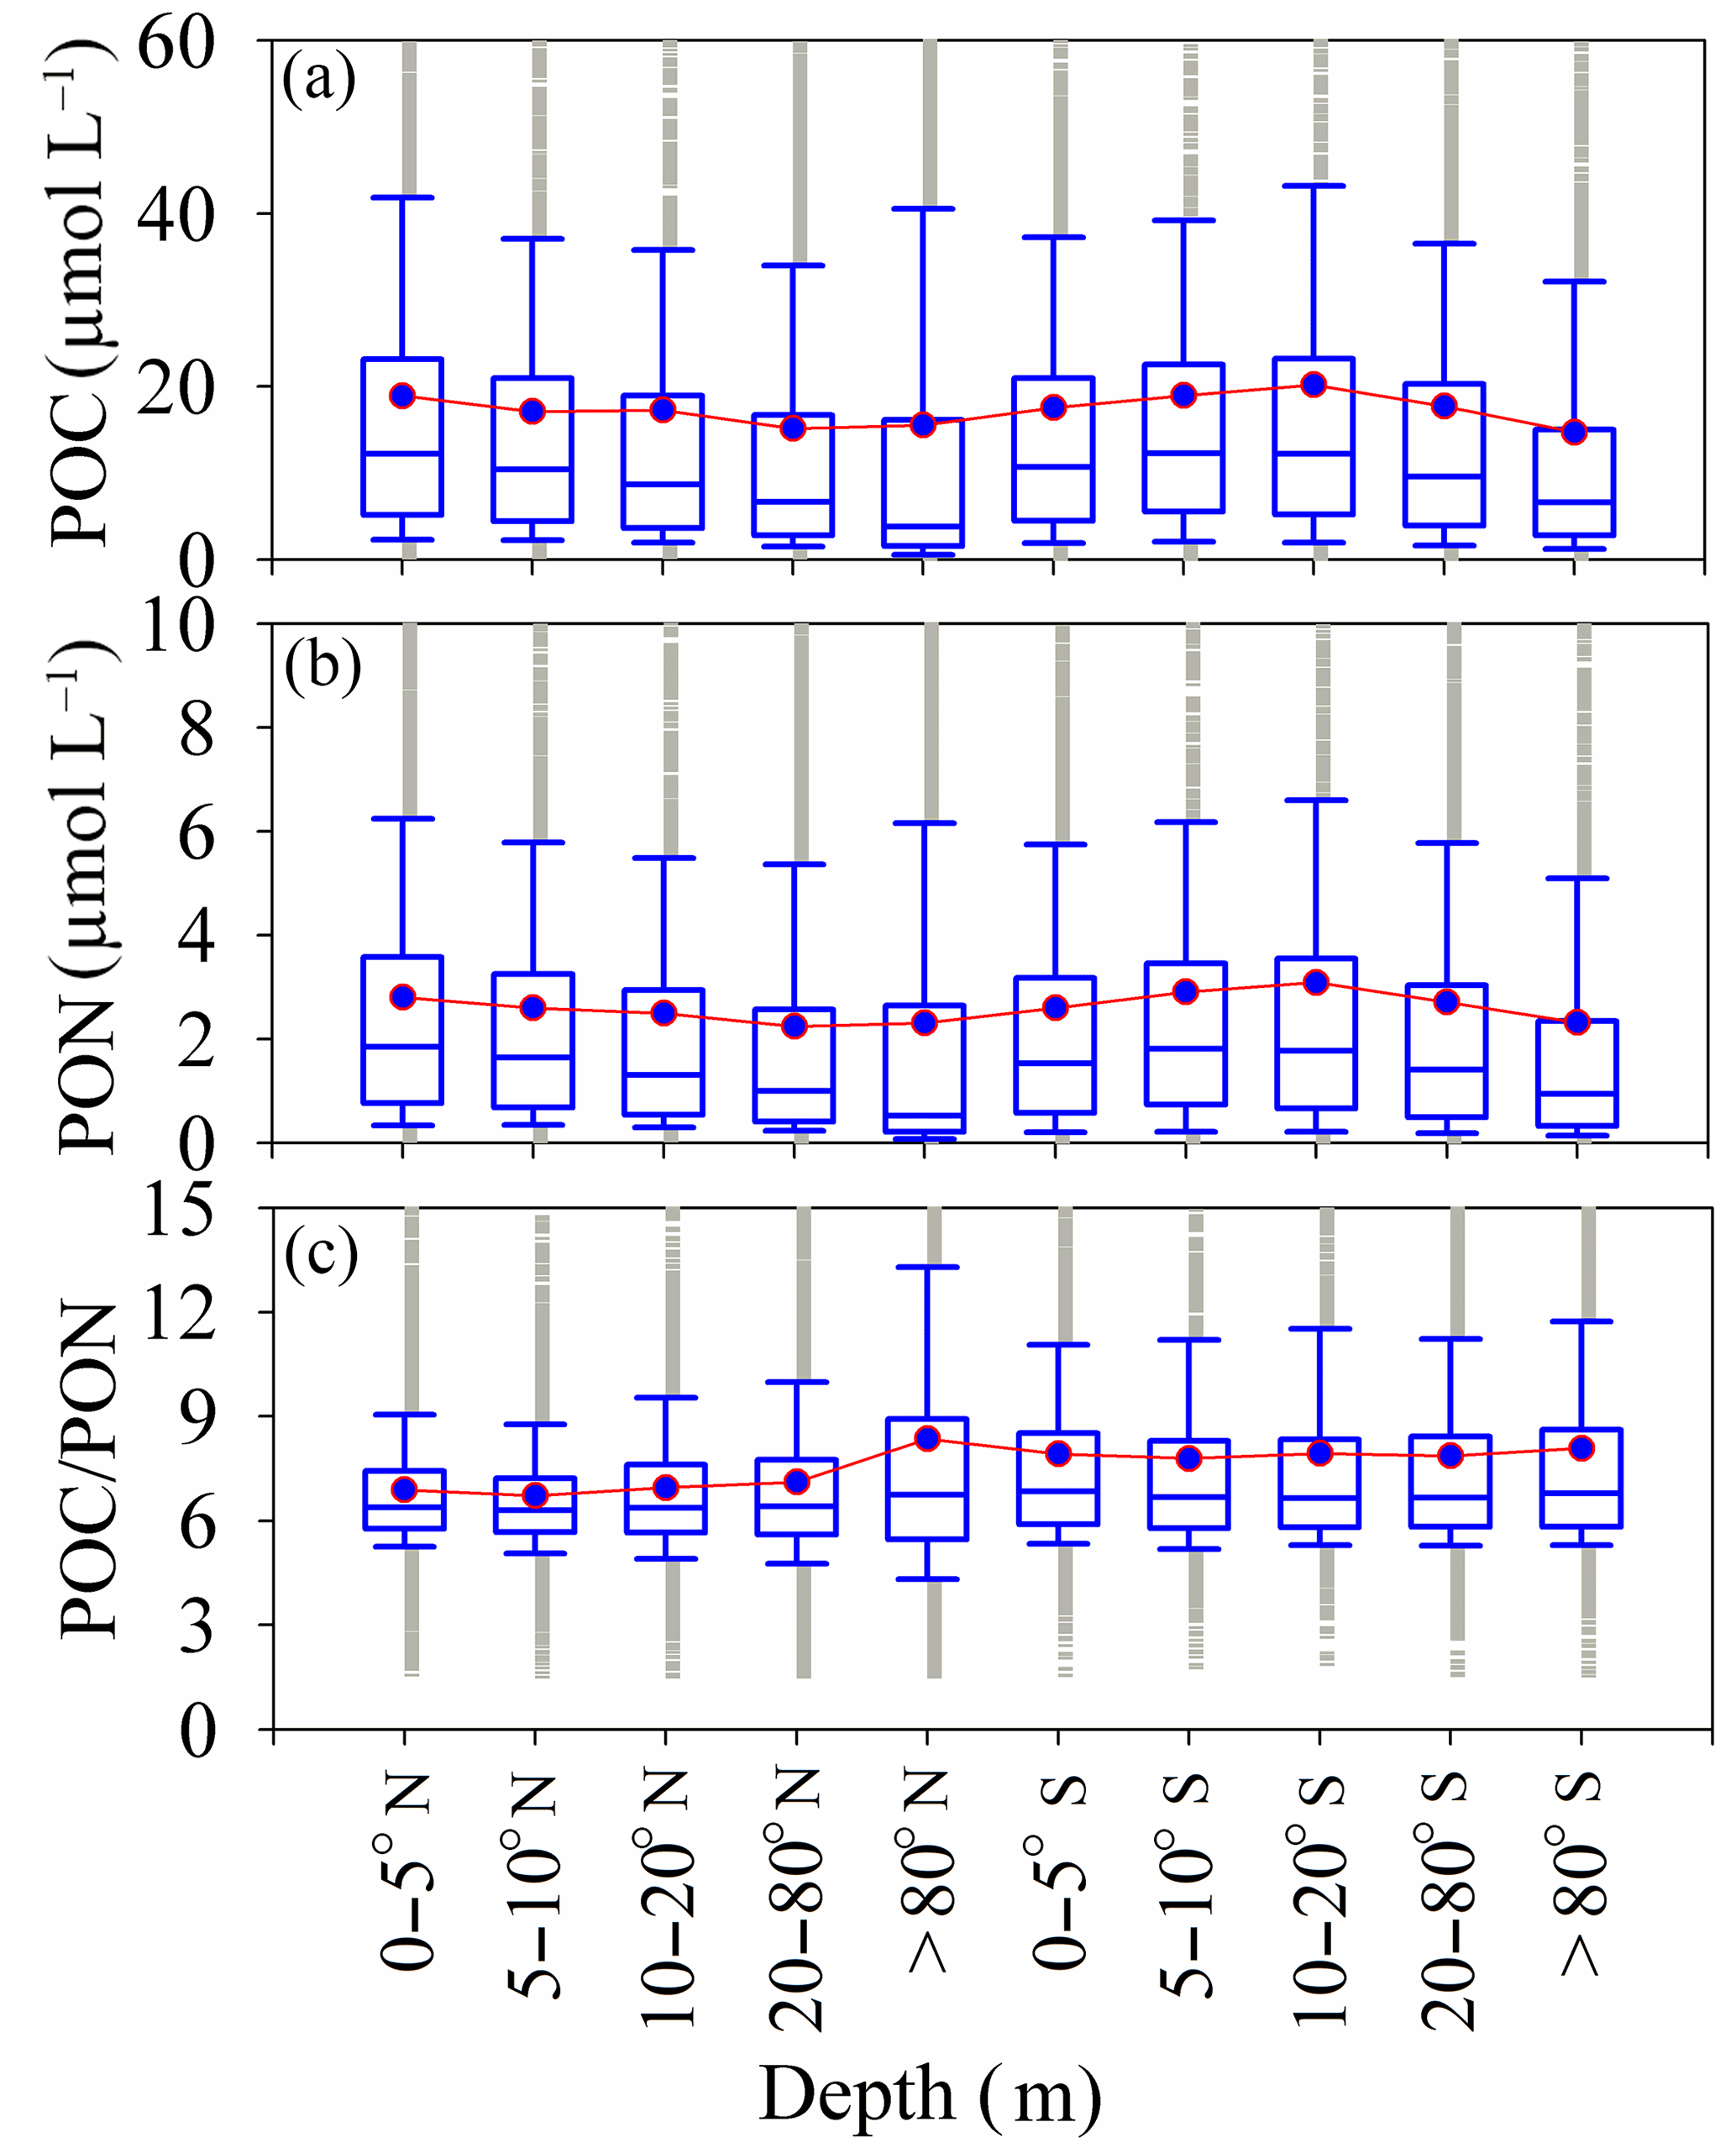
Figure 4Depth dependence of POC and PON in the Southern Hemisphere and depth dependence of POC ∕ PON in the Northern Hemisphere. The box plots show the median and 25th and 75th percentiles, with whiskers covering most of the data. The red line with the green boxes shows the mean value at each depth.
3.1.2 Depth variation of POC, PON and POC ∕ PON
The vertical distributions of POC and PON, and the resulting variations in POC ∕ PON, have a critical impact on carbon and nitrogen cycles in oceans and should be considered in models of the biogeochemical cycle (Schneider et al., 2003, 2004, 2005; Babbin et al., 2014). The distributions of POC and PON show that the relatively high POC and PON were distributed in the surface water (0–5 m) in the Northern Hemisphere with mean values of 17.83 ± 2.03 µmol L−1 (POC) and 2.72 ± 0.29 µmol L−1 (PON). Conversely, relatively high POC and PON in the Southern Hemisphere appeared in deeper water (10–20 m) with mean values of 16.79 ± 1.51 µmol L−1 (POC) and 2.49 ± 0.23 µmol L−1 (PON) (Fig. 4a and b). However, the depth dependence of POC ∕ PON in the Northern Hemisphere and Southern Hemisphere is weak (Fig. 4c). POC ∕ PON increased significantly, from 6.88 ± 2.3 (0–5 m) to 8.36 ± 6.5 (> 80 m) in the Northern Hemisphere, but was nearly constant (7.92 ± 0.10) in the Southern Hemisphere (Fig. 4c). Increases in POC ∕ PON with depth in the Northern Hemisphere occurred at rates of 5.2 km (depth < 200 m). These increasing rates are much higher than the 0.2 ± 0.1 km (0–> 5000 m) rate proposed by Schneider (2004). This may be due to the predominance of nitrogen remineralization in shallow ocean water (Babbin et al., 2014). The coupling relationship between POC and PON is relatively lower at other depths, such as deeper than 80 m (Fig. S3b in the Supplement) and in surface water (Fig. S3a) in the Northern Hemisphere. The relationship between POC and PON in the Southern Hemisphere is much stronger than in the Northern Hemisphere (Fig. S3c and d). The regression functions of POC and PON for each depth are listed in Table S3.
3.1.3 Variations in POC, PON and POC ∕ PON with offshore distance
Previous studies indicate that a large amount of terrestrial carbon is discharged from rivers to oceans (Cole et al., 2007), causing variations in POC, PON and POC ∕ PON, especially in coastal regions (Martiny et al., 2013b). Most of the terrestrial carbon will sink as sediment in estuaries or transport to the open ocean, although a large amount (0.3 PgC yr−1) of terrestrial carbon (0.5 PgC yr−1) is emitted as CO2 (Cai, 2011).
Variations occur in POC and PON levels when taking into account the distance from the shore, showing that there is a significant separation zone (50 km) dividing POC and PON levels into two regions in the Northern Hemisphere (Fig. 5a, b). POC levels close to land (0–50 km) (region close to the shore, 21.90 ± 11.01 µmol L−1) are nearly 2 times larger than in regions more than 50 km from land (offshore region, 11.65 ± 3.58 µmol L−1) due to terrestrial influences. The distribution of PON is similar, as PON levels are higher close to the shore (0–50 km, 3.19 ± 1.46 µmol L−1) compared to offshore (> 50 km, 1.67 ± 0.44 µmol L−1). Conversely, POC ∕ PON increases from 6.89 ± 2.38 to 7.59 ± 4.22 with distance from shore to open sea in the Northern Hemisphere (Fig. 5c). Terrestrial impacts on POC and PON levels in the Southern Hemisphere are relatively weak (POC, 20.14 ± 5.51 µmol L−1; PON 3.12 ± 0.87 µmol L−1) (Fig. 5d, e). In addition, there is little change in POC ∕ PON with distance from coastal (7.59 ± 3.77) to offshore regions (7.90 ± 3.99) in the Southern Hemisphere (Fig. 5f).
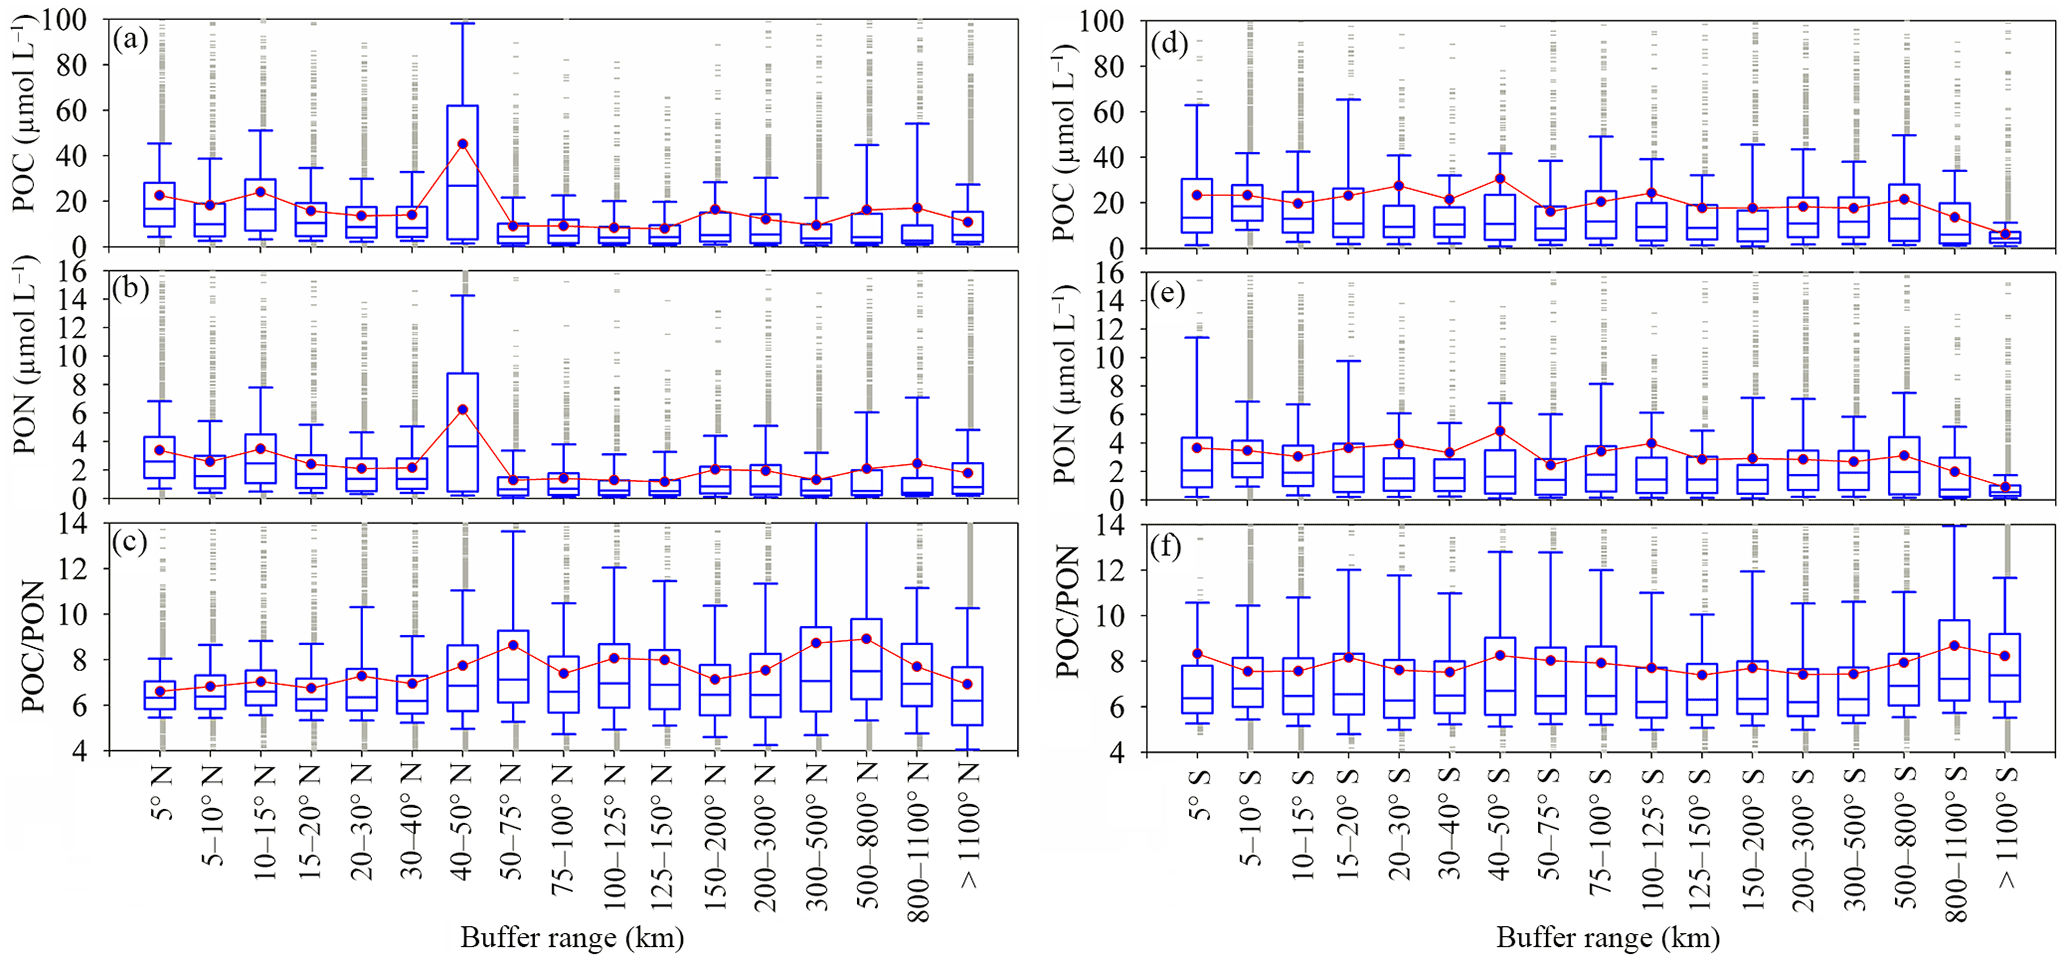
Figure 5Variation of POC, PON and POC ∕ PON with distance from shore. The number of samples for each buffer is listed in Table S4. The box plots show the median and 25th and 75th percentiles. The red line with green boxes shows the mean value for each range.
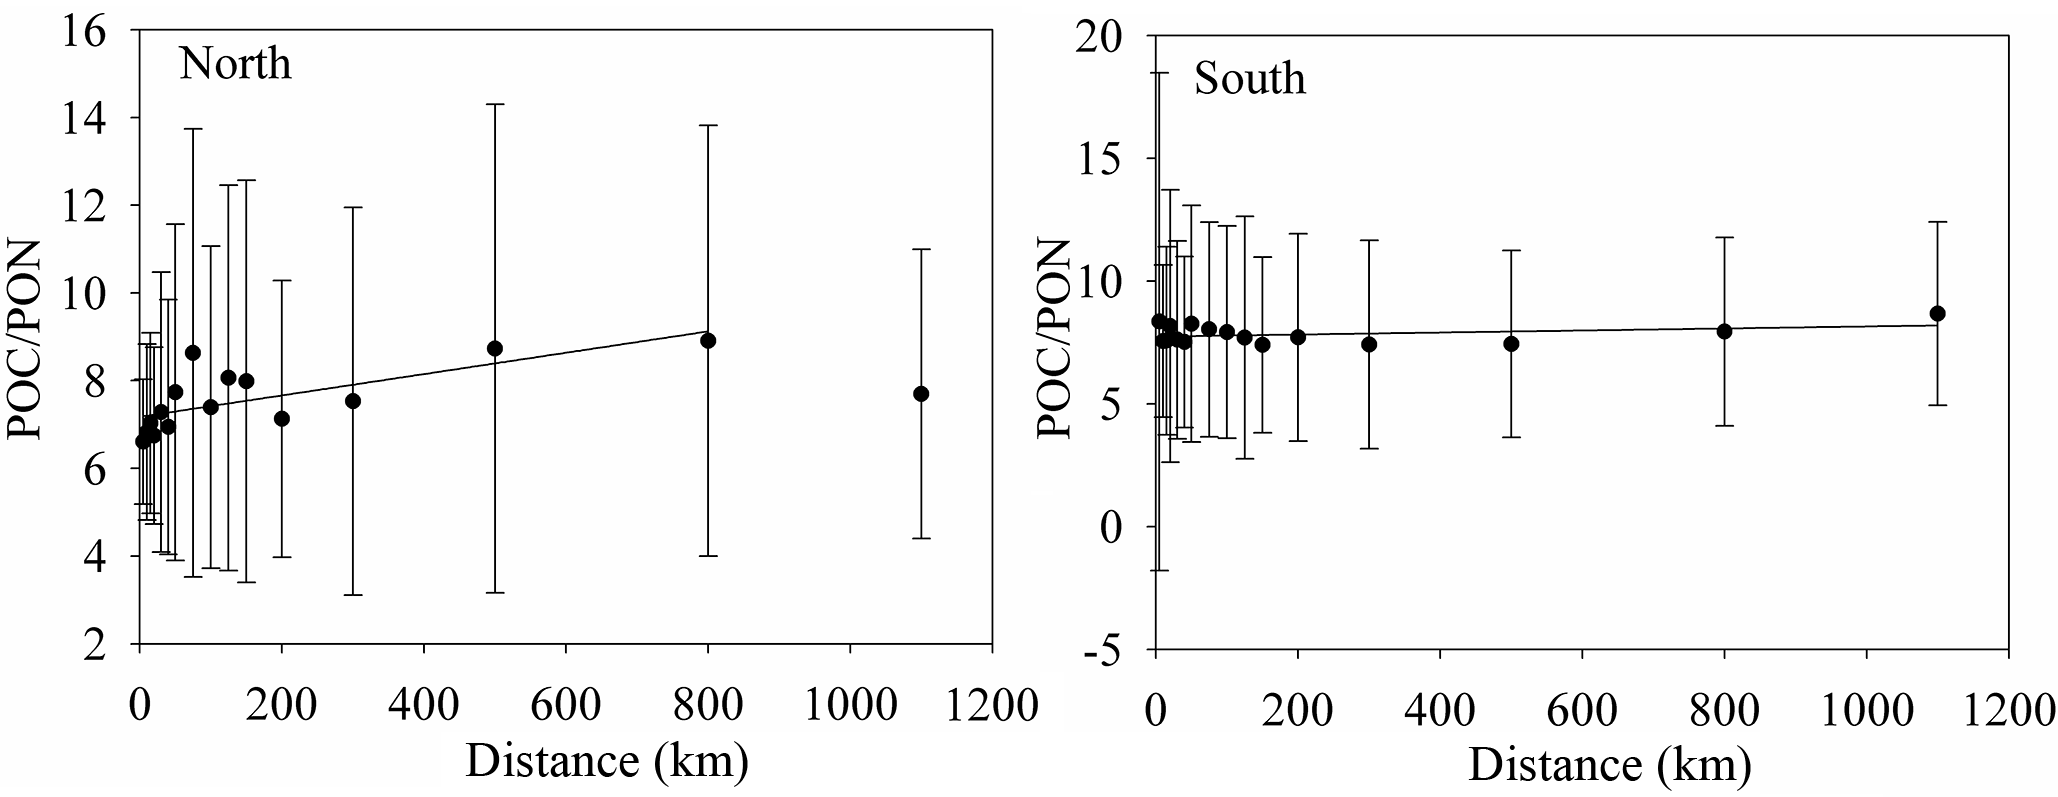
Figure 6The variation of POC ∕ PON with distance from the shore to the open sea. The relationships between POC ∕ PON and distance are POC ∕ PON = (R2=0.519, Northern Hemisphere) and POC ∕ PON = (R2=0.118, Southern Hemisphere).
Coastal water with relatively high POC and PON levels has a low POC ∕ PON within 75 km of the coast in the Northern Hemisphere (Table S4 in the Supplement, Northern Hemisphere). This is inconsistent with previous studies that show that coastal water has a higher POC ∕ PON than offshore water (Sterner et al., 2008; Kaiser et al., 2014) due to the discharge of terrestrial organic matter with high POC ∕ PON (Hilton et al., 2015; Y. H. Cai et al., 2015). A previous study proposed that more than 0.2 PgC yr−1 of CO2 is emitted from coastal waters due to the microbial decomposition of terrestrial organic matter (Cai et al., 2011), as well as the priming effect (Bianchi, 2011). The over-consumption of carbon could reduce the POC ∕ PON ratio in the coastal waters. Zooplankton, phytoplankton and high nutrient levels also reduce POC ∕ PON in coastal waters (Koeve, 2006; Martiny et al., 2013b; Talmy et al., 2016). The relatively high POC ∕ PON ratio in offshore water is primary caused by small phytoplankton, which is the dominant contributor to POC levels at the ocean surface and has a high POC ∕ PON ratio (Richardson and Jackson, 2007; Puigcorbé et al., 2015). The increase in POC ∕ PON with distance is very significant in the Northern Hemisphere, with an increasing rate of 0.0024 km (POC ∕ PON = , R2=0.519), especially within 75 km of the coast (POC ∕ PON = , R2=0.855), but is insignificant in the Southern Hemisphere, with a rate of 0.0004 km (POC ∕ PON = , R2=0.118) (Fig. 6).

Figure 7Variation of PON, POC and POC ∕ PON in lake waters. The lakes are mainly located in the Northern Hemisphere. Eutrophic, small, large, and shallow lakes are included in the dataset. MDV is McMurdo Dry Valleys Lakes (Antarctica), ALa is Alaskan Lakes (USA), NL is Norwegian Lakes (Norway), NA is Northern American Lakes (USA), HkL is Hokkaido Lakes (Japan), LCG is the Lacustrine Central Group (USA), KkL is Lake Kasumigaura (Japan), BwL is Lake Biwa (Japan), HL is Lake Hovsgol (Mongolia), BkL is Lake Baikal (Russia), GL is Green Lake (Canada), ThL is Lake Taihu (China), and GLG is the Great Lakes Group (USA). The box plots show the median and 25th and 75th percentiles, with whiskers covering most of the data. The red line with green boxes shows the mean value of each range. The lake names and their abbreviations are listed in Table S7 in the Supplement.
3.2 Variability of POC, PON and POC ∕ PON in inland waters
3.2.1 Lake water
Inland waters play an important role in the global carbon cycle, linking the terrestrial, atmospheric, and oceanic carbon pools. The lakes investigated in this study were sorted by latitude, according to geographical position. POC and PON in lake waters exhibit a similar latitudinal variation trend with the ocean of the Northern Hemisphere, where POC and PON decreased with latitude, but had greater variability than in oceans due to the strong dual influences of terrestrial and aquatic organic matter (Fig. 7) (Wilkinson et al., 2013). In contrast to the latitudinal variation trend of POC and PON, the POC ∕ PON in lake waters increased with latitude. However, the lake's morphology, trophic state, climate and other influencing factors could also regulate the latitude variation of POC ∕ PON in lake waters. The investigated data from 8300 lakes indicate that the average carbon ∕ nitrogen stoichiometry in different types of lakes is approximately 10.6 at the global scale, 9.5 for small lakes, 8.5 for large lakes, 8.16 for shallow lakes, 5.67 for deep lakes, 11.46 for frigid northern lakes and 10.37 for temperate lakes (Chen et al., 2015; Sterner et al., 2008). For example, Kasumigaura Lake is an extremely eutrophic lake, with a mean (from 1977 to 2013) chlorophyll a concentration of 67 ± 44 µg L−1 and relatively high POC and PON (POC, 332.76 µmol L−1, and PON, 47.94 µmol L−1). The trophic state of Lake Taihu is similar to Kasumigaura Lake (Huang et al., 2015), and the POC and PON levels in Lake Taihu are very close to those in Kasumigaura Lake. However, the POC ∕ PON ratio in Lake Taihu (4.04 ± 3.96) is much smaller than in Kasumigaura Lake (7.1 ± 1.5). This could be caused by the over-mineralization of organic carbon reducing the POC ∕ PON in large shallow lakes (e.g., Lake Taihu) and emitting much more CO2 than the smaller lakes (e.g., Kasumigaura Lake) (Xiao et al., 2014; Hotchkiss et al., 2015). The large and deep lakes, including the Great Lakes, also show a relatively low POC ∕ PON ratio (5.07). Lakes located in cold-dry climatic zones (McMurdo Dry Valleys Lakes, Alaskan Lakes, Norwegian Lakes, Lake Baikal, and Lake Hovsgol) tend to have low POC and PON levels but a high POC ∕ PON ratio (Fig. 7). This agrees with previous studies that inland waters maintain high POC ∕ PON ratios due to the strong impact of terrestrial organic matter (Guo et al., 2003; Cai et al., 2008). Meanwhile, the coupling relationship between POC and PON for each lake was also regulated by these influencing factors (Table S5 and Fig. S5 in the Supplement). The relationships between PON and POC for each lake are listed in Table S5.
3.2.2 River water
Rivers not only bridge the carbon and nitrogen elemental cycles in the land and ocean through the transmission of organic matter, but also conduct the emission of CO2 in the inland water (Raymond et al., 2013; Ward et al., 2017; Sawakuchi et al., 2017). The POC and PON in the river are relatively higher than in oceans and lakes, especially in large and highly turbid rivers (such as the Yangtze River and Amazon River in Fig. 8a and b). The POC and PON in the Yangtze River (the highest POC and PON river, 4154.6 ± 3109.6 µmol L−1 and 290.7 ± 180.5 µmol L−1) are proximately 100- and 80-fold bigger than in the Fraser River (the lowest POC and PON river in this study, 39.7 ± 54.9 µmol L−1, 3.7 ± 4.3 µmol L−1), indicating huge spatial variation of POC and PON in the river system. It also could be that big rivers with high POC and PON discharge much more POC and PON into the ocean (the global annual flux of POC is 216 Tg, Voss, 2009), accompanied by high runoff. Previous studies also proposed that the temporal variation of POC and PON in rivers is significant (Verity, 2002; Ward et al., 2012). However, the variation of POC ∕ PON (variable coefficient, 0.47) in river waters is much smaller than POC (variable coefficient, 2.03) and PON (variable coefficient, 1.81). The value and variation of POC ∕ PON (12.5 ± 5.8 with a variable coefficient of 0.47) in this study are much bigger than in previous studies (10.6 ± 2.3 with a variable coefficient of 0.21, Meybeck, 1982). The highest POC ∕ PON ratio appeared in the Ipswich and Parker rivers (IPPR, 28.73 in Fig. 8c). This value is higher than in previous studies on the Mississippi River (9.74 ± 0.70, this study; 9.7, Trefry et al., 1994; 14.4, Y. H. Cai et al., 2015), the central USA river (11.22 ± 1.86, Onstad et al., 2000) and the Amazon River (10.8 ± 3.3, this study; 11.6, Moreira-Turcq et al., 2013), but it is still lower than in northern rivers such as the Chena River (32 ± 12, Guo et al., 2003; 34.33, Cai et al., 2008). The lowest POC ∕ PON ratio appeared in the Pearl River (PR, 6.02 ± 1.91), which is closer to the 5.67 ratio for deep lakes (Chen et al., 2015). The latitude dependences of POC, PON and POC ∕ PON were not evaluated because the samples of each river did not follow the latitude distribution. The relationships between PON and POC for each river are listed in Table S6 (Fig. S6 in the Supplement).
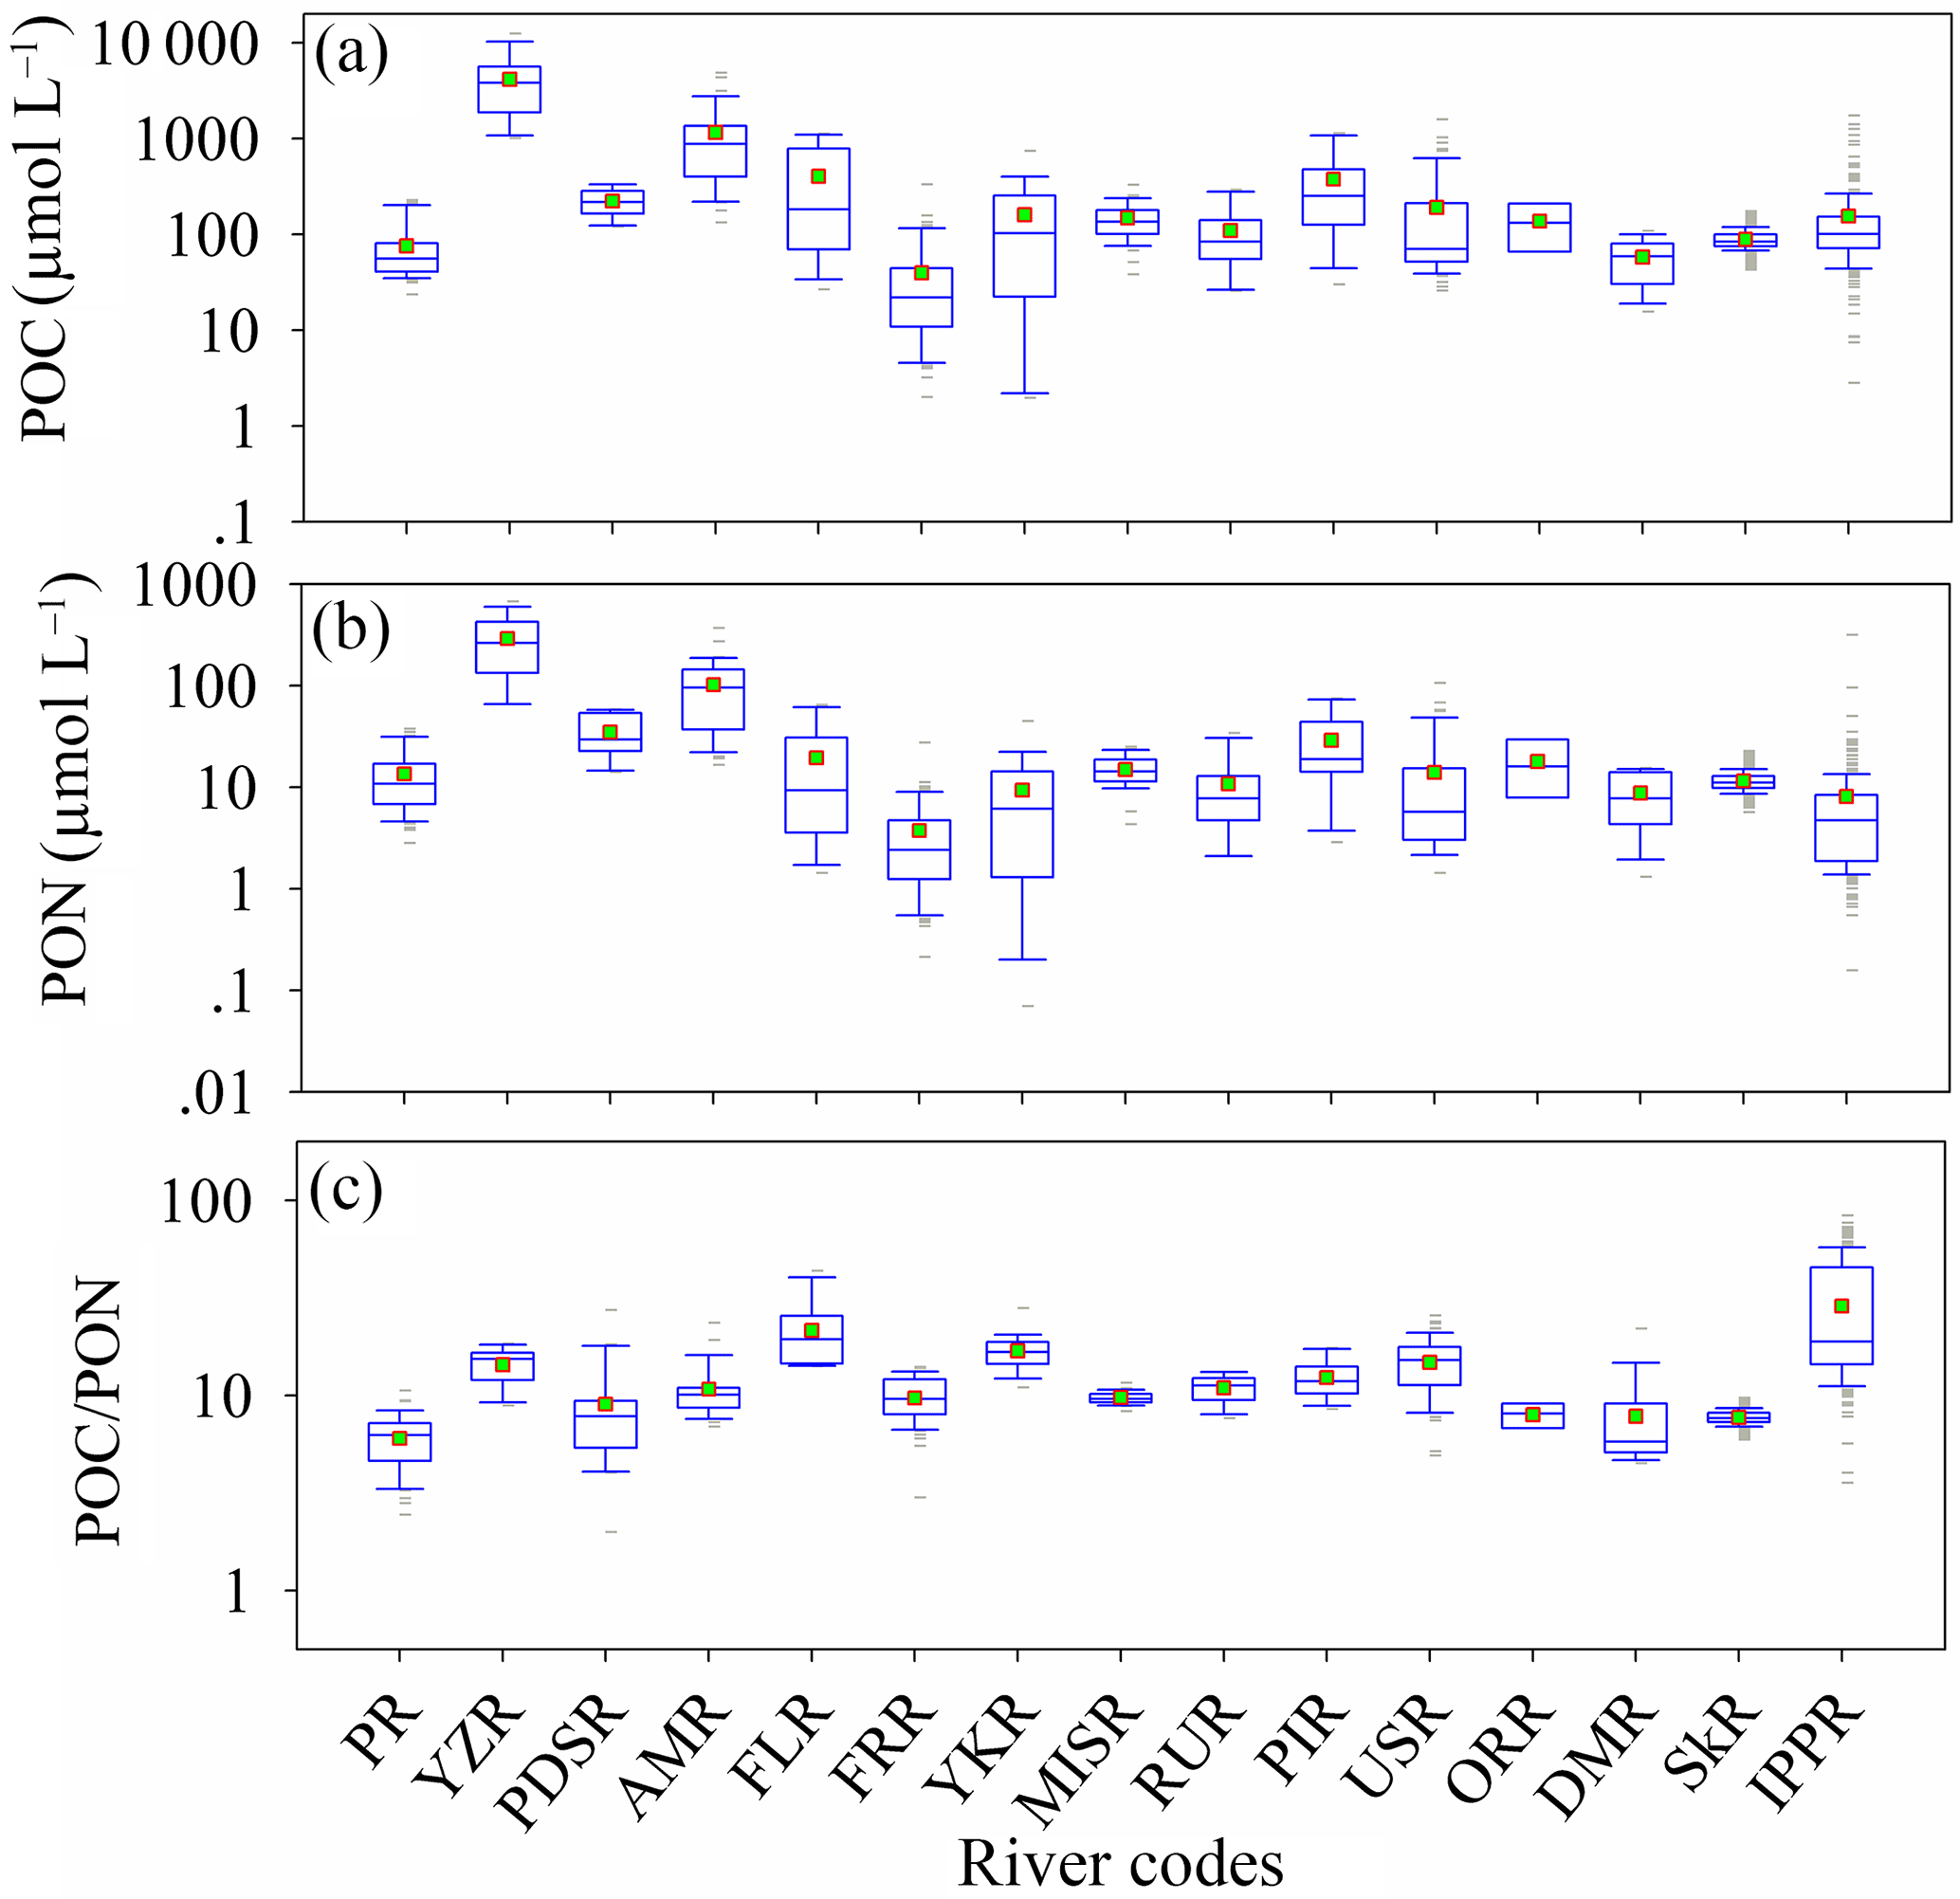
Figure 8Variation of PON, POC and POC ∕ PON in river waters. PR is Pearl River (China), YZR is Yangtze River (China), PDSR is Paraiba do Sul river (Brazil), AMR is Amazon River (Brazil), FLR is Fly River (Papua New Guinea), FRR is Fraser River (Canada), YKR is Yukon River (USA), MISR is Mississippi River (USA), RUR is Russian rivers (Russia), PIR is Ping River (Thailand), USR is Union and Skokomish rivers (USA), ORR is Orinoco River (Venezuela), DMR is Mandovi River (India), SkR is Skidaway River (USA), and IPPR is Ipswich and Parker rivers (USA).
3.3 Drivers of POC, PON and POC ∕ PON variation
3.3.1 Terrestrial organic carbon
Land is a huge organic carbon pool and delivers a large amount of POC into oceans via rivers (IPCC, 2013). Global studies of the riverine export of POC have proposed that POC export from land to the oceans is mostly caused by physical erosion (Galy et al., 2015). The storage and distribution of soil organic carbon (Köchy et al., 2015) in the global terrestrial sphere has a high positive correlation with POC and PON levels in oceans (Fig. 9a and b). The linear functions (R2=0.86) and (R2=0.83) express the relationship between PON, POC and SOC well, except between 40–50 and 80–90∘ N (marked with an ellipse in Fig. 9a and b). PON and POC levels between 40 and 50∘ N are underestimated by the relationship between PON, POC and SOC due to excess organic matter from phytoplankton (satellite estimation result chlorophyll a in ocean color products, https://oceancolor.gsfc.nasa.gov/). Overestimated PON and POC levels for 80–90∘ N are primarily caused by ice on the land and ocean. POC ∕ PON is negatively correlated with the ratio of land area to coastline length (land ∕ coastline): POC ∕ PON = 11.938 ⋅ (land ∕ coastline)−0.078 (R2=0.41) (Fig. 9c).
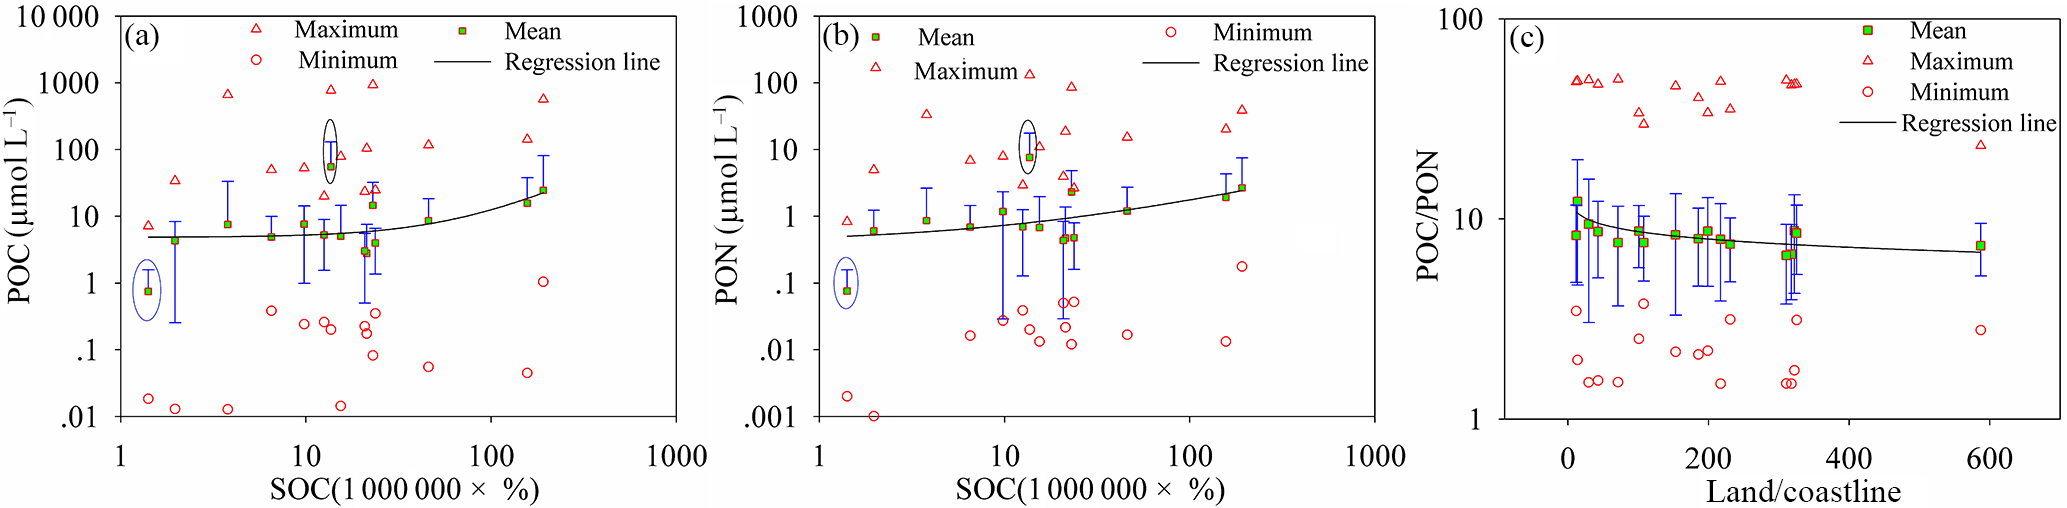
Figure 9(a, b) Relationship between POC, PON and soil organic carbon. (c) The relationship between POC ∕ PON and the ratio of land area to coastal linear length. The red boxes with green shading are the mean values of POC, PON and POC ∕ PON in each latitudinal range, the blue line is the standard deviation, and the red triangles and circles are the maximum and minimum values of POC, PON and POC ∕ PON in each latitudinal range.
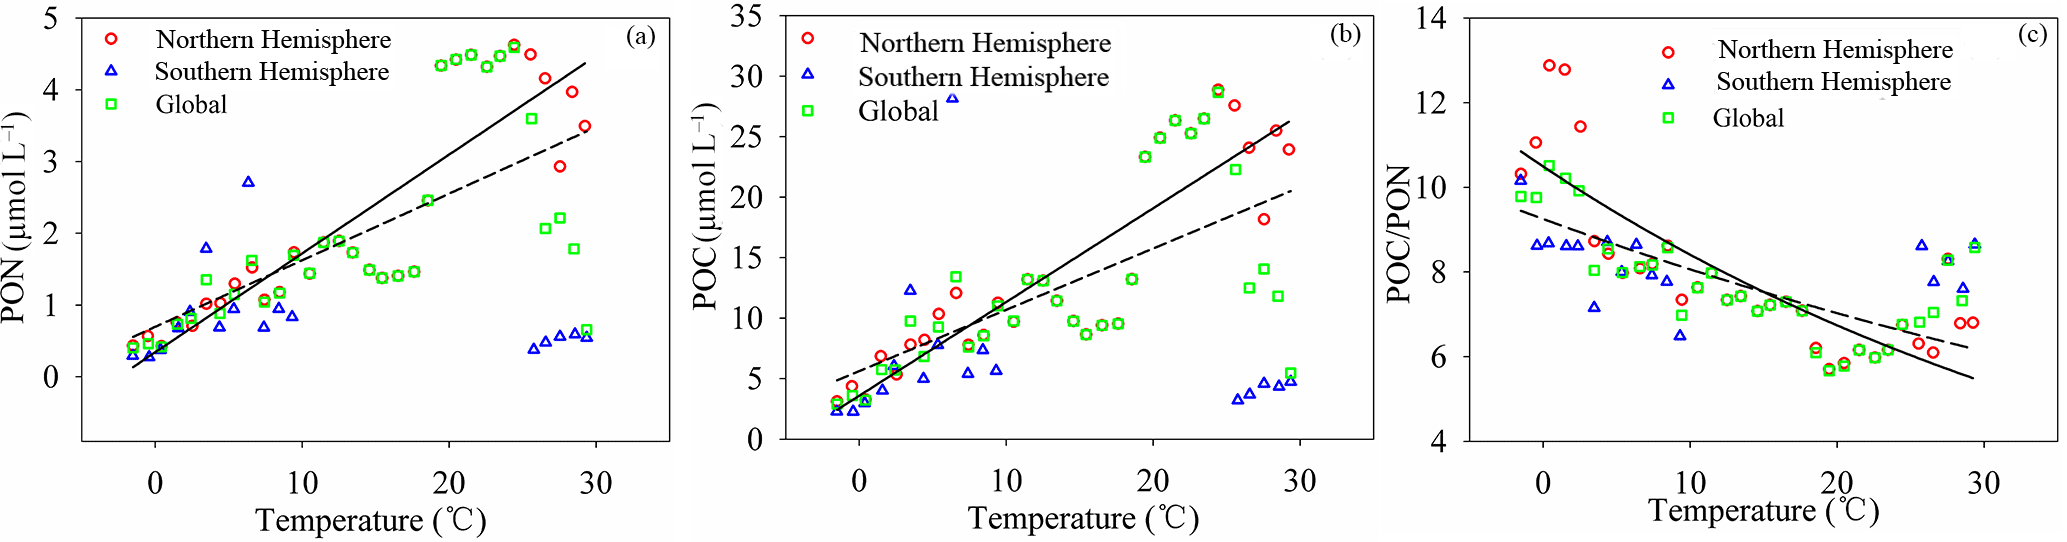
Figure 10Relationships between POC, PON, and POC ∕ PON and temperature (T). POC, PON and POC ∕ PON are highly correlated with temperature in the Northern Hemisphere (solid line), with relationships of (R2=0.74), (R2=0.74) and POC ∕ PON = (R2=0.81), respectively. There is almost no correlation in the Southern Hemisphere, with correlation coefficients of −0.11, −0.08 and −0.31 for PON, POC and POC ∕ PON, respectively. The relationships between POC, PON, and POC ∕ PON and T at a global scale (dashed line) are (R2=0.42), (R2=0.41) and POC ∕ PON = (R2=0.57).
3.3.2 Temperature
The temperature dependence of organic carbon production (e.g., primary production, released from permafrost and soil erosion) and consumption (e.g., mineralization, respiration and methane emission) increases the influence of temperature on aquatic ecosystems and reflects the importance of temperature in the carbon cycle (Gudasz et al., 2010; Padfield et al., 2015; Yvon-Durocher et al., 2011a, b, 2012, 2014, 2015a, b; Zona et al., 2016). POC and PON levels show a high positive correlation with temperature in the Northern Hemisphere with the relationships (R2=0.74) and (R2=0.74). However, the effect of temperature on POC and PON levels in the Southern Hemisphere is not very significant, with correlation coefficients (r) of −0.11 and −0.08, respectively. The influence of temperature on POC and PON levels at a global scale is not homogeneous (Fig. 10a, b). The increased sensitivity of POC and PON to temperature in the Northern Hemisphere may be caused by relatively large amounts of nutrients and a large land area when compared to the Southern Hemisphere. POC ∕ PON showed a high negative correlation with temperature in the Northern Hemisphere, with the relationship POC ∕ PON = (R2=0.81) (not including samples with subzero temperature). Phytoplankton and microzooplankton growing at low temperatures (subzero) may regulate POC ∕ PON, keeping the value low (Crawford et al., 2015; Talmy et al., 2016), and nitrogen ( and ) uptake and light may also play a role (Yun et al., 2012). The impact of temperature on POC ∕ PON in the Southern Hemisphere () is relatively low when compared to the Northern Hemisphere (Fig. 10c). This may indicate that the mineralization of organic carbon occurs at a much higher rate than organic nitrogen with increasing temperature, or that terrestrial organic carbon, which has a high POC ∕ PON ratio, is more efficiently kept than phytoplankton- and microzooplankton-derived organic carbon, which has a low POC ∕ PON ratio, with increasing temperature (Sharma, et al., 2015; Porcal et al., 2015; Crawford et al., 2015; Talmy et al., 2016).
3.3.3 Productivity and migration
Phytoplankton is an agent of the biological pump, which sequesters carbon from the atmosphere to the deep sea (Koeve, 2006). Thus, it influences the global carbon cycle and the climate system (Lam et al., 2011). Studies have proposed general relationships between POC and chlorophyll a concentration (CChl a) to describe the dominant effect of phytoplankton on the POC reservoir (Peña et al., 1991; Legendre and Michaud, 1999; Lefevre et al., 2003; Wang et al., 2011, 2013). However, the relationship between POC and CChl a cannot accurately explain POC variation at the global scale due to high variation in POC ∕ CChl a (Arrigo et al., 2003; Sathyendranath et al., 2009). POC levels show a high positive correlation with CChl a for oceans, lakes, eutrophic lakes, rivers and coastal waters (Fig. 11a). The best-fit function for the relationship between POC and CChl a varies with water type. A linear function is best for lakes (R2=0.64) and coastal waters (R2=0.82), and a power function is best for oceans (R2=0.68) and eutrophic lakes (R2=0.77). Both linear and power functions can be used in rivers (linear, R2=0.77; power, R2=0.77). This is partly consistent with previous studies on ocean water, where POC co-varied with CChl a via a power function (Sathyendranath et al., 2009; Wang et al., 2011). However, the power exponent for the global ocean (0.581) is slightly higher than that of Wang (2011, 0.5402). The highest power exponent (0.645) is for eutrophic lakes, and the lowest (0.434) is for rivers. The slope of the linear fit function in lakes is much higher than in coastal waters. The best-fit power function for POC and CChl a in oceans, eutrophic lakes and rivers demonstrates that phytoplankton carbon sequestration efficiency reduces with increasing chlorophyll a in these water types. Consequently, carbon sequestration efficiency in eutrophic lakes, following a power function, is much higher than in oceans and rivers; in lakes, following a linear function, it is higher than in coastal waters. Thus, the regulation of lake water requires more attention, as it significantly affects the global carbon cycle.

Figure 11(a) Comparison of the relationships between POC and chlorophyll a concentration (CChl a) for oceans, lakes, eutrophic lakes, rivers and coastal waters. (b) Comparison of the relationship between POC and total suspended matter concentration (CTSM) for oceans, lakes and eutrophic lakes. The relationships between POC and CChl a are (R2=0.51, N=5462, yellow solid line); (R2=0.64, N=984, red solid line); (R2=0.72, N=4656, red dashed line); (N = 936, yellow dashed line); and (R2=0.82, N=692, green solid line) for oceans, lakes, eutrophic lakes, rivers, and coastal waters, respectively. The relationships between POC and CTSM are (R2=0.53, N=432, black solid line); (R2=0.67, N=191, green solid line); and (R2=0.27, N=4683, red solid line) for oceans, lakes, and eutrophic lakes, respectively.

Figure 12(a) Comparison of the relationships between DOC and DON for oceans, lakes, rivers, and coastal waters. The relationships between DOC and DON are (R2=0.35, n=995, black solid line); (, blue dashed line); and (R2=0.61, n=255, pink solid line) for all samples, in lakes and rivers, respectively. The correlation coefficients for DOC and DON are r=0.44, 0.78, 0.15 and −0.15 for lakes, rivers, coastal waters and oceans, respectively. (b) DOC ∕ DON for oceans, lakes, rivers and coastal waters. The DOC ∕ DON ratios are 24.10 ± 24.57, 40.43 ± 34.56, 29.35 ± 34.93, 13.15 ± 4.95 and 12.86 ± 4.88 for all samples, lakes, rivers, coastal waters and oceans, respectively. The corresponding POC ∕ PON ratios are 9.65 ± 16.73, 7.71 ± 0.61, 7.07 ± 2.44 and 6.24 ± 1.20 for lakes, rivers, coastal waters and oceans, respectively. (c) Relationships of POC and DOC for different water types. The correlation between POC and DOC is weak for individual water types, but is strong for the combined data of lakes, oceans and coastal waters. The regression function (black line in the figure) between POC and DOC is (R2=0.58, n=570), not including river data.
Total suspended particulate matter transported from the continental biosphere significantly affects POC levels in the water body, in addition to producing phytoplankton (Galy et al., 2015). The relationship between POC and suspended particulate matter concentration (CTSM) (Fig. 11b) is very similar to studies that show that POC has a high, positive correlation with suspended particulate matter (Ni et al., 2008; Cetinić et al., 2012; Woźniak et al., 2016; Yang et al., 2016). The power relationship between POC (mg L−1) and CTSM (mg L−1) at the global scale (, R2=0.81, n=5306) is close to the same relationships in the Baltic Sea (, R2=0.86, Woźniak et al., 2016) and surface water in the US (, R2=0.593, Yang et al., 2016). However, this relationship differs slightly from the one presented by Galy (2015, Figs. 1–3), in which the global flux of terrestrial POC to oceans is composed of biospheric (80 %) and petrogenic (20 %) POC, with the relationship . This indicates that suspended particulate matter includes large amounts of organic carbon in addition to terrestrial organic carbon due to primary productivity and the subsequent zooplankton in the food chain.
3.3.4 Dissolved organic carbon and nitrogen
DOC, which is present in much higher concentrations than POC (Figs. 11a and 12a), quantitatively represents the most important carbon pool (Emerson and Hedges, 2008). DOC is a complex mix of organic compounds from both autochthonous and allochthonous sources that primarily originate from aquatic organisms and runoff, respectively (Doval et al., 2016; Kuliński et al., 2016). DON shows a strong positive correlation with DOC, with a best-fit function of (R2=0.58, n=995) at the global scale. The linear regression model (Fig. 12a) shows that the slope of the linear function is smaller than in previous regional studies (13.3 ± 0.8, Doval et al., 1999; 20.5 ± 3, Aminot and Kérouel, 2004) and is also smaller than DOC sequestered in the deep sea (17.38) via the microbial carbon pump (Jiao et al., 2010). The DOC ∕ DON ratio in lakes (40.43 ± 34.56) and rivers (29.35 ± 34.93) is much higher than in oceans (12.86 ± 4.88) and coastal waters (13.15 ± 4.95) (Fig. 12b). Thus, inland water holds much more DOC, which may result in the high emission of CO2 in inland waters (Raymond et al., 2013; Hotchkiss et al., 2015). The correlation between POC and DOC is weak for individual water types but is strong for combined data of lakes, oceans and coastal waters. The regression function (black line in Fig. 12c) between POC and DOC is (R2=0.58, n=570), not including river data. High DOC∕POC (1.48 ± 0.75 for coastal water, 7.57 ± 6.83 for rivers, 1.18 ± 0.77 for lakes and 4.02 ± 2.13 for ocean) and DOC ∕ DON ratios indicate that organic carbon is mostly stored in dissolved form. DOC and DON regulate the organic carbon and nitrogen equilibrium system with the POC and PON, in addition to the interaction with the inorganic carbon and nitrogen (such as CO2, nutrients, N2 and NOx).
Analysis of global temporal and spatial variation in POC, PON and POC ∕ PON and the analysis of drivers that influence POC, PON and POC ∕ PON distribution have biogeochemical implications. The simple mean value of POC ∕ PON at the global scale (7.54 ± 3.82) is higher than the Redfield ratio (6.63), but the linear regression slope (including intercept, 6.17; excluding intercept, 6.23) for all ocean data is lower than the simple mean value of POC ∕ PON and the Redfield ratio. The linear regression slopes between POC and PON in the Northern Hemisphere (including intercept, 7.06; excluding intercept, 7.00) are much higher than in the Southern Hemisphere (including intercept, 5.97; excluding intercept, 6.03). Variations in POC, PON and POC ∕ PON in inland waters require further attention due to the importance of inland waters in global carbon and nitrogen cycles and the indeterminacy of the relationship between carbon and nitrogen. Land and soil organic carbon distribution and offshore distance appeared to be controlled factors in the variation of POC, PON and POC ∕ PON at a global scale besides the temperature and productivity.
All raw data can be accessed at https://pan.baidu.com/s/1fIYugvBkwQH70JkkDmzccQ (Huang et al., 2018).
The supplement related to this article is available online at: https://doi.org/10.5194/bg-15-1827-2018-supplement.
The authors declare that they have no conflict of interest.
This study was supported by the National Natural Science Foundation of China
(grant nos. 41571324, 41673108 and 41773097), a project funded by the
Priority Academic Program Development of Jiangsu Higher Education
Institutions, the Guangdong Innovative and Entrepreneurial Research Team
Program and the Innovation driven development capacity building project of
the Guangdong Academy of Sciences (2017GDASCX-0801), and the Guangdong
Innovative and Entrepreneurial Research Team Program (no. 2016ZT06D336).
Support of A-Xing Zhu through the Vilas Associate Award, the Hammel Faculty
Fellow Award, the Manasse Chair Professorship from the University of
Wisconsin-Madison, and the “One-Thousand Talents” Program of China is
greatly appreciated. We are grateful to Nick Kleeman for the language editing
and to the reviewers for their useful comments.
Edited by: Gerhard Herndl
Reviewed by: four
anonymous referees
Aminot, A. and Kérouel, R.: Dissolved organic carbon, nitrogen and phosphorus in the N-E Atlantic and the N-W Mediterranean with particular reference to non-refractory fractions and degradation, Deep-Sea Res. Pt. I, 51, 1975–1999, 2004.
Arrigo, K. R., Robinson, D. H., Dunbar, R. B., and Leventer, A. R.: Physical control of chlorophyll a, POC, and TPN distributions in the pack ice of the Ross Sea, Antarctica, J. Geophys. Res., 108, 3316, https://doi.org/10.1029/2001JC001138, 2003.
Babbin, A. R., Keil, R. G., Devol, A. H., and Ward, B. B.: Organic Matter Stoichiometry, Flux, and Oxygen Control Nitrogen Loss in the Ocean, Science, 344, 406–408, 2014.
Bianchi, T. S.: The role of terrestrially derived organic carbon in the coastal ocean: A changing paradigm and the priming effect, P. Natl. Acad. Sci. USA, 108, 19473–19481, 2011.
Cai, P. H., Zhao, D., Wang, L., Huang, B., and Dai, M.: Role of particle stock and phytoplankto n comm unity structure in regulating particulate organic carbon export in a large marginal sea, J. Geophys. Res.-Oceans, 120, 2063–209, https://doi.org/10.1002/2014JC010432, 2015.
Cai, W. J.: Estuarine and coastal ocean carbon paradox: CO2 sinks or sites of terrestrial carbon incineration? Ann. Rev. Mar. Sci., 3, 123–145, 2011.
Cai, Y. H., Guo, L. D., and Douglas, T. A.: Temporal variations in organic carbon species and fluxes from the Chena River, Alaska, Limnol. Oceanogr., 53, 1408–1419, 2008.
Cai, Y. H., Guo, L. D., Wang, X., and Aiken, G.: Abundance, stable isotopic composition, and export fluxes of DOC, POC, and DIC from the Lower Mississippi River during 2006–2008, J. Geophys. Res.-Biogeo., 120, 2273–2288, https://doi.org/10.1002/2015JG003139, 2015.
Caperon, J., Harvey, W. A., and Steinhilper, F. A.: Particulate Organic Carbon, Nitrogen, and Chlorophyll as Measures of Phytoplankton and Detritus Standing Crops in Kaneohe Bay, Oahu, Hawaiian Islands, Pac. Sci., 30, 317–327, 1976.
Cardoso, S. J., Enrich-Prast, A., Pace, M. L., and Roland, F.: Do models of organic carbon mineralization extrapolate to warmer tropical sediments?, Limnol. Oceanogr., 59, 48–54, 2014.
Cetinić, I., Perry, M. J., Briggs, N. T., Kallin, E., D'Asaro, E. A., and Lee, C. M.: Particulate organic carbon and inherent optical properties during 2008 North Atlantic Bloom Experiment, J. Geophys. Res., 117, C06028, https://doi.org/10.1029/2011JC007771, 2012.
Chen, M., Zeng, G. M., Zhang, J. C., Xu, P., Chen, A. W., and Lu, L. H.: Global Landscape of Total Organic Carbon, Nitrogen and Phosphorus in Lake Water, Sci. Rep.-UK, 5, 15043, https://doi.org/10.1038/srep15043, 2015.
Cole, J. J., Prairie, Y. T., Caraco, N. F., McDowell, W. H., Tranvik, L. J., Striegl, R. G., Duarte, C. M., Kortelainen, P., Downing, J. A., Middelburg, J. J., and Melack, J. M.: Plumbing the global carbon cycle: Integrating inland waters into the terrestrial carbon budget, Ecosystems, 10, 171–184, 2007.
Crawford, D. W., Wyatt, S. N., Wrohan, I. A., Cefarelli, A. O., Giesbrecht, K. E., Kelly, B., and Varela, D. E.: Low particulate carbon to nitrogen ratios in marine surface waters of the Arctic, Global Biogeochem. Cy., 29, 2021–2033, https://doi.org/10.1002/2015GB005200, 2015.
Devries, T. and Deutsch, C.: Large-scale variations in the stoichiometry of marine organic matter respiration, Nat. Geosci., 7, 890–894, 2014.
Doval, M. D., Pérez, F. F., and Berdalet, B.: Dissolved and particulate organic carbon and nitrogen in the northwestern Mediterranean, Deep-Sea Res. Pt. I, 46, 511–527, 1999.
Doval, M. D., López, A., and Madriñán, M.: A decade of weekly dissolved organic carbon values in the coastal upwelling of the NW Spain (Atlantic Galician Rías), Mar. Chem., 179, 34–43, 2016.
Emerson, S. R. and Hedges, J. I.: Chemical Oceanography and the Marine Carbon Cycle, Cambridge University Press, Cambridge, p. 453, 2008.
Flückiger, J., Blunier, T., Stauffer, B., Chappellaz, J., Spahni, R., Kawamura, K., Schwander, J., Stocker, T. F., and Dahl-Jensen, D.: N2O and CH4 variations during the last glacial epoch: insight into global processes, Global Biogeochem. Cy., 18, 1–14, 2004.
Galloway, J. N., Dentener, F. J., Capone, D. G., Boyer, E. W., Howarth, R. W., Seitzinger, S. P., Asner, G. P., Cleveland, C. C., Green, P. A., Holland, E. A., Karl, D. M., Michaels, A. F., Porter, J. H., Townsend, A. R., and Vöosmarty, C. J.: Nitrogen cycles: past, present, future, Biogeochemistry, 70, 153–226, 2004.
Galloway, J. N., Townsend, A. R., Erisman, J. W., Bekunda, M., Cai, Z., Freney, J. R., Martinelli, L. A., Seitzinger, S. P., and Sutton, M. A.: Transformation of the nitrogen cycle: recent trends, questions, and potential solutions, Science, 16, 889–892, https://doi.org/10.1126/science.1136674, 2008.
Galy, V., Peucker-Ehrenbrink, B., and Eglinton, T.: Global carbon export from the terrestrial biosphere controlled by erosion, Nature, 521, 204–207, 2015.
Gälman, V., Rydberg, J., de-Luna, S. S., Bindler, R., and Renberg, I.: Carbon and nitrogen loss rates during aging of lake sediment: Changes over 27 years studied in varved lake sediment, Limnol. Oceanogr., 53, 1076–1082, 2008.
Gruber, N. and Galloway, J. N.: An Earth-system perspective of the global nitrogen cycle, Nature, 451, 293–296, 2008.
Gudasz, C., Bastviken, D., Steger, K., Premke, K., Sobek, S., and Tranvik, L. J.: Temperature-controlled organic carbon mineralization in lake sediments, Nature, 466, 478–481, https://doi.org/10.1038/nature09186, 2010.
Guo, L. D., Lehner, J. K., White, D. M., and Garland, D. S.: Heterogeneity of natural organic matter from the Chena River, Alaska, Water Res., 37, 1015–1022, 2003.
Hall, S. R., Leibold, M. A., Lytle, D. A., and Smith, V. H.: Grazers, producer stoichiometry, and the light: nutrient hypothesis revisted, Ecology, 88, 1142–1152, 2007.
Hilton, R. G., Galy, V., Gaillardet, J., Dellinger, M., Bryant, C., O'Regan, M., Grocke, D. R., Coxall, H., Bouchez, J., and Calmels, D.: Erosion of organic carbon in the Arctic as a geological carbon dioxide sink, Nature, 524, 84–87, 2015.
Hotchkiss, E. R., Hall Jr., R. O., Sponseller, R. A., Butman, D., Klaminder, J., Laudon, H., Rosvall, M., and Karlsson, J.: Sources of and processes controlling CO2 emissions change with the size of streams and rivers, Naturegeoscience, 8, 696–699, 2015.
Huang, C. C., Shi, K., Yang, H., Li, Y. M., Zhu, A. X., Sun, D. Y., Xu, L. J., Zou, J., and Chen, X.: Satellite observation of hourly dynamic characteristics of algae with Geostationary Ocean Color Imager (GOCI) data in Lake Taihu, Remote Sens. Environ., 159, 278–287, 2015.
Huang, C. C., Jiang, Q. L., Yao, L., Yang, H., Lin, C., Huang, T., Zhu, A. X., and Zhang, Y. M.: Variation pattern of particulate organic carbon and nitrogen in oceans and inland waters-DATA, available at: https://pan.baidu.com/s/1fIYugvBkwQH70JkkDmzccQ (last access: December 2017), 2018.
Hyvönen, R. Persson, T., Andersson, S., Olsson, B., Ågren, G. I., and Linder, S.: Impact of long-term nitrogen addition on carbon stocks in trees and soils in northern Europe, Biogeochemistry, 89, 121–137, https://doi.org/10.1007/s10533-007-9121-3, 2007.
IPCC: Climate change 2013 the physical science basis, available at: http://climatechange2013.org/ (last access: January 2016), 2003.
Jiang, L.-Q., Cai, W.-J., Wang, Y., and Bauer, J. E.: Influence of terrestrial inputs on continental shelf carbon dioxide, Biogeosciences, 10, 839–849, https://doi.org/10.5194/bg-10-839-2013, 2013.
Jiao, N. Z., Herndl, G. J., Hansell, D. A., Benner, R., Kattner, G., Wilhelm, S. W., Kirchman, D. L., Weinbauer, M. G., Luo T., Chen, F., and Azam, F.: Microbial production of recalcitrant dissolved organic matter: long-term carbon storage in the global ocean, Nat. Rev. Microbiol., 8, 593–599, 2010.
Kaiser, D., Unger, D., and Qiu, G. L.: Particulate organic matter dynamics in coastal systems of the northern Beibu Gulf, Cont. Shelf Res., 82, 99–118, 2014.
Kendall, C., Silva, S. R., and Kelly, V. J.: Carbon and nitrogen isotopic compositions of particulate or-ganic matter in four large river systems across the United States, Hydrol. Process., 15, 1301–1346, 2001.
Kim, B. K., Lee, J. H., Yun, M. S., Joo, H. T., Song, H. J., Yang, E. J., Chung, K. H., Kang, S. H., and Lee, S. H.: High lipid composition of particulate organic matter in the northern Chukchi Sea, Deep-Sea Res. Pt II, 120, 72–81, 2015.
Köchy, M., Hiederer, R., and Freibauer, A.: Global distribution of soil organic carbon –Part 1: Masses and frequency distributions of SOC stocks for the tropics, permafrost regions, wetlands, and the world, Soil, 1, 351–365, https://doi.org/10.5194/soil-1-351-2015, 2015.
Koeve, W.: C : N stoichiometry of the biological pump in the North Atlantic: constraints from climatological data, Global Biogeochem. Cy., 20, gb3018, https://doi.org/10.1029/2004GB002407, 2006.
Körtzinger, A., Koeve, W., Kähler, P., and Mintrop, L.: C : N ratios in the mixed layer during the productive season in the northeast Atlantic Ocean, Deep-Sea Res. Pt. I, 48, 661–688, 2001.
Kuliński, K., Hammer, K., Schneider, B., and Schulz-Bull, D.: Remineralization of terrestrial dissolved organic carbon in the Baltic Sea, Mar. Chem., 181, 10–17, 2016.
Lam, P. J., Doney, S. C., and Bishop, J. K. B.: The dynamic ocean biological pump: Insights from a global compilation of partic-ulate organic carbon, CaCO3, and opal concentration profiles from the mesopelagic, Global Biogeochem. Cy., 25, GB3009, https://doi.org/10.1029/2010GB003868, 2011.
Lara, R. J., Alder, V., Franzosi, C. A., and Kattner, G.: Characteristics of suspended particulate organic matter in the southwestern Atlantic: Influence of temperature, nutrient and phytoplankton features on the stable isotope signature, J. Marine Syst., 79, 199–209, 2010.
Le Quéré, C., Moriarty, R., Andrew, R. M., Peters, G. P., Ciais, P., Friedlingstein, P., Jones, S. D., Sitch, S., Tans, P., Arneth, A., Boden, T. A., Bopp, L., Bozec, Y., Canadell, J. G., Chini, L. P., Chevallier, F., Cosca, C. E., Harris, I., Hoppema, M., Houghton, R. A., House, J. I., Jain, A. K., Johannessen, T., Kato, E., Keeling, R. F., Kitidis, V., Klein Goldewijk, K., Koven, C., Landa, C. S., Landschützer, P., Lenton, A., Lima, I. D., Marland, G., Mathis, J. T., Metzl, N., Nojiri, Y., Olsen, A., Ono, T., Peng, S., Peters, W., Pfeil, B., Poulter, B., Raupach, M. R., Regnier, P., Rödenbeck, C., Saito, S., Salisbury, J. E., Schuster, U., Schwinger, J., Séférian, R., Segschneider, J., Steinhoff, T., Stocker, B. D., Sutton, A. J., Takahashi, T., Tilbrook, B., van der Werf, G. R., Viovy, N., Wang, Y.-P., Wanninkhof, R., Wiltshire, A., and Zeng, N.: Global carbon budget 2014, Earth Syst. Sci. Data, 7, 47–85, https://doi.org/10.5194/essd-7-47-2015, 2015.
Lefevre, N., Taylor, A. H., Gilbert, F. J., and Geider, R. J.: Modeling carbon to nitrogen and carbon to chlorophyll a ratios in the ocean at low latitudes: evaluation of the role of physiological plasticity, Limnol. Oceanogr., 48, 1796–1807, 2003.
Legendre, L. and Michaud, J.: Chlorophyll a to estimate the particulate organic carbon available as food to large zooplankton in the euphotic zone of oceans, J. Plankton Res., 21, 2067–2083, 1999.
Martiny, A. C., Pham, C. T. A., Primeau, F. W., Vrugt, J. A., Moore, J. K., Levin, S. A., and Lomas, M. W.: Strong latitudinal patterns in the elemental ratios of marine plankton and organic matter, Nat. Geosci., 6, 279–283, 2013a.
Martiny, A. C., Vrugt, J. A., Primeau, F. W., and Lomas, M. W.: Regional variation in the particulate organic carbon to nitrogen ratio in the surface ocean, Global Biogeochem. Cy., 27, 723–731, 2013b.
Martiny, A. C., Vrugt, J. A., and Lomas, M. W.: Concentrations and ratios of particulate organic carbon, nitrogen, and phosphorus in the global ocean, Scientific Data, 1, 140048, https://doi.org/10.1038/sdata.2014.48, 2014.
Mcgroddy, M. E., Daufresne, T., and Hedin, L. O.: Scaling of C : N : P stoichiometry in forest ecosystems worldwide: Implications of terrestrial Redfield-type ratios, Ecology, 85, 2390–2401, 2004.
Meisel, S. and Struck, U.: The potential distortion of sedimentary δ15N and Corg ∕ N ratios by NH4+ and the effects of pre-analysis sample treatment, Foss. Rec., 14, 141–152, https://doi.org/10.1002/mmng.201100004, 2011.
Meybeck, M.: Carbon, nitrogen, and phosphorus transport by world rivers, Am. J. Sci., 282, 401–450, 1982.
Moreira-Turcq, P., Bonnet, M. P., Amorim, M., Bernardes, M., Lagane, C., Maurice, L., Perez, M., and Seyler, P.: Seasonal variability in concentration, composition, age, and fluxes of particulate organic carbon exchanged between the floodplain and Amazon River, Global Biogeochem. Cy., 27, 119–130, 2013.
Ni, H. G., Lu, F. H., Luo, X. L., Tian, H. Y., and Zeng, E. Y.: Riverine inputs of total organic carbon and suspended particulate matter from the Pearl River Delta to the coastal ocean off South China, Mar. Pollut. Bull., 56, 1150–1157, 2008.
Onstad, G. D., Canfield, D. E., Quay, P. D., and Hedges, J. I.: Sources of particulate organic matter in rivers from the continental USA: Lignin phenol and stable carbon isotope compositions, Geochim. Cosmochim. Ac., 64, 3539–3546, 2000.
Padfield, D., Yvon-Durocher, G., Buckling, A., Jennings, S., and Yvon-Durocher, G.: Rapid evolution of metabolic traits explains thermal adaptation in phytoplankton, Ecol. Lett., 19, 133–142, 2015.
Peña , M. A., Lewis, M. R., and Harrison, W. G.: Particulate organic matter and chlorophyll in the surface layer of the equatorial Pacific Ocean along 135∘ W., Mar. Ecol.-Prog. Ser., 72, 179–188, 1991.
Perga, M. E., Maberly, S. C., Jenny, J. P., Alric, B., Pignol, C., and Naffrechoux, E.: A century of human-driven changes in the carbon dioxide concentration of lakes, Global Biogeochem. Cy., 30, 93–104, 2016.
Porcal, P., Dillon, P. J., and Molot, L. A.: Temperature Dependence of Photodegradation of Dissolved Organic Matter to Dissolved Inorganic Carbon and Particulate Organic Carbon, Plos One, 10, e0128884, https://doi.org/10.1371/journal.pone.0128884, 2015.
Puigcorbé, V., Benitez-Nelson, C. R., Masqué, P., Verdeny, E., White, A. E., Popp, B. N., Prahl, F. G., and Lam, P. J.: Small phytopl ankton drive high summertime carb on and nutrient export in the Gulf of California and Eastern Tropical North Pacific, Global Biogeochem. Cy., 29, 1309–1332, https://doi.org/10.1002/2015GB005134, 2015.
Raymond, P. A., Hartmann, J., Lauerwald, R., Sobek, S., McDonald, C., Hoover, M., Butman, D., Striegl, R., Mayorga, E., Humborg, C., Kortelainen, P., Durr, H., Meybeck, M., Ciais, P., and Guth, P.: Global carbon dioxide emissions from inland waters, Nature, 21, 355–359, 2013.
Richardson, T. L. and Jackson, G. A.: Small phytoplankton and carbon export from the surface ocean, Science, 315, 838–840, 2007.
Sawakuchi, H. O., Neu, V., Ward, N. D., Barros, M. L. C., Valerio, A. M., Gagne-Maynard, W., Cunha, A. C., Less, D. F., Diniz, J. E., Brito, D. C., Krusche, A. V., and Richey, J. E.: Carbon dioxide emissions along the lower Amazon River, Frontiers in Marine Science, 4, 76, https://doi.org/10.3389/fmars.2017.00076, 2017.
Sathyendranath, S., Stuart, V., Nair, A., Oka, K., Nakne, T., Bouman, H., Forget, M. H., Maass, H., and Platt, T.: Carbon-to-chlorophyll ratio and growth rate of phytoplankton in the sea, Mar. Ecol.-Prog. Ser., 383, 73–84, 2009.
Schneider, B., Schlitzer, R., Fischer, G., and Nothig, E. M.: Depth-dependent elemental compositions of particulate organic matter (POM) in the ocean, Global Biogeochem. Cy., 17, 1032, https://doi.org/10.1029/2002GB001871, 2003.
Schneider, B., Engel, A., and Schlitzer, R.: Effects of depth- and CO2-dependent C : N ratios of particulate organic matter (POM) on the marine carbon cycle, Global Biogeochem. Cy., 18, GB2015, https://doi.org/10.1029/2003GB002184, 2004.
Schneider, B., Karstensen, J., Engel, A., and Schlitzer, R.: Model-based evaluation of methods to determine C : N and N : P regeneration ratio from dissolved nutrients, Global Biogeochem. Cy., 19, GB2009, https://doi.org/10.1029/2004GB002256, 2005.
Sharma, S., Gray, D. K., Read, J. S., O'Reilly, C. M., Schneider, P., Qudrat, A., Gries, C., Stefanoff, S., Hampton, S. E., Hook, S., Lenters, J. D., Livingstone, D. M., McIntyre, P. B., Adrian, R., Allan, M. G., Anneville, O., Arvola, L., Austin, J., Bailey, J., Baron, J. S., Brookes, J., Chen, Y., Daly, R., Dokulil, M., and Dong, B.: A global database of lake surface temperatures collected by in situ and satellite methods from 1985–2009, Sci. Data, 2, 150008, https://doi.org/10.1038/sdata.2015.8, 2015.
Sobek, S., Anderson, N. J., Bernasconi, S. M., and Del Sontro, T.: Low organic carbon burial efficiency in arctic lake sediments, J. Geophys. Res.-Biogeo., 119, 1231–1243, https://doi.org/10.1002/2014JG002612, 2014.
Sterner, R. W. and Elser, J. J.: Ecological Stoichiometry: the Biology of Elements from Molecules to the Biosphere, Princeton Univ. Press, Princeton, NJ, USA, 2002.
Sterner, R. W., Andersen, T., Elser, J. J., Hessen, D. O., Hood, J. M., McCauley, E., McCauley, E., and Urabe, J.: Scale-dependent carbon: nitrogen: phosphorus seston stoichiometry in marine and freshwaters, Limnol. Oceanogr., 53, 1169–1180, 2008.
Stief, P.: Enhanced exoenzyme activities in the presence of deposit-feeding Chironomus riparius larvae, Freshw. Biol., 52, 1807–1819, 2007.
Talmy, D., Martiny, A. C., Hill, C., Hickman, A. E., and Follows, M. J.: Microzooplankton regulation of surface ocean POC : PON ratios, Global Biogeochem. Cy., 30, 1–22, https://doi.org/10.1002/2015GB005273, 2016.
Tamelander, T., Reigstad, M., Olli, K., Slagstad, D., and Wassmann, P.: New Production Regulates Export Stoichiometry in the Ocean, Plos One, 8, e54027, https://doi.org/10.1371/jo urnal.pone.0054027, 2013.
Thornton, S. F. and McManus, J.: Application of organic carbon and nitrogen stable isotope and C ∕ N ratios as source indicators of organic matter provenance in estuarine systems: evidence from the Tay Estuary, Scotl. and Estuarine Coastal Shelf Sci., 38, 219–233, 1994.
Tranvik, L. J., Downing, J. A., Cotner, J. B., Loiselle, S. A., Sriegl, R. G., Ballatore, T. J., Dillon, P., Finlay, K., Fortino, K., Knoll, L. B, Kortelainen, P., Kutser, T., Larsen, S., Laurion, I., Leech, D. M., McCallister, S. L., McKnight, D. M., Melack, J. M., Overholt, E., Porter, J. A., Prairie, Y., Renwick, W. H., Roland, F., Sherman, B. S., Schindler, D. W., Sobek, S., Tremblay, A., Vanni, M. J., Verschoor, A. M., Wachenfeldt, E., and Weyhenmeyer, G. A.: Lakes and reservoirs as regulators of carbon cycling and climate, Limnol. Oceanogr., 54, 2298–2314, 2009.
Trefry, J. H., Nelsen, T. A., Trocine, R. P., and Eadie, B. J.: Transport of Particulate Organic Carbon by the Mississippi River and Its Fate in the Gulf of Mexico, Estuaries, 17, 839–849, 1994.
Verity, P.: A Decade of Change in the Skidaway River Estuary II, Particulate Organic Carbon, Nitrogen, and Chlorophyll a, Estuaries, 25, 961–975, 2002.
Voss, B. M.: Spatial and temporal dynamics of biogeochemical processes in the Fraser River, Canada: A coupled organic-inorganic perspective, PhD, Massachusetts Institute of Technology, 201–276, 2009.
Wang, G. F., Zhou, W., Cao, W. X., Yin, J. P., Yang, Y. Z., Sun, Z. H., Zhang, Y. Z., and Zhao, J.: Variation of particulate organic carbon and its relationship with bio-optical properties during a phytoplankton bloom in the Pearl River estuary, Mar. Pollut. Bull., 62, 1939–1947, 2011.
Wang, X. J., Murtugudde, R., Hackert, E., and Marañón, E.: Phytoplankton carbon and chlorophyll distributions in the equatorial Pacific and Atlantic: A basin-scale comparative study, J. Marine Syst., 109–110, 138–148, 2013.
Ward, N. D., Keil, R. G., and Richey, J. E.: Temporal variation in river nutrient and dissolved lignin phenol concentrations and the impact of storm events on nutrient loading to Hood Canal, Washington, USA, Biogeochemistry, 111, 629–645, 2012.
Ward, N. D., Bianchi, T. S., Medeiros, P. M., Seidel, M., Richey, J. E., Keil, R. G., and Sawakuchi, H. O.: Where carbon goes when water flows: Carbon cycling across the aquatic continuum, Frontiers in Marine Science, 4, 7, https://doi.org/10.3389/fmars.2017.00007, 2017.
Watanabe, K. and Kuwae, T.: How organic carbon derived from multiple sources contributes to carbon sequestration processes in a shallow coastal system?, Glob. Change Biol., 21, 2612–2623, 2015.
Wilkinson, G. M., Pace, M. L., and Cole, J. J.: Terrestrial dominance of organic matter in north temperate lakes, Global Biogeochem. Cy., 27, 43–51, https://doi.org/10.1029/2012GB004453, 2013.
Woźniak, S. B., Dareckia, M., Zabłocka, M., Burska, D., and Dera, J.: New simple statistical formulas for estimating surface concentrations of suspended particulate matter (SPM) and particulate organic carbon (POC) from remote-sensing reflectance in the southern Baltic Sea, Oceanologia, 58, 161–175, 2016.
Xiao, W., Liu, S. D., Li, H. C., Xiao, Q., Wang, W., Hu, Z. H., Hu, C., Gao, Y. Q., Shen, J., Zhao, X. Y., Zhang, M., and Lee, X. H.: A Flux-Gradient System for Simultaneous Measurement of the CH4, CO2, and H2O Fluxes at a Lake-Air Interface, Environ. Sci. Technol., 48, 14490–14498, 2014.
Yang, Q. C., Zhang, X. S., Xu, X. Y., Asrara, G. R., Smithd, R. A., Shihe, J. S., and Duan, S. W.: Spatial patterns and environmental controls of particulate organic carbon in surface waters in the conterminous United States, Sci. Total Environ., 554–555, 266–275, 2016.
Yun, M. S., Chung, K. H., Zimmermann, S., Zhao, J., Joo, H. M., and Lee, S. H.: Phytoplankton productivity and its resp onse to higher light levels in the Canada Basin, Polar Biol., 35, 257–268, https://doi.org/10.1007/s00300-011-1070-6, 2012.
Yvon-Durocher, G., Montoya, J., Trimmer, M., and Woodward, G.: Warming alters the size spectrum and shifts the distribution of biomass in freshwater ecosystems, Glob. Change Biol., 17, 1681–1694, https://doi.org/10.1111/j.1365-2486.2010.02321.x, 2011a.
Yvon-Durocher, G., Montoya, J., Woodward, G., Jones, J., and Trimmer, M.: Warming increases the proportion of primary production emitted as methane from freshwater mesocosms, Glob. Change Biol., 17, 1225–1234, https://doi.org/10.1111/j.1365-2486.2010.02289.x, 2011b.
Yvon-Durocher, G., Caffrey, J. M., Cescatti, A., Dossena, M., del Giorgio, P. A., Gasol, J. M., Montoya, J. M., Pumpanen, J., Staehr, P. A., Trimmer, M., Woodward, G., and Allen, A. P.: Reconciling the temperature dependence of respiration across timescales and ecosystem types, Nature, 487, 472–476, 2012.
Yvon-Durocher, G., Allen, A. P., Bastviken, D., Conrad, R., Gudasz, C., St-Pierre, A., Thanh-Duc, N., and del Giorgio, P. A.: Methane fluxes show consistent temperature dependence across microbial to ecosystem scales, Nature, 507, 488–491, 2014.
Yvon-Durocher, G., Allen, A. P., Cellamare, M., Dossena, M., Gaston, K. J., Leitao, M., Montoya, J. M., Reuman, D. C., Woodward, G., and Trimmer, M.: Five Years of Experimental Warming Increases the Biodiversity and Productivity of Phytoplankton, Plos Biol., 13, e1002324, https://doi.org/10.1371/journal.pbio.1002324, 2015a.
Yvon-Durocher, G., Dossena, M., Trimmer, M., Woodward, G., and Allen, A. P.: Temperature and the biogeography of algal stoichiometry, Global Ecol. Biogeogr., 24, 562–570, 2015b.
Zona, D., Gioli, B., Commane, R., Lindaas, J., Wofsy, S. C., Miller, C. E., Dinardo, S. J., Dengel, S., Sweeney, C., Karion, A., Chang, R. Y. W., Henderson, J. M., Murphy, P. C., Goodrich, J. P., Moreaux, V., Liljedahl, A., Watts, J. D., Kimball, J. S., Lipson, D. A., and Oechel, W. C.: Cold season emissions dominate the Arctic tundra methane budget, P. Natl. Acad. Sci. USA, 113, 40–45, 2016.